Can Thinking Green and Sustainability Be an Economic ... · 5 Fresh water is essential to...
81
ERIA-DP-2015-66 ERIA Discussion Paper Series Can Thinking Green and Sustainability Be an Economic Opportunity for ASEAN? Venkatachalam ANBUMOZHI Ponciano S. INTAL, Jr. Economic Research Institute for ASEAN and East Asia (ERIA) September 2015 Abstract ASEAN member states (AMS) are confronted by serious environmental problems that threaten to undermine future growth and regional stability. This paper considers four major environmental challenges that policymakers across ASEAN will need to address towards 2030: water management, deforestation and land degradation, air pollution, and climate change. We argue that these challenges, each unique in its own way, exhibit the characteristics of wicked problems. As developed in the planning literature, and now applied much more broadly, wicked problems are dynamic and complex, encompass many issues and stakeholders, and evade straightforward, lasting solutions. Detailed case studies are presented to illustrate the complexity and significance of these environmental challenges, as well as their nature as wicked problems. The most important implication of this finding is that there will be no easy or universal solutions to environmental problems across ASEAN, as Environmental Performance Indicators (EPI) illustrate. This is a caution against over-optimism for formulating sector-specific solutions. It is not, however, a counsel for despair. We suggest general principles which may be useful across the board to tackle the issues and accelerate green growth. These are: a focus on co- benefits; an emphasis on stakeholder participation; a commitment to scientific and technological research; an emphasis on long-term planning; pricing reform; tackling governance issues, in addition to generally bolstering institutional capacity with regard to environmental regulation; and a strengthening of regionally coordinated approaches and international support. Keywords: green growth, environmental performance indicators, regional cooperation, sustainability JEL Classification: Q32, Q34, Q37
Transcript of Can Thinking Green and Sustainability Be an Economic ... · 5 Fresh water is essential to...
ERIA-DP-2015-66
ERIA Discussion Paper Series
Can Thinking Green and Sustainability Be an
Economic Opportunity for ASEAN?
Venkatachalam ANBUMOZHI
Ponciano S. INTAL, Jr.
Economic Research Institute for ASEAN and East Asia (ERIA)
September 2015
Abstract ASEAN member states (AMS) are confronted by serious environmental
problems that threaten to undermine future growth and regional stability. This
paper considers four major environmental challenges that policymakers across
ASEAN will need to address towards 2030: water management, deforestation and
land degradation, air pollution, and climate change. We argue that these challenges,
each unique in its own way, exhibit the characteristics of wicked problems. As
developed in the planning literature, and now applied much more broadly, wicked
problems are dynamic and complex, encompass many issues and stakeholders, and
evade straightforward, lasting solutions. Detailed case studies are presented to
illustrate the complexity and significance of these environmental challenges, as well
as their nature as wicked problems. The most important implication of this finding
is that there will be no easy or universal solutions to environmental problems across
ASEAN, as Environmental Performance Indicators (EPI) illustrate. This is a caution
against over-optimism for formulating sector-specific solutions. It is not, however,
a counsel for despair. We suggest general principles which may be useful across the
board to tackle the issues and accelerate green growth. These are: a focus on co-
benefits; an emphasis on stakeholder participation; a commitment to scientific and
technological research; an emphasis on long-term planning; pricing reform;
tackling governance issues, in addition to generally bolstering institutional capacity
with regard to environmental regulation; and a strengthening of regionally
coordinated approaches and international support.
Keywords: green growth, environmental performance indicators, regional
cooperation, sustainability
JEL Classification: Q32, Q34, Q37
1
1. Introduction
Towards the end of the 20th century, governments began to seriously acknowledge
the central importance of environmental sustainability to the process of economic
development (Arrow et al., 1995; Dasgupta, 1996). It is now widely accepted that
long-term economic growth requires not just accumulation of technology, physical
capital, and labour, but also the preservation of the natural capital base (Brock and
Taylor, 2005; OECD, 2011).
Whereas other factors of production may be replaceable and are often substitutable,
ecosystem services provided by waterways, forests, and fertile lands are essential but
largely finite resources. Once damaged, they may become unusable for long periods,
and their repair often an expensive and protracted process. As these natural systems
are the primary source of economic inputs such as food and clean water, their
degradation through pollution and over-use is an enduring brake on economic
development. For this reason, academics and policymakers have become increasingly
concerned with national accounting procedures that include measures of
environmental capital (Stiglitz et al., 2009).
In 1987 the United Nations report on sustainable development foresaw the need
for ‘a new era of economic growth, one that must be based on policies that sustain and
expand the environmental resource base’ (WCED, 1987).
The ASEAN economies are incredibly successful when judged by their rapid
growth, but less so when environmental damage is accounted for.1 They are now
confronted by the prospect of a dwindling supply of environmental capital to support
the growing demands of a more numerous, wealthier, and increasingly urbanised
population. Clean and ample water, arable land, and unpolluted air are just some of the
vital ecosystem services necessary to maintain ASEAN’s emergence as the engine of
the global economy. Yet recent economic expansion has largely been pursued at the
expense of the environment, undermining delivery of these ecosystem services in the
1 China’s one-off attempt to calculate ‘Green GDP’ found that environmental pollution cost 3.05
percent of GDP in 2004, or around one-third of GDP growth in that year (GoC, 2006). Although
such estimates are unavoidably speculative, it is indicative of the true magnitude of damages that
this particular figure encompassed only direct economic losses (such as agricultural production and
health) and not natural resource degradation or long-term ecological damage.
2
future. This unsustainable trajectory will, if allowed to continue, progressively hinder
future development.
Environmental damage not only undermines the sustainability of growth, putting
future welfare at risk, it also exacts a large welfare cost here and now. Low-income
groups, particularly in rural areas, disproportionately subsist on environmental
services. Poverty limits the ability of poor households to find alternatives to a
contaminated water source or harmful cooking fuels. Where the capacity to earn
income or receive education is affected, such as health problems related to pollution
and food insecurity, environmental problems reinforce poverty. Consequently,
environmental degradation is a fundamental development issue in ASEAN today and
beyond 2015.
The economic imperative for environmental protection is now a principal policy
issue as ASEAN member states (AMS) formally and progressively recognise the
necessity of environmentally sustainable growth in various declarations and
implementation plans such as the ASEAN Socio-cultural Community Blueprint
(ASEAN, 2009), the State of the Environment Report (ASEAN, 2007, 2009), the mid-
term Review of Socio-cultural Community Blueprint (ASEAN 2014), the ASCC Score
Card (ASEAN, 2013), etc.
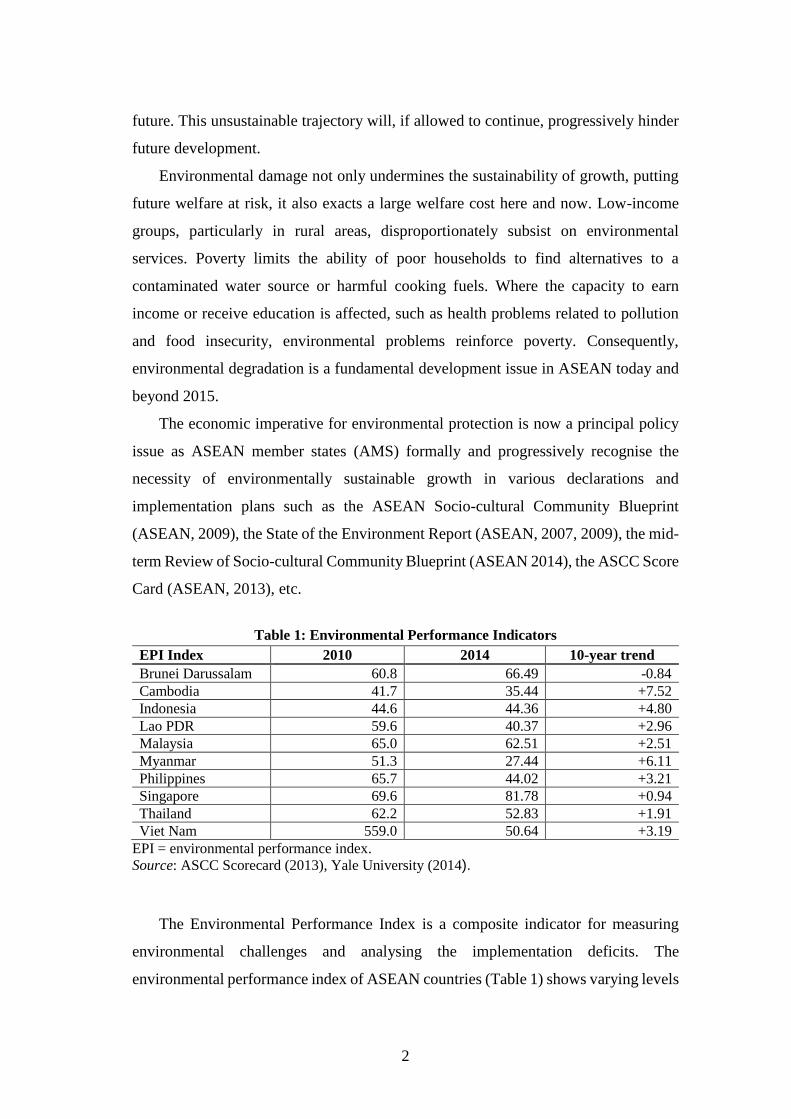
Table 1: Environmental Performance Indicators
EPI Index 2010 2014 10-year trend
Brunei Darussalam 60.8 66.49 -0.84
Cambodia 41.7 35.44 +7.52
Indonesia 44.6 44.36 +4.80
Lao PDR 59.6 40.37 +2.96
Malaysia 65.0 62.51 +2.51
Myanmar 51.3 27.44 +6.11
Philippines 65.7 44.02 +3.21
Singapore 69.6 81.78 +0.94
Thailand 62.2 52.83 +1.91
Viet Nam 559.0 50.64 +3.19
EPI = environmental performance index.
Source: ASCC Scorecard (2013), Yale University (2014).
The Environmental Performance Index is a composite indicator for measuring
environmental challenges and analysing the implementation deficits. The
environmental performance index of ASEAN countries (Table 1) shows varying levels
3
of challenges, progress, and indicates that headway will not be easy, as AMS hold a
range of diverse environmental problems and threats. What they have in common is
their complexity. We believe that it is useful to think of these complex environmental
challenges as ‘wicked problems,’ a concept taken from social planning literature, and
now deployed more broadly. One characteristic of ‘wicked problems’ is that there are
no easy solutions. Certainly, one cannot expect any of these problems to lessen, let
alone disappear, as ASEAN integrates economically and grows fast. To the contrary,
without sustained policy effort, these will persist if not worsen. While in general an
automatic relationship between environmental quality and income per capita does not
exist (Stern, 2004; Carson, 2010), the sort of problems facing ASEAN will not, by and
large, reduce with growth that will further be engineered by economic integration.
Accelerated economic growth will make more resources available to address these
problems. However, without effective environmental management, growth will simply
heighten the divergence across many facets of economic activity between private and
social costs.
The Asian Development Bank Institute (2013) analysed the relationship between
economic growth and environmental resources in different parts of the ASEAN as part
of documenting ASEAN aspirations and achieving RICH (resilient, inclusive,
competitive, and harmonious) targets in 2030. Anbumozhi and Bhatacharyaa (2014)
reviewed environmental degradation due to burgeoning energy demand across AMS,
and recommended several policies to address this issue as economic expansion
continues. They also discussed the competitive use of resources by ASEAN, India, and
China; the need for inter-state cooperation over environmental issues; and the impact
of these major players on the broader region. These earlier analyses lacked a coherent
conceptual framework to provide general observations concerning the origins and
management of ASEAN’s range of environmental problems. This paper seeks to
address this deficiency at the broader level by the formulation and application of
ASEAN Socio-cultural Community (ASCC) framework, an approach that lends itself
to detailed analysis of specific issues outlined in ASCC Scorecard, section D –
Ensuring Environmental Sustainability and ASCC Blue Print-Mid-term review.
The following section illustrates the importance of ASEAN’s natural resource
base to economic development, through an analysis of four major environmental
4
challenges beyond 2015. Section 3 presents seven in-depth case studies. Section 4
outlines the concept of wicked problems using examples from the case studies and
AMS’s broader environmental challenges. Section 5 outlines opportunities available
with Green Growth paradigm. Section 6 explores the implications and presents some
general management strategies to minimise economic and social damages. Section 7
concludes with policy recommendations to take forward ASCC Blueprint.
2. Major Environmental Issues for ASEAN— Beyond 2015
Appendix A-1 lists a composite image of common environment challenges faced
by ASEAN. The major environmental problems confronting ASEAN are grouped
under four themes: water management, deforestation and land degradation, air
pollution, and climate change2.
To analyse these four broad themes, we present related case studies to bring some
benchmarks.
The challenge of water management is illustrated by the dam construction on
the Mekong River.
The challenge of deforestation and land degradation is illustrated by a case
study on deforestation in Indonesia and afforestation programmes in China.
The challenge of air pollution is illustrated by regulatory reforms regarding air
pollutants in India, and the Indonesian deforestation case.
Climate change crosses all of the above challenges and associated cases, and is
also the focus of a section covering climate change mitigation in Southeast
Asia
The four themes are briefly introduced in the following subsections.
Water management
2 Marine ecosystems and resources, biodiversity, waste management, and other issues are also
important and close to climate change, but they are covered in detail in other papers commissioned
for this study and, in our judgement, the four areas above present the most pressing challenges to
ASEAN’s economic integration over the next two decades.
5
Fresh water is essential to agricultural and industrial production. It is a basic
requirement for human life, other organisms, and biological processes. Water
resources generally have multiple uses and users, and inadequate management of their
competitive use has frequently facilitated over-exploitation and degradation. The
depletion and contamination of these resources generate large economic costs through
an increase in the cost of obtaining a direct input to production, and damaging impacts
to environmental systems and human health. Water management is viewed not only as
an environmental issue but a major challenge to economic development, particularly
in AMS (ADB, 2007a).
Excessive groundwater extraction, pollution from human waste and industry, poor
infrastructure, and dam-building are factors contributing to degradation of the region’s
fresh water sources. Major improvements have been made with regards to water access
and sanitation in AMS over the last two decades, but large numbers still have
inadequate facilities (Table 1). Supply-side issues such as these are compounded by
altered rainfall patterns due to climate change, particularly with respect to weakening
of the Indian and East Asian monsoons (IPCC, 2007). Within the next three decades,
increasing glacial melt during the dry season is likely to reverse and transform the
major rivers originating in the Himalayas, such as the Mekong and Citrum in Indonesia,
into seasonal rivers (Asia Society, 2009; Immerzeel et al., 2010).
On the demand side, the United Nations’ projections to 2030 estimate that the total
population of ASEAN, currently comprising 8 percent of the world’s total population,
will rise to 736 million (UN, 2010). The attendant rises in agricultural, industrial, and
urban usage will place even greater strain on dwindling supplies throughout these
economies. The scale of this challenge is emphasised by the estimate that by 2030,
under current management policies, water demand will exceed supply by 25 percent
(WRG, 2009).
Although access to secure and clean freshwater resources will be a common
challenge across ASEAN, the nature of this issue will vary across different settings.
Increased demand may play a large role in some locations, in growing mega-cities like
Jakarta, Bangkok, Kuala Lumpur, and Singapore, for instance, while supply-side
concerns, such as lower dry-season rainfall or polluted water sources, may dominate
in other locations. In most settings, some combinations of both demand and supply
6
factors will be present. Consequently, the term ‘water management’ used here
encompasses a broad mix of water-related issues which also includes efficiency of
water usage; degradation of water resources through pollution or over-use; allocation
between competing uses such as agriculture, drinking-water, natural ecosystems, and
industry; flood control; coordination between users at a local, national, and
international level; treatment of waste water; and water storage, among many others.
The welfare implications of degraded water resources in ASEAN are substantial.
As approximately 70 percent of water is currently used in agriculture (ADB, 2007b),
water shortages undercut food security and the incomes of farmers. Illnesses associated
with contaminated water reduce labour productivity and cause other health-related
costs. If supplies continue to deteriorate as demand rises, the costs of attaining usable
water, such as drilling for groundwater, will rise accordingly. Without improved
management of pollution, expansion of industrial water usage, particularly in China
(WRG, 2009), may diminish availability for human consumption and other uses.
Furthermore, conflict over access to this increasingly scarce resource could arise
between and within states (Asia Society, 2009); plans for several Chinese dams on the
Tsangpo-Brahmaputra River upstream are perceived as a key threat to the stability of
relationship among Mekong countries (Morton 2011).
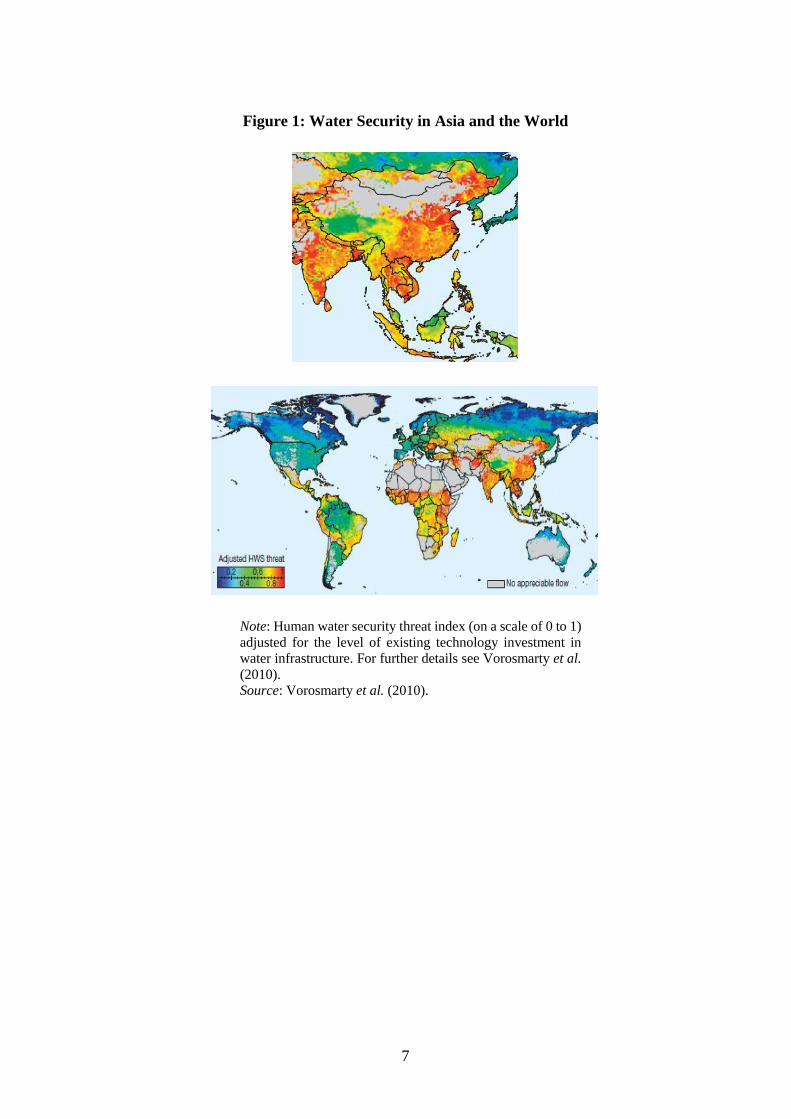
Figure 1 is a map of human water insecurity which demonstrates from a global
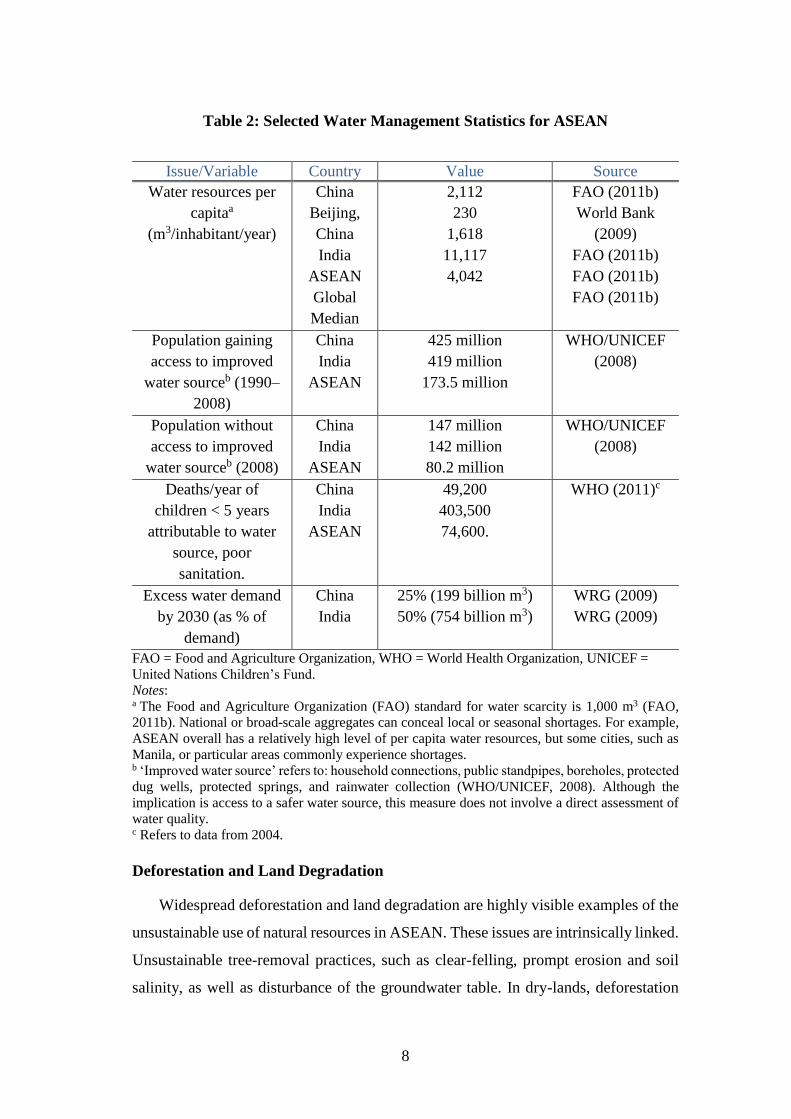
perspective the extent of ASEAN’s current water scarcity problems. Table 2 presents
statistics highlighting the importance and scale of water management issues in ASEAN.
7
Figure 1: Water Security in Asia and the World
Note: Human water security threat index (on a scale of 0 to 1)
adjusted for the level of existing technology investment in
water infrastructure. For further details see Vorosmarty et al.
(2010).
Source: Vorosmarty et al. (2010).
8
Table 2: Selected Water Management Statistics for ASEAN
Issue/Variable Country Value Source
Water resources per
capitaa
(m3/inhabitant/year)
China
Beijing,
China
India
ASEAN
Global
Median
2,112
230
1,618
11,117
4,042
FAO (2011b)
World Bank
(2009)
FAO (2011b)
FAO (2011b)
FAO (2011b)
Population gaining
access to improved
water sourceb (1990–
2008)
China
India
ASEAN
425 million
419 million
173.5 million
WHO/UNICEF
(2008)
Population without
access to improved
water sourceb (2008)
China
India
ASEAN
147 million
142 million
80.2 million
WHO/UNICEF
(2008)
Deaths/year of
children < 5 years
attributable to water
source, poor
sanitation.
China
India
ASEAN
49,200
403,500
74,600.
WHO (2011)c
Excess water demand
by 2030 (as % of
demand)
China
India
25% (199 billion m3)
50% (754 billion m3)
WRG (2009)
WRG (2009)
FAO = Food and Agriculture Organization, WHO = World Health Organization, UNICEF =
United Nations Children’s Fund.
Notes: a The Food and Agriculture Organization (FAO) standard for water scarcity is 1,000 m3 (FAO,
2011b). National or broad-scale aggregates can conceal local or seasonal shortages. For example,
ASEAN overall has a relatively high level of per capita water resources, but some cities, such as
Manila, or particular areas commonly experience shortages. b ‘Improved water source’ refers to: household connections, public standpipes, boreholes, protected
dug wells, protected springs, and rainwater collection (WHO/UNICEF, 2008). Although the
implication is access to a safer water source, this measure does not involve a direct assessment of
water quality. c Refers to data from 2004.
Deforestation and Land Degradation
Widespread deforestation and land degradation are highly visible examples of the
unsustainable use of natural resources in ASEAN. These issues are intrinsically linked.
Unsustainable tree-removal practices, such as clear-felling, prompt erosion and soil
salinity, as well as disturbance of the groundwater table. In dry-lands, deforestation
9
facilitates the transformation of fertile areas into barren land, a process known as
desertification3. Once land is sufficiently degraded, it may be unable to support forests
again, or even the agricultural use that often drives deforestation in the first place.
Deforestation and land degradation throughout ASEAN are caused by various
factors, including demand for timber products and palm oil, intensive farming, and
urban sprawl. Poor regulations and, in some cases, corruption have commonly allowed
unsustainable practices. However, it has become increasingly apparent throughout the
region that the enduring economic costs from unsustainable land-use ultimately
overwhelm the more immediate gains. Once sufficiently degraded, woodland
ecosystems require time and large expense to recover, effectively eliminating future
sources of wood and causing other problems that curb the productivity of the natural
resource base. Over-cultivation of agricultural land increasingly leads to declining soil
productivity and, consequently, lower output and, in some areas, food insecurity.
At a regional level, the situation with regards to deforestation is clearly improving.
This is due, in large part, to concerted afforestation and forest-protection efforts in
countries like Viet Nam. ASEAN now has the largest area of planted forests in the
world and, if anything, the governments of the region are elevating its level of ambition
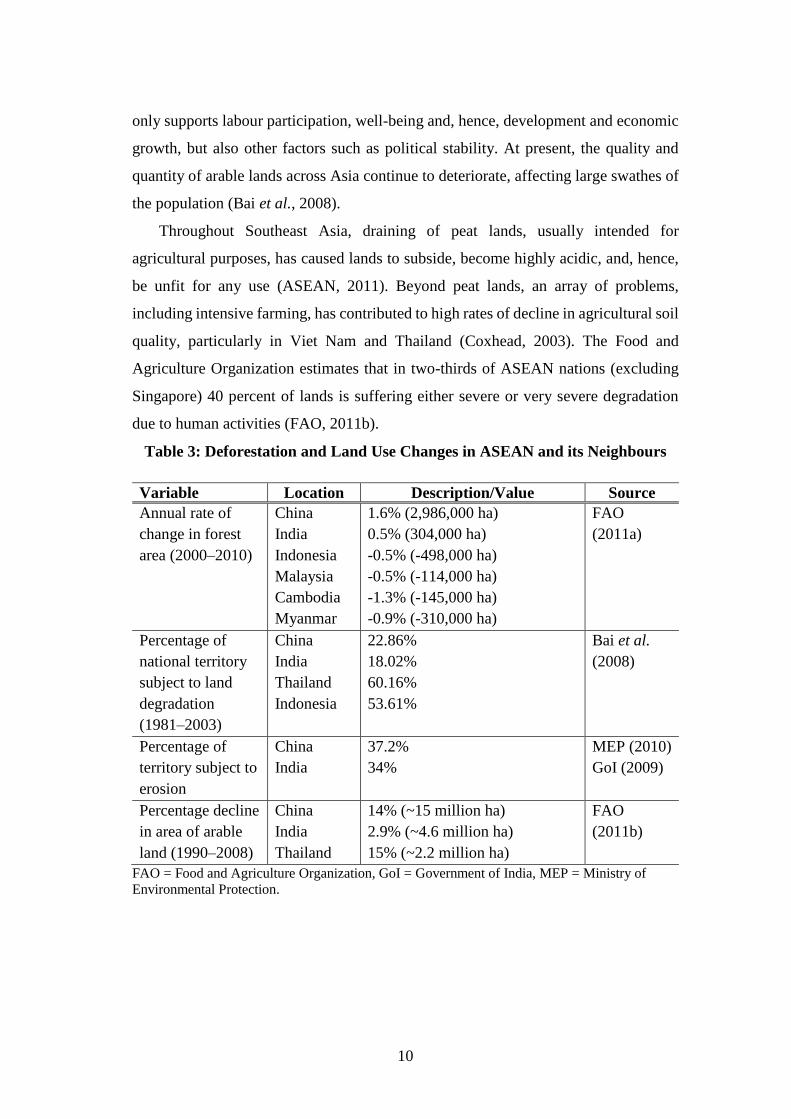
in this area. Yet these promising trends are at odds with those in Indonesia, Malaysia,
Myanmar, and Cambodia, where deforestation continues on a massive scale (Table 2).
In fact, it would seem that improved regulations elsewhere in Asia, particularly China,
are contributing to continuing deforestation in the latter ASEAN countries (Demurger
et al., 2007). For example, the expansion of palm oil plantations is a major driver of
deforestation in Indonesia and Malaysia (Fitzherbert et al., 2008), and these two
countries alone produce over 85 percent of global palm oil exports. China and India
account for 45 percent of global imports (FAO, 2011b). Limits to expansion of
agricultural land in the latter are, to some degree, ‘exporting’ former deforestation
problems. Similar trends in the Asian timber trade have also emerged from recent
analysis (Meyfroidt et al., 2010).
Land degradation is a major economic issue primarily because, like sufficient
water, productive land is a necessary determinant of food security. Access to food not
3 Other drivers of desertification include climate change, natural weather variability, and unsustainable
farming practices such as intensive cropping and excessive irrigation in lands with poor drainage.
10
only supports labour participation, well-being and, hence, development and economic
growth, but also other factors such as political stability. At present, the quality and
quantity of arable lands across Asia continue to deteriorate, affecting large swathes of
the population (Bai et al., 2008).
Throughout Southeast Asia, draining of peat lands, usually intended for
agricultural purposes, has caused lands to subside, become highly acidic, and, hence,
be unfit for any use (ASEAN, 2011). Beyond peat lands, an array of problems,
including intensive farming, has contributed to high rates of decline in agricultural soil
quality, particularly in Viet Nam and Thailand (Coxhead, 2003). The Food and
Agriculture Organization estimates that in two-thirds of ASEAN nations (excluding
Singapore) 40 percent of lands is suffering either severe or very severe degradation
due to human activities (FAO, 2011b).
Table 3: Deforestation and Land Use Changes in ASEAN and its Neighbours
Variable Location Description/Value Source
Annual rate of
change in forest
area (2000–2010)
China
India
Indonesia
Malaysia
Cambodia
Myanmar
1.6% (2,986,000 ha)
0.5% (304,000 ha)
-0.5% (-498,000 ha)
-0.5% (-114,000 ha)
-1.3% (-145,000 ha)
-0.9% (-310,000 ha)
FAO
(2011a)
Percentage of
national territory
subject to land
degradation
(1981–2003)
China
India
Thailand
Indonesia
22.86%
18.02%
60.16%
53.61%
Bai et al.
(2008)
Percentage of
territory subject to
erosion
China
India
37.2%
34%
MEP (2010)
GoI (2009)
Percentage decline
in area of arable
land (1990–2008)
China
India
Thailand
14% (~15 million ha)
2.9% (~4.6 million ha)
15% (~2.2 million ha)
FAO
(2011b)
FAO = Food and Agriculture Organization, GoI = Government of India, MEP = Ministry of
Environmental Protection.
11
Air pollution
Access to clean air is a principal determinant of human health, as well as the
overall condition of other organisms and environmental processes. Outdoor air
pollution is a common by-product of industrial production, motorised transport, and,
in fact, the central processes underpinning global economic growth over the last
century or so. On the other hand, indoor air pollution is often associated with lack of
development. Absence of affordable alternatives encourages burning of solid fuels
such as dung and timber for energy, despite its harmful effects. Consequently, air
pollution is a primary cause of illnesses and deaths in both the growing cities and the
poorer rural areas of ASEAN. The widespread nature of this problem undermines the
productivity and income of the labour force, exacting a heavy economic toll. For
example, a recent study estimates that in 2005 the annual welfare loss associated with
air pollution in China amounted to US$151 billion (2010 dollars) (Matus et al., 2011).
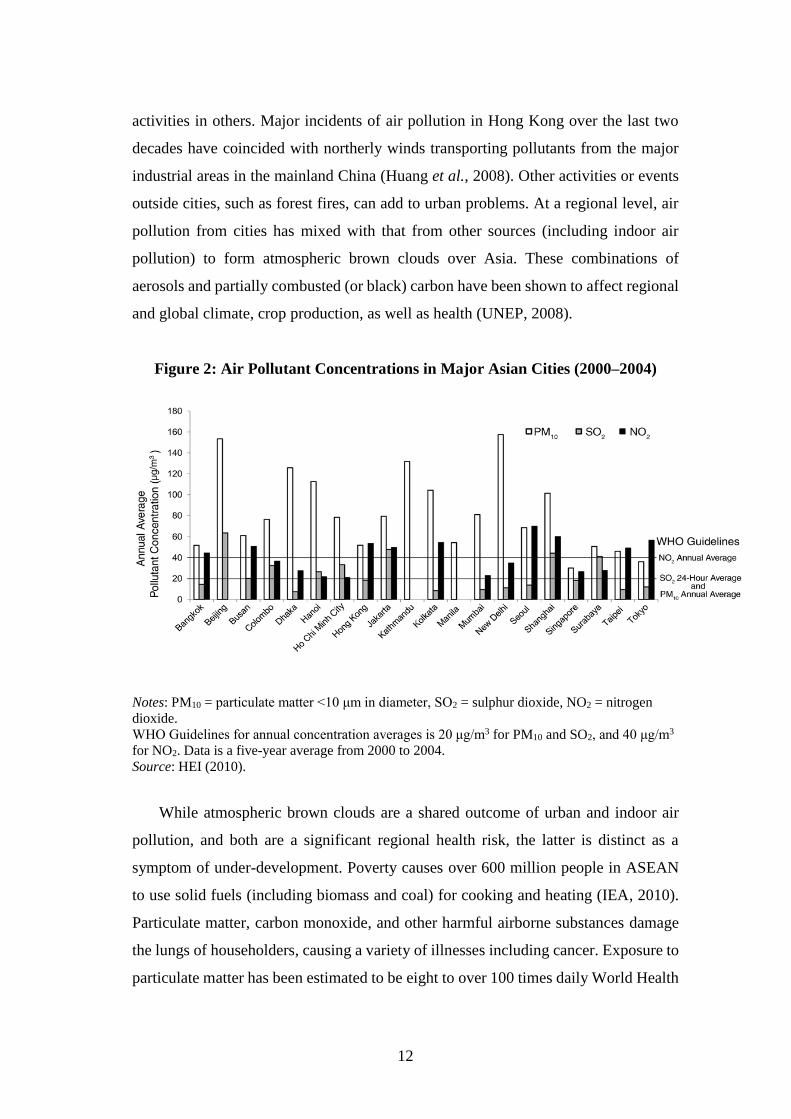
Air pollution commonly exceeds safe levels across the cities of AMS (Figure 2).
Emission of noxious gases and particulate matter from motor vehicles, industry, and
other sources—plus the rising urban population exposed to them— are increasing the
regional burden of respiratory illnesses and cancer (HEI, 2010). On a global basis,
about 65 percent of urban air pollution mortality occurs in ASEAN, China, and South
Asia (Cohen et al., 2005). At an aggregate level, there have been significant
improvements in recent times (CAI, 2010), but without renewed mitigation efforts,
such as tighter emissions standards and stronger monitoring programmes, the situation
across the region could deteriorate substantially. The urban population of ASEAN is
set to increase by 50 percent between 2010 and 2030 (UN, 2009). This rapid
urbanisation and a growing middle class are causing an explosion in motor vehicle
ownership in ASEAN. Higher incomes will also raise demand for energy-intensive
consumer goods, such as air conditioners, and, where industrial and energy production
occurs in proximity to cities, potential pollution from these sources increases
accordingly.
Air pollution in large cities is not simply a localised or a health issue. Air transport
of urban pollutants causes problems further afield. For example, acid rain originating
from sulphur dioxide emissions in cities degrades farm land in regional areas and
contaminates groundwater. Air pollution problems in one city may be compounded by
12
activities in others. Major incidents of air pollution in Hong Kong over the last two
decades have coincided with northerly winds transporting pollutants from the major
industrial areas in the mainland China (Huang et al., 2008). Other activities or events
outside cities, such as forest fires, can add to urban problems. At a regional level, air
pollution from cities has mixed with that from other sources (including indoor air
pollution) to form atmospheric brown clouds over Asia. These combinations of
aerosols and partially combusted (or black) carbon have been shown to affect regional
and global climate, crop production, as well as health (UNEP, 2008).
Figure 2: Air Pollutant Concentrations in Major Asian Cities (2000–2004)
Notes: PM10 = particulate matter <10 μm in diameter, SO2 = sulphur dioxide, NO2 = nitrogen
dioxide.
WHO Guidelines for annual concentration averages is 20 μg/m3 for PM10 and SO2, and 40 μg/m3
for NO2. Data is a five-year average from 2000 to 2004.
Source: HEI (2010).
While atmospheric brown clouds are a shared outcome of urban and indoor air
pollution, and both are a significant regional health risk, the latter is distinct as a
symptom of under-development. Poverty causes over 600 million people in ASEAN
to use solid fuels (including biomass and coal) for cooking and heating (IEA, 2010).
Particulate matter, carbon monoxide, and other harmful airborne substances damage
the lungs of householders, causing a variety of illnesses including cancer. Exposure to
particulate matter has been estimated to be eight to over 100 times daily World Health
13
Organization (WHO) safe levels (Rehfuess et al., 2011). As a consequence of such
exposure levels, the WHO estimates that over one million deaths each year in China,
India, and ASEAN are directly attributable to indoor air pollution (WHO, 2009).
The disproportionate impact upon women and children of this problem impedes
the workforce participation of the former and limits the prospects for the latter.
Although this problem has been long recognised, widespread change in ASEAN is yet
to take place (IEA, 2010). Indoor air pollution is a major development issue because
it not only affects the welfare of poor households in the present but their prospects for
the future. While promising developments are on the horizon, particularly as the co-
benefits of black carbon mitigation and improved cook stoves gain prominence
(UNEP/WMO, 2011), indoor air pollution will continue to afflict a large proportion of
poor households in Asia over the next two decades (IEA, 2010), despite regional
economic growth.
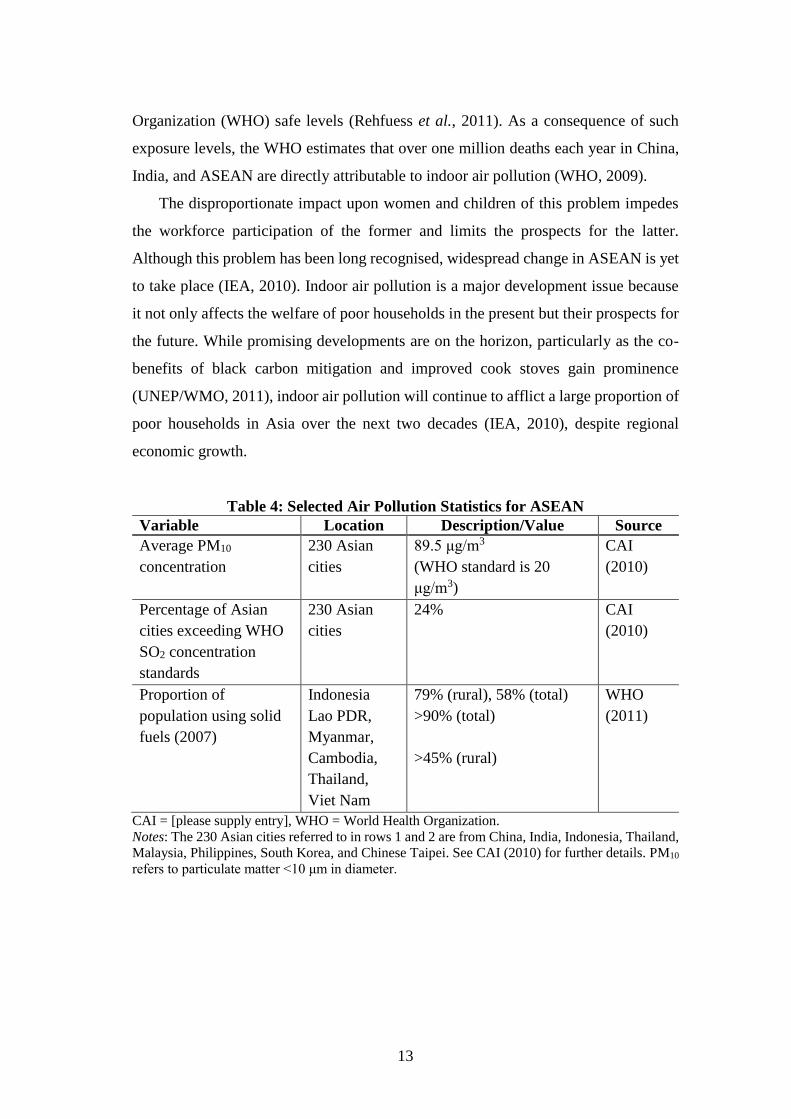
Table 4: Selected Air Pollution Statistics for ASEAN
Variable Location Description/Value Source
Average PM10
concentration
230 Asian
cities
89.5 μg/m3
(WHO standard is 20
μg/m3)
CAI
(2010)
Percentage of Asian
cities exceeding WHO
SO2 concentration
standards
230 Asian
cities
24% CAI
(2010)
Proportion of
population using solid
fuels (2007)
Indonesia
Lao PDR,
Myanmar,
Cambodia,
Thailand,
Viet Nam
79% (rural), 58% (total)
>90% (total)
>45% (rural)
WHO
(2011)
CAI = [please supply entry], WHO = World Health Organization.
Notes: The 230 Asian cities referred to in rows 1 and 2 are from China, India, Indonesia, Thailand,
Malaysia, Philippines, South Korea, and Chinese Taipei. See CAI (2010) for further details. PM10
refers to particulate matter <10 μm in diameter.
14
Climate change
ASEAN is highly vulnerable to the effects of climate change. With a large
population in low-lying and coastal areas, widespread water insecurity, and around
two-thirds of the world’s poorest people, the region is likely to suffer extensive
damages in the future (IPCC, 2007). While the full force of development impacts will
not be realised for many decades, climate change adaptation is already a contemporary
issue. Rising maximum temperatures and changing rainfall patterns are affecting
agriculture and food security today, and the effect of these changes will escalate to
2030 (Lobell et al., 2008). For example, it is estimated that yields of important crops
will decline in parts of Asia by 2.5 percent to 10 percent by the 2020s (IPCC, 2007).
Greater intensity of extreme weather events, incidence of flooding and tropical disease,
and decline of marine ecosystems are also concerns for the proximate future (ADB,
2009a; IPCC, 2007).
Climate change will worsen the ill effects of ASEANs current environmental
problems, such as water insecurity, but these problems also contribute to climate
change. Deforestation and black carbon emissions in Asia drivers of global warming,
both in terms of contribution and also because their mitigation could be a low-cost
option with short-term benefits. Energy demand in ASEAN is expected to explode
with ongoing economic expansion and, accordingly, so will coal use and greenhouse
gas emissions. ASEAN is set to be the dominant source of expansion in global
emissions. Recent projections of global emissions estimate that, under business as
usual, China’s share of global fossil fuel emissions will be 34 percent by 2030, and the
figure for developing Asia as a whole will be 51.9 percent (Garnaut et al., 2008).
Unsurprisingly, the International Energy Agency projections indicate that China, India,
and ASEAN, in particular, will have to shoulder a large share of the mitigation burden
necessary to restrict global warming to 2°C (Table 5).
15
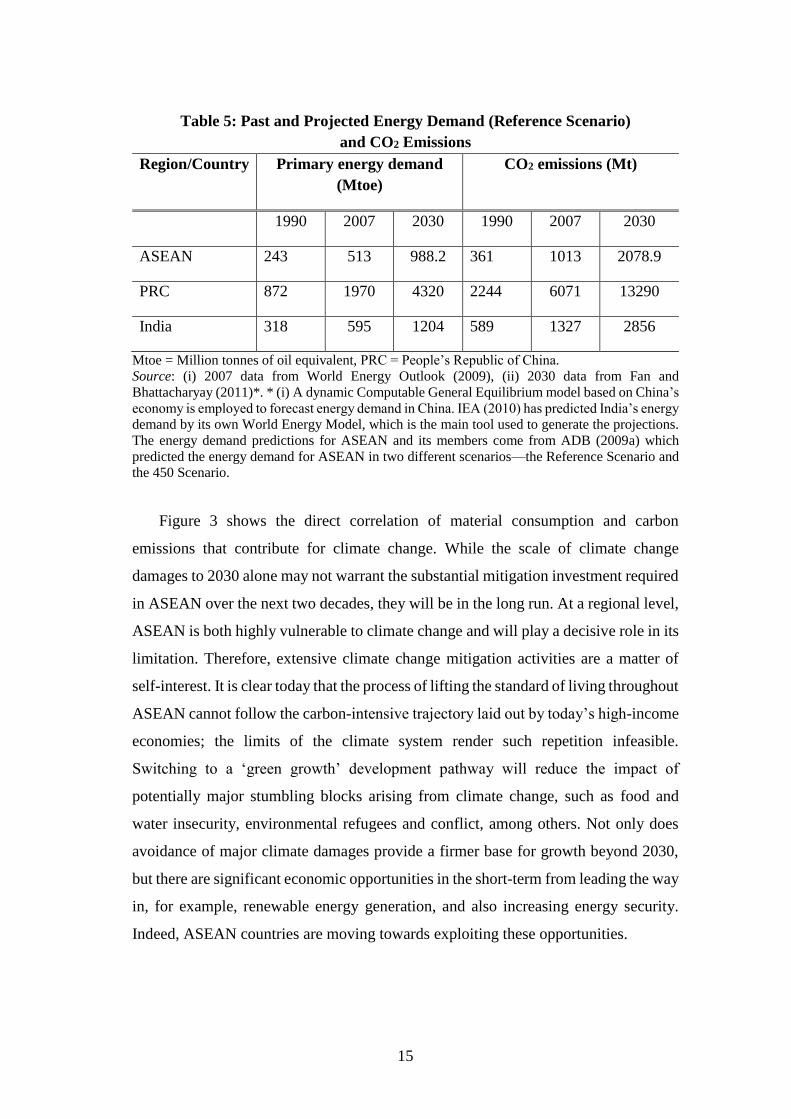
Table 5: Past and Projected Energy Demand (Reference Scenario)
and CO2 Emissions
Region/Country Primary energy demand
(Mtoe)
CO2 emissions (Mt)
1990 2007 2030 1990 2007 2030
ASEAN 243 513 988.2 361 1013 2078.9
PRC 872 1970 4320 2244 6071 13290
India 318 595 1204 589 1327 2856
Mtoe = Million tonnes of oil equivalent, PRC = People’s Republic of China.
Source: (i) 2007 data from World Energy Outlook (2009), (ii) 2030 data from Fan and
Bhattacharyay (2011)*. * (i) A dynamic Computable General Equilibrium model based on China’s
economy is employed to forecast energy demand in China. IEA (2010) has predicted India’s energy
demand by its own World Energy Model, which is the main tool used to generate the projections.
The energy demand predictions for ASEAN and its members come from ADB (2009a) which
predicted the energy demand for ASEAN in two different scenarios—the Reference Scenario and
the 450 Scenario.
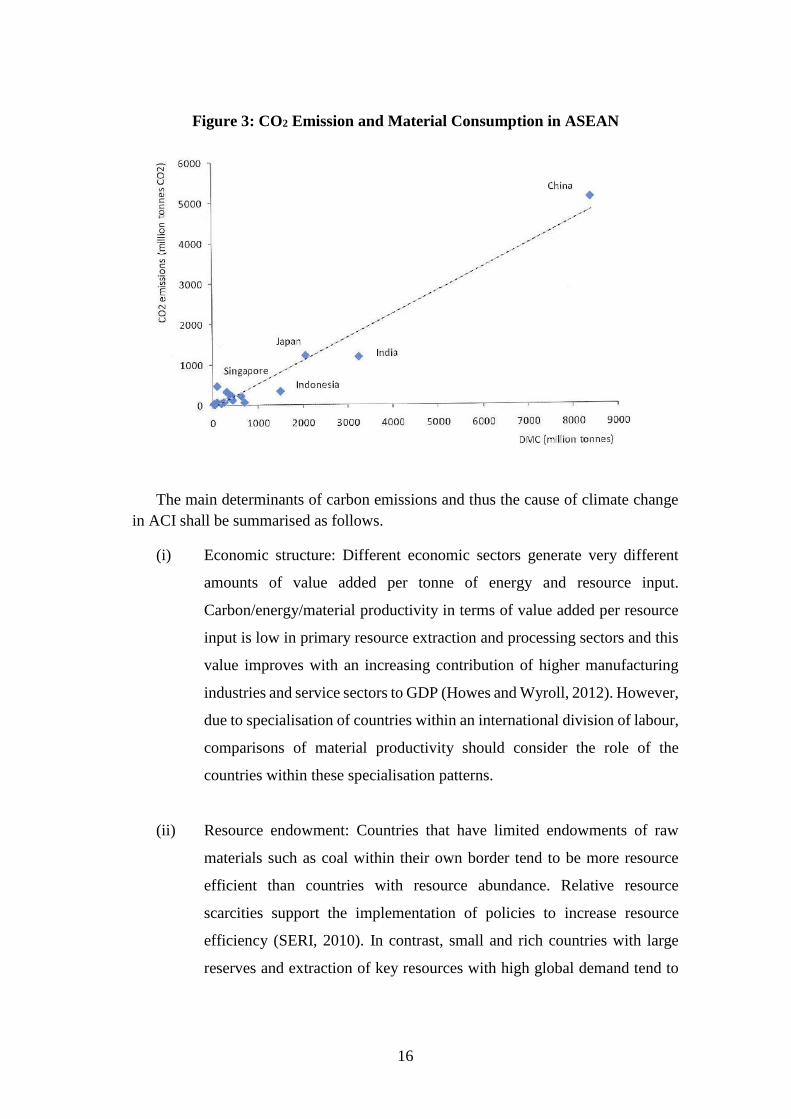
Figure 3 shows the direct correlation of material consumption and carbon
emissions that contribute for climate change. While the scale of climate change
damages to 2030 alone may not warrant the substantial mitigation investment required
in ASEAN over the next two decades, they will be in the long run. At a regional level,
ASEAN is both highly vulnerable to climate change and will play a decisive role in its
limitation. Therefore, extensive climate change mitigation activities are a matter of
self-interest. It is clear today that the process of lifting the standard of living throughout
ASEAN cannot follow the carbon-intensive trajectory laid out by today’s high-income
economies; the limits of the climate system render such repetition infeasible.
Switching to a ‘green growth’ development pathway will reduce the impact of
potentially major stumbling blocks arising from climate change, such as food and
water insecurity, environmental refugees and conflict, among others. Not only does
avoidance of major climate damages provide a firmer base for growth beyond 2030,
but there are significant economic opportunities in the short-term from leading the way
in, for example, renewable energy generation, and also increasing energy security.
Indeed, ASEAN countries are moving towards exploiting these opportunities.
16
Figure 3: CO2 Emission and Material Consumption in ASEAN
The main determinants of carbon emissions and thus the cause of climate change
in ACI shall be summarised as follows.
(i) Economic structure: Different economic sectors generate very different
amounts of value added per tonne of energy and resource input.
Carbon/energy/material productivity in terms of value added per resource
input is low in primary resource extraction and processing sectors and this
value improves with an increasing contribution of higher manufacturing
industries and service sectors to GDP (Howes and Wyroll, 2012). However,
due to specialisation of countries within an international division of labour,
comparisons of material productivity should consider the role of the
countries within these specialisation patterns.
(ii) Resource endowment: Countries that have limited endowments of raw
materials such as coal within their own border tend to be more resource
efficient than countries with resource abundance. Relative resource
scarcities support the implementation of policies to increase resource
efficiency (SERI, 2010). In contrast, small and rich countries with large
reserves and extraction of key resources with high global demand tend to
17
have the highest per capita consumption numbers and have less incentive
to increase resource efficiency.
(iii) International trade: A factor closely related to emission and resource
endowments is international trade. Countries that import high shares of
their raw materials and products have higher material productivities than
countries that extract and process raw materials within their borders. This
calls for application of more comprehensive indicators to measure material
consumption and evaluate material productivity, including the up-stream
indirect flows of trade (Kalirajan, 2012).
3. Case Studies of Environmental Problems in Asia
This section presents five case studies of environmental issues affecting the
economies of ASEAN.
3.1. Regional Management of Hydropower Development on the Mekong River
The Mekong is one of the world’s few major rivers whose hydropower potential
remains largely unexploited. This relative absence of dams is set to change at a rapid
pace. Eleven mainstream dams are planned in the Lower Mekong Basin (LMB), an
area encompassing Lao PDR, Thailand, Cambodia, and Viet Nam.4 The environmental
and social impacts of the proposed dams will endure for decades, yet, due to the
complex processes involved, any prior assessment of costs and benefits is riddled with
great uncertainty. 5 Outcomes will be broadly and unevenly distributed across
stakeholders, time, and countries. In recognition of the scale of potential transnational
impacts, a regional forum, the Mekong River Commission (MRC), was created during
the 1990s to facilitate collective and mutually beneficial management. However,
meeting this fundamental objective, whether through the MRC or otherwise, is likely
4 Away from the mainstream, a further 56 tributary dams are in various stages of design or
construction through the LMB, mainly in Lao PDR (MRC, 2011b). Although tributary dams can
have a major impact on the mainstream river, they are outside the auspices of the MRC. 5 A recent study by Costanza et al. (2011) demonstrates that cost-benefit analysis of Mekong
mainstream dams can produce highly variable results across a credible range of values for
economic and environmental parameters.
18
to be a major challenge during both planning and operation of these projects, should
they proceed.
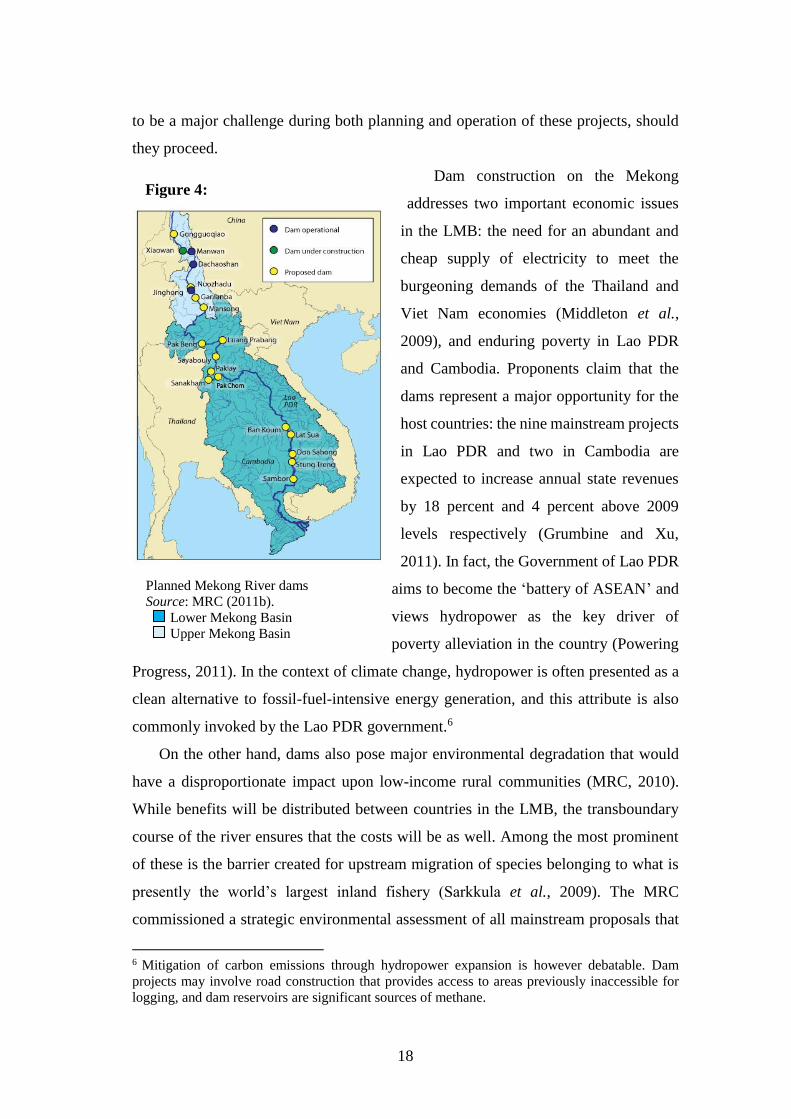
Dam construction on the Mekong
addresses two important economic issues
in the LMB: the need for an abundant and
cheap supply of electricity to meet the
burgeoning demands of the Thailand and
Viet Nam economies (Middleton et al.,
2009), and enduring poverty in Lao PDR
and Cambodia. Proponents claim that the
dams represent a major opportunity for the
host countries: the nine mainstream projects
in Lao PDR and two in Cambodia are
expected to increase annual state revenues
by 18 percent and 4 percent above 2009
levels respectively (Grumbine and Xu,
2011). In fact, the Government of Lao PDR
aims to become the ‘battery of ASEAN’ and
views hydropower as the key driver of
poverty alleviation in the country (Powering
Progress, 2011). In the context of climate change, hydropower is often presented as a
clean alternative to fossil-fuel-intensive energy generation, and this attribute is also
commonly invoked by the Lao PDR government.6
On the other hand, dams also pose major environmental degradation that would
have a disproportionate impact upon low-income rural communities (MRC, 2010).
While benefits will be distributed between countries in the LMB, the transboundary
course of the river ensures that the costs will be as well. Among the most prominent
of these is the barrier created for upstream migration of species belonging to what is
presently the world’s largest inland fishery (Sarkkula et al., 2009). The MRC
commissioned a strategic environmental assessment of all mainstream proposals that
6 Mitigation of carbon emissions through hydropower expansion is however debatable. Dam
projects may involve road construction that provides access to areas previously inaccessible for
logging, and dam reservoirs are significant sources of methane.
Planned Mekong River dams
Source: MRC (2011b).
Lower Mekong Basin
Upper Mekong Basin
Figure 4:
19
estimated an annual loss of 340,000 tonnes of fish by 2030, equating to US$476
million per year (MRC, 2010). As fish account for 47-80 percent of animal protein
consumed within the LMB (Hortle, 2007), and is a major source of rural income
(Dugan et al., 2010), this factor alone could have a major impact on food security and
poverty (MRC, 2010). In addition, substantial blockage of sediment transfer would
cause significant downstream erosion and undermine the productivity of riverside and
flood-plain agriculture (Kummu et al., 2010). Although prior assessment of the
damages caused by LMB mainstream dams are unavoidably estimates, disastrous
experiences in China (Economy, 2010) and on Mekong tributaries (Amornsakchai et
al., 2000) indicate their potential scale.
The major recommendation of the MRC-commissioned strategic environmental
assessment was a 10-year moratorium on any construction decisions, pending further
scientific study into uncertainty over large environmental and social costs (MRC,
2010). This and other MRC technical reports (MRC, 2011c), as well as associated
planning processes (MRC, 2011a; 2011d), have significantly contributed to
dissemination of information on the mainstream proposals. However, the future
effectiveness of the MRC as a forum for LMB countries to collectively pursue
hydropower development sustainably is an open question (Grumbine and Xu, 2011).
The MRC has frequently been marginalised in states’ decision making (Dore and
Lazarus, 2009; Campbell, 2009). Despite the recommended delay, the Lao PDR
government has consistently demonstrated a determination to proceed in a much
shorter time frame (Hirsch, 2010). Although other member countries— particularly
Viet Nam— have recently used the MRC framework to voice objections to progress
in the first mainstream project at Xayaburi (near Luang Prabang in Lao PDR) (MRC,
2011d), and subsequently secured a temporary suspension on the sidelines of the
ASEAN summit, the MRC remains in principle a consultative body which affords no
veto power for members to prevent construction of a mainstream dam in another
country. This lack of oversight was demonstrated during the MRC consultation process
for the Xayaburi dam, when construction activities were already taking place (Bangkok
Post, 2011), and also during the supposed suspension, when the Lao PDR Ministry of
Energy notified the dam developer that it was authorised to proceed (Reuters, 2011).
20
It is important to note that regional management is not simply a case of deciding
whether the mainstream projects are built or not, but also minimising their negative
impacts should they proceed. Planning tools such as those pursued by the MRC inform
the need for dam design measures that incorporate environmental river flows. The
latter include variable water outlet capacity, sediment bypasses and flushing outlets,
re-regulation reservoirs, and fish passages (Krchnak et al., 2009). However, such
measures can entail significant additional costs to dam developers across all phases of
the project, including operation. What’s more, their utility will always be site-specific;
for example, there is no scientific evidence to suggest that fish ladders will work for
most species in the Mekong mainstream (Dugan et al., 2010). Minimising
environmental and social damage entails significant financial investment and a lengthy
planning period to allow sufficient scientific study, yet dam developers are unlikely to
meet such requirements if they impinge on short-term profits.
Outside of the MRC, other means for managing environmental risks exist, but
appear limited. Where domestic environmental regulations exist on paper in Lao PDR
and Cambodia, the institutional capacity or willingness to enforce them is often
deficient (Foran et al., 2010). Similarly, the prospects for regulation through corporate
social responsibility standards (such as the World Commission on Dams principles
[WCD, 2000]) are constrained by the primacy of profit to private-sector financiers and
developers from Thailand, Viet Nam, China, and Malaysia (Foran et al., 2010;
Middleton et al., 2009). These sources of new finance have supplanted the prospect of
direct involvement, and hence significant oversight, by multilateral institutions such
as the World Bank in the mainstream projects.
The task facing LMB governments within the MRC framework is complicated by
the existence of competing domestic interests. Aside from the importance of electricity
imports to growth of the Thailand and Viet Nam economies, dam developers and
financiers from these countries stand to make large profits from mainstream dams
(Foran et al., 2010). However, substantial community opposition exists both in
Thailand, where NGOs have effectively harnessed anti-dam sentiment from previous
domestic projects, and in Viet Nam, where farming productivity and food security in
the Mekong Delta are likely to suffer. From the perspective of the Cambodia and Lao
PDR governments, elite groups stand to gain personally if the dams proceed, yet the
21
broader development impacts for many of their citizens from, for example,
resettlement and lower fish catches could potentially be overwhelmingly negative,
especially in the short-term. While the Cambodian government seeks to mitigate
detrimental impacts from dams upstream in Lao PDR, it does not oppose mainstream
dam construction more generally due to plans within its own territory (MRC, 2011d).
Although China has only loose affiliation with the MRC, it is playing a major role
in the mainstream projects. Dams on the upper reaches in China provide not only a
moral case for Lao PDR (i.e. dams are already having impacts in the LMB), but have
changed the river’s hydrology so that the run-of-river projects planned in Lao PDR are
commercially viable (Hirsch, 2011)7. Aside from the four mainstream projects led by
Chinese interests (MRC, 2010), up to about 40 percent of all hydropower development
in the LMB (including tributary dams) will be undertaken by Chinese companies in
the coming decades (Hirsch, 2011). More broadly, China has been heavily expanding
economic investment in both Cambodia and Lao PDR, such as the forthcoming high-
speed rail link between China’s Yunnan Province and Vientiane.
Regional governance through a purpose-built institution like the MRC is essential
because mainstream dams are such a multi-faceted issue with wide ranging impacts
(Grumbine and Xu, 2011; Campbell 2009). In addition to the issues discussed above,
future transboundary damages have the potential to undermine long-term cooperation
and security in the region (Cronin, 2009). Even if the current plans do not proceed in
the near future, the prospective financial gains for some stakeholders ensure that
demand for dams will always be present. If they do proceed, strong mechanisms will
have to be developed within the MRC framework to ensure that they are operated to
the benefit of the region’s inhabitants. The perpetual yet dynamic nature of the issue,
as well as the great risks involved, will require adaptive and strong regional
governance in the years ahead.
3.2. Afforestation and Land Restoration in China
7 Run-of-river dams typically have small reservoirs and require a steady flow to operate year-round.
The high fluctuation of the Mekong’s flow across the seasons in northern Lao PDR, site of several
proposed run-of-river dams, is now regulated by the mainstream dams in China increasing flows
outside of the monsoon and vice versa.
22
Although deforestation and land degradation have been common throughout
China’s history, the unsustainable use of the country’s land-based resources has
become most apparent in the last two decades of rapid economic growth. By the late
1990s, soil erosion was degrading 20 percent of the country’s landmass, the area of
cropland and forested land per person had declined to one half and one-sixth of the
global average, and desertification affected 25 percent of China (Liu and Diamond,
2005). In addition to the pressures of population growth and urban development, these
problems were symptomatic of the national government’s earlier willingness to pursue
economic expansion at the expense of the environment. However, multiple factors
prompted the government to initiate urgent action during the late 1990s, including
major flooding; dust storms affecting urban areas, particularly Beijing; and concerns
over food security, as well as the future of the nation’s forest resources.
The government response was to design and implement several land-based
ecological restoration programmes (ERPs) which have, since 2000, entailed an
unprecedented financial investment in China’s forestry resources of approximately
US$100 billion (Wang, G. et al., 2008).8 Key focus areas include forest conservation
(including wholesale logging bans in many areas), prevention of slope erosion and
desertification, afforestation of degraded land, and re-vegetation of agricultural land.
The primary mechanism of these programmes has been an extraordinary rise in
afforestation activities9. The official statistics are impressive to say the least. Chinese
government figures indicate that forest coverage has been increasing at 1.6 percent per
year since 2000, or approximately three million hectares annually (FAO, 2011a). It has
been estimated that within the first eight years of the ERPs: 8.8 million hectares of
cropland was converted to forest; soil erosion and desertification of land had been
reversed, and were declining annually by 4.1 percent and 1283 km2 respectively; and
98 million hectares of natural forest were placed under effective protection (Wang et
al., 2007).
Aside from the finances dedicated to the ERPs, contributing factors to their
success have included payments to local communities, particularly for farmers through
8 See Wang et al (2007b, Table 2) for a detailed description of each programme. 9 Formally, afforestation refers to tree-planting on land that did not previously support forests and
reforestation applies to planting that occurs on land where forests did exist but were removed or
degraded. For simplicity, we use the term afforestation to describe tree-planting in both cases.
23
the Sloping Land Conversion Program (Yin and Yin, 2010); ownership and tax reform
at a state level that has encouraged the growth of commercial plantations (Wang et al.,
2007); and national government programmes that have resettled or retrained workers
previously engaged in logging (Wang et al., 2007).
There are, however, a number of caveats to this success story. The term ‘forest’ in
China has changed over the last decade, and can now describe scrub and grass land, as
well as orchards and other types of ‘economic forests’ (Demurger et al., 2007; Si,
2011). Thus, definitional alterations may account for some of the statistical expansion.
Monitoring and assessment are a major challenge; the political system ensures that
regional governments and the bureaucracy at all levels have a strong incentive to state
that central government targets are being met, even if that is not the case (Guan et al.,
2011; Yin and Yin, 2010). A field study of afforestation programmes in a small
township of Sichuan province demonstrated this problem, finding that local
government statistics had grossly misrepresented reports of success (Trac et al., 2007).
Another issue pertains to the desirability and permanence of tree plantations,
particularly in the arid and semi-arid lands of China. Large-scale afforestation in these
areas, particularly of non-local tree species, has frequently lowered the water table and
actually advanced land degradation (Cao, 2008; Jiao et al., 2011, Sun et al., 2006). As
they are simply not suited to the environment in these regions, survival rates of planted
trees in China’s dry northern provinces have been as little as 15 percent in some cases
(Cao, 2011). Although re-vegetation of local grasses and shrubbery would produce
better long-term results (Jiao et al., 2011), the ‘top-down’ nature of ERP design and
implementation means that the central government has been slow to recognise that
afforestation alone will not produce favourable outcomes (Cao et al., 2010). Across a
wider range of geographic areas, forestry management practices that encourage higher
survival rates and better quality of plantation forests (such as thinning and tending of
branches, as well as site selection) have been insufficiently incorporated into
afforestation programmes to date (Yin and Yin, 2010).
A further component of the permanence issue is the long-term maintenance of
reforested land by private land owners. Uncertainty over the duration of compensatory
funding— five to eight-year periods are typical— provides a disincentive to quality
stewardship and, in the case of the Sloping Land Conservation Project (SLCP),
24
analysis of surveyed participants responses indicated that a large proportion will
simply return forested land to cropping once funding ends (Bennett, 2008). Moreover,
the level of support and resources available for implementation of ERPs on the ground
has often been lacking (Wang et al., 2007; Bennett, 2008).
A common thread to critiques of the ERPs is the inefficiency of their ‘top-down’
design and the multiple levels of bureaucracy required for implementation (Demurger
et al., 2007; Cao, 2011; Yin and Yin, 2010). Obviously this is not a problem specific
just to forestry and environmental management, but a wider issue pertaining to
governance in China as a whole. Although vast resources have been dedicated to
afforestation and mitigation of land degradation since the turn of the century, it would
appear that these efforts have been hindered by China’s political system. Official
estimates of China’s forest coverage and related statistics have improved, but they are
rarely corroborated by independent evidence (Yin and Yin, 2010).
The Chinese government has stated plans to further increase official forest cover
to 23 percent by 2020 and 26 percent by 2050 (up from 22 percent in 2011); hence,
large-scale afforestation activities are set to continue. A major component of this
increase will be plantations to fulfil the growing demands of China’s economy,
particularly the manufacture of timber products. In light of the issues outlined above,
actual future increases in domestic supply are unlikely to meet burgeoning domestic
demand (White et al., 2006). Another pressure on China’s forestry resources will be
conversion to agricultural land as the population and incomes grow. However, given
the central government’s commitment to reversing deforestation rather than a
widespread return to unsustainable domestic practices, it is more probable that the
recent ‘exportation’ of China’s deforestation problems to its neighbours will escalate
(Liu and Diamond, 2005; Demurger et al., 2009).
3.3. Deforestation in Indonesia and Transboundary Haze Pollution
Although various estimates differ over the precise scale of deforestation in
Indonesia, they all tell the same story: the country’s forestry resources are being
degraded at a massive rate10. Satellite-based observations between 2000 and 2008 of
10 For example, Verchot et al. (2010) quote government statistics of 1.2 million hectares per year.
The FAO (2011a) report 498,000 hectares per year. Such discrepancies are common and arise from
the difficulties of measuring such a dynamic and geographically disperse issue.
25
Indonesia’s largest land masses, Sumatra and Kalimantan, have revealed 5.39 million
hectares of deforestation, comprising 5.3 percent of the land area and 9.2 percent of
forest cover in 2000 (Broich et al., 2011). Deforestation in Indonesia is driven
primarily by demand for timber and conversion of land into palm oil plantations
(mostly for export), as well as the expansion of subsistence farming which also plays
a lesser, though still significant, role (Verchot et al., 2010).
Central to the problem is that weak institutional capacity and corruption at a local
level limit the strength of national laws aimed at reducing deforestation; illegal logging
in government- managed areas is common.11 Further drivers include the short-term
financial gain in regional income and employment associated with deforestation
activities, particularly given that Indonesia exhibits relatively low-income levels
(Tacconi et al., 2008); government policies in the 1980s that encouraged land-use
change (Herawati and Santoso, 2011); and the move to decentralisation of governance
after the fall of the Suharto regime (Arnold, 2008). More broadly, however, much of
the demand for timber and palm oil originates from overseas, where surging economic
growth and more stringent domestic regulations in countries such as China have caused
Indonesia to ‘import’ some of its deforestation problems from elsewhere (see previous
section of the present study).
While deforestation in itself is a major environmental issue—Indonesia’s
remaining forests support extensive animal and plant biodiversity, as well as providing
vital ecosystem services to rural communities—the manner in which it occurs greatly
accentuates its ill effects. Land-clearing for logging and agricultural purposes is
commonly pursued by means of fire simply because this is the cheapest method
available (Tacconi et al., 2008). The smoke and air pollution associated with fire
clearing is exacerbated by its frequent occurrence on Indonesia’s vast expanse of
tropical peat lands; peat is organically rich and highly combustible, thus fire clearing,
combined with the accompanying practice of draining peat lands, causes the land itself
to burn. The consequent haze is transported by monsoonal winds over to Indonesia’s
neighbours, of which Malaysia and Singapore are among the worst affected. In 1997
a major incidence of regional transboundary haze pollution (THP) from forest fires in
11 For example, the Broich et al. (2011) study found that 20 percent of deforestation occurred in
legally protected areas.
26
Indonesia exacted a short-term economic impact across the three countries of around
US$4.5 billion, including US$1.4 billion from air-pollution-related health costs
(EEPSEA/WWF, 2003).
Once again, THP and deforestation are not just an important issue in terms of their
regional impacts, but also because of their direct link to the greatest environmental
challenge at a global scale: climate change. The drainage and burning of peat lands
release large volumes of carbon dioxide trapped in soil. Forest clearing eliminates a
major carbon sink. The combination of these two factors, plus the scale at which they
are occurring, renders deforestation in Indonesia an issue of global importance. The
forest fires causing the aforementioned THP incidence in 1997 have been estimated to
account for 13–40 percent of global carbon emissions in that year (Page et al., 2002).
In fact, Indonesia is considered the third highest source of carbon emissions by country,
though 80 percent are caused by the land-use change discussed here, and not the energy
and industrial production that are major emissions sources elsewhere.
From a domestic perspective, the Indonesian government has to weigh up many
competing interests within the country. Deforestation represents a short-term
economic opportunity locally, particularly in peat land areas where there is a high
incidence of poverty (Harrison et al., 2009), but it adversely affects national health and
unsustainably degrades Indonesia’s natural resources; 41 percent of Indonesia’s
remaining forest land is considered to be degraded (Verchot et al., 2010). Decision-
making in the interests of long-term sustainability is made more difficult by logging
and palm oil companies, both domestically and foreign owned, that use their influence
over regional economies to extract favourable treatment from politicians.
Within Malaysia, Singapore, and other neighbours affected by THP, costs are
borne from air pollution but benefits also accrue from deforestation, such as a ready
supply of cheap timber to manufacture wood-based furniture. Further afield,
consumers and companies in countries not affected by THP, such as China, suffer in
the long-term if Indonesia’s land-based resources are degraded to the point where they
are no longer available.
The twin issues of deforestation and THP have been, and continue to be, the focus
of potential solutions at a domestic and international level. Numerous legislation and
other regulations have been devised, but largely failed due to the incapacity or
27
unwillingness of local authorities to enforce them (Herawati and Santoso, 2011);
corruption has commonly exacerbated the difficulties of enforcement (Palmer, 2001).
As a response to THP, a regional haze agreement was formulated under the auspices
of ASEAN in 2002. However, the Indonesian parliament has not ratified it, partly as
Indonesia would have to foot the majority of the cost of compliance (Tacconi et al.,
2008), but also because poor air quality in Singapore lies well outside the political
compass of a politician representing a region where there are many pressures for land
clearing.
More recently (2010), the Norwegian and Indonesian governments signed an
agreement whereby the latter would institute a two-year moratorium on the issuance
of new permits to log or set up palm oil plantations in government-managed forest and
peat lands. As part of this agreement, Norway will help build institutional capacity for
improved forest management and, if deforestation rates decrease, Indonesia will
receive up to US$1 billion. In May 2011 a presidential instruction to regional
authorities brought the moratorium into effect. However, it contained numerous
exemptions as a result of lobbying by business entities. For example, projects where
the application was received prior to the presidential instruction can still proceed, as
can those which are up for renewal and also those related to mining (Wells and Paoli,
2011). The Norwegian funding is seen as laying the groundwork for future expansion
of REDD (Reducing Emissions from Deforestation and Forest Degradation) in
Indonesia as part of international climate mitigation policy. If successful, the two-year
freeze in the increasing rate of deforestation will enable data collection and other
activities that aid successful implementation of REDD. Despite the potentially large
sums involved in future REDD-based activities in Indonesia (up to US$5.6 billion
(Clements et al., 2010), they will only be effective if they address the key impediments
to previous attempts at stopping deforestation: local-level incentives and a deficient
institutional capacity for effective monitoring and enforcement.
3.4. Regulation of Air Pollution in India
In the 50 years to the end of the 20th century, the population of Delhi, the national
capital region, increased from less than two million to around 13 million people
(Firdaus and Ahmad, 2011). Rapid population growth, urban sprawl, and rising
28
incomes in one of India’s major economic hubs have come however at a major
environmental cost. By the 1990s, air pollution from a burgeoning vehicular fleet—
registered vehicles doubled to four million between 1991 and 2001 (World Bank,
2005)—and industrial activity suffocated Delhi with the highest level of suspended
particulate matter in Asia (World Bank, 2005). Unsurprisingly, the health impacts were
substantial. Given that up to 25 percent of non-trauma deaths were associated with air
pollution in the earlier 1990s, and the peak impact was on Delhi residents between the
ages of 15 and 44, Cropper et al., (1997) found that there would be major benefits to
stronger air quality regulation.
Intervention by the Indian Supreme Court beginning in 1996 compelled the
government to reform the state government’s existing suite of poorly targeted and even
more poorly enforced air quality regulations.12 As vehicular emissions were the major
cause of air pollution (approximately 60–70 percent during the 1990s (Foster and
Kumar, 2011), they were the primary target of the new regulations, although forced
closure or relocation of polluting industries also occurred. The central component of
the reform was the conversion of all commercial vehicles (including buses, taxis, and
motorised rickshaws or ‘three-wheelers’) to using compressed natural gas, a much
cleaner fuel than diesel or gasoline. Other measures included retirement of old
commercial vehicles, reduction of sulphur content in diesel and gasoline fuels,
emissions standards for private vehicles, and enhancement of the public transport
system.13
Despite the challenges of broad reform involving so many road users, the
programme has been a major success. Statistical analyses of air quality measurement
have indicated that the results of these policies have been highly beneficial,
significantly reducing, or at least arresting, the rapid rise in concentrations of
particulate matter, sulphur dioxide, carbon monoxide, and other pollutants (Firdaus
and Ahmad, 2011; Narain and Krupnik, 2007; World Bank, 2005). Similarly, the
respiratory function of Delhi’s inner city residents has substantially improved,
particularly among low-income households (Foster and Kumar, 2011). As a direct
12 Bell et al. (2004) for a comprehensive exposition of the judiciary’s role in the reform process. 13 Government of NCT of Delhi (2010, Table 2.5) for a timeline of state government air pollution
reduction measures.
29
result of the reforms, it has been estimated that nearly 4,000 deaths each year in Delhi
have since been averted (World Bank, 2005).
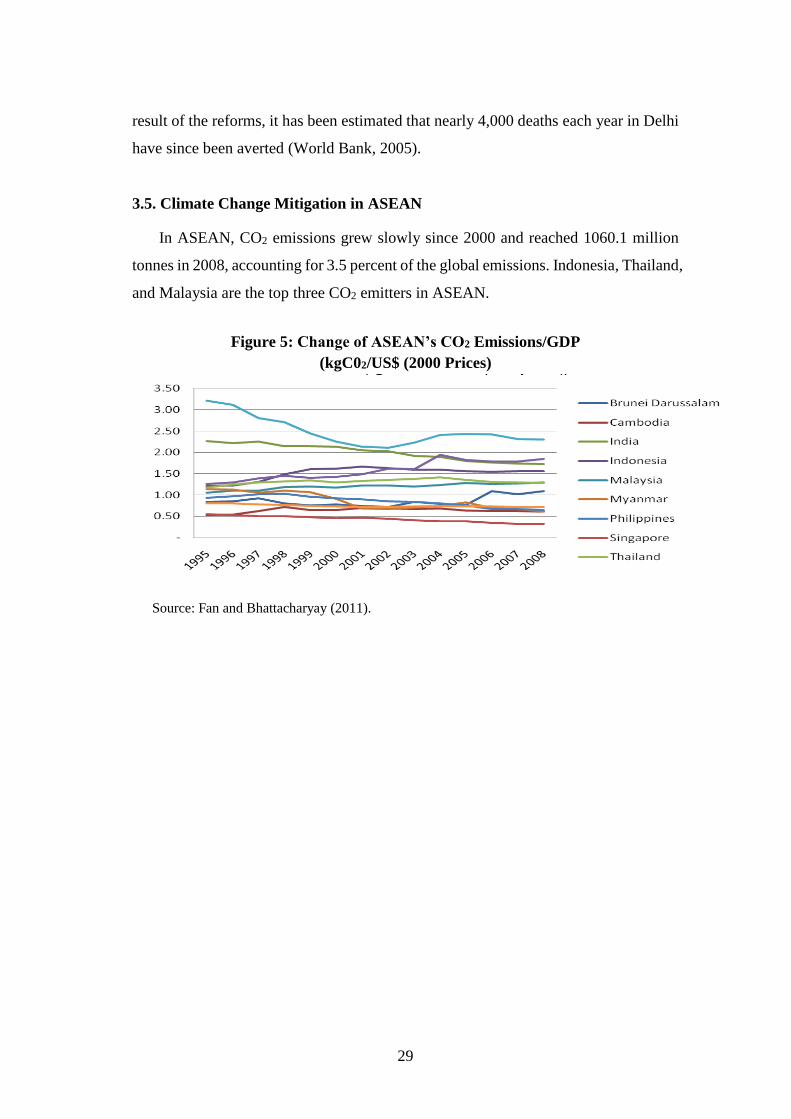
3.5. Climate Change Mitigation in ASEAN
In ASEAN, CO2 emissions grew slowly since 2000 and reached 1060.1 million
tonnes in 2008, accounting for 3.5 percent of the global emissions. Indonesia, Thailand,
and Malaysia are the top three CO2 emitters in ASEAN.
Figure 5: Change of ASEAN’s CO2 Emissions/GDP
(kgC02/US$ (2000 Prices)
Source: Fan and Bhattacharyay (2011).
30
Of course, in per capita or cumulative terms, ASEAN’s emissions still greatly lag
those of the EU and US. However, one can safely say that there can be no satisfactory
global response to climate change without the active participation of ASEAN.
In 2009, Malaysia, Indonesia, and Thailand announced that they would, for the
first time, subject themselves to emissions constraint. Their aim is to reduce CO2
emissions intensity in 2020 by 20–25 percent compared to 2005, with and without
international support. This is an ambitious target which will not be met without
considerable policy effort.
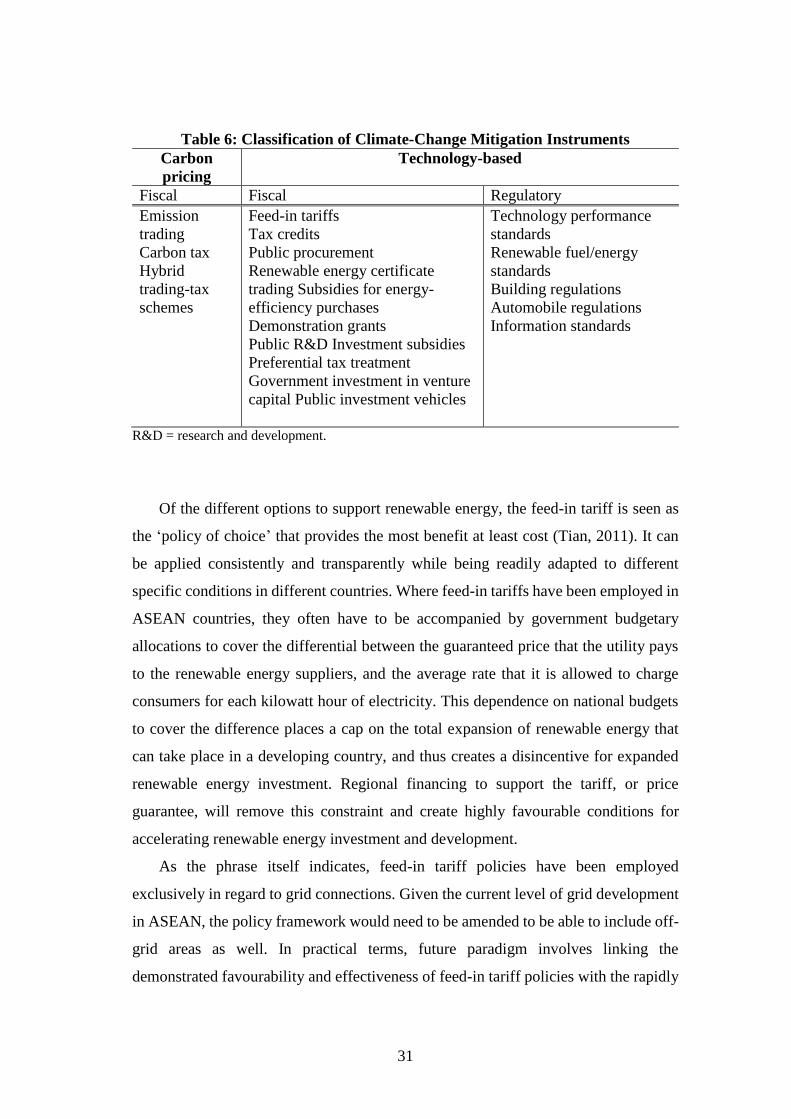
AMS already have a large range of policy instruments in place to achieve their
new emissions target (Table 6). Climate-change mitigation policy instrument can be
divided into market-based instruments such as energy pricing and taxes can be an
efficient means of stimulating resource conservation and controlling emissions as well
as technology-based policies. In the past and at present, countries have used a variety
of mechanisms to promote renewable energy, including direct public investment,
investment incentives (e.g. low interest rates, tax write-offs, accelerated depreciation),
portfolio obligations, and feed-in tariffs. While all policy mechanisms have had their
share of success, the most dramatic expansion in renewable energy capacity was
witnessed under the feed-in tariff programmes. ‘Feed-in tariffs’ obligate electricity
grids to purchase renewable energy as it becomes available (to ‘feed it in’), and offer
potential providers of renewable energy a guaranteed price (the ‘tariff,’ or rate paid for
the electricity). The tariffs are generally fixed for a given period, between 10 and 20
years, at levels that ensure the profitability of the investment. The existence of a
guarantee that successful development of a solar or wind energy installation will be
rewarded with customers as well as a subsidised price essentially levels the playing
field, removing the cost barrier to renewable energy development in comparison to
fossil fuel–based technologies.
31
Table 6: Classification of Climate-Change Mitigation Instruments
Carbon
pricing
Technology-based
Fiscal Fiscal Regulatory
Emission
trading
Carbon tax
Hybrid
trading-tax
schemes
Feed-in tariffs
Tax credits
Public procurement
Renewable energy certificate
trading Subsidies for energy-
efficiency purchases
Demonstration grants
Public R&D Investment subsidies
Preferential tax treatment
Government investment in venture
capital Public investment vehicles
Technology performance
standards
Renewable fuel/energy
standards
Building regulations
Automobile regulations
Information standards
R&D = research and development.
Of the different options to support renewable energy, the feed-in tariff is seen as
the ‘policy of choice’ that provides the most benefit at least cost (Tian, 2011). It can
be applied consistently and transparently while being readily adapted to different
specific conditions in different countries. Where feed-in tariffs have been employed in
ASEAN countries, they often have to be accompanied by government budgetary
allocations to cover the differential between the guaranteed price that the utility pays
to the renewable energy suppliers, and the average rate that it is allowed to charge
consumers for each kilowatt hour of electricity. This dependence on national budgets
to cover the difference places a cap on the total expansion of renewable energy that
can take place in a developing country, and thus creates a disincentive for expanded
renewable energy investment. Regional financing to support the tariff, or price
guarantee, will remove this constraint and create highly favourable conditions for
accelerating renewable energy investment and development.
As the phrase itself indicates, feed-in tariff policies have been employed
exclusively in regard to grid connections. Given the current level of grid development
in ASEAN, the policy framework would need to be amended to be able to include off-
grid areas as well. In practical terms, future paradigm involves linking the
demonstrated favourability and effectiveness of feed-in tariff policies with the rapidly
32
growing energy needs of ASEAN countries, offering suitable mechanisms for finance,
policy, and technical support for rapid scale up. It delivers the right mix of policy and
market stability that, according to recent research summarised by Kim et al. (2011),
can create the highest possible leverage for public financing, mobilising up to 15 times
the original investment in additional, follow-on funding (Hongo, 2012).
A new regional investment fund needs to be established to contribute the global
share of the subsidy for renewable energy services and supplement the national
guarantees offered by each country. As such, the fund will reduce uncertainty and
ensure predictability in the renewable energy industry. Once it is in place and
adequately resourced, it would help stimulate a rapid and massive expansion in the
market for solar, wind, and other renewable technologies— and speed them toward an
economic tipping point, after which they would be on track to become the dominant
energy option on the planet. The price support mechanisms need to be structured in
such a way as to reward the most efficient renewable energy suppliers and to give them
an incentive to reduce costs as rapidly as possible. The concept of a declining tariff
schedule seeks to ensure this by stipulating that price supports decline and disappear
within a defined period of time. Producers would race to enter the market ahead of the
declining subsidy and establish their competitive position in the marketplace. Where
appropriate, countries could choose additional policies (such as renewable portfolio
standards and innovative financing of upfront costs) that would encourage utilities and
local governments to be more proactive in cooperating with renewable energy
suppliers. If implemented, the economics and the technologies of the world energy
sector could be transformed by 2030. With renewable energy costs becoming
competitive with fossil fuels, subsidies could soon be discontinued. The majority of
ASEAN’s poor would have access to energy from affordable, renewable sources—the
new default option.
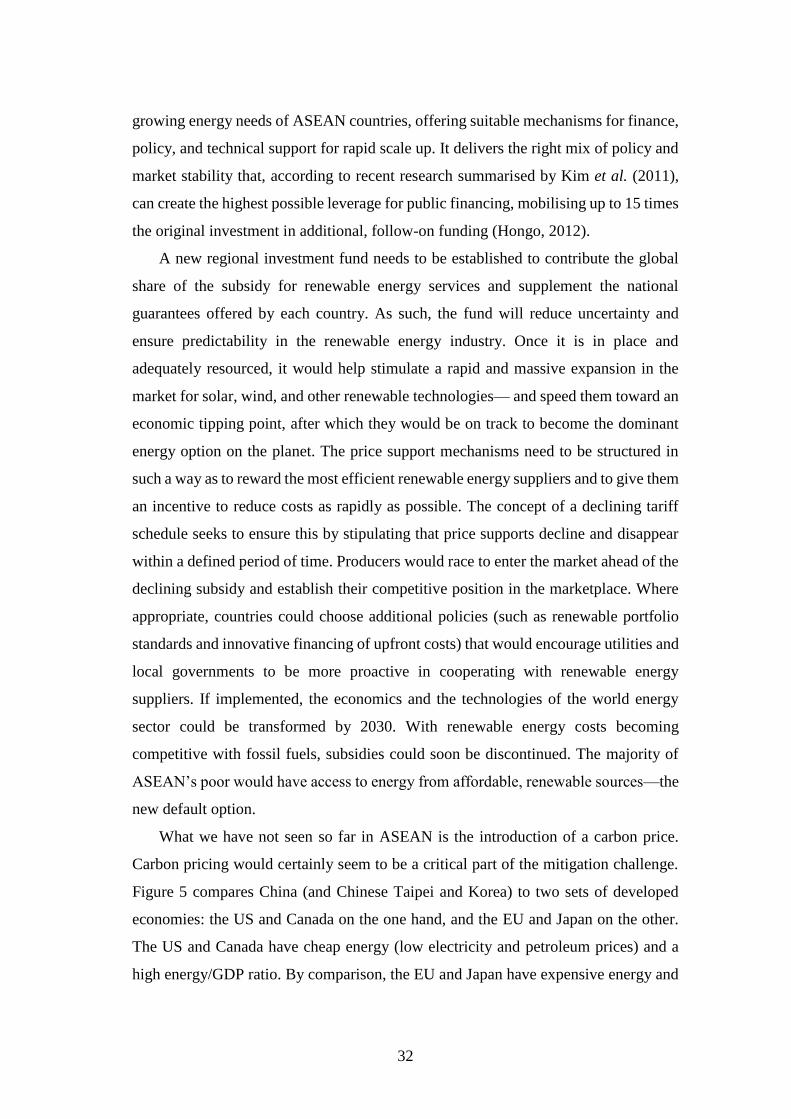
What we have not seen so far in ASEAN is the introduction of a carbon price.
Carbon pricing would certainly seem to be a critical part of the mitigation challenge.
Figure 5 compares China (and Chinese Taipei and Korea) to two sets of developed
economies: the US and Canada on the one hand, and the EU and Japan on the other.
The US and Canada have cheap energy (low electricity and petroleum prices) and a
high energy/GDP ratio. By comparison, the EU and Japan have expensive energy and
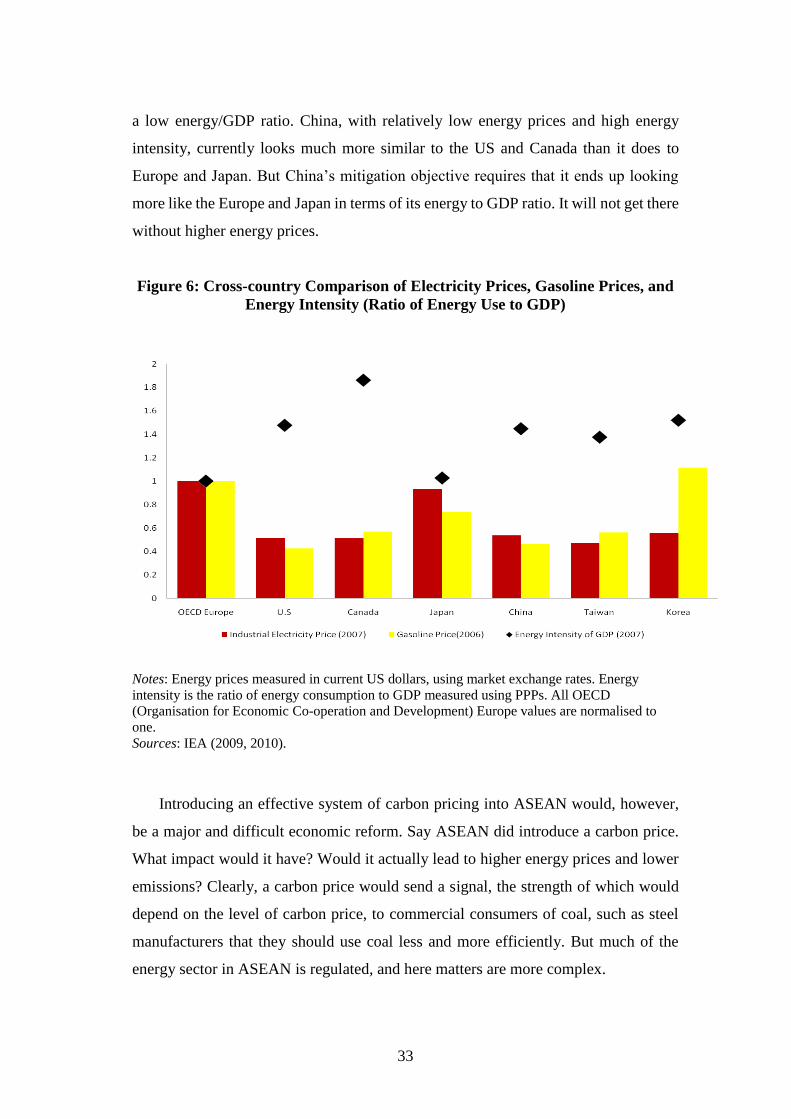
33
a low energy/GDP ratio. China, with relatively low energy prices and high energy
intensity, currently looks much more similar to the US and Canada than it does to
Europe and Japan. But China’s mitigation objective requires that it ends up looking
more like the Europe and Japan in terms of its energy to GDP ratio. It will not get there
without higher energy prices.
Figure 6: Cross-country Comparison of Electricity Prices, Gasoline Prices, and
Energy Intensity (Ratio of Energy Use to GDP)
Notes: Energy prices measured in current US dollars, using market exchange rates. Energy
intensity is the ratio of energy consumption to GDP measured using PPPs. All OECD
(Organisation for Economic Co-operation and Development) Europe values are normalised to
one.
Sources: IEA (2009, 2010).
Introducing an effective system of carbon pricing into ASEAN would, however,
be a major and difficult economic reform. Say ASEAN did introduce a carbon price.
What impact would it have? Would it actually lead to higher energy prices and lower
emissions? Clearly, a carbon price would send a signal, the strength of which would
depend on the level of carbon price, to commercial consumers of coal, such as steel
manufacturers that they should use coal less and more efficiently. But much of the
energy sector in ASEAN is regulated, and here matters are more complex.
34
One key problem is that cost pass-through mechanisms in the electricity and
petroleum fuel sectors need further strengthening. Coal is the dominant fuel for
electricity in AMS like Indonesia, Malaysia, and Viet Nam. In recent years, the price
of coal in Indonesia has risen sharply. Through a series of electricity tariff increases,
Indonesia greatly reduced electricity subsidies over the past years. However, Indonesia
has found it difficult to pass on the increase in coal costs it has recently experienced.
A good illustration that effective carbon pricing requires pricing reform comes
from attempts already made to try to influence the fuel mix, or dispatch order, in the
electricity sector. Under the Energy Saving and Emissions Reduction in Power
Generation or ESERD that China introduced in five pilot provinces, provinces have
been instructed to dispatch generators, not on an across-the-board basis as in the past,
but rather according to a mix of economic and environmental criteria. To simplify, the
dispatch order is: renewable, nuclear, gas, and then coal, with coal plants ordered by
their thermal efficiency, from highest to lowest. Note that this is roughly the order that
one would expect with a high-enough carbon price, and, indeed, simulations show
implementing ESERD would cut emissions by 10 percent. However, the pilot
provinces have only been able to partially implement this reform, because of the
negative financial implications full implementation would have for less-efficient coal-
fired units. These units are still valuable as reserve capacity, but, under the Chinese
on-grid tariff system, plants only receive a payment if they are dispatched, and so have
no incentive to provide stand-by capacity. Instead, if not regularly dispatched, they
would simply shut down, thereby depriving the system of valuable spare capacity, in
case of an emergency or a spike in demand. Or, put differently, the policy-induced lack
of flexibility in dispatch has undermined the impact of the introduction of a carbon
price (or, in this case, a carbon price equivalent).
Carrying out the reforms needed in the power sector in ASEAN to make carbon
pricing effective will not be easy. Power sector reforms in developing economies are
generally difficult. While there are some success stories, a World Bank (Besant-Jones,
2006) review of power sector reforms concludes that overall ‘political forces are
difficult to align for reform’ (Besant-Jones, 2006), that interest groups ‘constitute a
major impediment to reform’ (Besant-Jones, 2006), and that ‘successful reform
requires sustained political commitment’ (Besant-Jones, 2006). Not surprisingly,
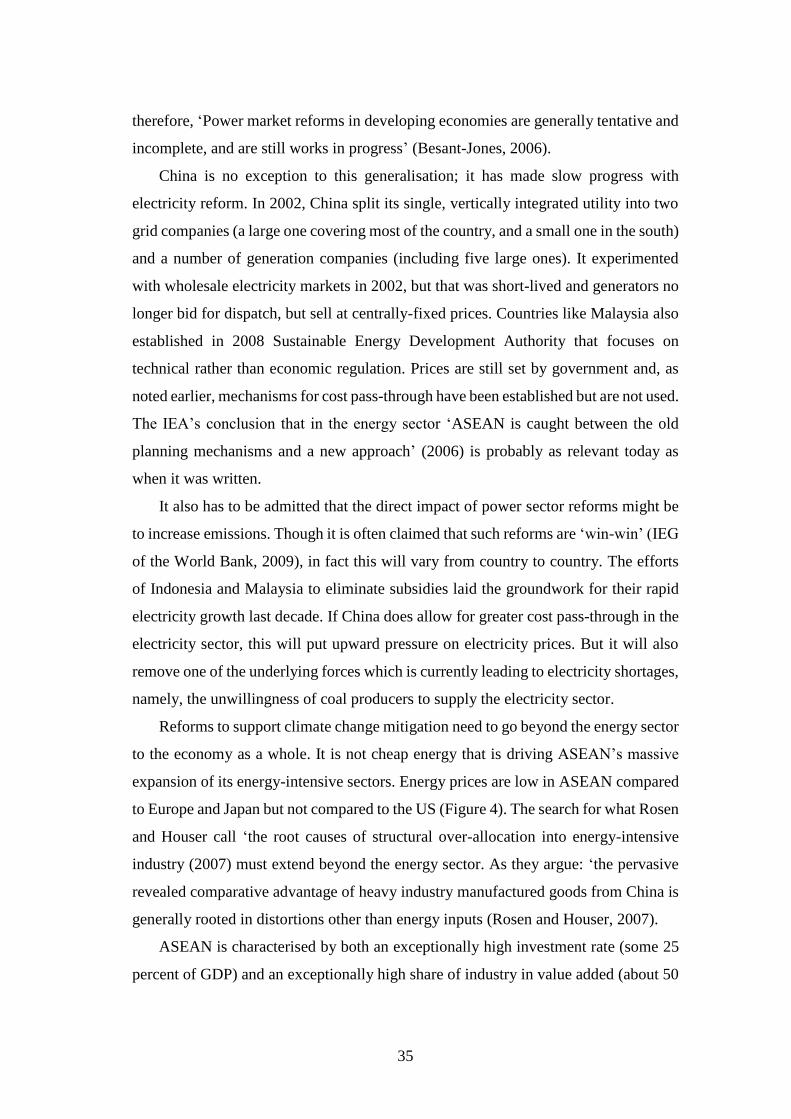
35
therefore, ‘Power market reforms in developing economies are generally tentative and
incomplete, and are still works in progress’ (Besant-Jones, 2006).
China is no exception to this generalisation; it has made slow progress with
electricity reform. In 2002, China split its single, vertically integrated utility into two
grid companies (a large one covering most of the country, and a small one in the south)
and a number of generation companies (including five large ones). It experimented
with wholesale electricity markets in 2002, but that was short-lived and generators no
longer bid for dispatch, but sell at centrally-fixed prices. Countries like Malaysia also
established in 2008 Sustainable Energy Development Authority that focuses on
technical rather than economic regulation. Prices are still set by government and, as
noted earlier, mechanisms for cost pass-through have been established but are not used.
The IEA’s conclusion that in the energy sector ‘ASEAN is caught between the old
planning mechanisms and a new approach’ (2006) is probably as relevant today as
when it was written.
It also has to be admitted that the direct impact of power sector reforms might be
to increase emissions. Though it is often claimed that such reforms are ‘win-win’ (IEG
of the World Bank, 2009), in fact this will vary from country to country. The efforts
of Indonesia and Malaysia to eliminate subsidies laid the groundwork for their rapid
electricity growth last decade. If China does allow for greater cost pass-through in the
electricity sector, this will put upward pressure on electricity prices. But it will also
remove one of the underlying forces which is currently leading to electricity shortages,
namely, the unwillingness of coal producers to supply the electricity sector.
Reforms to support climate change mitigation need to go beyond the energy sector
to the economy as a whole. It is not cheap energy that is driving ASEAN’s massive
expansion of its energy-intensive sectors. Energy prices are low in ASEAN compared
to Europe and Japan but not compared to the US (Figure 4). The search for what Rosen
and Houser call ‘the root causes of structural over-allocation into energy-intensive
industry (2007) must extend beyond the energy sector. As they argue: ‘the pervasive
revealed comparative advantage of heavy industry manufactured goods from China is
generally rooted in distortions other than energy inputs (Rosen and Houser, 2007).
ASEAN is characterised by both an exceptionally high investment rate (some 25
percent of GDP) and an exceptionally high share of industry in value added (about 50
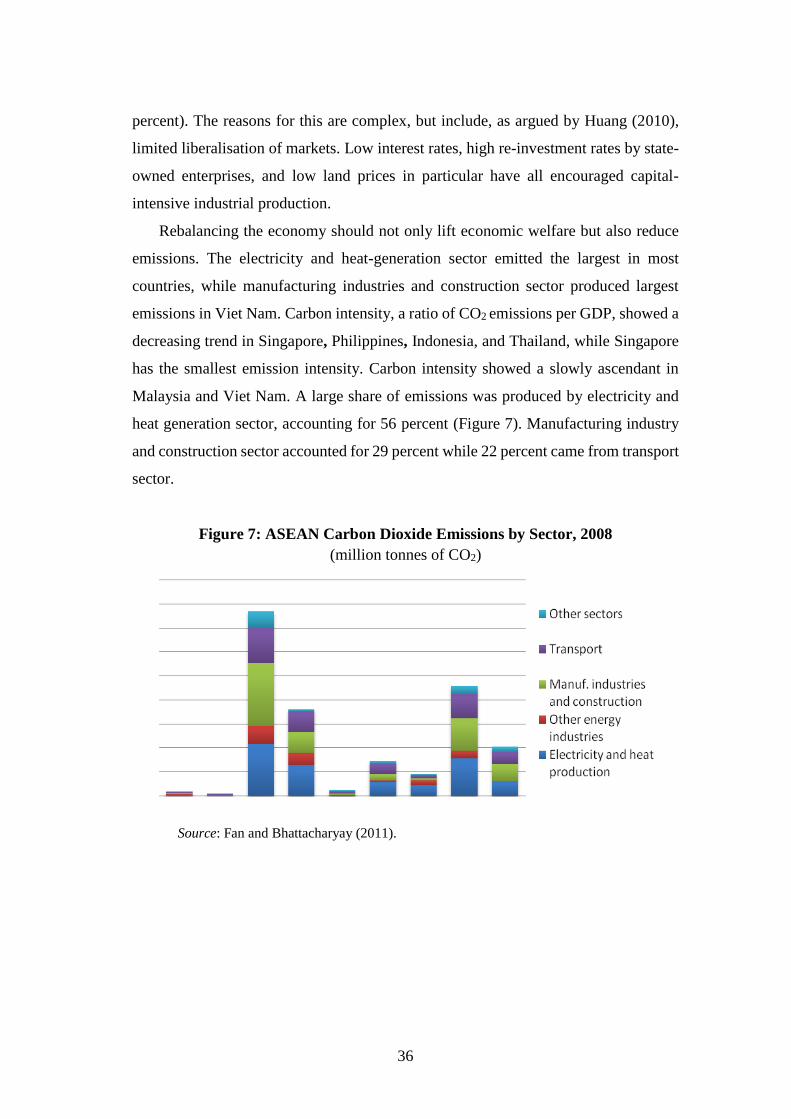
36
percent). The reasons for this are complex, but include, as argued by Huang (2010),
limited liberalisation of markets. Low interest rates, high re-investment rates by state-
owned enterprises, and low land prices in particular have all encouraged capital-
intensive industrial production.
Rebalancing the economy should not only lift economic welfare but also reduce
emissions. The electricity and heat-generation sector emitted the largest in most
countries, while manufacturing industries and construction sector produced largest
emissions in Viet Nam. Carbon intensity, a ratio of CO2 emissions per GDP, showed a
decreasing trend in Singapore, Philippines, Indonesia, and Thailand, while Singapore
has the smallest emission intensity. Carbon intensity showed a slowly ascendant in
Malaysia and Viet Nam. A large share of emissions was produced by electricity and
heat generation sector, accounting for 56 percent (Figure 7). Manufacturing industry
and construction sector accounted for 29 percent while 22 percent came from transport
sector.
Figure 7: ASEAN Carbon Dioxide Emissions by Sector, 2008
(million tonnes of CO2)
Source: Fan and Bhattacharyay (2011).
37
Rebalancing implies, among other things, faster growth in services than industry.
A 10 percentage point switch in GDP composition away from industry towards
services (the tertiary sector) would, everything else being equal, result in a 14 percent
reduction in energy intensity.
Slower economic growth would also help reduce the growth in ASEAN’s
emissions. ASEAN’s average economic growth between 2001 and 2010 was 5.6
percent. This is a remarkable result considering that the period encompasses the global
financial crisis. It seems heretical to suggest that ASEAN would do better by growing
more green way, but it is possible such growth would actually improve welfare. For
example, a switch in government spending from fossil fuel subsidies to incentives for
renewable and green infrastructure could generate green growth but still be welfare-
enhancing as well as emissions-reducing. Whether ASEAN will be able to, green
growth remains to be seen.
As with energy reform, rebalancing will not be undertaken to reduce emissions.
Its primary motivation will be economic. But emissions reductions efforts will be more
successful if rebalancing occurs.
Of course, the measures already in place, such as support for research and
development, and other regulatory and technology-specific-promotion measures, are
also important. But these are already at the heart of ASEAN’s mitigation efforts. What
is now needed is a broader response to the mitigation challenge, one which embraces
pricing reform, energy sector reform, and structural economy-wide reforms. Neither
the importance nor the difficulty of the path ahead should be underestimated.
4. ASEAN’s Wicked Environmental Problems
Initially conceived in the context of social planning in the United States (Rittel
and Webber, 1973), the concept of ‘wicked problems’ has since been applied to a
diverse range of fields, including health sciences (Kreuter et al., 2004), business
strategy (Camillus, 2008), art design (Buchanan, 1992), and forestry management
(Allen and Gould, 1986). The term ‘wicked’ is not used in this instance to reflect
awfulness and immensity of consequences. Rather, wicked problems are complex,
multidimensional, hard to solve, and often harder to define.
38
Rittel and Webber (1973) contrasted these difficult challenges to ‘tame problems’,
for which the task is more straightforward, even though the impacts may be
considerable. Initial contrasts involved (wicked) problems like building a freeway or
setting a tax rate with (tame) problems such as solving a mathematical equation or
identifying a chemical compound. The latter type have definable right and wrong
answers, with clear criteria for distinguishing between them, both of which the former
lack. In particular, different stakeholders will hold wildly different and often
irreconcilable views on the best highway routes or tax rate.
From an environmental perspective, consider the contrast between international
action to prevent ozone depletion and climate change. In the former case, the primary
cause is the emission of chlorofluorocarbon gases from refrigeration. This can be
reduced at low cost, and through the engagement of a small number of players, namely
the producers and users of refrigerants. The definite source, low mitigation cost, and
small number of stakeholders involved facilitated the implementation of a successful
solution, the Montreal Protocol.
On the other hand, greenhouse gas emissions arise from a wide variety of sources,
such as electricity generation, transport, manufacturing, and, in fact, the fundamental
processes of industrialised society. Traditional sectors are also involved, namely
agriculture and forestry. Therefore, devising a solution is a much more complex task
involving a much larger number of inter-connected issues, much larger costs, and
greater uncertainties. Not surprisingly, the world has made much less progress in
responding to climate change than ozone depletion.
There are various characterisations of a wicked problem. By way of introduction
to the approach in the present study, Table 7 summarises the characteristics of wicked
problems in contrast to tame problems. We illustrate them in the following sub-
sections using three overlapping themes: problem formulation, interdependency, and
solution set. The applicability of this framework to ASEAN’s environmental concerns
is demonstrated by its description in terms of examples from the case studies, whilst
also referring to the four broad environmental challenges.
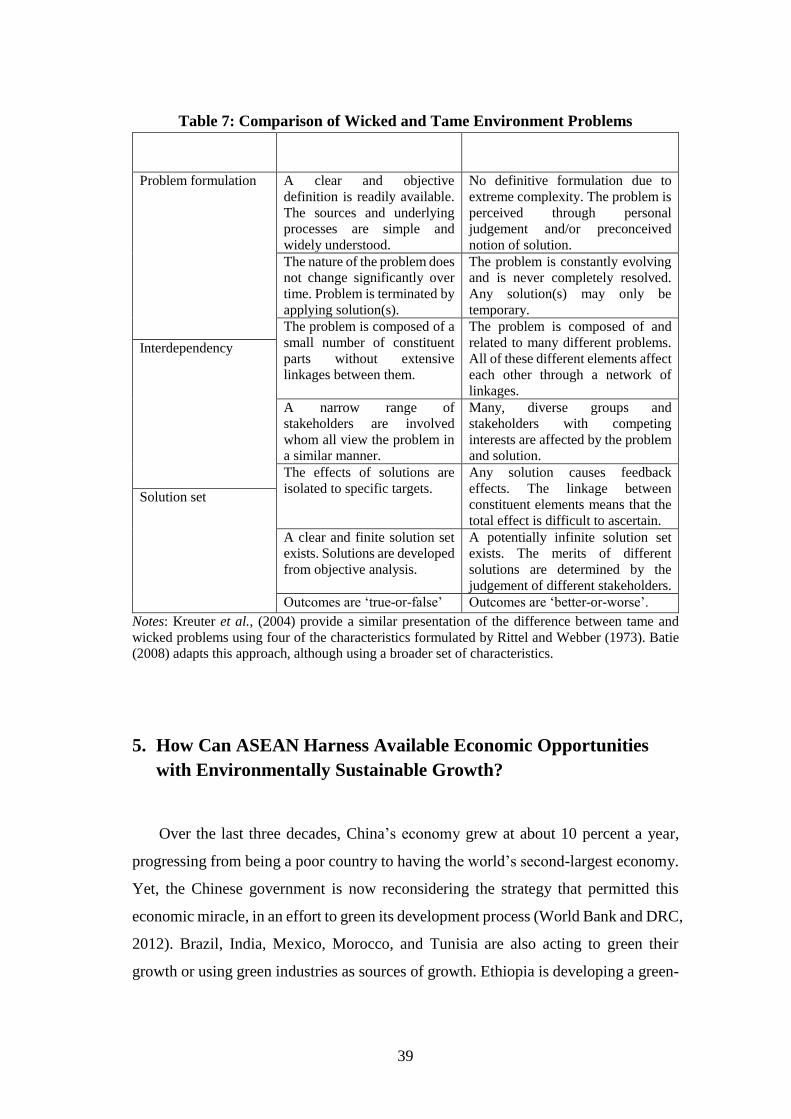
39
Table 7: Comparison of Wicked and Tame Environment Problems
Characteristic Tame Problem Wicked Problem
Problem formulation A clear and objective
definition is readily available.
The sources and underlying
processes are simple and
widely understood.
No definitive formulation due to
extreme complexity. The problem is
perceived through personal
judgement and/or preconceived
notion of solution.
The nature of the problem does
not change significantly over
time. Problem is terminated by
applying solution(s).
The problem is constantly evolving
and is never completely resolved.
Any solution(s) may only be
temporary.
The problem is composed of a
small number of constituent
parts without extensive
linkages between them.
The problem is composed of and
related to many different problems.
All of these different elements affect
each other through a network of
linkages.
Interdependency
A narrow range of
stakeholders are involved
whom all view the problem in
a similar manner.
Many, diverse groups and
stakeholders with competing
interests are affected by the problem
and solution.
The effects of solutions are
isolated to specific targets.
Any solution causes feedback
effects. The linkage between
constituent elements means that the
total effect is difficult to ascertain.
Solution set
A clear and finite solution set
exists. Solutions are developed
from objective analysis.
A potentially infinite solution set
exists. The merits of different
solutions are determined by the
judgement of different stakeholders.
Outcomes are ‘true-or-false’ Outcomes are ‘better-or-worse’.
Notes: Kreuter et al., (2004) provide a similar presentation of the difference between tame and
wicked problems using four of the characteristics formulated by Rittel and Webber (1973). Batie
(2008) adapts this approach, although using a broader set of characteristics.
5. How Can ASEAN Harness Available Economic Opportunities
with Environmentally Sustainable Growth?
Over the last three decades, China’s economy grew at about 10 percent a year,
progressing from being a poor country to having the world’s second-largest economy.
Yet, the Chinese government is now reconsidering the strategy that permitted this
economic miracle, in an effort to green its development process (World Bank and DRC,
2012). Brazil, India, Mexico, Morocco, and Tunisia are also acting to green their
growth or using green industries as sources of growth. Ethiopia is developing a green-
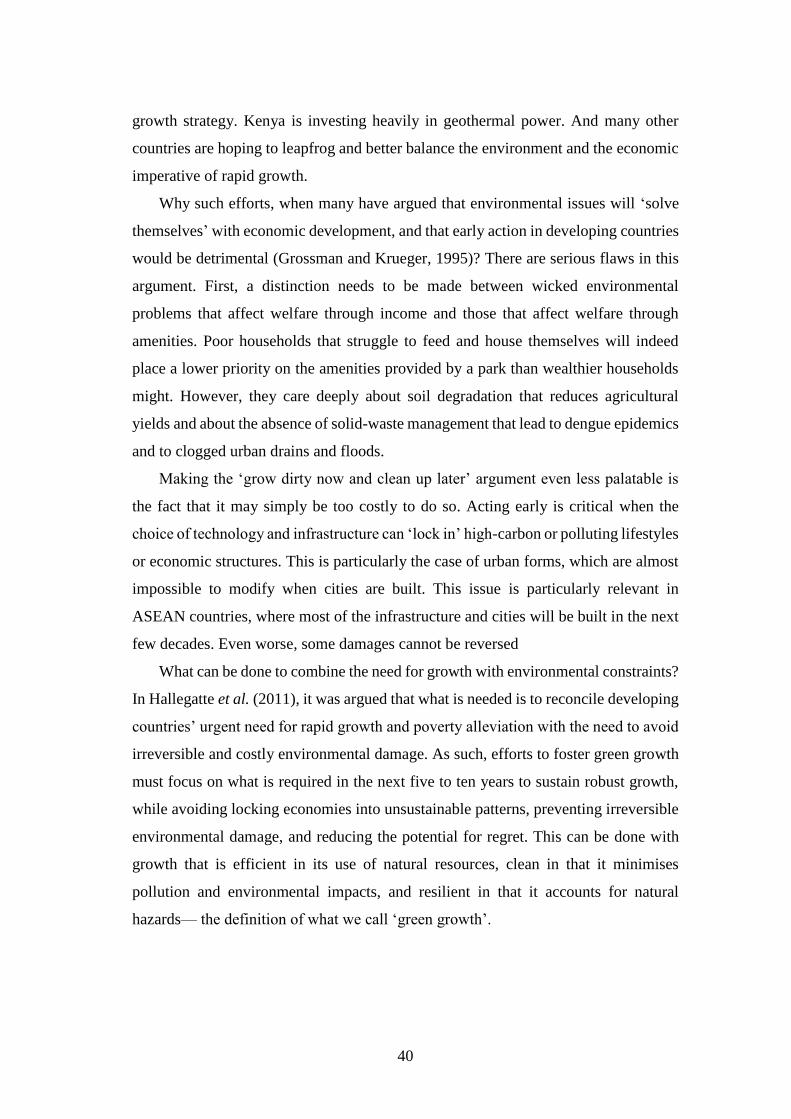
40
growth strategy. Kenya is investing heavily in geothermal power. And many other
countries are hoping to leapfrog and better balance the environment and the economic
imperative of rapid growth.
Why such efforts, when many have argued that environmental issues will ‘solve
themselves’ with economic development, and that early action in developing countries
would be detrimental (Grossman and Krueger, 1995)? There are serious flaws in this
argument. First, a distinction needs to be made between wicked environmental
problems that affect welfare through income and those that affect welfare through
amenities. Poor households that struggle to feed and house themselves will indeed
place a lower priority on the amenities provided by a park than wealthier households
might. However, they care deeply about soil degradation that reduces agricultural
yields and about the absence of solid-waste management that lead to dengue epidemics
and to clogged urban drains and floods.
Making the ‘grow dirty now and clean up later’ argument even less palatable is
the fact that it may simply be too costly to do so. Acting early is critical when the
choice of technology and infrastructure can ‘lock in’ high-carbon or polluting lifestyles
or economic structures. This is particularly the case of urban forms, which are almost
impossible to modify when cities are built. This issue is particularly relevant in
ASEAN countries, where most of the infrastructure and cities will be built in the next
few decades. Even worse, some damages cannot be reversed
What can be done to combine the need for growth with environmental constraints?
In Hallegatte et al. (2011), it was argued that what is needed is to reconcile developing
countries’ urgent need for rapid growth and poverty alleviation with the need to avoid
irreversible and costly environmental damage. As such, efforts to foster green growth
must focus on what is required in the next five to ten years to sustain robust growth,
while avoiding locking economies into unsustainable patterns, preventing irreversible
environmental damage, and reducing the potential for regret. This can be done with
growth that is efficient in its use of natural resources, clean in that it minimises
pollution and environmental impacts, and resilient in that it accounts for natural
hazards— the definition of what we call ‘green growth’.
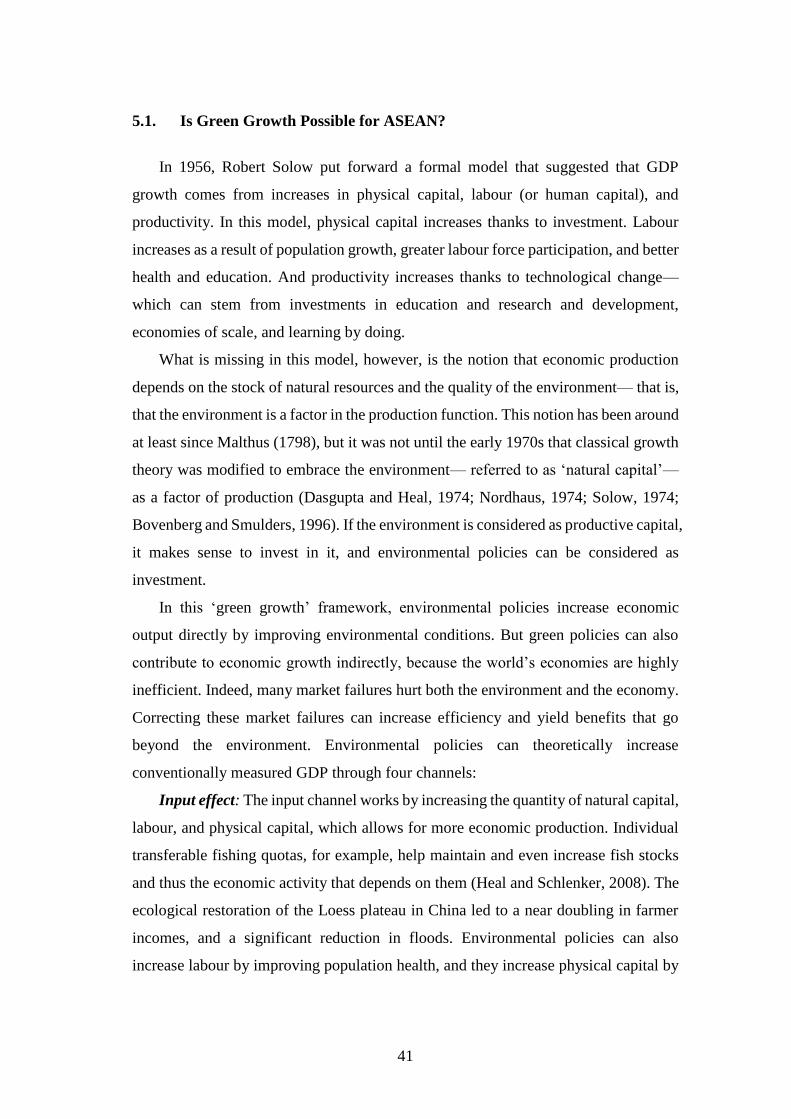
41
5.1. Is Green Growth Possible for ASEAN?
In 1956, Robert Solow put forward a formal model that suggested that GDP
growth comes from increases in physical capital, labour (or human capital), and
productivity. In this model, physical capital increases thanks to investment. Labour
increases as a result of population growth, greater labour force participation, and better
health and education. And productivity increases thanks to technological change—
which can stem from investments in education and research and development,
economies of scale, and learning by doing.
What is missing in this model, however, is the notion that economic production
depends on the stock of natural resources and the quality of the environment— that is,
that the environment is a factor in the production function. This notion has been around
at least since Malthus (1798), but it was not until the early 1970s that classical growth
theory was modified to embrace the environment— referred to as ‘natural capital’—
as a factor of production (Dasgupta and Heal, 1974; Nordhaus, 1974; Solow, 1974;
Bovenberg and Smulders, 1996). If the environment is considered as productive capital,
it makes sense to invest in it, and environmental policies can be considered as
investment.
In this ‘green growth’ framework, environmental policies increase economic
output directly by improving environmental conditions. But green policies can also
contribute to economic growth indirectly, because the world’s economies are highly
inefficient. Indeed, many market failures hurt both the environment and the economy.
Correcting these market failures can increase efficiency and yield benefits that go
beyond the environment. Environmental policies can theoretically increase
conventionally measured GDP through four channels:
Input effect: The input channel works by increasing the quantity of natural capital,
labour, and physical capital, which allows for more economic production. Individual
transferable fishing quotas, for example, help maintain and even increase fish stocks
and thus the economic activity that depends on them (Heal and Schlenker, 2008). The
ecological restoration of the Loess plateau in China led to a near doubling in farmer
incomes, and a significant reduction in floods. Environmental policies can also
increase labour by improving population health, and they increase physical capital by
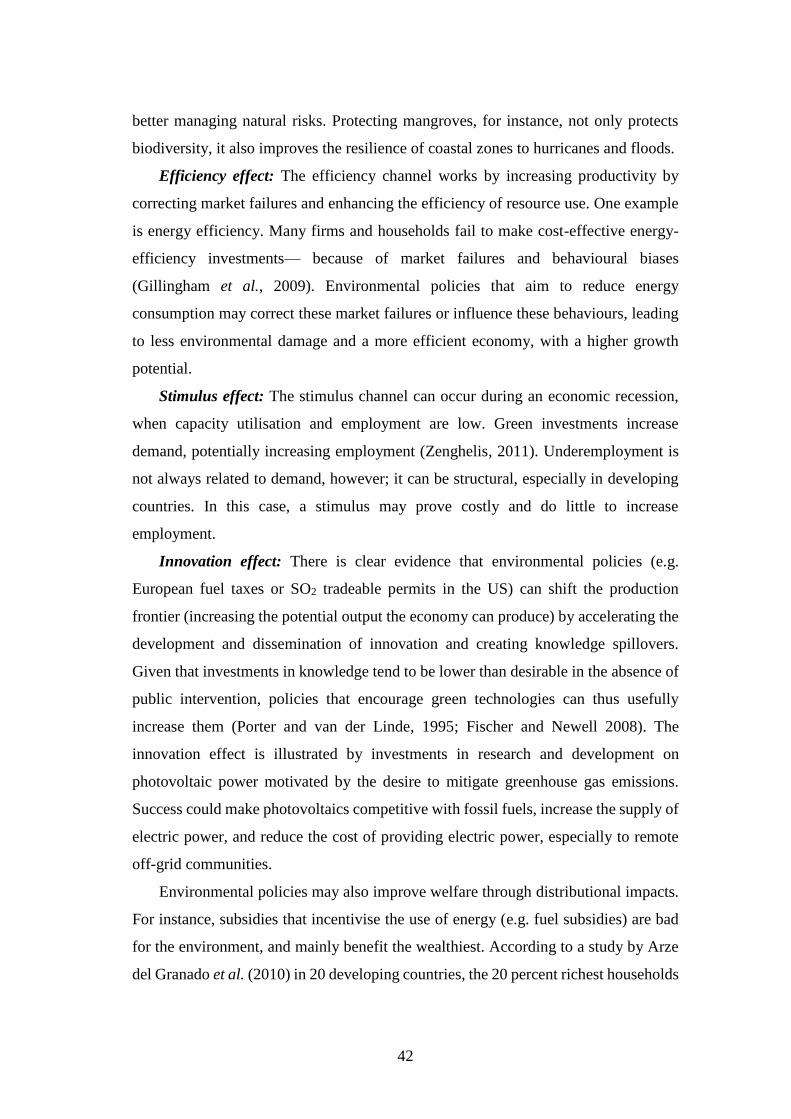
42
better managing natural risks. Protecting mangroves, for instance, not only protects
biodiversity, it also improves the resilience of coastal zones to hurricanes and floods.
Efficiency effect: The efficiency channel works by increasing productivity by
correcting market failures and enhancing the efficiency of resource use. One example
is energy efficiency. Many firms and households fail to make cost-effective energy-
efficiency investments— because of market failures and behavioural biases
(Gillingham et al., 2009). Environmental policies that aim to reduce energy
consumption may correct these market failures or influence these behaviours, leading
to less environmental damage and a more efficient economy, with a higher growth
potential.
Stimulus effect: The stimulus channel can occur during an economic recession,
when capacity utilisation and employment are low. Green investments increase
demand, potentially increasing employment (Zenghelis, 2011). Underemployment is
not always related to demand, however; it can be structural, especially in developing
countries. In this case, a stimulus may prove costly and do little to increase
employment.
Innovation effect: There is clear evidence that environmental policies (e.g.
European fuel taxes or SO2 tradeable permits in the US) can shift the production
frontier (increasing the potential output the economy can produce) by accelerating the
development and dissemination of innovation and creating knowledge spillovers.
Given that investments in knowledge tend to be lower than desirable in the absence of
public intervention, policies that encourage green technologies can thus usefully
increase them (Porter and van der Linde, 1995; Fischer and Newell 2008). The
innovation effect is illustrated by investments in research and development on
photovoltaic power motivated by the desire to mitigate greenhouse gas emissions.
Success could make photovoltaics competitive with fossil fuels, increase the supply of
electric power, and reduce the cost of providing electric power, especially to remote
off-grid communities.
Environmental policies may also improve welfare through distributional impacts.
For instance, subsidies that incentivise the use of energy (e.g. fuel subsidies) are bad
for the environment, and mainly benefit the wealthiest. According to a study by Arze
del Granado et al. (2010) in 20 developing countries, the 20 percent richest households
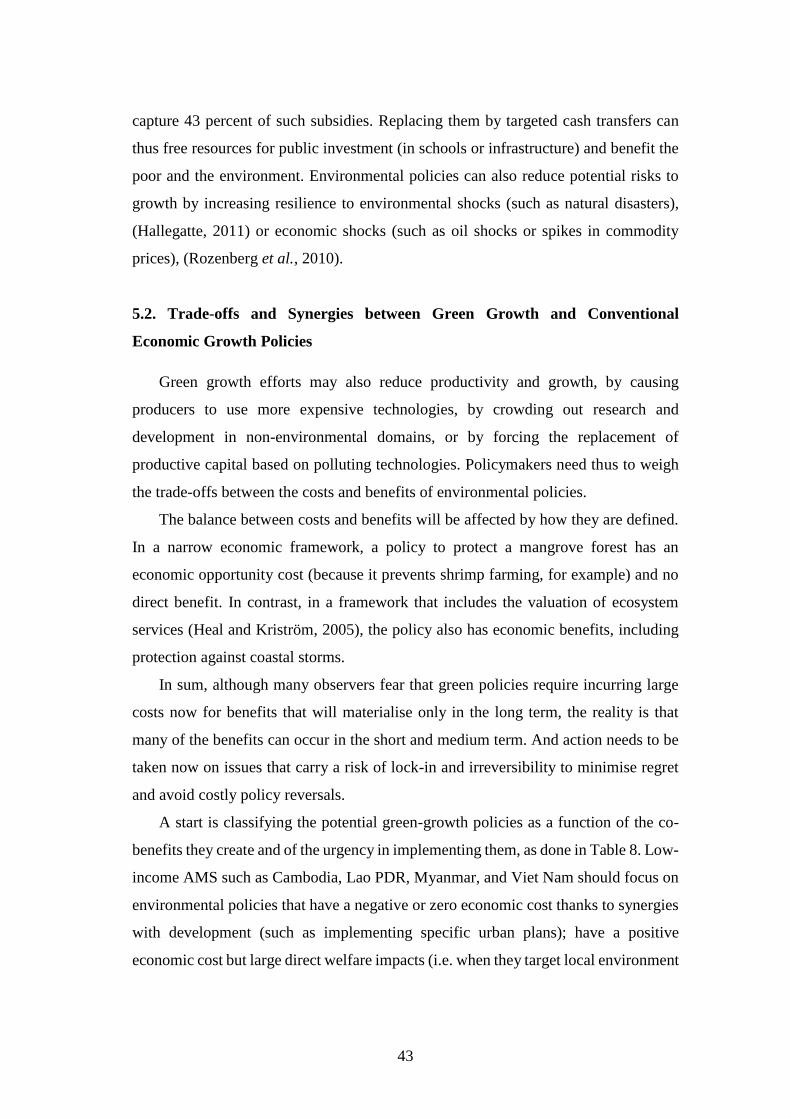
43
capture 43 percent of such subsidies. Replacing them by targeted cash transfers can
thus free resources for public investment (in schools or infrastructure) and benefit the
poor and the environment. Environmental policies can also reduce potential risks to
growth by increasing resilience to environmental shocks (such as natural disasters),
(Hallegatte, 2011) or economic shocks (such as oil shocks or spikes in commodity
prices), (Rozenberg et al., 2010).
5.2. Trade-offs and Synergies between Green Growth and Conventional
Economic Growth Policies
Green growth efforts may also reduce productivity and growth, by causing
producers to use more expensive technologies, by crowding out research and
development in non-environmental domains, or by forcing the replacement of
productive capital based on polluting technologies. Policymakers need thus to weigh
the trade-offs between the costs and benefits of environmental policies.
The balance between costs and benefits will be affected by how they are defined.
In a narrow economic framework, a policy to protect a mangrove forest has an
economic opportunity cost (because it prevents shrimp farming, for example) and no
direct benefit. In contrast, in a framework that includes the valuation of ecosystem
services (Heal and Kriström, 2005), the policy also has economic benefits, including
protection against coastal storms.
In sum, although many observers fear that green policies require incurring large
costs now for benefits that will materialise only in the long term, the reality is that
many of the benefits can occur in the short and medium term. And action needs to be
taken now on issues that carry a risk of lock-in and irreversibility to minimise regret
and avoid costly policy reversals.
A start is classifying the potential green-growth policies as a function of the co-
benefits they create and of the urgency in implementing them, as done in Table 8. Low-
income AMS such as Cambodia, Lao PDR, Myanmar, and Viet Nam should focus on
environmental policies that have a negative or zero economic cost thanks to synergies
with development (such as implementing specific urban plans); have a positive
economic cost but large direct welfare impacts (i.e. when they target local environment
44
goods such as local air pollution or natural risks); and whose cost can be offset with
external resources (such as carbon trading).
Table 8: Prioritising Green-Growth Strategies for ASEAN
Note: The examples provided in this table are illustrative, and the extent of trade-offs, synergies,
and inertia is highly context dependent at individual country level.
Source: Authors.
6. Managing Wicked Environment Problems through Green Growth
in ASEAN
The present analysis of interrelated characteristics of environmental problems and
green growth in ASEAN indicates that they are going to be very difficult to manage.
But that does not mean that these issues will not be or that they cannot be addressed.
Environmental resources are a critical component of human welfare and economic
activity, and, consequently, their degradation will compel responses at some stage. The
key question is not whether these responses occur in ASEAN, but how? Pre-emptive
45
measures avoid the far greater economic burden associated with reactive or emergency
responses, such as migration from areas of extreme water scarcity or government
imports of food due to failed harvests. Prior mitigation necessarily avoids some of the
costs from adaptation and damages. Therefore, the degree to which these problems act
as a brake on regional economic integration will depend largely upon the pre-emptive
steps taken towards controlling them.
A major corollary of the discussion in the previous section is that wicked problems
defy simplistic, pre-packaged solutions. A more modest and useful goal is to suggest
a set of more general policy objectives that will serve as a platform from which to
address all these problems, at both the regional and local level. We offer below seven
areas of strategic focus whose engagement will facilitate management of ASEAN
environmental problems beyond 2015.
6.1. Co-benefits and Issue Linkage
One of the principal characteristics of wicked problems is that they are composed
of and related to many problems. This presents complexity but also opportunity. The
links between AMS’s environmental problems, as well as to development and other
issues, allow a single measure to address more than one negative outcome, or achieve
co-benefits. Such a situation has many advantages. The value for money in terms of
welfare and economic benefits from finance dedicated to attempted solutions is likely
to be higher. ‘No-regrets’ policies may be available; even if one goal is not achieved
satisfactorily by a multi-objective solution, another is likely to be. Finance and
resources available for one issue can be used to address another where the wherewithal
is less prevalent. Regional policymakers should divert some resources towards
identifying where these opportunities may exist and how they can be best exploited.
Opportunities to realise these co-benefits are most conspicuous where climate
change is involved. For example, future REDD arrangements may enable the
Singapore and Malaysia governments to prevent the health impacts of THP in their
countries. Similarly, the distribution of improved cook stoves in the interest of climate
change mitigation also addresses the health impacts of indoor air pollution on low-
income communities. Energy sector reform and a shift to renewable technology can
be pursued in the joint interest of energy security, sustainable economic growth, and
46
climate change mitigation. Indeed, the development co-benefits of climate change
mitigation have been a principal focus for climate policy in Asia and developing
countries more generally. Beyond 2015, the international architecture is likely to
present many more opportunities similar to the Clean Development Mechanism and
REDD. These should be embraced by the governments of Asia’s emerging economies,
even where there are up-front costs, such as imposition of outside oversight or
structural reform.
Away from climate change, a fundamental issue for AMS policymakers beyond
2015 is that environmental problems are also problems of development and economic
growth. Environmental sustainability is not an end in itself, but a key determinant of
future prosperity. Certainly, some trade-offs will still occur in the short-term, but not
later or even in the proximate future. ASEAN’s shift towards greater environmental
protection reflects the economic downside of the ‘development first-environment later’
mindset, even over just a decade or so of major expansion. Other economies in the
region have the opportunity to avoid undergoing this correction. This is why problems
such as water and air pollution, farmland degradation, deforestation, and the like are
economic issues first and foremost. Hence, their engagement by definition produces
‘win-win’ situations.
A further relevant point here is that the economist adage of ‘one problem, one
instrument’ is unlikely to work for these wicked problems. More complex responses
operating across multiple issues will be required. In the energy-environment space, for
example, a mix of policies will be required to reduce emissions, improve energy
security, tackle air pollution, and extend energy access.
6.2. Bottom-up Management Processes and Stakeholder Participation
Many of ASEAN’s environmental issues involve diffuse groups whose actions are
difficult to control by centralised, one-size-fits-all regulation. The nature of an
environmental problem is likely to differ across locations in the same country, state,
or neighbouring communities. Without the participation of local-level stakeholders in
their formulation, attempted solutions will not be effective, especially where the
incentive structure to change behaviour is not addressed. Where possible, participation
of stakeholders in both the decision-making process and adaptive management should
47
be encouraged. Stakeholders will generally have the best idea of how problems and
their solutions work and affect them. Even where broad-scale strategies are required,
the design of centralised measures should place a heavy emphasis on information
gleaned from ‘bottom-up’ consultative processes.
The advantages of this approach are apparent from our earlier examples. The
short-term financial incentives for communities to be engaged in logging would need
to be overcome to achieve a lasting halt to deforestation in Indonesia. Similarly,
improved groundwater management in rural Cambodia would require some form of
cooperation between groundwater users, perhaps through community management.
Rural households are unlikely to adopt improved cook stoves unless they consider
them to be viable and improved alternatives to traditional methods. Impacts of dams
on riparian communities in the Mekong, and the choice of afforestation activities in
Indonesia are all issues that will have improved environmental outcomes by the direct
engagement of local stakeholders.
6.3. Scientific and Technological Research
Comprehension of the dynamics and impacts of problems and potential solutions
are essential inputs into effective management of environmental issues. The process
of prioritising certain measures from within an infinite solution set has to be informed
by the best possible information. For example, a critical determinant of the welfare
impacts of Mekong dams will be the effectiveness of fish ladders for migratory species.
Without prior research into this issue, informed decisions on construction are
impossible. Likewise, scientific assessment prior to the establishment of large-scale
plantations would have avoided the negative impacts on soil hydrology that have since
occurred. Ongoing support of scientific research facilitates adaptive management as
problems evolve and solutions are attempted. Increased linkages between research
institutions across Asia will support knowledge dissemination on related issues.
48
6.4. Planning for Green Growth
As indicated at the start of this section, planning rather than reaction will be crucial
to effective management. For example, measures addressing air pollution in major
cities must account for continuing urban sprawl and a richer population in the future
and, consequently, rising demand for vehicles. Planning for rising water demand will
also be crucial over the next two decades. Policies that address only the current state
of an environmental issue will likely be ineffective if and when the problem expands
in the future.
The importance of green growth is particularly significant to climate change. Steps
taken towards a low-carbon economy in ASEAN to 2030 will have a great bearing on
the future extent of climate change globally. Measures in the near-term, such as energy
pricing reform, will reduce the level of restructuring required once these economies
have grown much larger. Moreover, climate change will render water security a much
bigger challenge in the future, particularly in India and China. Planning for such events
ahead of time and addressing issues before they get worse will avoid the full scale of
negative impacts.
6.6. Pricing of Environmental Services
Most environmental problems are an example of ‘market failure’. This failure
usually pertains to environmental costs being unrepresented in the price of goods,
services, and access to resources. Raise the price to reflect these costs and invariably
there will be less ‘demand’ for environmental degradation. Throughout ASEAN,
examples abound of large discrepancies between prices, or private costs, and social
cost. In our case-studies, the link was particularly clear in the case of excessive ground-
water degradation, and climate change mitigation. Indeed, when it comes to energy
and water, prices often fail to reflect economic let alone environmental costs. Of course,
one reason ASEAN’s environmental problems are wicked is because the pricing
reforms needed to solve them are very difficult to implement. Energy pricing reform
can be one of the most sensitive reforms a government can attempt to undertake.
Nevertheless, if one is looking for solutions, opportunities to rectify major
discrepancies between private and social cost need to be taken.
49
The flipside of this argument is that environmentally beneficial activities should
be supported through subsidies and other price-based mechanisms. Governments
throughout the region are already investing heavily in the development and
deployment of renewable energy. In other areas, such as deforestation, ecosystem
services are beginning to be valued and economic mechanisms developed to sustain
them. Such activities should broaden. The prospects for this happening will increase
with international and regional support in the provision of funds, expertise, technology,
and other resources.
6.7. Improving Institutional Capacity
A key determinant of effective environmental regulation is, of course, the quality
of the regulator. Implementation remains a pervasive hindrance to improved
environmental protection. Whether it be high-level sanction of forest ‘land-grabs’,
misreporting of environmental statistics, or bribes for local officials not to enforce
national laws, insufficient institutional capacity facilitates unsustainable resource use
across many parts of Asia. Institutional capacity is a wicked problem in itself, but
attention to this single issue will strengthen the effectiveness of all the other
management strategies outlined here. Establishment of independent regulators,
cooperation with unrestricted NGO sector, greater transparency, and institutional
democratization at all levels are important objectives. Still, uncorrupted regulatory
bodies can be under-resourced or have poorly trained staff. Allocating central budget
resources to environmental regulation should increasingly be viewed as part of the
economic growth and development agenda.
6.8. Cooperative Management, Regional Institutions, and International
Cooperation
Cooperative management mechanisms will be important to avoid any conflict over
use of shared resources, particularly between states. Forums such as the Mekong River
Commission and others like it must serve as an important meeting place for states to
share information and negotiate. The creation of shared institutions or agreements prior
to the full materialisation of potential flashpoints will assist adaptive and mutually
beneficial management. At a community level, cooperative management of a shared
50
resource, such as groundwater, could help to break ‘public good’ characteristics
wherein individual users have no self-interest in personally pursuing sustainable usage
patterns. Cooperative management between government departments or national
governments in the pursuit of the co-benefits mentioned above will be critical to the
results of a multi-objective approach.
An important component of cooperative management will be a central role for
regional institutions. Batie (2008) emphasises the importance of ‘boundary institutions’
in addressing wicked problems. Such institutions act as a conduit between knowledge
providers (e.g. scientific researchers) and knowledge users (e.g. policymakers,
resource managers, and the public). In ERIA, the region already has a major institution
that fulfils this role. As Asia’s environmental problems grow, the ERIA, ASEAN
Secretariat and Asian Development Bank should expand their activities to further
engage with the management strategies outlined in Appendix A-2. Political and
economic institutions such as ASEAN and Asia-Pacific Economic Cooperation will
increasingly have to incorporate environmental issues within their agenda, not just in
words but in actions that reflect the significance of these problems to regional growth
and stability.
Looking beyond the region, international cooperation has a critical role to play.
This century may belong to Asia, but, at this particular juncture, this region will need
considerable assistance if it is to find the resources and expertise required to address
its environmental problems. This is particularly true for Cambodia, Lao PDR,
Myanmar, and Viet Nam. Broadly, the developed countries of the region would also
play a crucial leadership role on global issues such as climate change. Without
effective action to reduce emissions being taken by OECD (Organisation for Economic
Co-operation and Development) countries, one can hardly expect tough decisions to
be made in ASEAN.
7. Conclusion and Recommendations
The current trajectory of environmental degradation in ASEAN is clearly
unsustainable. Policymakers around the region acknowledge the importance of
51
environmentally sustainable growth and are already addressing it, but much more will
need to be done. A prosperous, growing, and safe ASEAN needs water, clean air,
forests, and arable lands. Under current trends, these components of the natural
resource base threaten to decline substantially as population and per capita incomes
rise. Food security, human health, and regional cooperation are all likely to weaken if
natural resources are not protected. Action on climate change mitigation in the region
over the next two decades will, by and large, shape the scale of damages from global
warming. Both the region and the globe cannot afford for ASEAN as a whole to retain
any vestiges of a ‘development first–environment later’ mindset.
At the same time, there are no easy answers. In this paper, based on the fact and
progress made, we have argued that ASEAN’s diverse environmental problems share
the characteristic of being ‘wicked’. That is, they are dynamic and complex, they
encompass many issues and stakeholders, and they evade straightforward, lasting
solutions. Greening the growth will help make resources available to direct towards
solutions, but they will also deepen the impact of the divergence between social and
private cost which underlies so many of these problems.
Prescriptive, simplistic solutions will not be effective, and may make matters
worse. The best one can hope to articulate at a general level is a set of principles for
accelerating green growth that may be useful in dealing with a number of these
problems. Broadly, the factors that need to be considered to facilitate the transition
toward environmentally sustainable green growth are:
Recognising that development is the main priority in ASEAN, an
environmentally efficient development path provides an opportunity to
contribute towards this objective in a more sustainable manner. The policy
framework to promote a resource- efficient development path needs to clearly
demonstrate the benefits of both co-benefits and strategies for removing
barriers to reap the co-benefits. Pursuing the low-carbon development path will
benefit ASEAN from more analysis based on existing policies, with a clearer
analysis of co-benefits, in particular, the benefits for development;
To promote a better understanding of the co-benefit approach towards a low-
carbon green growth, it would also be necessary to enable ASEAN to quantify
clearly the developmental challenges and other international agreements such
as climate change, Montreal protocol;
52
Translation of national goals to enable wider access to energy services and
resource-efficient technologies needs to be strategised through innovative
policies, financing schemes, and the participation of various stakeholders;
It is important to quantify resource efficiency and renewable energy potential
at the national level to assess the implications for (i) energy and water security;
(ii) emission reduction; and (iii) a country’s competitiveness;
Application and utilisation of appropriate green technologies in developing
these strategies would be essential to assess their financial implications. There
is a need to better understand the long-term socio-economic and environmental
costs and benefits in the choice of technologies. Technology transfer would be
necessary to assist developing countries in accelerating the process;
More innovative financing schemes at the micro- and macro-levels will be
needed to implement strategies for access to water services, reduce land
degradation, improve air quality, and foster energy efficiency. A mechanism
to complement these strategies—closer links to the emerging carbon market
and domestic financing schemes—needs to be developed at the national level.
For ensuring water security and efficiency, ASEAN countries need to enhance
their regional cooperation particularly in sharing cross-border water sources
and meeting regional financing needs for water infrastructure.
The transition to the above state will involve coherent efforts by national and sub-
national governments, private sector, international organisations, and knowledge
institutes. Although such a transition involves many actors, the following concrete
policy options could take advantage of the opportunities available:
Employ market-based instruments such as eco-labelling programmes at regional
level, to improve efficiency in resource use and promote innovations in renewable
energy technology. Placing a price on emissions and pollutions has been found to
stimulate innovation as firms and consumers seek out clean and green alternatives.
Environmental and energy-related taxation on some levee has been successfully
used by countries around the region since the 1970s and 1980s including Malaysia,
the Philippines, and Thailand.
Establish well designed regulatory frameworks that can define right conditions for
market-based instruments and create incentives as well as remove barriers for
investments in renewable energy resources. Adequate regulatory frameworks such
as feed-in-tariffs reduce business risks and increase confidences.
Prioritise government investments and spending in areas that stimulate energy and
water resource conservations as well as pollution prevention. Green subsidies such
as price support measures, tax incentives, direct grants, and loan support may be
used to avoid lock-in effects as well as foster new industries in energy, water, and
53
emission- reduction sectors, as a part of combined ASEAN strategy to build
comparative advantage and drive long-term employment growth.
Limit government spending in areas that deplete resources. Artificially lowering
the cost of using fossil fuels through subsidies deters consumers and industries
from adopting resource efficiency measures that would otherwise be cost effective.
Though subsidy reform is possible in ASEAN, it is challenging given the vested
interest in their maintenance, but there are numerous examples such as conditional
cash transfer schemes where aid is targeted to poor households.
Invest in capacity building, training, and education. The capacity to seize the
opportunities available with cross-border infrastructure projects varies from
country to country. National circumstances often influence the readiness of
ASEAN economies and population to cope with challenge. Training and skill
enhancement programmes are needed to prepare the workforce for cross-border
projects.
Strengthen trade and governance systems through regional cooperation. The
United Nations Framework Convention on Climate Change (UNFCC)’s Kyoto
Protocol has already stimulated growth of trade and investment in a number of
economic sectors of ASEAN. The cooperation among ASEAN, Japan, China,
Korea, and India in establishing a regional market could be a significant factor in
determining the speed and scale of the new green growth projects.
It is unquestionable that the challenge is vast and the urgency mounting. AMS’s
continued economic expansion and rising standard of living are being increasingly
exposed to declining environmental conditions. The degree to which considered, pre-
emptive action takes primacy over forced reaction will determine the burden of
environmental degradation on ASEAN economic integration beyond 2015.
References
ADB (2007a), Asian Water Development Outlook 2007: Achieving Water Security for
Asia, Mandaluyong, Philippines: Asian Development Bank.
ADB (2007b), Asian Environment Outlook: Water Supply and Sanitation in Asia.
Mandaluyong, Philippines: Asian Development Bank.
ADB (2009a), The Economics of Climate Change in Southeast Asia: A Regional
Review. Mandaluyong, Philippines: Asian Development Bank.
ADB (2009b), Asian Sanitation Data Book 2008: Achieving Sanitation for All.
Mandaluyong, Philippines: Asian Development Bank.
54
ADB/DFIC (Asian Development Bank/Department for International Development)
(2006), Energy Efficiency and Climate Change Considerations for On-road
Transport in Asia, http://www.adb.org/Documents/Reports/Energy-
Efficiency-Transport/energy-efficiency.pdf
ADB-ADBI (2014), ASEAN, PRC, and India: The Great Transformation. A Joint
Study by ADB and ADBI, Tokyo: Asian Development Bank Institute.
ADBI (2014), ASEAN 2030: Towards a Borderless Economic Community. Tokyo:
Asian Development Bank Institute.
Adler, T. (2010), ‘Better Burning, Better Breathing: Improving Health with Cleaner
Cook Stoves’, Environmental Health Perspectives, 118(3), pp. A124–A129.
Aggrawal, R.K. and S.S. Chandel (2004), ‘Review of Improved Cookstoves
Programme in Western Himalayan State of India’, Biomass and Bioenergy, 27,
pp. 131–44.
AIECE (2009), ‘World Commodity Prices 2009’. Association of European
Conjuncture Institutes, Working Group on Commodity Prices.
Amornsakchai, S., P. Annez, S. Vongvisessomjai, S. Choowaew, P. Kunurat, J.
Nippanon, R. Schouten, P. Sripaptrrasite, C. Vaddhanaphuti, C. Vidthayanon,
W. Wirojanagud, and E. Watana (2000), ‘Pak Mun Dam: Mekong River Basin
Thailand’, World Commission on Dams Case Study. http://www.centre-
cired.fr/IMG/pdf/F8_PakMunDam.pdf (accessed 17 January 2015).
Arnold, L. (2008), ‘Deforestation in Decentralised Indonesia: What’s Law Got to Do
with It?’, Law, Environment and Development Journal, 4(2), pp.75–101,
http://www.lead-journal.org/content/08075.pdf (accessed 17 January 2015).
Arrow, K., B. Bolin, R. Costanza, P. Dasgupta, C. Folke, C.S. Holling, B.O. Jansson,
S. Levin, K.G. Maler, C. Perrings, and D. Pimental (1995), ‘ Economic Growth,
Carrying Capacity, and the Environment’, Science 268, pp. 520–521.
Arze del Granado, J.D. Coady, and R. Gillingham (2010), ‘The Unequal Benefits of
Fuel Subsidies: A Review of Evidence for Developing Countries.’ IMF WP
10/02, Washington, DC: International Monetary Fund.
ASEAN (2001), Second ASEAN State of the Environment Report 2000. Jakarta:
ASEAN Secretariat.
ASEAN (2003), Guidelines for Implementation of the ASEAN Policy on Zero Burning.
Jakarta: ASEAN Secretariat.
ASEAN (2004), Guidelines for Implementation of the ASEAN Policy on Controlled
Burning Practices. Jakarta: ASEAN Secretariat.
ASEAN (2007a), ‘Combating Haze in ASEAN, 2007’, Associate of South East Asian
Nations, Jakarta.
ASEAN (2007b), ASEAN Declaration on Environmental Sustainability. Jakarta:
ASEAN Secretariat. http://www.asean.org/21060.htm (accessed 17 January
2015).
55
ASEAN (2009a), Asian Socio-Cultural Community Blueprint. Jakarta: ASEAN
Secretariat. http://www.asean.org/archive/5187-19.pdf (accessed 17 January
2015).
ASEAN (2009b), ‘Executive Summary’ in ASEAN, Fourth ASEAN State of the
Environment Report 2009. Jakarta: ASEAN Secretariat (accessed 17 January
2015).
ASEAN (2009c), Fourth ASEAN State of the Environment Report 2009. Jakarta:
ASEAN Secretariat (accessed 17 January 2015).
ASEAN (2011), Website of the ASEAN Peatlands Forest Project.
http://www.aseanpeat.net/index.cfm?&menuid=9 (accessed 17 January 2015).
ASEAN (2013), ‘ASCC Score Card; Section D Ensuring Environmental
Sustainability,’ Jakarta: Association of South East Asian Nations.
Asia Society (2009), ‘Asia’s Next Challenge: Securing the Region’s Water Security’,
Report by the Leadership Group on Water Security in Asia, Asia Society.
http://asiasociety.org/files/pdf/WaterSecurityReport.pdf (5 September 2015).
Bai, Z.G., D.L. Dent, L. Olsson, and M.E. Schaepman (2008), ‘Proxy Global
Assessment of Land Degradation’, Soil Use and Management, 24, pp. 223–234.
Batie, S. (2008), ‘Wicked Problems and Applied Economics’, American Journal of
Agricultural Economics 90(5), pp. 1176–1191.
Bawa, K.S., L.P. Koh, T.M. Lee, J. Liu, P.S. Ramakrishnan, D.W. Yu, Y. Zhang, and
P. Raven (2010), ‘China, India, and the Environment’, Science 327, pp. 1457–
8.
Behrens, A., S. Giljum, J. Kovanda, and S. Niza (2007), ‘The Material Basis of the
Global Economy: Worldwide Patterns of Natural Resource Extraction and
Their Implications for Sustainable Resource Use Policies’, Ecological
Economics, 64(2), pp. 444–453.
Bell, R.G., K. Mathur, U. Narain, and D. Simpson (2004),’Clearing the Air: How Delhi
Broke the Logjam on Air Quality Reforms’, Environment, 46(3), pp. 22–39.
Bennett, M. (2008), ‘China’s Sloping Land Conversion Program: Institutional
Innovation or Business as Usual?’, Ecological Economics, 65, pp. 699–711.
Besant-Jones, J.E. (2006), ‘Reforming Power Markets in Developing Countries: What
Have We Learned?’, Energy Mining Sector Board Discussion Paper No. 19,
Washington, DC: World Bank.
Bleischwitz, R. (2010), ‘International Economics of Resource Productivity: Relevance,
Measurement, Empirical Trends, Innovation, Resource Policies, International
Economics and Economic Policy, 7, pp. 227–244.
Bovenberg, A.L. and S. Smulders (1996), ‘Transitional Impacts of Environmental
Policy in an Endogenous Growth Model’, International Economic Review, 37
(4), pp. 861–895.
Brenner, M.D., M. Riddle, and J.K. Boyce (2007), ‘A Chinese Sky Trust?
Distributional Impacts of Carbon Charges and Revenue Recycling in China’,
Energy Policy, 35(3), pp. 1771–1784.
56
Bringezu, S. (2003), ‘Industrial \Ecology and Material Flow Analysis. Basic Concepts,
Policy Relevance and Some Case Studies’, in D. Bourg and S. Erkman (eds.),
Perspectives in Industrial Ecology. Sheffield, UK: Greenleaf Publishing.
Bringezu, S. and R. Bleischwitz (eds.) (2009), Sustainable Resource Management:
Global Trends, Visions and Policies. Sheffield, UK: Greenleaf Publishing, pp.
15–17.
Briscoe, J. and R.P.S. Malik (2005), India’s Water Economy: Bracing for a Turbulent
Future. Washington, DC: World Bank.
Brock, W.A. and M. Scott Taylor (2005), ‘Economic Growth and the Environment: A
Review of Theory and Empirics’, in P. Aghion and S.N. Durlauf (eds.),
Handbook of Economic Growth 1B. Tokyo: Elsevier.
Broich, M., M. Hansen, F. Stolle, P. Potapov, B.A. Margono, and B. Adusei (2011),
‘Remotely Sensed Forest Cover Loss Shows High Spatial and Temporal
Variation Across Sumatra and Kalimantan, Indonesia 2000–2008’,
Environmental Research Letters, 6, pp. 1–9.
Campbell, I. (2009), ‘The Challenges for Mekong River Management’, in I. Cambell
(ed.), The Mekong: Biophysical Environment of an International River Basin.
Burlington, MA: Academic Press.
Cao, S. (2008), ‘Why Large-Scale Afforestation Efforts in China Have Failed to Solve
the Desertification Problem’, Environmental Science and Technology, 42(6),
pp. 1826–1831.
Cao, S., T. Tian, L. Chen, X. Dong, X. Yu, and G. Wang (2010), ‘Damage Caused to
the Environment by Reforestation Policies in Arid and Semi-Arid Areas of
China’, AMBIO 39, pp. 279–83.
Carson, R.T. (2010), ‘The Environmental Kuznets Curve: Seeking Empirical
Regularity and Theoretical Structure’, Review of Environmental Economics
and Policy, 4(1), pp. 3–23.
Centre for Science and Environment (2011), Tracking Winter Pollution in Delhi 2010.
http://www.cseindia.org/userfiles/winter_pollution2010.pdf (accessed 5
September 2015).
Chakraborti, D., B. Das, and M. Murrill (2011), ‘Examining India’s Groundwater
Quality Management’, Environmental Science and Technology, 45, pp. 27–33.
Chengappa, C., R. Edwards, R. Bajpi, K.N. Shields, and K.R. Smith (2007), ‘Impact
of Improved Cookstoves on Indoor Air Quality in the Bundelkhand Region in
India’, Energy for Sustainable Development, 11(2), pp. 33–44.
Clean Air Initiative (2010), Air Quality in Asia: Status and Trends 2010 Edition.
http://cleanairinitiative.org/portal/sites/default/files/documents/AQ_in_Asia.p
df (accessed 5 September 2015).
Clements, G.P., J. Sayer, A. K. Boedhihartono, O. Venter, T. Lovejoy, L.P. Koh, and
W.F. Laurance (2010), ‘Cautious Optimism over Norway-Indonesia REDD
Pact’, Conservation Biology 24(6), pp. 1437–1438.
57
Cohen, A.J., H.R. Anderson, B. Ostra, K.D. Pandey, M. Kryzyanowski, N. Kunzli, K.
Gutschmidt, A. Pope, I. Romieu, J.M. Samet, and K. Smith (2005), ‘The Global
Burden of Disease Due to Outdoor Air Pollution’, Journal of Toxicology and
Environmental Health, Part A 68, pp. 1–7.
Commission on Growth and Development (2008), The Growth Report: Strategies for
Sustained Growth and Inclusive Development. Washington, DC: World Bank.
http://www.growthcommission.org/index.php?Itemid=169&id=96&option=c
om_content&task=view (accessed 5 September 2015).
Costanza, R., I. Kubiszewski, P. Paquet, J. King, S. Halimi, H. Sanguanngoi, N. Bach,
R. Frankel, J. Ganaseni, A. Intralawan, and D. Morell (2011), Planning
Approaches for Water Resources Development in the Lower Mekong Basin.
Oregon: Portland State University/Mae Fah Luang University.
http://web.pdx.edu/~kub/publicfiles/Mekong/LMB_Report_FullReport.pdf
(accessed 17 January 2015).
Coxhead, I. (2003), ‘Development and the Environment in Asia’, Asian-Pacific
Economic Literature, 17(1), pp. 22–54.
Cronin, R. (2009), ‘Mekong Dams and the Perils of Peace’, Survival: Global Politics
and Strategy, 51(6), pp. 147–160.
Cropper, M.L., N.B. Simon, A. Alberini, and P.K. Sharma (1997), The Health Benefits
of Air Pollution Control in Delhi. World Bank.
http://cleanairinitiative.org/portal/system/files/58255_resource_4.pdf
(accessed 17 January 2015).
Dasgupta, P. (1996), ‘The economics of the environment’, Environment and
Development Economics, 1, pp. 387–428.
Dasgupta, P., and G. Heal (1974), ‘Optimal Depletion of Exhaustible Resources’,
Review of Economic Studies Symposium, pp. 3–28.
Demurger, S., H. Yuanzhao, and Y. Weiyong (2009), ‘Forest Management Policies
and Resource Balance in China: An Assessment of the Current Situation’, The
Journal of Environment Development, 18(1), pp. 17–41.
Dittrich, M. (2009). ‘The Physical Dimension of International Trade, 1962–2005’, in
Bleischwitz, R., P.J.J. Welfens, and Z.X. Zhang (eds.), Sustainable Growth and
Resource Productivity. Economic and Global Policy Issues. Sheffield, UK:
Greenleaf Publishing.
Dittrich, M., (2010), ‘Dynamics of Material Use of Emerging Countries’, Presentation
on 3rd International Wuppertal Colloquium on ‘Sustainable Growth and
Resource Productivity’, Brussels.
Dittrich, M. and S. Bringezu (2010), ‘The Physical Dimension of International Trade.
Part I: Direct Global Flows Between 1962 and 2005’, Ecological Economics,
69, pp. 1838–1847.
Dore, J. and K. Lazarus (2009), ‘De-marginalizing the Mekong River Commission’,
in F. Molle, T. Foran, and M. Kakonen (eds.), Contested Waterscapes in the
Mekong Region. London, UK: Earthscan.
58
Dugan, P., C. Barlow, A. Agostinho, E. Baran, G. Cada, D. Chen, I. Cowx, J. Ferguson,
T. Jutagate, M. Mallen-Cooper, G. Marmulla, J. Nestler, M. Petere, R.
Welcomme, and K. Winemiller (2010), ‘Fish Migration, Dams, and Loss of
Ecosystem Services in the Mekong Basin’, AMBIO, 39(4), pp. 344–348.
Economy, E. (2010), The River Runs Black: The Environmental Challenge to China’s
Future. Ithaca, New York: Cornell University Press.
Ekins, P., B. Meyer, and F. Schmidt-Bleek (2009), ‘Reducing Resource Consumption:
A Proposal for Global Resource and Environmental Policy’. GWS Discussion
Paper 2009/5. Osnabrück: GWS.
Fan, Ying, and B. Biswanath (2011), ‘ASEAN, China and India Energy Security
Outlook for a Green and Sustainable Asia’, Background paper prepared for
ADBI/ADB’s study ‘ASEAN, China and India: 2030’.
FAO (2011a), State of the World’s Forests 2011. Rome: Food and Agriculture
Organization of the United Nations.
FAO (2011b), FAOSTAT’, Statistical Database of the Food and Agriculture
Organization of the United Nations. http://faostat.fao.org/default.aspx
Firdaus, G., and A. Ahmad (2011), ‘Changing Air Quality in Delhi, India:
Determinants, Trends, and Policy Implications’, Regional Environmental
Change http://www.springerlink.com/content/6925518520g511gk/ (accessed
17 January 2015).
Fischer, C., and R.G. Newell (2008), ‘Environmental and Technology Policies for
Climate Mitigation’, Journal of Environmental Economics and Management,
55(2), pp. 142–162.
Fitzherbert, E.B., M.J. Struebig, A. Morel, F. Danielsen, C.A. Bruhl, P.F. Donald, and
B. Phalan (2008), ‘How Will Oil Palm Expansion Affect Biodiversity?’,
Trends in Ecology and Evolution, 23(10), pp. 538–545.
Foran, T., T. Wong, and S. Kelley (2010), Mekong Hydropower Development: A
Review of Governance and Sustainability Challenges, M-POWER Research
Network.
http://www.mpowernetwork.org/Knowledge_Bank/Key_Reports/PDF/Resear
ch_Reports/Foran_Wong_Kelley_2010.pdf (5 September 2015).
Foster, A., and N. Kumar (2011), ‘Health Effects of Air Quality Regulations in Delhi,
India’, Atmospheric Environment 45, pp. 1675–1683.
GACC (2011), Website of the Global Alliance for Clean Cookstoves.
http://cleancookstoves.org/
Garnaut, R., S. Howes, F. Jotzo, and P. Sheehan (2008), ‘Emissions in the Platinum
Age’, Oxford Review of Economic Policy, 24(2), pp. 377–401.
Giljum, S. (2004), ‘Trade, Material Flows and Economic Development in the South:
The Example of Chile’, Journal of Industrial Ecology 8, pp. 241–261.
Giljum, S., M. Dittrich, S. Bringezu, C. Polzin, and S. Lutter (2010), ‘Resource Use
and Resource Productivity in Asia: Trends over the past 25 years’, SERI
Working Paper Series No. 11, Vienna: Sustainable Europe Research Institute.
59
Gillingham, K., R. Newell, and K. Palmer (2009), ‘Energy Efficiency Economics and
Policy’, Annual Review of Resource Economics, 1, pp. 597–619.
Government of China (2006), Green GDP Study Report 2004 Issued.
http://www.gov.cn/english/2006-09/11/content_384596.htm (accessed 17
January 2015).
Government of India (2009), State of Environment Report: India – 2009. New Delhi:
Ministry of Environment & Forests, Government of India.
Government of India (2010), Groundwater Scenario of India 2009–10. Central
Ground Water Board, Ministry of Water Resources.
http://www.cgwb.gov.in/documents/Ground%20Water%20Year%20Book%2
02009-10.pdf (accessed 17 January 2015).
Government of NCT of Delhi (2010), State of Environment Report for Delhi, 2010.
New Delhi: Department of Environment and Forests, Government of NCT of
Delhi.
Grieshop, A.P., C.C.O. Reynolds, M. Kandlikar, and H. Dowlatabadi (2009), ‘A
Black-carbon Mitigation Wedge’, Nature Geoscience, 2, pp. 533–534.
Grossman, G,M., and A.B. Krueger (1995), ‘Economic Growth and the Environment’,
Quarterly Journal of Economics, 110, pp. 353–377.
Grumbine, R., and J. Xu (2011), ‘Mekong Hydropower Development’, Science, 332,
pp. 178–179.
Guan, L., G. Sun, and S. Cao (2011), ‘China’s Bureaucracy Hinders Environmental
Recovery’, AMBIO, 40 pp. 96–99.
Gusdorf, F., S. Hallegatte, and A. Lahellec (2008), ‘Time and Space Matter: How
Urban Transitions Create Inequality’, Global Environment Change, 18(4), pp.
708–719.
Gustafson, O., M. Krusa, Z. Zencak, R.J. Sheesley, L. Granat, E. Engstrom, P.S.
Praveen, P.S.P. Rao, C. Leck, and H. Rodhe (2009), ‘Brown Clouds Over
South Asia: Biomass or Fossil Fuel Combustion?’, Science, 323(5913), pp.
495–498.
Guttikunda, S. (2010), ‘Air Quality Index (AQI) for Delhi, India: Trend Analysis &
Implications for the Commonwealth Games 2010 & Beyond’, Sim-air Working
Paper Series: 35-2010.
Hallegatte, S. (2011), ‘How Economic Growth and Rational Decisions Can Make
Disaster Losses Grow Faster than Wealth’, Policy Research Working Paper
5617, Washington, DC: World Bank.
Hallegatte, S., G. Heal, M. Fay, and D. Treguer (2011), ‘From Growth to Green
Growth: A Framework’, NBER Working Paper 17841. Washington, DC:
National Bureau of Economic Research, Inc.
Harrison, M., S. Page, and S. Limin (2009), ‘The Global Impact of Indonesian Forest
Fires’, Biologist, 56(3), pp. 156–163.
60
He, J., and L. Kuijs (2007), ‘Rebalancing China‘s Economy – Modelling A Policy
Package’, World Bank China Research Paper No.7, September, Washington,
DC: World Bank.
Heal, G. and B. Kriström (2005), ‘National Income and the Environment’, in K.G.
Mäler, and J. R. Vincent (eds.) Handbook of Environmental Economics,
Volume 3, Part 2. Amsterdam: Elsevier, pp. 1147–1217.
Heal, G., and W. Schlenker (2008), ‘Economics: Sustainable Fisheries’, Nature, 455
(7216), pp. 1044–1045.
Health Effects Institute (2010), ‘Outdoor Air Pollution and Health in the Developing
Countries of Asia: A Comprehensive Review’. HEI International Scientific
Oversight Committee, Special Report 18.
http://ehs.sph.berkeley.edu/krsmith/publications/2011/heiasiareview.pdf
(accessed 17 January 2015).
Herawati, H., and H. Santoso (2011), ‘Tropical Forest Susceptibility To and Risk of
Fire Under Changing Climate: A Review of Fire Nature, Policy and Institutions
in Indonesia’, Forest Policy and Economics, 13(4), pp. 227–233.
Hirsch, P. (2010), ‘Changing Political Dynamics of Dam Building on the Mekong’,
Water Alternatives, 3(2), pp. 312–323.
Hirsch, P. (2011), ‘China and the Cascading Geopolitics of Lower Mekong
Dams’, The Asia-Pacific Journal, 9(20) number 2: May 16.
Hongo, T. (2012), Mobilizing Private Capital for Low Carbon Green Growth, BP for
CCGA study.
Hortle, K. (2007), Consumption and the Yield of Fish and Other Aquatic Animals from
the Lower Mekong Basin. MRC Technical Paper, Mekong River Commission.
http://www.mrcmekong.org/download/free_download/Tech16_split/consump
tion-report1-summary.pdf (accessed 17 January 2015).
Howes, S. and P. Wyroll (2012), ‘An Overview of Emission Profiles, Development
Trajectories and Policy Actions in Asia’, ADBI Working Paper No. 369. Tokyo:
Asian Development Bank Institute.
Howes, S., and P. Wyrwoll (2011), ‘Environmental Challenges and Solutions in
ASEAN, China and India’, Background paper prepared for ADBI/ADB’s study
‘ASEAN, China and India: 2030’.
Huang, Y. (2010), ‘China‘s Great Ascendancy and Structural Risks: Consequences of
Asymmetric Market Liberalization’, Asian-Pacific Economic Literature, 24,
pp. 65–85.
http://lnweb90.worldbank.org/servlet/OEDSearchServletV656?SearchType=
byText&PerPage=20&DbURL=oed/oeddoclib.nsf&Form=OEDSearch&Sear
chText=Phase%20I:%20An%20Evaluation%20of%20World%20Bank,%20
Win-Win%20energy%20policy%20reforms (accessed 17 January 2015).
IEA (International Energy Agency) (2006), ‘China’s power sector reforms: where to
next?’ http://www.iea.org/textbase/nppdf/free/2006/chinapower.pdf (accessed
17 January 2015).
61
IEA (2009), CO2 Emissions from Fuel Combustion (2009 Edition). Paris, France:
International Energy Agency.
IEA (2010), World Energy Outlook 2010. Paris, France: International Energy Agency.
IEG (Independent Evaluation Group) of the World Bank 2009, Climate change and
the World Bank Group: Phase I – an evaluation of World Bank win-win energy
policy reforms. Washington, DC: World Bank.
http://lnweb90.worldbank.org/servlet/OEDSearchServletV656?SearchType=
byText&PerPage=20&DbURL=oed/oeddoclib.nsf&Form=OEDSearch&Sear
chText=Phase%20I:%20An%20Evaluation%20of%20World%20Bank,%20
Win-Win%20energy%20policy%20reforms
IIT/ERI (Indian Institute of Technology Delhi/Energy and Resources Institute, New
Delhi) 2010, ‘New Initiative for Development and Deployment of Improved
Cookstoves: Recommended Action Plan’, Report to the Ministry of New and
Renewable Energy, Government of India, May 2010.
http://www.winrockindia.org/mnre/doc/Final_Report_Cookstove.doc
Immerzeel, W.W., L.P.H. van Beek, and M.F.P. Bierkens (2010), ‘Climate Change
Will Affect the Asian Water Towers’, Science 328: 1382–1385.
IPCC (2007), Climate Change 2007 – Impacts, Adaptation and Vulnerability:
Contribution of Working Group II to the Fourth Assessment Report of the IPCC.
Cambridge: Cambridge University Press.
IPCC (Intergovernmental Panel on Climate Change) (2007), Climate Change 2007:
Synthesis Report. Geneva: IPCC. https://www.ipcc.ch/pdf/assessment-
report/ar4/syr/ar4_syr.pdf (accessed 17 January 2015).
Jiao, J., Z. Zhang, W. Bai, Y. Jia, and N. Wang (2011), ‘Assessing the Ecological
Success of Restoration by Afforestation on the Chinese Loess Plateau’,
Restoration Ecology
Kalirajan, K. (2012), ‘Regional Cooperation towards Green Asia: Trade and
Investment’, ADBI Working Paper 350, Tokyo: Asian Development Bank
Institute.
Kim, J.T. (2011), Financing Green Growth, APEC Study on Green Finance.
Kishore, V.V.N., and P.V. Ramana (2002), ‘Improved Cookstoves in Rural India: How
Improved Are They? A Critique of the Perceived Benefits from the National
Programme on Improved Chulhas (NPIC)’, Energy, 27, pp. 47–63.
Kondepati, R. (2011), ‘Agricultural Groundwater Management in Andhra Pradesh,
India: A Focus on Free Electricity Policy and its Reform', International
Journal of Water Resources Development, 27(2), pp. 375–386.
Konikow, L., and E. Kendy (2005), ‘Groundwater Depletion: A Global Problem’,
Journal of Hydrology, 13, pp. 317–320.
Krausmann, F., M. Fischer-Kowalski, H. Schandl, and N. Eisenmenger (2008), ‘The
Global Sociometabolic Transition: Past and Present Metabolic Profiles and
their Future Trajectories, Journal of Industrial Ecology, 12, p. 637.
62
Krchnak, K., B. Richter, and G. Thomas (2009), Integrating Environmental Flows into
Hydropower Dam Planning, Design, and Operations. World Bank Water
Working Notes No. 22. Washington, DC: World Bank.
http://water.worldbank.org/water/publications/integrating-environmental-
flows-hydropower-dam-planning-design-and-operations (accessed 17 January
2015).
Kummu, M., and O. Varis (2010), ‘Basin-wide Sediment Trapping Efficiency of
Emerging Reservoirs Along the Mekong’, Geomorphology, 199, pp. 181–197.
Levy II, H., M.D. Schwartzkopf, L. Horowitz, V. Ramaswany, and K.L. Findell (2008),
‘Strong Sensitivity of Late 21st Century Climate to Projected Changes in Short-
lived Air Pollutants’, Journal of Geophysical Research, 113 (D06102), pp. 1–
13.
Liu, J., and P.H. Raven (2010), ‘China’s Environmental Challenges and Implications
for the World’, Critical Reviews in Environmental Science and Technology, 40,
pp. 823–51.
Lobell, D.B., M.B. Burke, C. Tebaldi, M.D. Mastrandrea, W.P. Falcon, and R.L.
Naylor (2008), ‘Prioritizing Climate Change Adaption Needs for Food
Security in 2030’, Science, 319, pp. 607–610.
Malthus, T.R. (1965) (1798), First Essay on Population. New York: Kelley.
Manby, B. (1992), ‘South Africa: The Impact of Sanctions’, Journal of International
Affairs, 46, pp. 193–217.
Mandal, B.K., P.P. Chowdhury, G. Samanta, G.K. Basu, C.R. Chanda, D. Lodh, N.K.
Karan, R.K. Dhar, D.K. Tamili, D. Das, K.C. Saha, and D. Chakraborti (1996),
‘Arsenic in Groundwater in Seven Districts of West Bengal, India: The Biggest
Arsenic Calamity in the World’, Current Science, 70(11), pp. 976–986.
Matus, K., K.M. Nam, N.E. Selin, L.N. Lamsal, J.M. Reilly, and S. Paltsev (2011),
‘Health Damages from Air Pollution in China’, MIT Joint Program on the
Science and Policy of Global Change, Report No. 196, Boston.
McCarty, N., D. Still, and D. Ogle (2010), ‘Fuel Use and Emissions Performance of
Fifty Cooking Stoves in the Laboratory and Related Benchmarks of
Performance’, Energy for Sustainable Development, 14, pp. 161–171.
MEP (Ministry of Environmental Protection – Government of China) (2010), 2009
Report on the State of the Environment in China (English translation).
http://english.mep.gov.cn/standards_reports/soe/soe2009/201104/t20110411_
208979.htm (accessed 17 January 2015).
Meyfroidt, P., T.K. Rudel, and E.F. Lambin (2010), ‘Forest Transitions, Trade, and
the Global Displacement of Land Use’, Proceedings of the National Academy
of Sciences, published online 15 November 2010.
http://www.pnas.org/cgi/doi/10.1073/pnas.1014773107 (accessed 17 January
2015).
63
Middleton, C., J. Garcia, and T. Foran (2009), ‘Old and New Hydropower Players in
the Mekong Region: Agendas and Strategies’, in F. Molle, T. Foran, and M.
Kakonen (eds.), Contested Waterscapes in the Mekong Region. London, UK:
Earthscan.
Ministry of the Environment (2010), Annual Report on the Environment, the Sound
Material-Cycle Society and the Biodiversity 2009. Tokyo: Ministry of the
Environment. https://www.env.go.jp/en/wpaper/2009/fulltext.pdf
Molle, F., T. Foran, and P. Floch (2009), ‘Introduction: Changing Waterscapes in the
Mekong Region - Historical Background and Context’, in F. Molle, T. Foran,
and M. Kakonen (eds.) Contested Waterscapes in the Mekong Region. London,
UK: Earthscan.
Morton, K. (2011), ‘Climate Change and Security at the Third Pole’, Survival, 53(1),
pp. 121–132.
MRC (2011a), ‘IWRM-based Basin Development Strategy for the Lower Mekong
Basin’, http://www.mrcmekong.org/17thCouncil/IWRM-based-Basin-Dev-
Strategy-approved-by-MRC-Council-260111.pdf (accessed 17 January 2015).
MRC (2011b), Website of the Mekong River Commission,
http://www.mekongmrc.org
MRC (2011c), ‘Prior Consultation Project Review Report: Proposed Xayaburi Dam
Project – Mekong River’. http://www.mrcmekong.org/PNPCA/2011-03-
24_MRCS_PC_Review_Report.pdf
MRC (2011d), ‘Reply Forms of Notified Countries’, Home page of the Proposed
Xayaburi Hydropower Project Prior Consultation Process.
http://www.mrcmekong.org/pnpca/PNPCA-technical-process.htm
MRC (Mekong River Commission) (2010), ‘Strategic Environmental Assessment for
Hydropower on the Mekong Mainstream’.
http://www.mrcmekong.org/ish/SEA/SEA-Main-Final-Report.pdf (accessed
17 January 2015).
Munoz, P., S. Giljum, and J. Roca (2009), ‘The Raw Material Equivalents of
International Trade: Empirical Evidence for Latin America, Journal of
Industrial Ecology, 13, pp. 881–897.
Narain, U., and A. Krupnik (2007), The Impact of Delhi’s CNG Program on Air
Quality, Resources for the Future Discussion Paper.
http://papers.ssrn.com/sol3/papers.cfm?abstract_id=969727 (accessed 17
January 2015).
NBS (National Bureau of Statistics of China) (2010), 2009 China Statistical Yearbook.
Beijing: China Statistics Press.
NDRC (2011), China’s 12th Five Year Plan (2011–2015), English translation by the
Delegation of the European Union in China.
http://cbi.typepad.com/china_direct/agriculture/ (accessed 17 January 2015).
64
NDRC (National Development and Reform Commission (2007), Medium and Long-
Term Development Plan for Renewable Energy in China.
http://www.iea.org/textbase/pm/?mode=cc&id=4129&action=detail (accessed
17 January 2015).
Nordhaus, W.D. (1974), ‘Resources as a Constraint on Growth’, American Economic
Review, 64 (May): 22–26.
OECD (2007), Measuring Material Flows and Resource Productivity. The OECD
guide. ENV/EPOC/SE(2006)1/REV3, Environment Directorate. Paris:
Organisation for Economic Co-operation and Development.
OECD (2008), OECD Environmental Data Compendium. Environmental Performance
and Information Division. Paris: OECD Environment Directorate.
OECD (Organisation for Economic Co-operation and Development (2011), Towards
Green Growth. http://www.oecd.org/dataoecd/37/34/48224539.pdf (accessed
17 January 2015).
Page, S., F. Siegert, J.O. Rieley, H.D.V. Boehm, A. Jaya, and S. Limin (2002), ‘The
Amount of Carbon Released from Peat and Forest Fires in Indonesia During
1997’, Nature, 420, pp. 61–65.
Palmer, C. (2001), ‘The Extent and Causes of Illegal Logging: An Analysis of a Major
Cause of Tropical Deforestation in Indonesia’, CSERGE Working Paper.
London: University College London.
http://discovery.ucl.ac.uk/17588/1/17588.pdf (accessed 17 January 2015).
PBL (Netherlands Environmental Assessment Agency) (2010), Database associated
with J. Olivier and J. Peters, ‘No growth in total global CO2 emissions in 2009’.
Bithoven, The Netherlands: Netherlands Environmental Assessment Agency.
http://www.pbl.nl/en/publications/2010/No-growth-in-total-global-CO2-
emissions-in-2009.html
Porter, M., and C. van der Linde (1995), ‘Toward a New Conception of the
Environment-Competitiveness Relationship’, Journal of Economic
Perspective, 9(4), pp. 97–118.
Powering Progress (2011), Laos Government website for hydropower development,
http://www.poweringprogress.org (accessed 17 January 2015).
Price, L., M.D. Levine, N. Zhou, D. Fridley, N. Aden, H. Lu, M. McNeil, N. Zheng,
Y. Qin, and P. Yowargana (2011), ‘Assessment of China’s Energy-saving and
Emission-reduction Accomplishments and Opportunities During the 11th Five
Year Plan’, Energy Policy, 39, pp. 2165–2178.
Raffer, O.K., and H.W. Singer (2001), The Economic North-South Divide: Six
Decades of Unequal Development. Cheltenham: Edward Elgar.
Ramanathan, V., and G. Carmichael (2008), ‘Global and Regional Climate Changes
Due to Black Carbon’, Nature Geoscience, 1, pp. 221–227.
Rehfeuss, E.A., N.G. Bruce, and K.R. Smith (2011), ‘Solid Fuel Use: Health Effect’,
Encyclopaedia of Environmental Health, 5, pp. 150–161.
65
Renewable Energy Policy Network for the 21st Century, Renewable Global Status
Report 2010 (Paris, REN21 Secretariat),
http://www.ren21.net/Portals/0/documents/activities/gsr/REN21_GSR_2010_
full_revised%20Sept2010.pdf
Reuters (2011), Laos Defies Neighbours on Dam Project: Environmentalists, 23 June
2011. http://www.reuters.com/article/2011/06/23/us-laos-dam-
idUSTRE75M2DE20110623 (accessed 17 January 2015).
Rodell, M., I. Velicogna, and J.S. Famiglietti (2009), ‘Satellite-based Estimates of
Groundwater Depletion in India’, Nature, 460, pp. 999–1002.
Rosen, D.H., and T. Houser (2007), China Energy: A Guide for the Perplexed.
Washington, DC: The Centre for Strategic and International Studies and
Peterson Institute for International Economics.
Rozenberg J., S. Hallegatte, A. Vogt-Schilb, O. Sassi, C. Guivarch, H. Waisman, and
J.C. Hourcade (2010), ‘Climate Policies as a Hedge Against the Uncertainty
on Future Oil Supply’, Climatic Change Letters, 101(3), pp. 663–669.
Russi, D., A.C. Gonzalez-Martinez, J.C. Silva-Macher, S. Giljum, J. Martinez-Alier,
M.C. Vallejo (2008), ‘Material Flows in Latin America: A Comparative
Analysis of Chile, Ecuador, Mexico and Peru, 1980–2000’, Journal of
Industrial Ecology, 12(5/6), pp. 704–720.
Sachs, J.D., and A.M. Warner (1999), ‘Natural Resource Intensity and Economic
Growth’, in J. Mayer, B. Chambers, A. Farooq (eds.), Development Policies in
Natural Resource Economies. Cheltenham: Edward Elgar.
Sarkkula, J., M. Keskinen, J. Koponen, M. Kummu, J. Richey, and O. Varis (2009),
‘Hydropower in the Mekong Region: What are the Likely Impacts upon
Fisheries’, in F. Molle, T. Foran, and M. Kakonen (eds.), Contested
Waterscapes in the Mekong Region. London, UK: Earthscan.
Schandl, H., J. West (forthcoming), Resource Use and Resource Efficiency in the
Asia-Pacific Region. Global Environmental Change.
Schütz, H., S. Bringezu, and S. Moll (2004), Globalisation and the Shifting
Environmental Burden. Material Trade Flows of the European Union.
Wuppertal: Wuppertal Institute.
SERI (2010), Technical Report on the compilation of the material flow database for
www.materialflows.net.
SERI, Global (2000), Friends of the Earth Europe. 2009. Overconsumption? Our use
of the world's natural resources. Vienna & Brussels.
Shah, T. (2011), Innovations in Groundwater Management: Examples from India.
International Water Management Institute.
http://rosenberg.ucanr.org/documents/argentina/Tushar%20Shah%20Final.pd
f (accessed 17 January 2015).
Si, M. (2011), ’China’s forestry fudge?’, China Dialogue. 29 April 2011.
http://www.chinadialogue.net/article/show/single/en/4259-China-s-forestry-
fudge- (accessed 17 January 2015).
66
Sinton, J. E., K.R. Smith, J.W. Peabody, L. Yaping, Z. Xiliang, R. Edwards, and G.
Quan (2004), ‘An Assessment of Programs to Promote Improved Household
Stoves in China’, Energy for Sustainable Development, 8(3), pp. 33–52.
Slaski, X., and Mark Thurber (2009), ‘Research Note: Cookstoves and Obstacles to
Technology Adoption by the Poor’, Stanford Program on Energy and
Sustainable Development Working Paper #89.
http://pesd.stanford.edu/publications/cookstoves_and_obstacles_to_technolog
y_adoption_by_the_poor/ (accessed 17 January 2015).
Smith, K.R., G. Shuhua, H. Kun, and Q. Daxiong (1993), ‘One Hundred Million
Improved Cookstoves in China: How Was It Done?’, World Development,
21(6), pp. 941–961.
Solow, R.M. (1956), ‘A Contribution to the Theory of Economic Growth, Quarterly
Journal of Economics, 70(1), pp. 65–94.
Solow, R.M. (1974), ‘The Economics of Resources or the Resources of Economics’,
American Economic Review, 64, pp. 1–14.
Stern, D. (2004), ‘The Rise and Fall of the Environmental Kuznets Curve’, World
Development, 32(8), pp. 1419–1439.
Stiglitz, J.E., A. Sen, and J.P. Fitoussi (2009), Report by the Commission on the
Measurement of Economic Performance and Social Progress.
http://www.stiglitz-sen-fitoussi.fr/documents/rapport_anglais.pdf (accessed
17 January 2015).
Sun, G., G. Zhou, Z. Zhang, X. Wei, S. McNulty, and J. Vose (2006), ‘Potential Water
Yield Reduction Due to Forestation Across China’, Journal of Hydrology, 328,
pp. 548–558.
Tacconi, L., F. Jotzo, and R.Q. Grafton (2008), ‘Local Causes, Regional Co-operation
and Global Financing for Environmental Problems: The Case of Southeast
Asian Haze Pollution’, International Environmental Agreements, 8, pp. 1–16.
The Economic Toll’, Economy and Environment Program for Southeast Asia/ World
Wide Fund for Nature (2003), The Indonesian Fires and Haze of 1997: The
Economic Toll. http://www.idrc.ca/uploads/user-S/10536124150ACF62.pdf
(accessed 17 January 2015).
Trac, C., S. Harrell, T. Hincklet, and A. Henck (2007), ‘Reforestation Programs in
Southwest China: Reported Success, Observed Failure, and the Reasons Why’,
Journal of Mountain Science, 4(4), pp. 275–292.
UN (2004), World Population to 2300. New York: Department of Economic and
Social Affairs of the United Nations Secretariat.
http://www.un.org/esa/population/publications/longrange2/WorldPop2300fin
al.pdf
UN (United Nations) (2009), World Urbanization Prospects: The 2009 Revision.
United Nations Population Division.
http://esa.un.org/unpd/wup/unup/index_panel1.html (accessed 17 January
2015).
67
UN (2010), World Population Projections 2010. United Nations Department of
Economic and Social Affairs.
http://esa.un.org/unpd/wpp/unpp/panel_population.htm (accessed 17 January
2015).
UNCTAD (United Nations Conference on Trade and Development) (2010), Trade and
Environment Review 2009/2010. Geneva: UNCTAD.
UNDP (United Nations Development Program) (2010), China and a Sustainable
Future: Towards a Low Carbon Economy and Society, China Human
Development Report 2009/10. Beijing: China Publishing Group Corporation.
UNEP (2000), Global Environment Outlook.
http://www.unep.org/Geo2000/english/index.htm (accessed 17 January 2015).
UNEP (United Nations Environment Programme) (2008), Atmospheric Brown Clouds:
Regional Assessment Report with Focus on Asia.
http://www.unep.org/pdf/ABCSummaryFinal.pdf (accessed 17 January 2015).
UNEP/WMO (United Nations Environment Programme/World Meteorological
Organization (2011), Integrated Assessment of Black Carbon and
Tropospheric Ozone: Summary for Decision Makers.
http://www.unep.org/dewa/Portals/67/pdf/Black_Carbon.pdf (accessed 17
January 2015).
Venkataraman, C., A.D. Sager, G. Habib, N. Lam, and K.R. Smith (2010), ‘The Indian
National Initiative for Advanced Biomass Cookstoves: The Benefits of Clean
Combustion’, Energy for Sustainable Development, 14, pp. 63–72.
Verchot, L., E. Petkova, K. Obidzinski, S. Atmadja, E. Yuliani, A. Dermawan, D.
Murdiyarso, and A. Salwa (2010), Reducing Forestry Emissions in Indonesia.,
Centre for International Forestry Research.
http://www.cifor.cgiar.org/publications/pdf_files/Books/BVerchot0101.pdf
(accessed 17 January 2015).
Verchot, L., E. Petkova, K. Obidzinski, S. Atmadja, E. Yuliani, A. Dermawan, D.
Murdiyarso, and A. Salwa (2010), Reducing Forestry Emissions in Indonesia.
Centre for International Forestry Research.
http://www.cifor.cgiar.org/publications/pdf_files/Books/BVerchot0101.pdf
(accessed 17 January 2015).
Victor, P.A. (2008), Managing Without Growth: Slower by Design, Not Disaster.
Amsterdam: Edward Elgar Publishing.
Vienna: Sustainable Europe Research Institute.((??))
Von Weizsäcker, E.U., K. Hargroves, M.H. Smith, C. Deshaand, P. Stasinopoulos
(2009), Factor Five. Transforming the Global Economy through 80%
Improvements in Resource Productivity. London: Earthscan.
Vorosmarty, C.J., P.B. McIntyre, M.O. Gessner, D. Dudgeon, A. Prusevich, P. Green,
S. Glidden, S.E. Bunn, C.A. Sullivan, C.R. Liermann, and P.M. Davies (2010),
‘Global Threats to Human Water Security and River Biodiversity’, Nature, 467,
pp. 555–561.
68
Wang, G., J.L. Innes, S.W. Wu, and S. Dai (2007), ‘China’s Forestry Reforms’,
Science, 318, pp. 1556–1557.
Wang, G., J.L. Innes, S.W. Wu, and S. Dai (2008), ‘Towards a New Paradigm: The
Development of China's Forestry in the 21st Century’, International Forestry
Review, 10(4), pp. 619–631.
Wang, X., F. Chen, E. Hasi, and J. Li (2008), ‘Desertification in China: An
Assessment’, Earth-Science Reviews, 88, pp. 188–206.
Water and Sanitation Program (2008), Economic Impacts of Sanitation in Southeast
Asia: A four-country study conducted in Cambodia, Indonesia, the Philippines
and Vietnam under the Economics of Sanitation Initiative (ESI). Jakarta: World
Bank.
http://www.wsp.org/sites/wsp.org/files/publications/Sanitation_Impact_Synth
esis_2.pdf
Water Resources Group (2009), Charting Our Water Future: Economic frameworks
to inform decision-making. Report of the 2030 Water Resources Group.
http://www.mckinsey.com/App_Media/Reports/Water/Charting_Our_Water_
Future_Full_Report_001.pdf (accessed 17 January 2015).
WCD (World Commission on Dams) (2000), Dams and Development: A New
Framework for Decision-Making, Report of the World Commission on Dams.
London, UK: Earthscan.
WCED (World Commission on Environment and Development) (1987), Our Common
Future: The World Commission on Environment and Development. Oxford:
Oxford University Press.
Weisz, H., F. Krausmann, C. Amann, N. Eisenmenger, K.H. Erb, K. Hubacek, and M.
Fischer-Kowalski (2006), ‘The Physical Economy of the European Union:
Cross-country Comparison and Determinants of Material Consumption,’
Ecological Economics, 58(4), p. 676.
Wells, P., and G. Paoli (2011), An Analysis of Presidential Instruction No. 10, 2011:
Moratorium on Granting of New Licenses and Improvement of Natural
Primary Forest and Peatland Governance. Bogor, Indonesia: Daemeter
Consulting. http://www.daemeter.org/wp-
content/files/Daemeter_Moratorium_Analysis_20110527_FINAL.pdf
(accessed 17 January 2015).
White, A., X. Sun, K. Canby, J. Xu, C. Barr, E. Katsigris, G. Bull, C. Cossalter, and S.
Nilsson (2006), China and the Global Market for Forest Products. Washington,
DC: Forest Trends/Centre for International Forestry Research.
http://www.forest-trends.org/publication_details.php?publicationID=103
(accessed 17 January 2015).
WHO (World Health Organization) (2009a), National Statistics for Indoor Air
Pollution – Burden of Disease.
http://www.who.int/indoorair/health_impacts/burden_national/en/index.html
(accessed 17 January 2015).
69
WHO (2009b), Global Health Risks: Mortality and burden of disease attributable to
selected major risks. Geneva: World Health Organization.
http://www.who.int/healthinfo/global_burden_disease/GlobalHealthRisks_re
port_full.pdf
WHO (2010), Accompanying Data to ‘World Health Statistics 2010’. WHO Statistical
Information System. http://www.who.int/whosis/whostat/2010/en/index.html
(accessed 17 January 2015).
WHO (2011), Global Health Observatory Data Repository.
http://apps.who.int/ghodata/?vid=10011 (accessed 17 January 2015).
WHO/UNICEF (2008), Progress on Sanitation and Drinking Water: 2008 Update
Joint Monitoring Programme for Water Supply and Sanitation.
http://www.wssinfo.org/data-estimates/introduction/ (accessed 17 January
2015).
World Bank (2005), ‘For a Breath of Fresh Air: Ten Years of Progress and Challenges
in Urban Air Quality Management in India 1993–2002’, Environment and
Social Development Unit South Asia Region, World Bank.
World Bank (2010), Deep Wells and Prudence: Towards Pragmatic Action for
Addressing Groundwater Overexploitation in India. Washington, DC:
IBRD/World Bank.
World Bank (2011), ‘Household Cookstoves, Environment, Health, and Climate
Change: A New Look at an Old Problem’, The Environment Department
(Climate Change), Washington, DC: IRD/World Bank. http://www-
wds.worldbank.org/external/default/WDSContentServer/WDSP/IB/2011/07/2
0/000386194_20110720022733/Rendered/PDF/632170WP0House00Box036
1508B0PUBLIC0.pdf
World Bank and DRC (Development Research Center of the State Council, the
People’s Republic of China) (2012) Seizing the Opportunity of Green
Development in China. Supporting Report 3 for China 2030: Building a
Modern Harmonious, and Creative High-Income Society, Conference Edition,
Washington, DC: World Bank.
Xinhua (2011), China to Launch Carbon Emissions Trading Pilot Project. July 17.
http://news.xinhuanet.com/english2010/china/2011-
07/17/c_13990818.htm (accessed 17 January 2015).
Yin, R., and G. Yin (2010), ‘China’s Primary Programs of Terrestrial Ecosystem
Restoration: Initiation, Implementation, and Challenges’, Environmental
Management, 45, pp. 429–441.
Zakaria, S., and S. Leitner (2011), ‘Southeast Asia: Water Security’, part of the
background paper, ‘Water Security for ASEAN, China and India’ prepared for
ADBI/ADB’s study ‘ASEAN, China and India: 2030’.
Zenghelis, D. (2011), A Macroeconomic Plan for a Green Recovery. London:
Grantham Research Institute on Climate Change and the Environment.
Zhang, Z.X. (2008), ‘Asian Energy and Environmental Policy: Promoting Growth
Whilst Preserving the Environment’, Energy Policy, 36, pp. 3905–3924.

70
Zhou, N., M.D. Levine, and L. Price (2010), ‘Overview of Current Energy-efficiency
Policies in China’, Energy Policy, 38, pp. 6439–6452.
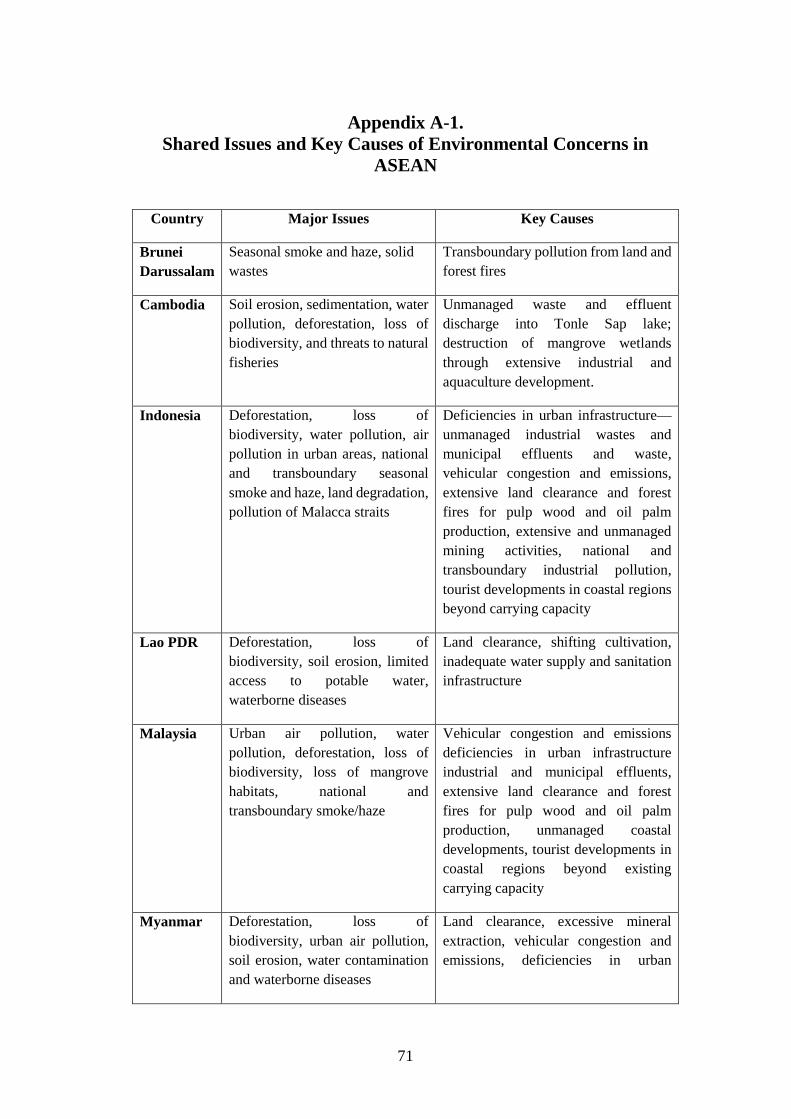
71
Appendix A-1.
Shared Issues and Key Causes of Environmental Concerns in
ASEAN
Country Major Issues Key Causes
Brunei
Darussalam
Seasonal smoke and haze, solid
wastes
Transboundary pollution from land and
forest fires
Cambodia Soil erosion, sedimentation, water
pollution, deforestation, loss of
biodiversity, and threats to natural
fisheries
Unmanaged waste and effluent
discharge into Tonle Sap lake;
destruction of mangrove wetlands
through extensive industrial and
aquaculture development.
Indonesia Deforestation, loss of
biodiversity, water pollution, air
pollution in urban areas, national
and transboundary seasonal
smoke and haze, land degradation,
pollution of Malacca straits
Deficiencies in urban infrastructure—
unmanaged industrial wastes and
municipal effluents and waste,
vehicular congestion and emissions,
extensive land clearance and forest
fires for pulp wood and oil palm
production, extensive and unmanaged
mining activities, national and
transboundary industrial pollution,
tourist developments in coastal regions
beyond carrying capacity
Lao PDR Deforestation, loss of
biodiversity, soil erosion, limited
access to potable water,
waterborne diseases
Land clearance, shifting cultivation,
inadequate water supply and sanitation
infrastructure
Malaysia Urban air pollution, water
pollution, deforestation, loss of
biodiversity, loss of mangrove
habitats, national and
transboundary smoke/haze
Vehicular congestion and emissions
deficiencies in urban infrastructure
industrial and municipal effluents,
extensive land clearance and forest
fires for pulp wood and oil palm
production, unmanaged coastal
developments, tourist developments in
coastal regions beyond existing
carrying capacity
Myanmar Deforestation, loss of
biodiversity, urban air pollution,
soil erosion, water contamination
and waterborne diseases
Land clearance, excessive mineral
extraction, vehicular congestion and
emissions, deficiencies in urban
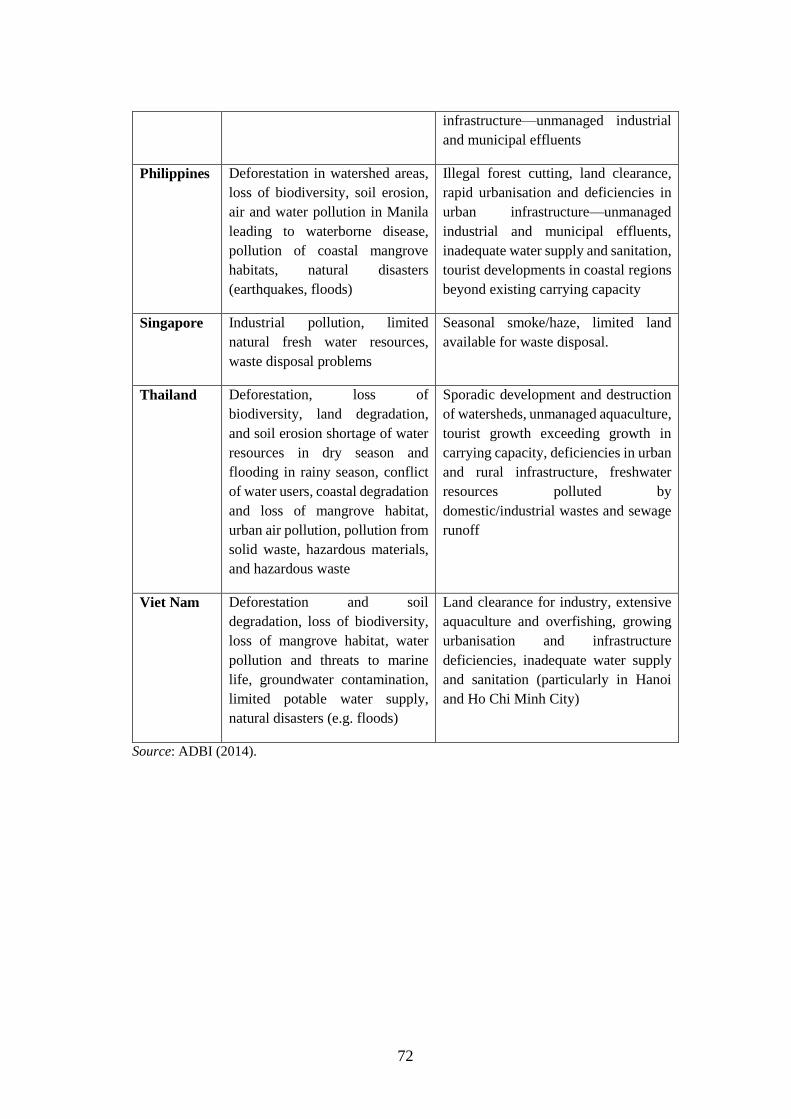
72
infrastructure—unmanaged industrial
and municipal effluents
Philippines Deforestation in watershed areas,
loss of biodiversity, soil erosion,
air and water pollution in Manila
leading to waterborne disease,
pollution of coastal mangrove
habitats, natural disasters
(earthquakes, floods)
Illegal forest cutting, land clearance,
rapid urbanisation and deficiencies in
urban infrastructure—unmanaged
industrial and municipal effluents,
inadequate water supply and sanitation,
tourist developments in coastal regions
beyond existing carrying capacity
Singapore Industrial pollution, limited
natural fresh water resources,
waste disposal problems
Seasonal smoke/haze, limited land
available for waste disposal.
Thailand Deforestation, loss of
biodiversity, land degradation,
and soil erosion shortage of water
resources in dry season and
flooding in rainy season, conflict
of water users, coastal degradation
and loss of mangrove habitat,
urban air pollution, pollution from
solid waste, hazardous materials,
and hazardous waste
Sporadic development and destruction
of watersheds, unmanaged aquaculture,
tourist growth exceeding growth in
carrying capacity, deficiencies in urban
and rural infrastructure, freshwater
resources polluted by
domestic/industrial wastes and sewage
runoff
Viet Nam Deforestation and soil
degradation, loss of biodiversity,
loss of mangrove habitat, water
pollution and threats to marine
life, groundwater contamination,
limited potable water supply,
natural disasters (e.g. floods)
Land clearance for industry, extensive
aquaculture and overfishing, growing
urbanisation and infrastructure
deficiencies, inadequate water supply
and sanitation (particularly in Hanoi
and Ho Chi Minh City)
Source: ADBI (2014).
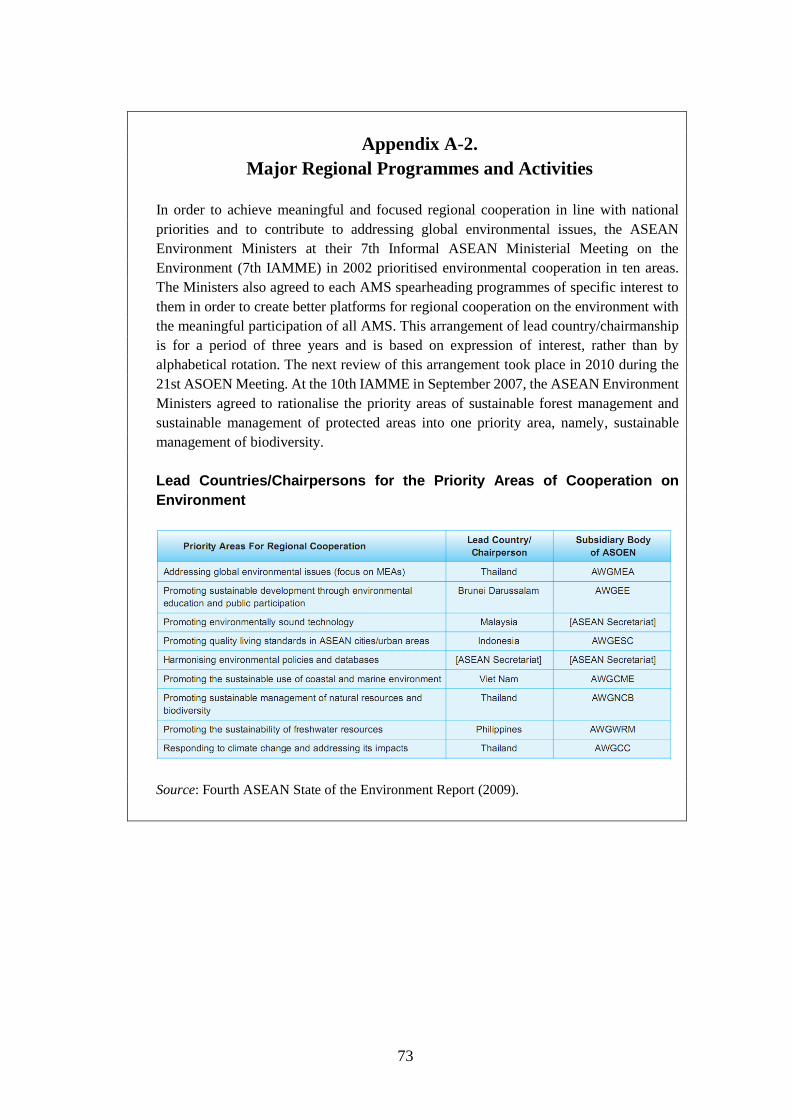
73
Appendix A-2.
Major Regional Programmes and Activities
In order to achieve meaningful and focused regional cooperation in line with national
priorities and to contribute to addressing global environmental issues, the ASEAN
Environment Ministers at their 7th Informal ASEAN Ministerial Meeting on the
Environment (7th IAMME) in 2002 prioritised environmental cooperation in ten areas.
The Ministers also agreed to each AMS spearheading programmes of specific interest to
them in order to create better platforms for regional cooperation on the environment with
the meaningful participation of all AMS. This arrangement of lead country/chairmanship
is for a period of three years and is based on expression of interest, rather than by
alphabetical rotation. The next review of this arrangement took place in 2010 during the
21st ASOEN Meeting. At the 10th IAMME in September 2007, the ASEAN Environment
Ministers agreed to rationalise the priority areas of sustainable forest management and
sustainable management of protected areas into one priority area, namely, sustainable
management of biodiversity.
Lead Countries/Chairpersons for the Priority Areas of Cooperation on
Environment
Source: Fourth ASEAN State of the Environment Report (2009).
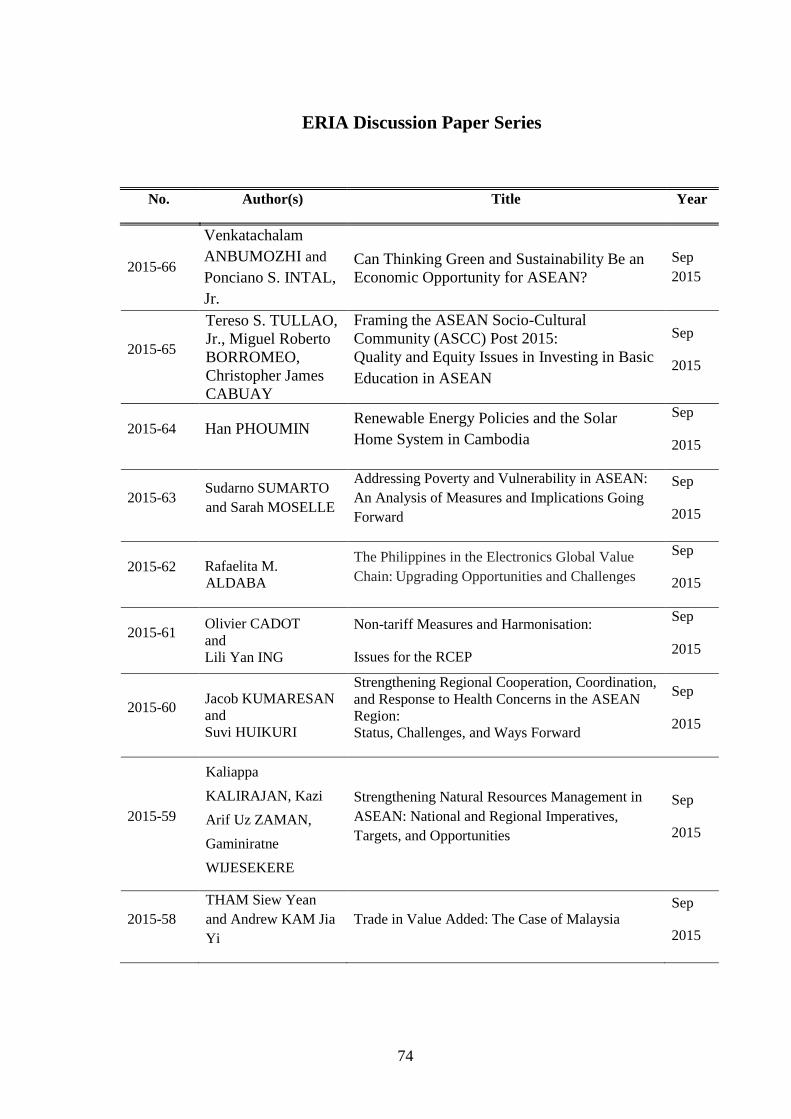
74
ERIA Discussion Paper Series
No. Author(s) Title Year
2015-66
Venkatachalam
ANBUMOZHI and
Ponciano S. INTAL,
Jr.
Can Thinking Green and Sustainability Be an
Economic Opportunity for ASEAN?
Sep
2015
2015-65
Tereso S. TULLAO,
Jr., Miguel Roberto
BORROMEO,
Christopher James
CABUAY
Framing the ASEAN Socio-Cultural
Community (ASCC) Post 2015:
Quality and Equity Issues in Investing in Basic
Education in ASEAN
Sep
2015
2015-64 Han PHOUMIN Renewable Energy Policies and the Solar
Home System in Cambodia
Sep
2015
2015-63 Sudarno SUMARTO
and Sarah MOSELLE
Addressing Poverty and Vulnerability in ASEAN:
An Analysis of Measures and Implications Going
Forward
Sep
2015
2015-62 Rafaelita M.
ALDABA
The Philippines in the Electronics Global Value
Chain: Upgrading Opportunities and Challenges
Sep
2015
2015-61 Olivier CADOT
and
Lili Yan ING
Non-tariff Measures and Harmonisation:
Issues for the RCEP
Sep
2015
2015-60 Jacob KUMARESAN
and
Suvi HUIKURI
Strengthening Regional Cooperation, Coordination,
and Response to Health Concerns in the ASEAN
Region:
Status, Challenges, and Ways Forward
Sep
2015
2015-59
Kaliappa
KALIRAJAN, Kazi
Arif Uz ZAMAN,
Gaminiratne
WIJESEKERE
Strengthening Natural Resources Management in
ASEAN: National and Regional Imperatives,
Targets, and Opportunities
Sep
2015
2015-58
THAM Siew Yean
and Andrew KAM Jia
Yi
Trade in Value Added: The Case of Malaysia Sep
2015
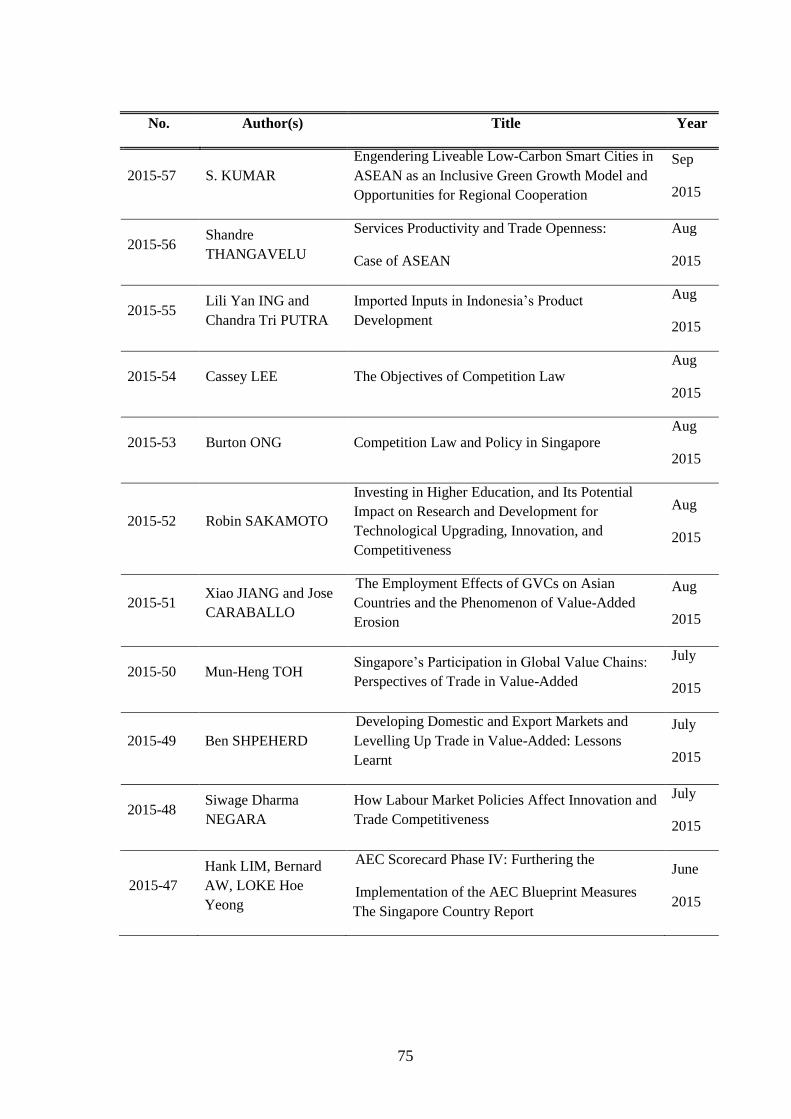
75
No. Author(s) Title Year
2015-57 S. KUMAR
Engendering Liveable Low-Carbon Smart Cities in
ASEAN as an Inclusive Green Growth Model and
Opportunities for Regional Cooperation
Sep
2015
2015-56 Shandre
THANGAVELU
Services Productivity and Trade Openness:
Case of ASEAN
Aug
2015
2015-55 Lili Yan ING and
Chandra Tri PUTRA
Imported Inputs in Indonesia’s Product
Development
Aug
2015
2015-54 Cassey LEE The Objectives of Competition Law Aug
2015
2015-53 Burton ONG Competition Law and Policy in Singapore Aug
2015
2015-52 Robin SAKAMOTO
Investing in Higher Education, and Its Potential
Impact on Research and Development for
Technological Upgrading, Innovation, and
Competitiveness
Aug
2015
2015-51 Xiao JIANG and Jose
CARABALLO
The Employment Effects of GVCs on Asian
Countries and the Phenomenon of Value-Added
Erosion
Aug
2015
2015-50 Mun-Heng TOH Singapore’s Participation in Global Value Chains:
Perspectives of Trade in Value-Added
July
2015
2015-49 Ben SHPEHERD
Developing Domestic and Export Markets and
Levelling Up Trade in Value-Added: Lessons
Learnt
July
2015
2015-48 Siwage Dharma
NEGARA
How Labour Market Policies Affect Innovation and
Trade Competitiveness
July
2015
2015-47
Hank LIM, Bernard
AW, LOKE Hoe
Yeong
AEC Scorecard Phase IV: Furthering the
Implementation of the AEC Blueprint Measures
The Singapore Country Report
June
2015
76
No. Author(s) Title Year
2015-46
Saowaruj
RATTANAKHAMFU
, Sumet
ONGKITTIKUL,
Nutthawut,
LAKSANAPUNYAK
UL, Nichamon
THONGPAT,
Natcha O-CHAROEN
Thailand Country Study ASEAN Economic
Community Blueprint Mid-term Review Project
June
2015
2015-45 Koji KUBO Evolving Informal Remittance Methods of
Myanmar Migrant Workers in Thailand
June
2015
2015-44 Philippa DEE Monitoring the Implementation of Services Trade
Reform towards an ASEAN Economic Community
May
2015
2015-43 Shandre
THANGAVELU
FDI Restrictiveness Index for ASEAN:
Implementation of AEC Blueprint Measures
May
2015
2015-42
Rully PRASSETYA
and Ponciano S.
INTAL, Jr.
AEC Blueprint Implementation Performance and
Challenges: Standards and Conformance
May
2015
2015-41 Ponciano INTAL Jr. AEC Blueprint Implementation Performance and
Challenges: Trade Facilitation
May
2015
2015-40
Fukunari KIMURA,
Tomohiro
MACHIKITA, and
Yasushi UEKI
Technology Transfer in ASEAN Countries: Some
Evidence from Buyer-Provided Training Network
Data
May
2015
2015-39 Dionisius NARJOKO AEC Blueprint Implementation Performance and
Challenges: Services Liberalization
May
2015
2015-38
Kazunobu
HAYAKAWA,
Nuttawut
LAKSANAPANYAK
UL, Shujiro URATA
Measuring the Costs of FTA Utilization: Evidence
from Transaction-level Import Data of Thailand
May
2015
2015-37 Kazunobu
HAYAKAWA,
Government Strategy and Support for Regional
Trade Agreements: The Case of Thailand May
77
No. Author(s) Title Year
Nuttawut
LAKSANAPANYAK
UL, Pisit PUAPAN,
Sastra SUDSAWASD
2015
2015-36 Dionisius A.
NARJOKO
AEC Blueprint Implementation Performance and
Challenges: Non-Tariff Measures and Non-Tariff
Barriers
May
2015
2015-35
Kazunobu
HAYAKAWA,
Tadashi ITO, and
Fukunari KIMURA
Trade Creation Effects of Regional Trade
Agreements: Tariff Reduction versus Non-tariff
Barrier Removal
Apr
2015
2015-34
Kazunobu
HAYAKAWA,
Tadashi ITO
Tarrif Pass-through of the World-wide Trade:
Empirical Evidence at Tarriff-line Level
Apr
2015
2015-33
Kazubobu
HAYAKAWA,
Nuttawut
LAKSANAPNYAKU
L, and Shujiro
URATA
Firm-level Impact of Free Trade Agreements on
Import Prices
Apr
2015
2015-32 Ponciano INTAL, Jr. AEC Blueprint Implementation Performance and
Challenges: Investment Liberalization
Apr
2015
2015-31 Emily Christi A.
CABEGIN
The Challenge of China and the Role of Deepening
ASEAN Integration for the Philippine
Semiconductor Industry
Apr
2015
2015-30
Venkatachalam
ANBUMOZHI, Alex
BOWEN and
Puthusserikunnel
Devasia JOSE
Market-Based Mechanisms to Promote Renewable
Energy in Asia
Apr
2015
2015-29 Venkatachalam
ANBUMOZHI
Low Carbon Green Growth in Asia: What is the
Scope for Regional Cooperation?
Apr
2015
2015-28 Tan LI and Larry D.
QIU
Beyond Trade Creation: Free Trade Agreements
and Trade Disputes
Mar
2015
78
No. Author(s) Title Year
2015-27 Mai Anh NGO Exporting and Firm-Level Credit Constraints –
Evidence from Ghana
Mar
2015
2015-26
Sunghoon CHUNG,
Joonhyung LEE,
Thomas OSANG
Did China Tire Safeguard Save U.S. Workers? Mar
2015
2015-25
Esther Ann BØLER,
Beata JAVORCIK,
Karen Helene
ULLTVEI-MOE
Globalization: A Woman’s Best Friend? Exporters
and the Gender Wage Gap
Mar
2015
2015-24 Tristan Leo Dallo
AGUSTIN and Martin
SCHRÖDER
The Indian Automotive Industry and the ASEAN
Supply Chain Relations
Mar
2015
2015-23 Hideo KOBAYASHI
and Yingshan JIN The CLMV Automobile and Auto Parts Industry
Mar
2015
2015-22 Hideo KOBAYASHI
Current State and Issues of the Automobile and Auto
Parts Industries in ASEAN
Mar
2015
2015-21 Yoshifumi
FUKUNAGA
Assessing the Progress of ASEAN MRAs on
Professional Services
Mar
2015
2015-20 Yoshifumi
FUKUNAGA and
Hikari ISHIDO
Values and Limitations of the ASEAN Agreement
on the Movement of Natural Persons
Mar
2015
2015-19 Nanda NURRIDZKI Learning from the ASEAN + 1 Model and the ACIA
Mar
2015
2015-18
Patarapong
INTARAKUMNERD
and Pun-Arj
CHAIRATANA and
Preeda
CHAYANAJIT
Global Production Networks and Host-Site
Industrial Upgrading: The Case of the
Semiconductor Industry in Thailand
Feb
2015
2015-17 Rajah RASIAH and
Yap Xiao SHAN
Institutional Support, Regional Trade Linkages and
Technological Capabilities in the Semiconductor
Industry in Singapore
Feb
2015
79
No. Author(s) Title Year
2015-16 Rajah RASIAH and
Yap Xiao SHAN
Institutional Support, Regional Trade Linkages and
Technological Capabilities in the Semiconductor
Industry in Malaysia
Feb
2015
2015-15 Xin Xin KONG, Miao
ZHANG and Santha
Chenayah RAMU
China’s Semiconductor Industry in Global Value
Chains
Feb
2015
2015-14 Tin Htoo NAING and
Yap Su FEI
Multinationals, Technology and Regional Linkages
in Myanmar’s Clothing Industry
Feb
2015
2015-13 Vanthana NOLINTHA
and Idris JAJRI
The Garment Industry in Laos: Technological
Capabilities, Global Production Chains and
Competitiveness
Feb
2015
2015-12 Miao ZHANG, Xin
Xin KONG, Santha
Chenayah RAMU
The Transformation of the Clothing Industry in
China
Feb
2015
2015-11
NGUYEN Dinh Chuc,
NGUYEN Ngoc Anh,
NGUYEN Ha Trang
and NGUYEN Ngoc
Minh
Host-site institutions, Regional Production Linkages and Technological Upgrading: A study of Automotive Firms in Vietnam
Feb
2015
2015-10
Pararapong
INTERAKUMNERD
and Kriengkrai
TECHAKANONT
Intra-industry Trade, Product Fragmentation and Technological Capability Development in Thai Automotive Industry
Feb
2015
2015-09 Rene E. OFRENEO
Auto and Car Parts Production: Can the Philippines Catch Up with Asia
Feb
2015
2015-08
Rajah RASIAH, Rafat
Beigpoor
SHAHRIVAR,
Abdusy Syakur AMIN
Host-site Support, Foreign Ownership, Regional Linkages and Technological Capabilites: Evidence from Automotive Firms in Indonesia
Feb
2015
2015-07 Yansheng LI, Xin Xin
KONG, and Miao
ZHANG
Industrial Upgrading in Global Production Networks: Te Case of the Chinese Automotive Industry
Feb
2015
2015-06 Mukul G. ASHER and
Fauziah ZEN Social Protection in ASEAN: Challenges and Initiatives for Post-2015 Vision
Feb
2015
2015-05 Lili Yan ING, Stephen
MAGIERA, and
Anika WIDIANA
Business Licensing: A Key to Investment Climate Reform
Feb
2015
80
No. Author(s) Title Year
2015-04
Gemma ESTRADA,
James ANGRESANO,
Jo Thori LIND, Niku
MÄÄTÄNEN,
William MCBRIDE,
Donghyun PARK,
Motohiro SATO, and
Karin SVANBORG-
SJÖVALL
Fiscal Policy and Equity in Advanced Economies: Lessons for Asia
Jan
2015
2015-03 Erlinda M.
MEDALLA Towards an Enabling Set of Rules of Origin for the Regional Comprehensive Economic Partnership
Jan
2015
2015-02
Archanun
KOHPAIBOON and
Juthathip
JONGWANICH
Use of FTAs from Thai Experience
Jan
2015
2015-01 Misa OKABE
Impact of Free Trade Agreements on Trade in East Asia
Jan
2015
http://www.eria.org/publications/discussion_papers/FY2014/
http://www.eria.org/publications/discussion_papers/FY2013/
http://www.eria.org/publications/discussion_papers/FY2012/
http://www.eria.org/publications/discussion_papers/FY2011/
http://www.eria.org/publications/discussion_papers/FY2010/
http://www.eria.org/publications/discussion_papers/FY2009/
http://www.eria.org/publications/discussion_papers/FY2008/


![1 Micro-Organisms Morphology.ppt [Read-Only]Micro-organisms • Study of organisms tooStudy of organisms too small to be clearly seen by the unaided eye (i.e., micro-organisms) •](https://static.fdocuments.us/doc/165x107/5f41f086404b9d4da6111259/1-micro-organisms-read-only-micro-organisms-a-study-of-organisms-toostudy-of.jpg)