Can the Modular Helium Reactor Compete in the Hydrogen Economy
22
This work is distributed as a Discussion Paper by the STANFORD INSTITUTE FOR ECONOMIC POLICY RESEARCH SIEPR Discussion Paper No. 05-01 Can the Modular Helium Reactor Compete in the Hydrogen Economy By Geoffrey Rothwell Stanford University June 2, 2005 Stanford Institute for Economic Policy Research Stanford University Stanford, CA 94305 (650) 725-1874 The Stanford Institute for Economic Policy Research at Stanford University supports research bearing on economic and public policy issues. The SIEPR Discussion Paper Series reports on research and policy analysis conducted by researchers affiliated with the Institute. Working papers in this series reflect the views of the authors and not necessarily those of the Stanford Institute for Economic Policy Research or Stanford University.
Transcript of Can the Modular Helium Reactor Compete in the Hydrogen Economy

This work is distributed as a Discussion Paper by the
STANFORD INSTITUTE FOR ECONOMIC POLICY RESEARCH
SIEPR Discussion Paper No. 05-01
Can the Modular Helium Reactor Compete in the Hydrogen Economy
By Geoffrey Rothwell Stanford University
June 2, 2005
Stanford Institute for Economic Policy Research Stanford University Stanford, CA 94305
(650) 725-1874 The Stanford Institute for Economic Policy Research at Stanford University supports research bearing on economic and public policy issues. The SIEPR Discussion Paper Series reports on research and policy analysis conducted by researchers affiliated with the Institute. Working papers in this series reflect the views of the authors and not necessarily those of the Stanford Institute for Economic Policy Research or Stanford University.
Can the Modular Helium Reactor Compete in the Hydrogen Economy?
June 2, 2005
Geoffrey Rothwell Department of Economics, Stanford University
ABSTRACT
In today’s energy economy, hydrogen is primarily used in the petroleum refining and petrochemical industries. The dominant technology for generating hydrogen is Steam Methane Reforming (SMR), which uses natural gas as both feedstock and fuel. In the much-discussed future hydrogen economy, hydrogen could become a major carrier of energy for distributed use, such as in fuel-cell vehicles. This paper compares the cost of hydrogen production using natural gas and SMR technology with the cost of nuclear-powered hydrogen production using a Modular Helium Reactor (MHR). A time series model of natural gas prices is estimated and used to simulate the cost of hydrogen from SMR to 2030: it is never above $11.80/GJ or $12.45/million BTU (in 2001 dollars). A cost engineering model of the General Atomics’ MHR shows a range of hydrogen production costs, none of which are below $11.80/GJ. For the MHR to be competitive in the pipeline hydrogen market, there must be an increase of 50-100% in the price of natural gas.
Keywords: hydrogen markets, hydrogen economics, nuclear power economics JEL classification number: Q41 Acknowledgments: I have acted as a member of the Economic Modeling Working Group (EMWG) for Generation IV International Forum (GIF) under contract with the U.S. DOE-NE, January 2003-December 2007; as Technical Director, Economics Crosscut Group, Generation IV Roadmap Committee, October 2001-December 2002; as a member of the Evaluation Methodologies Group, Generation IV Roadmap Committee, January 2001-December 2002; and as a member of the Subcommittee for Long Term Planning for Nuclear Energy Research, Nuclear Energy Research Advisory Committee (NERAC), Department of Energy (DOE-NE), December 1999-May 2000. I thank C. Forsberg, R. Graber, P. Peterson, W. Rasin, and T. Retson for their encouragement, data, or comments; and members of the EMWG. Remaining errors are my own.

[email protected] 2005 June 2 1
1. Today’s Hydrogen Economy
Some predict that hydrogen will replace other energy carriers, particularly gasoline in the
transportation sector and fossil-fueled electricity production. But in today’s hydrogen economy,
hydrogen is used primarily in the petroleum refining and petrochemical industries (93% in the
U.S. in 2003). According to the Chemical Market Reporter (2003, p.43): “More hydrogen plants
are being constructed because of the demand growth from the refinery sector, which uses
hydrogen to upgrade fuels to meet mandates for low-sulfur gasoline and diesel, as well as for
processing higher-sulfur crude.”
There are two sectors of the hydrogen production industry: (1) “captive capacity” owned
by downstream users of the hydrogen, e.g., oil refiners, and (2) “merchant capacity,” where
producers compete for business. Ignoring the “cryogenic liquid” market (e.g., rocket fuel) that
accounts for 7% of the merchant market, the total U.S. merchant hydrogen gas capacity is about
1,500 million (M) standard cubic feet (SCF)/day, or about 42 million cubic meters (Mm3). Most
of this merchant production capacity (92%) is located in three states: Texas with 560M SCF/day,
Louisiana with 440M SCF/day, and California with 380M SCF/day. See Chemical Market
Reporter (2001, 2003). Regarding the size of the captive capacity, the Chemical Market Reporter
(2003, p. 43) writes, “Another 3 billion SCF per day of captive hydrogen capacity exists at 145
locations in the US.” Therefore, the U.S. has a total capacity of approximately 4,500 M SCF/day,
or about 127 Mm3.
Throughout this decade, demand for hydrogen should continue to grow: “Although
aggregate hydrogen consumption is growing 4 percent annually, growth in the merchant
hydrogen business is significantly higher, perhaps 10 percent.” (Chemical Market Reporter,
2003, p. 43) With one-third of the market growing at 10% and the total market growing at 4%,

[email protected] 2005 June 2 2
the captive market is growing at approximately 1%. If the merchant market grows 10% annually,
merchant capacity will equal captured capacity by 2010. This implies adding 100M – 200M
SCF/day (3-5 Mm3) of capacity each year, much of it with100M SCF (2.83 Mm3)/day plants.
Figure 1 represents a model of the hydrogen economy (now being developed in
association with the Economic Modeling Working Group of the Generation IV International
Forum). It’s primary purpose is to determine demand for central station (i.e., pipeline) and
distributed hydrogen (e.g., with electrolysis) as hydrogen fuel-cell vehicles compete with
hybrid/internal combustion engines.
Energy is delivered to the hydrogen sector through natural gas or electricity. The prices
of natural gas and coal are functions of an exogenous oil price. The cost of hydrogen production
is described with cost-engineering models. The prices of distributed electricity, distributed
gasoline, and distributed hydrogen are determined in endogenous markets. The demand for
vehicle type in the transportation sector is a function of fuel cost and vehicle investment. The
model calculates probability distributions for prices and quantities of pipeline and distributed
hydrogen to 2030.
Figure 1 points to the possibility of generating pipeline hydrogen with nuclear power.
Generating hydrogen with nuclear power has been discussed for decades. Recently, the U.S.
House of Representatives passed the H.R. 6 Energy Policy Act of 2005. Section 651 of the Act
addresses Hydrogen Production Programs, authorizing $1,320 million for the Advanced Reactor
Hydrogen Cogeneration Project:
“The project shall consist of the research, development, design, construction, and operation of a hydrogen production cogeneration research facility that, relative to the current commercial reactors, enhances safety features, reduces waste production, enhances thermal efficiencies, increases proliferation resistance, and has the potential for improved economics and physical security in reactor siting. . . The overall project, which may involve demonstration of selected project objectives in a partner nation, must

[email protected] 2005 June 2 3
demonstrate both electricity and hydrogen production. . . The Secretary [of Energy] shall select technologies and develop the project to provide initial testing of either hydrogen production or electricity generation by 2011. (emphasis added)
The present paper forecasts the cost of hydrogen produced (1) with Steam Methane
Reforming with natural gas, and (2) with the leading nuclear power technology for hydrogen
production: the Modular Helium Reactor (MHR). SMR and MHR could compete in the
centralized production of hydrogen, where all production is sold via pipeline. Section 2 presents
a model of the average cost of hydrogen with Steam Methane Reforming as a function of the
price of natural gas. Section 3 develops time-series models of the prices of oil, natural gas, and
hydrogen. It shows that the cost of hydrogen is unlikely to exceed $11.80/GJ (or $12.45/M Btu)
for many months during the next 25 years without substantial increases in the price of natural gas
(e.g., after the imposition of carbon taxes). Section 4 analyzes cost estimates for the Modular
Helium Reactor. After making adjustments following international standards, the cost of
hydrogen using the Sulfur-Iodine process is greater than $11.80/GJ in all sensitivity scenarios.
More development must be done before the Sulfur-Iodine process can be demonstrated at a
prototype scale, e.g., of 50,000 tonnes of hydrogen per year.
2. The Cost of Hydrogen from Steam Methane Reforming
Most of the hydrogen today is produced with Steam Methane Reforming (SMR) by
chemically reacting natural gas and steam at high temperature, see Padro and Putsche (1999, p.
2). As described in Crosbie and Chapin (2003, p. 4):
“The conventional process occurs in a chemical reactor at temperatures of about 800-900°C. When fueled with fossil fuels it is the most economical method of producing hydrogen today [Padro and Putsche, 1999]. The heat is generally supplied by burning an excess of the methane. This results in a loss of both the reactant, and some of the product hydrogen. Typical thermal efficiencies for steam reforming are about 70% [Padro and Putsche, 1999].”

[email protected] 2005 June 2 4
This means that the cost of producing hydrogen depends on the price of natural gas. This
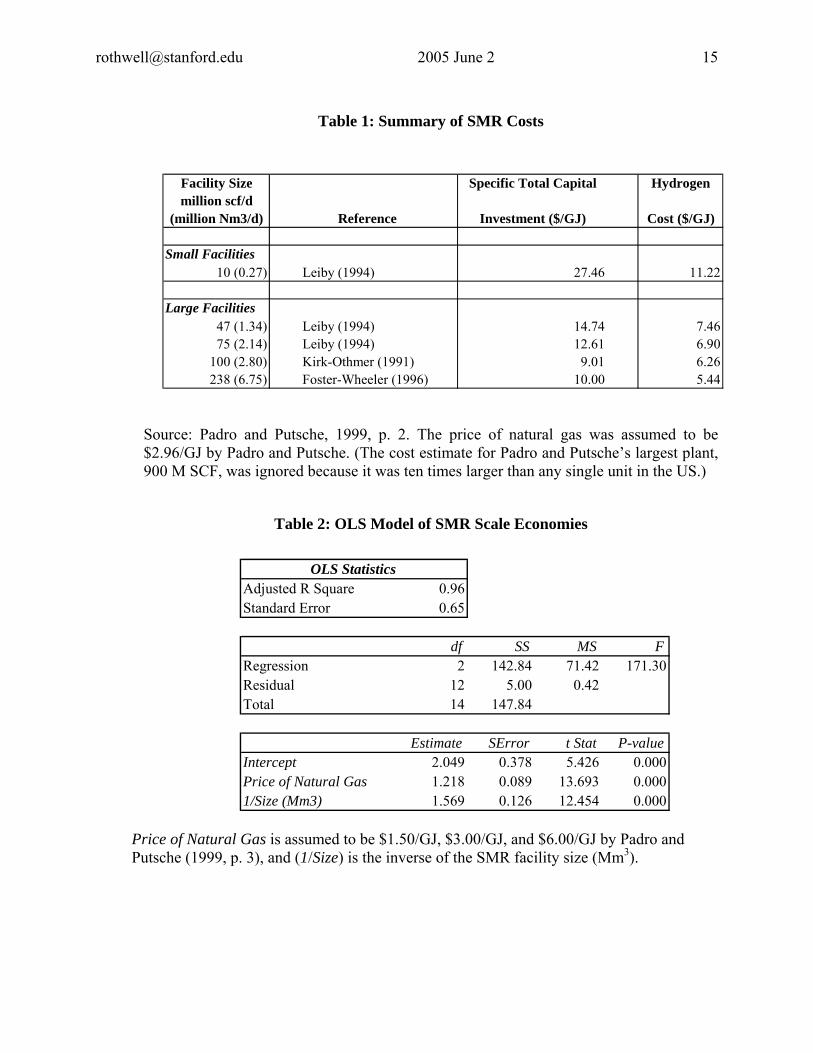
can be seen in Padro and Putsche’s discussion of scale economies in SMR. Table 1 is a
reproduction of their Table 2 and Figure 2 is a reproduction of their Figure 1. By using their
information, an average cost curve can be estimated with Ordinary Least Squares, see Table 2:
ACt = $2.049 + 1.218 PP
NGASt + $1.569 (1/ SIZE ) , (1)
where ACt is the average cost of hydrogen production in mid-1998 dollars per GJ, PP
NGASt is the
price of natural gas in $/GJ (which is nearly equal to dollars per million BTU), and (1/ SIZE ) is
the inverse of the facility capacity in Mm3. (This technique can lead to a lower estimation than
with a bottom-up model of SMR cost with a new plant.) Average Cost can be graphed as a
function of facility size and the price of natural gas, as in Figure 3. Assuming a facility of 2.83
Mm3, the average cost of hydrogen would be $2.603 + 1.218 ⋅ PNGASP t . For example, if PP
NGASt
were $6/GJ, the average cost of hydrogen would be about $9.90/GJ in 1998 dollars, or $10.60/GJ
in 2001 dollars (using the U.S. GDP implicit price deflator).
Using average cost curves (representing long-run marginal cost curves), a supply
schedule for the U.S. merchant hydrogen market can be constructed from this estimate of cost
(assuming all merchant plants use SMR technology). See Figure 5, where “demand lines” have
been added to show the intersection of historical demand with historical supply. Notice that in
each year, consumption is near the upturn in the average cost curve, putting cost pressure on the
price of hydrogen. The Chemical Market Reporter (2003) observes and predicts,
“Hydrogen has remained strong despite the weakened economy in recent years and this situation should prevail regardless of when the economy turns around. The industrial gas majors, Air Products, Praxair, Air Liquide, and BOC, have all raised their prices for hydrogen, based on the strong demand. This pricing trend is expected to continue.”
It appears that the demand for hydrogen in the petroleum and petrochemical sector will
continue to grow. Although it is difficult to predict how long the merchant hydrogen market will
[email protected] 2005 June 2 5
grow at 10% per year, it is likely that all new pipeline hydrogen production capacity can be fully
employed as long as it can compete with an average cost of $8-12/GJ, which depends on the
price of natural gas. The next section forecasts natural gas prices in Texas and California as
econometric functions of crude oil prices.
3. Forecasting Oil and Natural Gas Prices
To forecast the cost of hydrogen production using natural gas with SMR, I propose two
first-order autoregressive functions (see Rothwell 2004, based on Rothwell 2002):
PP
OILt = β + β POIL
1 2 P t - 1 + εOILt , (2)
PP
NGASt = β' + β' POIL
1 2 P t - 1 + β'3 PP
NGASt - 1 + εNGAS
t , (3)
Figure 5 presents the data to estimate these models. Table 3 presents estimates of Equations (2)
and (3) for the West Texas Intermediate Crude Oil Spot Price (representing the world oil price)
from http://www.eia.doe.gov/oil_gas/petroleum/info_glance/prices.html and City Gate Natural
Gas Prices in Texas http://tonto.eia.doe.gov/dnav/ng/hist/n3050tx3m.htm and California,
http://tonto.eia.doe.gov/dnav/ng/hist/n3050ca3m.htm. One can conclude that the price of oil
leads both natural gas prices and that the price of oil does not follow changes in either price of
natural gas. (Oil prices do not follow other energy prices, see Rothwell, 2004.)
To use these estimates in forecasting, they must be stationary, i.e., the mean and variance
must be stationary over time. One can test for stationarity in crude oil prices and in Texas and
California natural gas prices by considering the Dickey-Fuller (1979) procedures:
Δ PP
Jt = δ P 1
Jt-1 + ε Jt , (4a)
Δ PP
Jt = δ + δ P 0 1
Jt-1 + ε Jt , (4b)
Δ PP
Jt = δ + δ P 0 1
Jt-1 + δ time + ε 2
Jt , (4c)

[email protected] 2005 June 2 6
where Δ PJt = PP
Jt – PJ
P t-1 is the first difference of the monthly price, J indexes the form of energy
(here oil or natural gas), and time is a time trend. The null hypothesis is if δ1 = 0 = 1 – ρ, then PJt
is non-stationary (where ρ is the correlation between PJt and PP
Jt-1). The alternative hypothesis is
that δ < 0 (that PJ1 P t is stationary), where a one-tailed test is appropriate (if δ1 > 0, the series can
explode). If δ0 is significant in Equations (4b) and (4c), then PP
Jt is increasing or decreasing
(“drifting”). If δ is significant in Equation (4c), then PJ2 P t is changing with time (e.g., “drifting
around a trend”). The regression results are presented in Table 4. Using standard significance
levels, one can conclude for the purposes here that oil and natural gas prices are stationary.
Given these results, I propose the following forecasting model (based on Table 3, Row 2)
for oil prices after January 1, 2000 (here, 0.044 = 0.030 + 0.014):
PP
OILt = 0.044 + 0.917 POIL
P t - 1 + eOILt (5)
where eOILt are normally distributed residuals with a mean of zero and standard error of 0.0325
(The choice of January 2000 is arbitrary; other dates give similar results.)
Further, I propose the following forecasting equations for natural gas prices (based on
Table 3, Rows 6 and 8):
Texas: PP
TX-NGASt = 0.015 + 0.203 POIL
P t - 1 + 0.737 PP
TX-NGASt - 1 + eTX-NGAS
t and (6a)
California: PCA-NGASt = -0.016 + 0.238 PP
OILt - 1 + 0.768 PCA-NGAS
P t - 1 + eCA-NGASt , (6b)
where eK-NGASt are normally distributed residuals with means of zero and standard errors of 0.048
for Texas and 0.066 for California. Figure 6 presents one Monte Carlo simulation of the forecast.
These natural gas prices can be substituted into Equation (1) to forecast the price of
pipeline hydrogen over the next 25 years, assuming no structural changes in oil and natural gas
markets. Figure 7 presents one forecast of the average cost of hydrogen production in Texas and
[email protected] 2005 June 2 7
California using SMR (this is only one of many possible simulations). The mean price for
hydrogen is $8/GJ in both Texas and California. The price is never over $12/GJ.
4. Estimating Cost of Hydrogen from a Modular Helium Reactor
Crosbie and Chapin (2003) estimated the cost of nuclear-produced hydrogen with
technologies using energy from a Modular Helium Reactor (MHR). A promising long-term
technology for producing hydrogen with high-temperature nuclear heat is the Sulfur-Iodine (S-I)
technology. Brown et al. (2002) claim the cost of hydrogen could be as low as $10/GJ, which is
in the mid-range of the estimates by Schultz and General Atomics (2002).
However, estimating costs for future nuclear power technologies must adhere to a set of
internationally agreed upon standards. A set of standards based on International Atomic Energy
Agency bid evaluation process has been developed by the Economic Modeling Working Group
(EMWG) of the Generation IV International Forum (GIF): Cost Estimating Guidelines for
Energy Systems (2004). These Guidelines specify a comprehensive set of cost estimating
assumptions, such as the cost of capital and costs for each stage of the nuclear fuel cycle.
To recreate these “Nth-of-a-Kind” (i.e., after at least 8,000 MW of commercial capacity
has been installed, following GIF Guidelines) estimates of Schultz and General Atomics (2002)
and other General Atomics documents (see discussion in Appendix G of EMWG, 2004). Table 5
presents the non-capital “Input Data” spreadsheet following the EMWG Guidelines to estimate
nuclear power generation cost. Table 6 presents the “Capital” spreadsheet. See discussion in
EMWG (2004).
The General Atomics’ MHR for hydrogen production with the S-I process is designated
as the (Process Heat) PH-MHR. Its estimated efficiency is 42%, operating at the same outlet

[email protected] 2005 June 2 8
temperature as the GT-MHR (850º C). Table 7 compares the annualized and levelized costs of
production for the PH-MHR with the GT-MHR.
Most of the non-capital input data for the PH-MHR are the same as those for the GT-
MHR. The “electricity-equivalent” size of the 4-unit plant has been adjusted to reflect the lower
efficiency of the PH-MHR: a 2400 MWt plant operating at 42% efficiency would have an
electric-equivalent rating of 1008 MWe. The chemical facility was optimized for a heat source of
2857 MWt. Given the 4-module MHR is only 2400 MWt, the hydrogen facility size is reduced
by 16%. Fuel costs are the same for the PH-MHR as the GT-MHR. However, because of the
lower electric-equivalent output, fuel costs per MWh-equivalent are higher for the PH-MHR.
Regarding reactor operating costs, “Assuming the O&M costs scale as the capital cost,
the O&M cost is $23,400,000 per year for the PH-MHR” (Brown et al. 2003, p. 3-37). This cost
has been converted to an all-staff equivalent of 293 persons. Also, the annual chemical plant
O&M costs are $48.775M from Brown et al. (2003), Table 3-16, plus water costs of $1.805M.
Equipment costs must be adjusted to account for hydrogen production: The cost of the
Intermediate Heat Exchanger ($56M), Primary Circulator ($33M), IMX Circulator ($22M), and
Reactor-Process Ducting ($38.07M) were added to 84% of the “Fixed Capital Investment,” i.e.,
$571.531M x 0.84 = $480.086M. This total, $629.156M, replaces the cost of the turbine-
generator in Account 23 in Columns 3 and 4 of Table 6. The other difference between Column 3
and Column 4 is the additional IDC on the chemical plant, equal to $79M (times 84%). Also, the
initial chemical inventory (primarily iodine) is equal to $114.802M x 0.84 = $96.434M.
(Although there is an implicit assumption that all iodine inventory is recycled in the S-I process,
as in Brown et al., 2003, Werkoff, 2003, questions whether this is a reasonable assumption.)

[email protected] 2005 June 2 9
Two additional changes are made to the calculations in Brown et al. (2003) for PH-MHR.
First, the contingency rate is increased to 15% and applied to both the reactor and chemical plant.
Although contingency appears to have been added to the “Fixed Capital Investment” in Table
13-3 in Brown et al. (2003) under the item “Contingency and Fee,” the contingency and fee are
equal to 18% of the “Total Bare Module Cost with Adders.” This “fee” is nearly equal to the
indirect rate for reactor construction (17.3%). Therefore, contingency is only 0.7%, if indirect
costs are equal to those for the reactor. Given that the Sulfur-Iodine process has not been proven
at the prototype’s scale, a 15% contingency is less than what EPRI TAG Guidelines would
suggest. (The contingency could be doubled to 30% given the state of S-I technology; see
Rothwell 2005a.) Second, the IDC rate is increased to 10% and applied to all capital costs,
including the chemical plant, initial chemical inventory, and first fuel core.
Table 7 presents the results of these calculations. The annual production of 201,982
tonnes of hydrogen per year is from Brown et al. (2003), Table 3-16. The cost of hydrogen is
$12.58/GJ under the Brown et al. (2003) assumptions, with a fixed charge rate (FCR) of 10.5%.
With the cost of the first fuel core and a FCR of 10.23% the cost is $11.86/GJ (column 4 in Table
7). With the GIF Guideline adjustments, the cost of hydrogen increases to $15.11/GJ, which is
between the values of $13.90/GJ for a FCR of 12.5% and $16.50/GJ for a FCR of 16.5% in
Brown et al. (2003). A reasonable range of a state-of-the-art MHR with the S-I technology is
$12-$16/GJ.
This range of nuclear-produced hydrogen is added to Figure 7. The cost of nuclear
hydrogen is greater than the cost of hydrogen from Steam Methane Reforming in all but one
period: December 2000 to June 2001, i.e., during the California energy crisis, and in the price
simulation during one month, May 2023.
[email protected] 2005 June 2 10
5. Application
The next stage of development of the Modular Helium Reactor is the building of a dual-
unit MHR with one unit generating electricity and the other unit generating hydrogen. The cost
of the prototype can be estimated with the values in Tables 5-7, noting these are “Nth-of-a-Kind”
(NOAK) costs. Following the GIF Guidelines, the prototype will cost at least $1,009M equal to
one quarter of the Total Capitalized Cost for the GT-MHR ($444M, from Table 6, Col. 2) plus
one quarter of the Total Capitalized Cost for the PH-MHR ($565M from Table 6, Col. 4).
However, the first unit of any set costs more than the remaining units. These units could be 25%
more costly than one quarter of a four-unit plant. This would increase the costs to $1,260M.
Assuming a decline in cost of 6% with each doubling of total MHR capacity and NOAK
costs equal to cost at 8,000 MW, there are three doublings to 28 units with a total of 8,008 MW.
So, total “First-of-a-Kind” (FOAK) costs could be at least 19% (=1.063) higher, or about
$1,500M. Also, FOAK engineering and certification costs could be as much as $300M. The total
cost for an electricity and hydrogen production facility could be $1,800M. Instead, the project
should focus on the GT-MHR and start the hydrogen facility in 2011, once electricity and
revenue are being generated. It is too early to assume the cost of hydrogen from the MHR/S-I
will decline with learning-by-doing. For MHR technology to be competitive with Steam
Methane Reforming, i.e., to achieve a minimum commercial deployment of 8,000 MW, either
one of the following conditions must be satisfied: (1) an increase of 50-100% in the price of
natural gas, or (2) a decline in the cost of MHR with S-I technology of 33-50%.

[email protected] 2005 June 2 11
Figure 1: A Model of the Hydrogen Economy
Natural Gas Module (NGAS) Petroleum Module (OIL/GAS)
Natural Gas Market Oil Market
Transportation Module (CAR)
Hydrogen Distributed Production Hydrogen
Market Market
Hydrogen Module (H2) Transportation Vehicle Market
Electricity Module (ELEC)
Wholesale Electricity Market(including Transmission)
Coal Market
Nuclear Fuel Cycle Module Environment Module Coal Module (NUKE) (WASTE) (COAL)
LEGEND: Econometric Forecasting Market Clearing
Equations Functions
Cost Engineering Estimates
Fuel Cells
Electrolysis
Hydrogen Storage and Transmission
RADWASTE & CO2 CAP
Nuclear Hydrogen Production
SMR H2 Production
NGas Electricity Production
Nuclear Electricity Production Renewables
Coal
Nuclear Fuel Cycle
Gasoline Refining
ICEngines/Hybrid

[email protected] 2005 June 2 12
Figure 2: Scale Economies in SMR Production of Hydrogen
0
3
6
9
12
15
0 1 2 3 4 5 6
millions of cubic meters/day
$/G
J
$6/GJ
7
$3/GJ
$1.50/GJ
Source: Padro and Putsche (1999, p. 3).
Figure 3: Estimated Average Cost in SMR Production of Hydrogen
0
3
6
9
12
15
0 1 2 3 4 5 6
millions of cubic meters day
$/G
J
$6/GJ
7
$3/GJ
$1.50/GJ
Source: Parameter values from Table 2.
[email protected] 2005 June 2 13
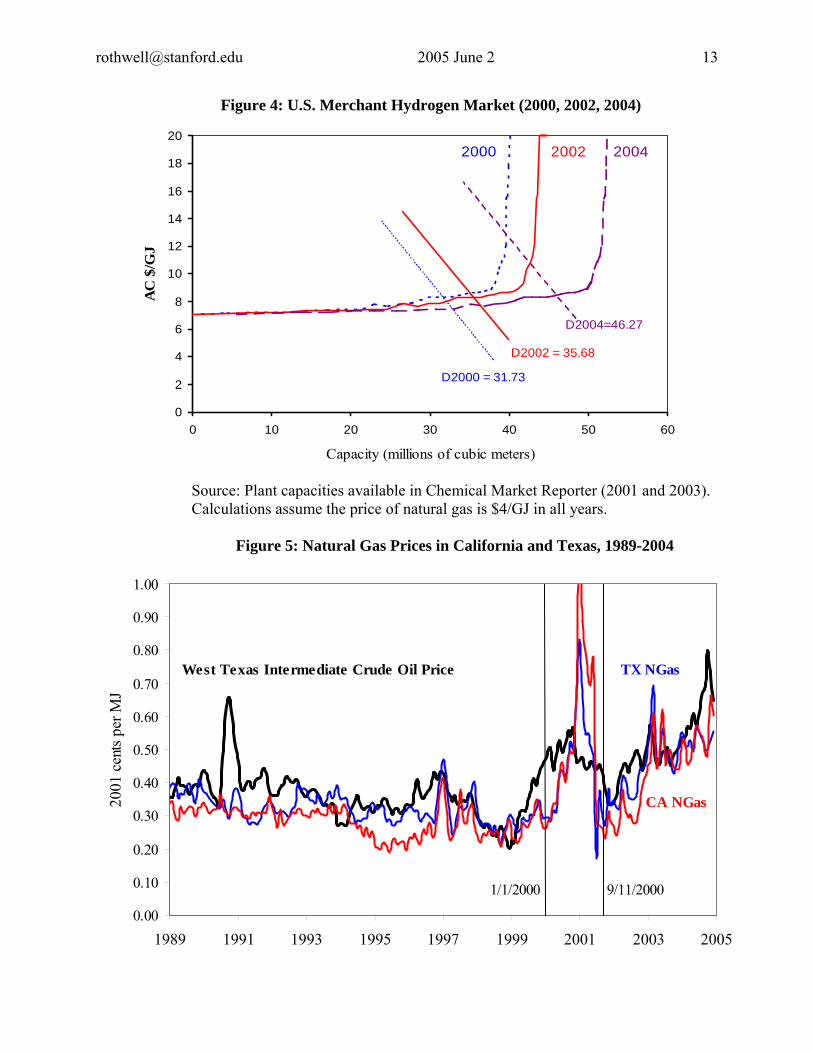
Figure 4: U.S. Merchant Hydrogen Market (2000, 2002, 2004)
0
2
4
6
8
10
12
14
16
18
20
0 10 20 30 40 50 6
Capacity (millions of cubic meters)
AC
$/G
J2000 2002
0
2004
D2004=46.27
D2002 = 35.68
D2000 = 31.73
Source: Plant capacities available in Chemical Market Reporter (2001 and 2003). Calculations assume the price of natural gas is $4/GJ in all years.
Figure 5: Natural Gas Prices in California and Texas, 1989-2004
0.00
0.10
0.20
0.30
0.40
0.50
0.60
0.70
0.80
0.90
1.00
1989 1991 1993 1995 1997 1999 2001 2003 2005
2001
cen
ts pe
r MJ
West Texas Intermediate Crude Oil Price TX NGas
CA NGas
1/1/2000 9/11/2000

[email protected] 2005 June 2 14
Figure 6: Projected Energy Prices for Texas and California, 2005-2030
0
2
4
6
8
10
1990 1995 2000 2005 2010 2015 2020 2025 2030
2001
$/G
J
CA-NGASForecast Prices
TX-NGas
Spot Crude
Historic Prices
Figure 7: Projected Hydrogen Costs for Texas and California
0
2
4
6
8
10
12
14
16
18
20
1990 1995 2000 2005 2010 2015 2020 2025 2030
2001
$/G
J
TX-H2
Nuclear MHR H2 Cost Range
Mean = $8/GJCA-H2
[email protected] 2005 June 2 15
Table 1: Summary of SMR Costs
Facility Size Specific Total Capital Hydrogenmillion scf/d
(million Nm3/d) Reference Investment ($/GJ) Cost ($/GJ)
Small Facilities10 (0.27) Leiby (1994) 27.46 11.22
Large Facilities47 (1.34) Leiby (1994) 14.74 7.4675 (2.14) Leiby (1994) 12.61 6.90
100 (2.80) Kirk-Othmer (1991) 9.01 6.26238 (6.75) Foster-Wheeler (1996) 10.00 5.44
Source: Padro and Putsche, 1999, p. 2. The price of natural gas was assumed to be $2.96/GJ by Padro and Putsche. (The cost estimate for Padro and Putsche’s largest plant, 900 M SCF, was ignored because it was ten times larger than any single unit in the US.)
Table 2: OLS Model of SMR Scale Economies
OLS StatisticsAdjusted R Square 0.96Standard Error 0.65
df SS MS FRegression 2 142.84 71.42 171.30Residual 12 5.00 0.42Total 14 147.84
Estimate SError t Stat P-valueIntercept 2.049 0.378 5.426 0.000Price of Natural Gas 1.218 0.089 13.693 0.0001/Size (Mm3) 1.569 0.126 12.454 0.000
Price of Natural Gas is assumed to be $1.50/GJ, $3.00/GJ, and $6.00/GJ by Padro and Putsche (1999, p. 3), and (1/Size) is the inverse of the SMR facility size (Mm3).

[email protected] 2005 June 2 16
Table 3. Granger Causality Tests: Crude Oil Spot Price, Texas City Gate Natural Gas, and Californian City Gate Natural Gas, 1989-2004
Depend df R2 RSS C Independ Est t Stat Independ Est t Stat F testVariable Variable Value Variable Value
1 Oil(t) 189 89 0.20 0.018 Oil(t-1) 0.959 39.65 2 Oil(t) 188 90 0.20 0.030 Oil(t-1) 0.917 29.22 Time>2000 0.014 2.09 4.3593 Oil(t) 188 89 0.20 0.017 Oil(t-1) 0.955 31.03 TX-NGas(t-1) 0.008 0.25 0.0624 Oil(t) 188 89 0.20 0.017 Oil(t-1) 0.948 32.41 CA-NGas(t-1) 0.015 0.67 0.455
5 TX-NGas(t) 189 73 0.48 0.050 TX-NGas(t-1) 0.865 22.77 6 TX-NGas(t) 188 76 0.43 0.015 TX-NGas(t-1) 0.737 16.07 Oil(t-1) 0.203 4.54 20.586
7 CA-NGas(t) 189 74 0.89 0.046 CA-NGas(t-1) 0.867 23.00 .8 CA-NGas(t) 188 76 0.82 -0.016 CA-NGas(t-1) 0.768 17.54 Oil(t-1) 0.238 4.04 16.333
Table 4. Dickey-Fuller Tests: Texas and Californian Energy Prices, 1989-2004
Depend df R2 RSS C Std Independ Est Std Independ Est StdVariable Error Variable Value Error Variable Value Error
1 Oil(d1) 190 0 0.2067 Oil(t-1) 0.0012 0.0058 2 Oil(d1) 189 1 0.2033 0.0178 0.0100 Oil(t-1) -0.0406 0.0242 3 Oil(d1) 188 3 0.2007 0.0172 0.0100 Oil(t-1) -0.0562 0.0262 Time 0.0009 0.0006
4 TX-NGas(d1) 190 0 0.5076 TX-NGas(t-1) -0.0064 0.0099 5 TX-NGas(d1) 189 6 0.4766 0.0501 0.0143 TX-NGas(t-1) -0.1353 0.0380 6 TX-NGas(d1) 188 9 0.4628 0.0496 0.0141 TX-NGas(t-1) -0.1792 0.0419 Time 0.0021 0.0009
7 CA-NGas(d1) 190 0 0.9442 CA-NGas(t-1) -0.0139 0.0141 8 CA-NGas(d1) 189 6 0.8905 0.0462 0.0137 CA-NGas(t-1) -0.1326 0.0377 9 CA-NGas(d1) 188 8 0.8685 0.0384 0.0140 CA-NGas(t-1) -0.1704 0.0412 Time 0.0026 0.0012
Note: Standard Errors of variables with high t-statistics are in bold.

[email protected] 2005 June 2 17
Table 5: Non-Capital Cost Input Data for 4-unit GT-MHR and PH-MHR
units Design Data Plant technology (reactor type) type GT-MHRx4 PH-MHRx4Reactor Net Capacity (thermal) MWt 2400 2400Reactor Net Capacity (electric) MWe 1145 1008Reactor Capacity factor % 90% 90%Contingency Rate % 5% 5%Contingency Rate (adjustment) % 15% 15%Plant economic life years 40 40Years to construct years 5 5EMWG Non-fuel Data 0 0Real discount rate for IDC & amortization % 10.00% 10.00%Estimated D&D cost $M $0 $0Estimated D&D cost (adjustment) $M $263 $204Fuel Data from Designer 0 0U-235 enrichment level (1st core ave) % U-235 15.5% 15.5%U-235 enrichment level (reload ave) % U-235 15.5% 15.5%Heavy metal mass of fuel assembly grams 5.88 5.88Fuel Assemblies in Full Core thousands 3,060 3,060Fuel Assemblies per Reload thousands 1,530 1,530Average time between refuelings years 1.5 1.5EMWG Fuel Cycle Data 0 0Enrichment plant tails assay %U-235 0.30% 0.30%Enrichment level of feed %U-235 0.71% 0.71%Cost of uranium ore in $/lb $/lbU3O8 $12 $12Cost of uranium ore in $/kg $/kgU $31 $31Cost of U3O8 to UF6 conversion $/kgU $6 $6Cost of Enrichment $/SWU $100 $100Cost of Fabrication $/kgHM $5,756 $5,756Cost of once-through waste disposal $/MWh $1 $1Non-Fuel Operational Recurring Costs 0 0On-site Staff count person/yr 376 293On-site Staffing Cost, including benefits $/person $80,000 $80,000Annual chemical plant O&M costs $M/yr $0 $50.581

[email protected] 2005 June 2 18
Table 6: Capital Cost for a General Atomics 4-unit GT-MHR and PH-MHR
Col. 1 Col. 2 Col. 3 Col. 4MHRx4 GT GT PH PH
GIF Code of Accountsadjusted adjusted
Cost Cost Cost Cost Description ($M) ($M) ($M) ($M)
10 series Capitalized Pre-construction Costs 0 0 0 020 series Capitalized Direct Costs (subtotal) 789 789 1,190 1,190
21 Buildings, Structures, & Improvements on Site 132 132 132 13222 Reactor Plant equipment 443 443 254 25423 T/G or (HX-H2 equipment+Chemical plant) 91 91 629 62924 Electrical equipment 62 62 50 5025 Water intake and heat rejection plant 33 33 0 026 Miscellaneous plant equipment 28 28 28 2827 Special materials (including chemicals) 0 0 96 96
30 series Capitalized Support Services (Subtotal) 137 137 106 10631 Design Services at A/E Offices (home office) 25 25 20 2035 Construction supervision at plant site (field) 28 28 22 2236 Field indirect costs (rentals, temp facil, etc) 83 83 64 64
40 series Owners' capital investment costs (Acct 46) 138 138 107 10750 series First Fuel Load or First Core (Acct 56) 180 180 180 180
Total Contingency (Accts 29+39+49+59) 53 187 41 23760 Series Financing: Interest during Construction (Acct 62) 129 345 167 439
Total Capitalized Cost w/o First Core $1,245 $1,594 $1,611 $2,079 Specific Cost ($/kw) $1,088 $1,393 $1,599 $2,063 Total Capitalized Cost plus First Core $1,426 $1,775 $1,792 $2,260 Specific Cost ($/kw) $1,245 $1,550 $1,777 $2,242

[email protected] 2005 June 2 19
Table 7: Annualized and Levelized Cost for General Atomics 4-unit MHR
Col. 1 Col. 2 Col. 3 Col. 4 Col. 5Case: GT-MHRx4 GT-MHRx4 PH-MHRx4 PH-MHRx4 PH-MHRx4
adjusted w/First Core adjusted CFR=10.5% CFR=10.23% CFR=10.23%
Annualized Cost in $M/yrCapital Cost incl Financing 145.785 181.469 169.197 151.450 231.067Operations Cost 30.110 30.110 73.981 73.981 73.981Fuel Cycle Cost 66.834 66.834 66.834 66.834 66.834D&D Cost 0.000 0.593 0.000 0.000 0.443Totals $242.729 $279.006 $310.013 $292.265 $372.325
Mills/kwh or $/MWh Electricity EquivalentsCapital Cost incl Financing 16.15 20.10 21.29 19.06 29.08Operations Cost 3.34 3.34 9.31 9.31 9.31Fuel Cycle Cost 7.40 7.40 8.27 8.27 8.27D&D Cost 0.00 0.07 0.00 0.00 0.06Totals $26.89 $30.91 38.87 36.64 46.71
Annual Production of H2 in kMt 201.982 201.982 201.982Cost of H2 in $/kg $1.53 $1.45 $1.84Cost of H2 in $/GJ $12.58 $11.86 $15.11
[email protected] 2005 June 2 20
References:
Brown, L.C., G.E. Besenbruch, Ken R. Schultz, A.C. Marshall, S.K. Showalter, Paul S. Pickard, J.F. Funk. 2002. “Nuclear Production of Hydrogen Using Thermochemical Water-Splitting Cycles.” presented at International Congress on Advanced Nuclear Power Plants (ICAPP), Embedded Topical Meeting, Hollywood, Florida (June 9-13).
Brown, Lloyd C., Gottfried E. Besenbruch, R.D. Lentsch, Ken R. Schultz, J.E. Funk, P.S. Pickard, A.C. Marshall, and S.K. Showalter. 2003. “High Efficiency Generation of Hydrogen Fuels Using Nuclear Power.” GA-A24285. (General Atomics, June). http://web.gat.com/pubs-ext/AnnSemiannETC/A24285.pdf
Chemical Market Reporter. 2001. “Chemical Profile: Hydrogen,” (Jan. 29): p. 37.
Chemical Market Reporter. 2003. “Chemical Profile: Hydrogen,” (Feb. 24): p. 43.
Crosbie, Leanne M. and Douglas Chapin. 2003. “Hydrogen Production by Nuclear Heat.” presented at GENES4/ANP2003, Kyoto, Japan (September 15-19). http://www.mpr.com/pdf_files/hydrogen.pdf
Dickey, D. A. and Fuller, W. A. (1979), Distributions of the Estimators For Autoregressive Time Series with a Unit Root, Journal of the American Statistical Association, 75: 427–431.
Economic Modeling Working Group. (EMWG). 2004. Cost Estimating Guidelines for Energy Systems. Generation IV International Forum (GIF) (Sept. 2003, updated Oct. 2004).
Granger, C.W.J. 1969. “Investigating Causal Relations by Econometric Models and Cross-Spectral Methods,” Econometrica 37(3): 424-438.
Nuclear Energy Agency. 2001. Nuclear Production of Hydrogen. OECD (ISBN 92-64-18696-4).
Padro, C.E.G. and V. Putsche. 1999. Survey of the Economics of Hydrogen Technologies. National Renewable Energy Laboratory.
Rothwell, G.S. 2002. “Lessons from the California Crisis for the Restructuring of Russia’s UES,” presented at “Russian Economic and Political Institutions in Transition,” New Economics School, Moscow, Russia (Oct. 2-5).
Rothwell, G.S. 2004. “Texas Energy Price Variance,” Texas Institute Advanced Chemical Technology and the U.S. Department of Energy (Nov).
Rothwell, G.S. 2005a. “Cost Contingency as the Standard Deviation of the Cost Estimate,” Cost Engineering (July).
Rothwell, G.S. 2005b. “Contingency in Levelized Capital Cost Estimation,” in AACE International Annual Meeting Transactions (June).
Schultz, Ken and General Atomics. 2002. “High Efficiency Generation of Hydrogen Fuels Using Nuclear Energy,” presented to Department of Energy, Nuclear Energy (Feb. 26).
Werkoff, François. 1997. “On the profitability of hydrogen production using nuclear power,” presented at The First European Hydrogen Energy Conference.
U.S. House of Representatives. 2005. H.R.6 Energy Policy Act of 2005. thomas.loc.gov/cgi-bin/query/z?c109:H.R.6


![Water and pressurized Helium as coolants of fusion reactor ... · [Ruth A.Carvajal-Ortiz et.al. Nuclear Engineering and Design, Vol 248, 2012, 340-342] Preliminary water chemistry](https://static.fdocuments.us/doc/165x107/5f930e6bfc309302222584f8/water-and-pressurized-helium-as-coolants-of-fusion-reactor-ruth-acarvajal-ortiz.jpg)