
CAN SOLAR ACTIVITY INFLUENCE THE OCCURRENCE OF … · The period of elevated solar activity with...
40
Mikhail Gorbanev January 2016 CAN SOLAR ACTIVITY INFLUENCE THE OCCURRENCE OF ECONOMIC RECESSIONS?
Transcript of CAN SOLAR ACTIVITY INFLUENCE THE OCCURRENCE OF … · The period of elevated solar activity with...

Mikhail Gorbanev
January 2016
CAN SOLAR ACTIVITY INFLUENCE THE OCCURRENCE OF ECONOMIC RECESSIONS?

Outline
2
• What are the sunspots, solar cycles, and solar maximums
and how does solar activity impact Earth?
• Literature: Jevons and Chizhevsky; recent research
• Methodology: Comparison of smoothed series; average of
“stacked” cycles centered along solar maximums; using
economic models and simulations.
• Findings: Recessions do occur more often around and after
solar maximums!
• Implications: What worked for the solar maximum of 2014
• Open discussion

What Are the Sunspots, Solar Cycles,
and Solar Maximums?
Solar activity fluctuates with approximate 11-year period known as the
“solar cycle”. The cycle is not exactly regular, and significant variations
have been observed over centuries.
The cycle can be measured by counting the “sunspots” on the sun surface.
Sunspots are temporary phenomena on the photosphere of the sun that
appear visibly as dark spots compared to surrounding regions.
The period of elevated solar activity with the highest number of sunspots
during the cycle is called “solar maximum”.
Around solar maximums, various types of solar activity reach their
maximums levels: ultraviolet radiation and X-rays, proton emission, solar
wind, solar flares, coronal mass ejections (CME), etc. 3
Impact on Earth
Physical impact: Disruptions of radio and telecommunications; fluctuations
in the geomagnetic field (“magnetic storms”); electromagnetic impulses in
power grids. “Carrington event” in 1859; “solar storms” in 774/775 and
993/994? Superstorm of July 2012 that missed the Earth by one week.
Human health hazard: Geomagnetic storms caused by solar activity affect
people with cardiovascular health conditions, increasing chances of stroke
and heart attack and exacerbating brain disorders.
4

Literature: From Classics to Modern
Willliam Stanley Jevons (1875-79): “Commercial
crises” in Europe in the XIX century occurred at
intervals of 11 years, broadly matching the average
solar cycle length. “Beautiful coincidence“. Link to
bad harvests.
Alexander Chizhevsky (1924, 1938, 1976):
Revolutions and “most important historical events
involving large numbers of people” occur much
more often in the three years around sunspot
maximums.
5
Modern research: Growing body of literature
documenting various aspects of solar activity’s impact on Earth.
Methodology
Comparison of smoothed series. Smoothing series with moving
average; de-trending with HP filter or another technique; comparing
smoothed economic series with the series for sunspots or other
indicators of solar or geomagnetic activity.
“Stacked cycles”. Identifying cycles, finding their maximum and
minimum points, “stacking” cycles so that their maximum points
overlap, finding average values corresponding to particular years or
months counting from the solar maximum.
Econometric models. Using sunspot numbers as explanatory
variable in econometric models for US recessions.
Simulations. Running program simulations to emulate the actual
data for the US recessions and determine their probability chances.
6

7

On average, revolutions occur more often in the
years of solar maximums

Revolutions overlapping with solar maximums
1789 Great French Revolution
1830 Revolutions in Europe (France, Poland, Germany, Italy, Greece)
1848 Revolutions in Europe (Italy, France, Germany, Austria, etc.)
1861 Secession of the southern US states that formed the C.S.A.
1871 Uprising in Paris, “Paris Commune”
1905-07 Revolution of 1905-07 in the Russian Empire
1917
1918 February Revolution, Great October Socialist Revolution in Russia Revolutions in Germany and Hungary, collapse of Austro-Hungarian Empire
1979 Islamic Revolution in Iran
1989
1991
Fall of Berlin Wall, collapse of communism in Eastern Europe
Collapse of Soviet Union and Yugoslavia
2001 Rise of al-Qaeda, terrorist attack on the U.S. on September 11
2011-13
2013-14
2015
“Arab Spring”: Revolutions in Egypt, Libya, Syria, Yemen, Tunisia
Revolution in Ukraine
Rise of ISIS, terrorist attacks against France, Russia
0
100
200
300
0
100
200
300
1785 1815 1845 1875 1905 1935 1965 1995
Sunspot number
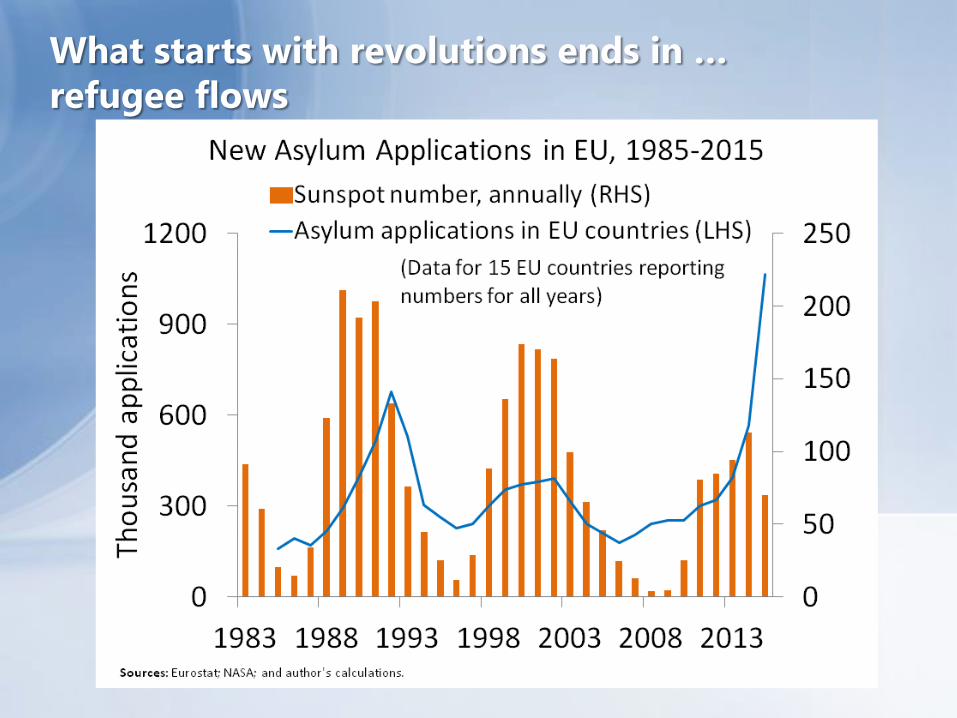
What starts with revolutions ends in …
refugee flows
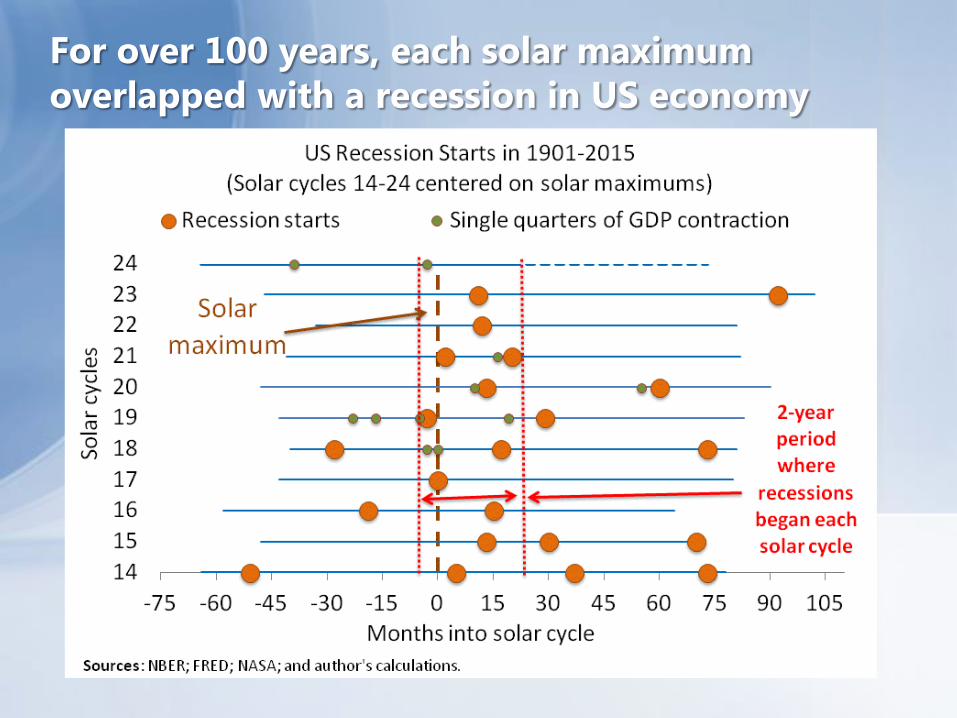
For over 100 years, each solar maximum
overlapped with a recession in US economy

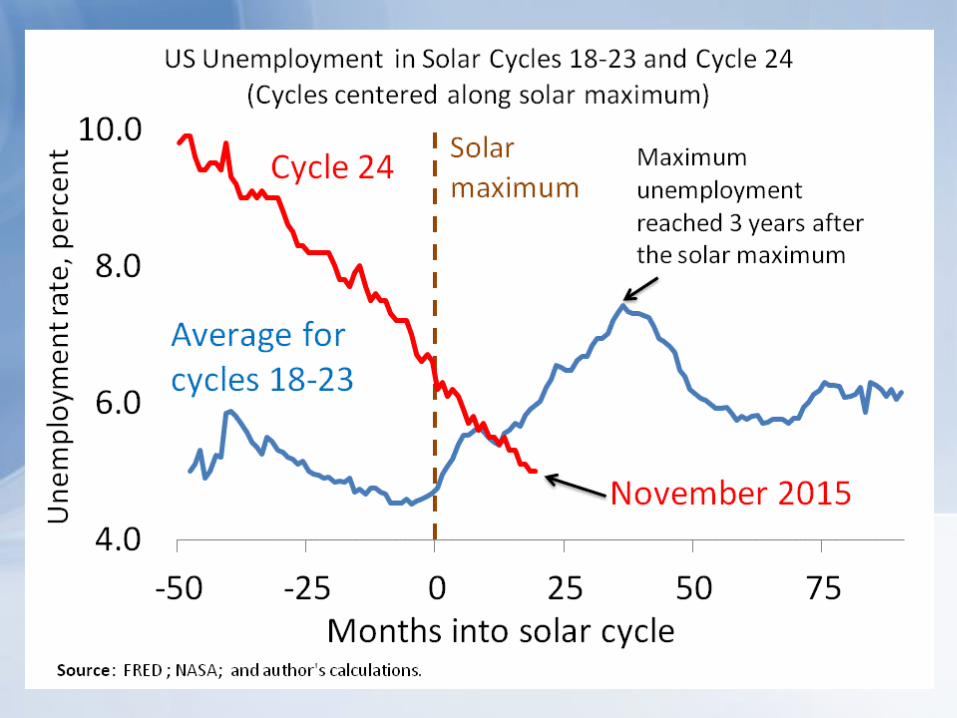
Since 1933, US economy spent 1/3 of time in
recession in about 3 years after solar maximums
12

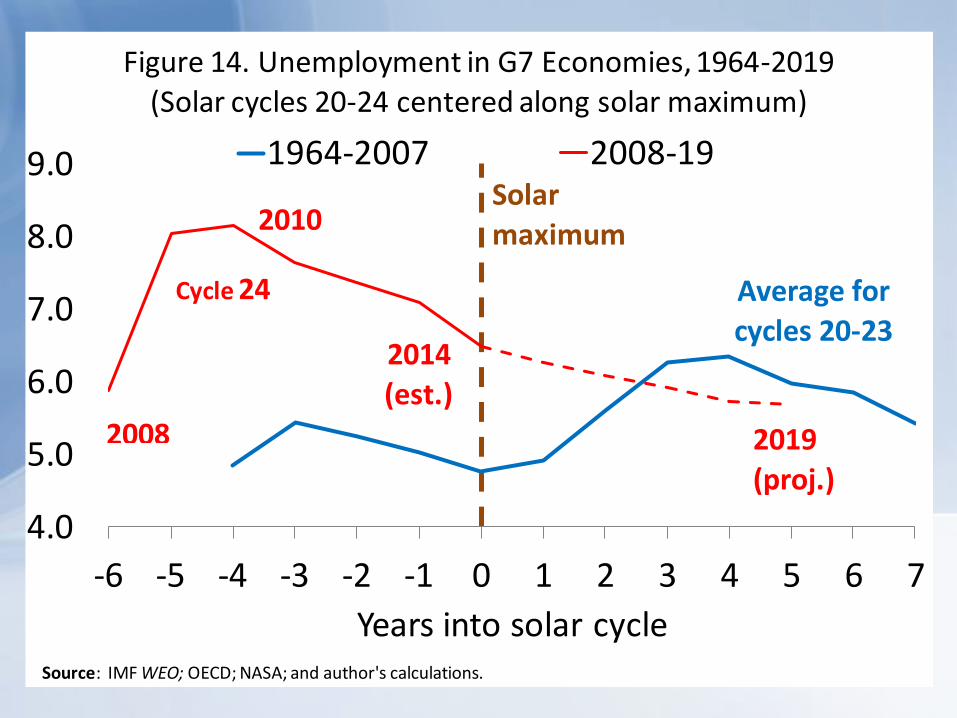
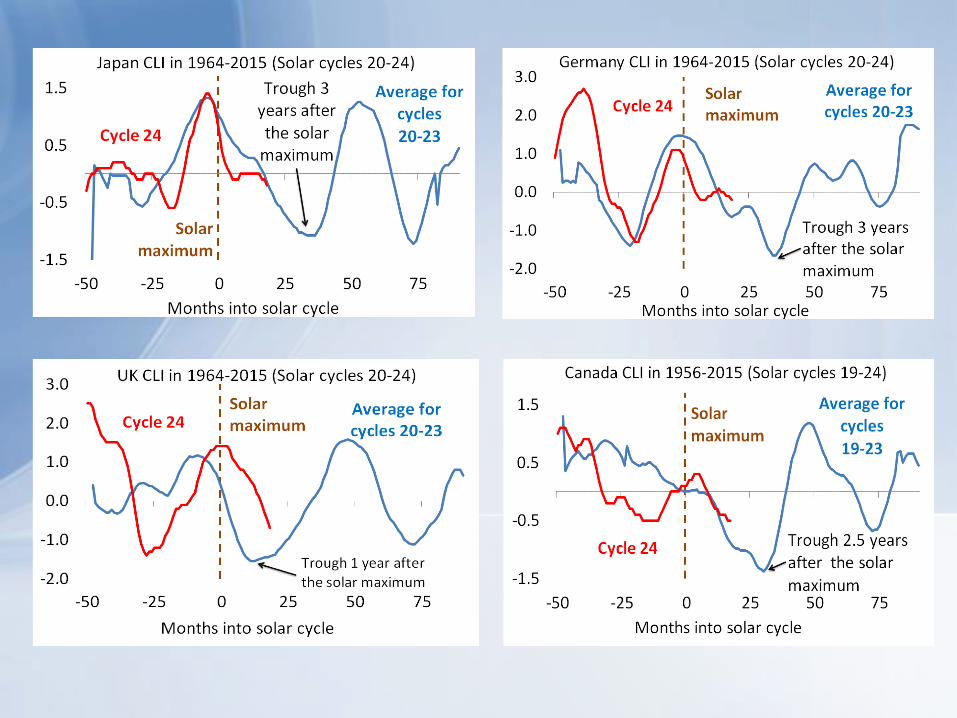
Since 1965, 3/5 of G7 recessions started in
3 years around and after solar maximums
13

In a simple regression, sunspots series is as
good as traditional predictors of US recessions Dependent Variable: NBER_REC
Method: Least Squares
Date: 09/08/15 Time: 14:53
Sample (adjusted): 1960M04 2015M08
Included observations: 665 after adjustments
Variable Coefficient Std. Error t-Statistic Prob.
OIL_YY(-3) 0.001262 0.000321 3.932902 0.0001
SPR_PROB 0.638476 0.067140 9.509618 0.0000
SSN(-15) 0.001039 0.000211 4.924585 0.0000
SP500_YY -0.009408 0.000657 -14.32315 0.0000
C 0.049146 0.018911 2.598731 0.0096
R-squared 0.442957 Mean dependent var 0.139850
Adjusted R-squared 0.439581 S.D. dependent var 0.347092
S.E. of regression 0.259837 Akaike info criterion 0.149966
Sum squared resid 44.56007 Schwarz criterion 0.183799
Log likelihood -44.86360 Hannan-Quinn criter. 0.163075
F-statistic 131.2071 Durbin-Watson stat 0.375048
Prob(F-statistic) 0.000000

In a simple PROBIT model, sunspots series is
doing better than traditional predictors! Dependent Variable: REC_START
Method: ML - Binary Probit (Quadratic hill climbing)
Date: 09/08/15 Time: 15:03
Sample (adjusted): 1960M08 2015M08
Included observations: 661 after adjustments
Convergence achieved after 6 iterations
Covariance matrix computed using second derivatives
Variable Coefficient Std. Error z-Statistic Prob.
SPR_PROB(-7) 0.476048 0.733303 0.649183 0.5162
SSN(-15) 0.005071 0.003100 1.635523 0.1019
OIL_YY(-3) 0.001776 0.003898 0.455616 0.6487
SP500_YY -0.014333 0.009654 -1.484648 0.1376
C -2.775637 0.332758 -8.341296 0.0000
McFadden R-squared 0.089014 Mean dependent var 0.010590
S.D. dependent var 0.102439 S.E. of regression 0.102401
Akaike info criterion 0.122070 Sum squared resid 6.878840
Schwarz criterion 0.156062 Log likelihood -35.34415
Hannan-Quinn criter. 0.135245 Deviance 70.68830
Restr. deviance 77.59542 Restr. log likelihood -38.79771
LR statistic 6.907116 Avg. log likelihood -0.053471
Prob(LR statistic) 0.140879
Obs with Dep=0 654 Total obs 661
Obs with Dep=1 7

Simulations confirm low chances of US recessions
fitting solar maximums “by coincidence”
Simulations for two periods: 1933-2008 (solar cycles 17-23) and 1901-2008 (solar cycles 14-23 ) Using the actually observed pattern of recessions, drawing out of distribution of times between recession starts With and without constraining assumption that the first recession in the time period overlaps with the solar maximum Outcome: probability of 8 recessions (1933-2008 ) or 11 recessions (1901-2008 ) occurring in the two-year period around and after solar maximums is a fraction of a percent Hypothesis of no relation between solar cycle and US recessions is rejected at 0.1 percent confidence level


1933-2008
Probability of 8 or more recessions
2 years (25 months) around solar max
Sim # constrained unconstrained
constrained -
discrete
unconstrained -
discrete
All
combinations
0 0.0087 0.0025 0.0752 0.0161
1 0.0208 0.0069 0.1340 0.0288
2 0.0138 0.0020 0.1670 0.0159
3 0.0163 0.0072 0.1711 0.0245
4 0.0147 0.0026 0.0896 0.0235
5 0.0093 0.0003 0.1180 0.0526
6 0.0166 0.0055 0.1133 0.0539
7 0.0085 0.0019 0.1085 0.0161
8 0.0051 0.0046 0.1077 0.0220
9 0.0061 0.0027 0.1230 0.0304
Average 0.0120 0.0036 0.1207 0.0284 0.062
STD 0.0052 0.0023 0.0303 0.0141
+/- 3 STD -0.0035 -0.0033 0.0297 -0.0138
0.0275 0.0105 0.2118 0.0706

1901-2008
Probability of 11 or more recessions
2 years (25 months) around solar max
Sim # constrained unconstrained
constrained -
discrete
unconstrained -
discrete
0 0.0241 0.0061 0.0315 0.0144
1 0.0197 0.0121 0.0867 0.0196
2 0.0277 0.0059 0.0307 0.0111
3 0.0056 0.0127 0.0327 0.0055
4 0.0068 0.0013 0.0429 0.0070
5 0.0089 0.0015 0.0400 0.0086
6 0.0115 0.0051 0.0338 0.0094
7 0.0137 0.0042 0.0417 0.0187
8 0.0188 0.0080 0.0445 0.0099
9 0.0243 0.0098 0.0498 0.0155
Average 0.0161 0.0067 0.0434 0.0120
STD 0.0079 0.0040 0.0165 0.0048
+/- 3 STD -0.0076 -0.0053 -0.0060 -0.0026
0.0398 0.0186 0.0928 0.0265

21

22

Solar maximum of April 2014 and current
economic developments and outlook
Global economic performance and outlook in 2015-
16 proved weaker than previously projected
However, US unemployment is declining, deviating
from previous pattern
And there was no US recession in 2014-15. Not yet?
With so many countries in trouble, is it a “global
economic slowdown” or “global economic crisis”?
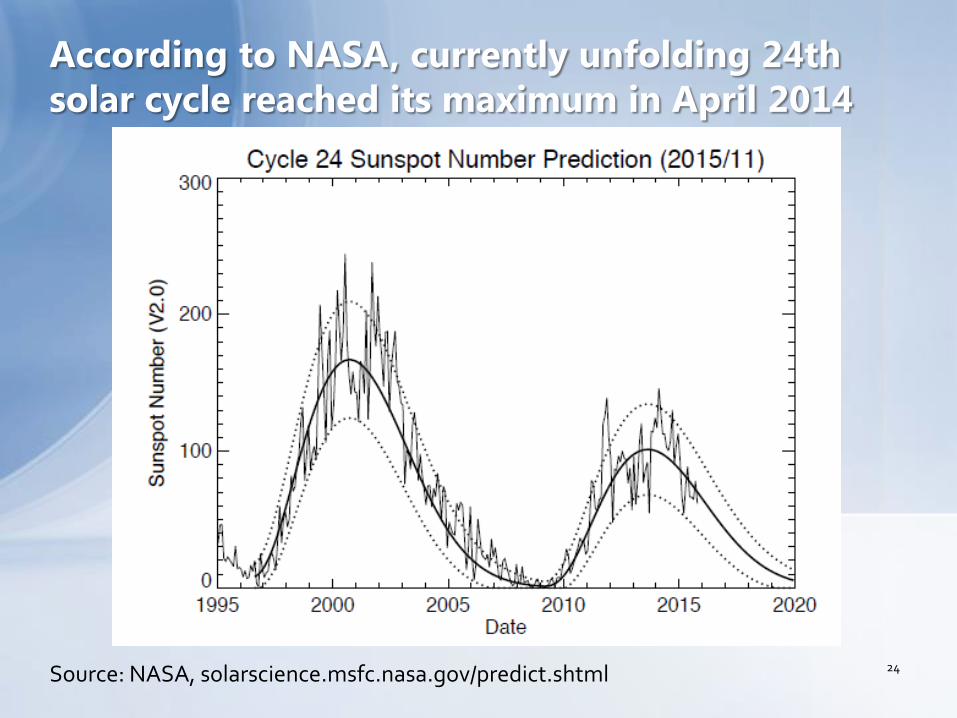
According to NASA, currently unfolding 24th
solar cycle reached its maximum in April 2014
24 Source: NASA, solarscience.msfc.nasa.gov/predict.shtml

25
-3.0
-1.0
1.0
3.0
5.0
-6 -5 -4 -3 -2 -1 0 1 2 3 4 5 6 7
Perc
ent
Years into solar cycle
Figure 16. US GDP Growth in 1954-2014 (Solar cycles 19-24 centered along solar maximum)
Source: Bureau of Economic Analysis; IMF WEO ; NASA; and author's calculations.
Cycle 24
2009
2010
2014
(est.)
2019 (proj.)
Average for cycles
19-23
Trough for 3 years after the solar maximum
Solar maximum

26
27
0.0
2.0
4.0
6.0
-6 -5 -4 -3 -2 -1 0 1 2 3 4 5 6 7
Perc
ent
Years into solar cycle
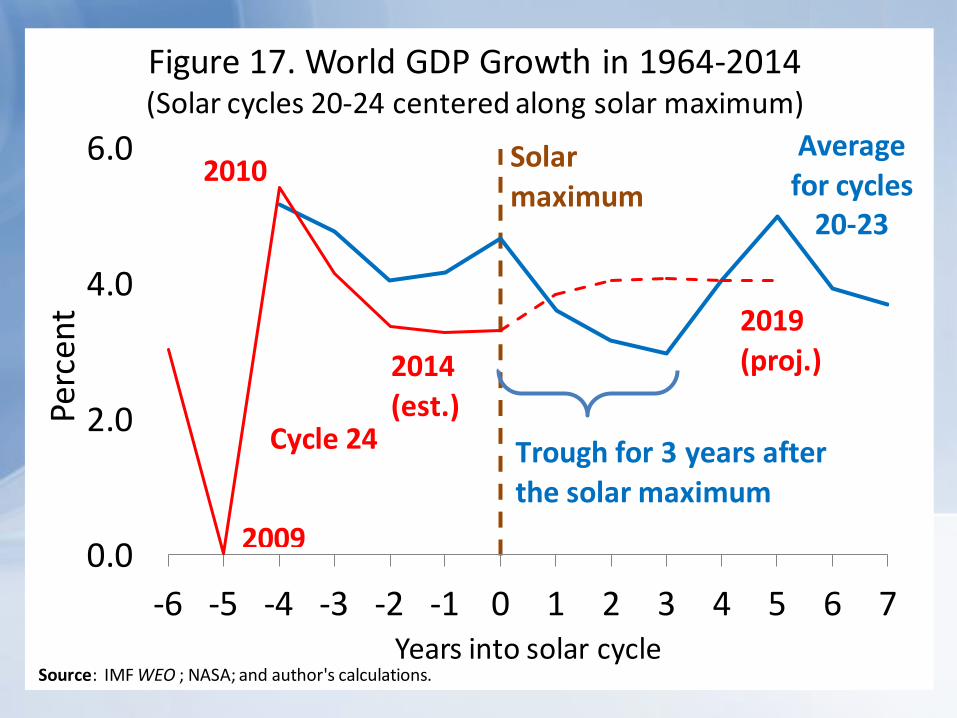
Figure 17. World GDP Growth in 1964-2014 (Solar cycles 20-24 centered along solar maximum)
2009
2010
2014
(est.)
2019
(proj.)
Cycle 24
Average
for cycles20-23
Source: IMF WEO ; NASA; and author's calculations.
Trough for 3 years after
the solar maximum
Solar
maximum

28
29
30
4.0
5.0
6.0
7.0
8.0
9.0
-6 -5 -4 -3 -2 -1 0 1 2 3 4 5 6 7
Years into solar cycle
Figure 14. Unemployment in G7 Economies, 1964-2019
(Solar cycles 20-24 centered along solar maximum)
1964-2007 2008-19
2008
2014 (est.)
2019
(proj.)
2010
Average for
cycles 20-23
Solar
maximum
Source: IMF WEO; OECD; NASA; and author's calculations.
Cycle 24

31


Open Discussion
36
How to design statistical tests?
Use in econometric models?
Value for projections and policy discussions?

Earth’s South Magnetic Pole is in Canada

Aurora Oval
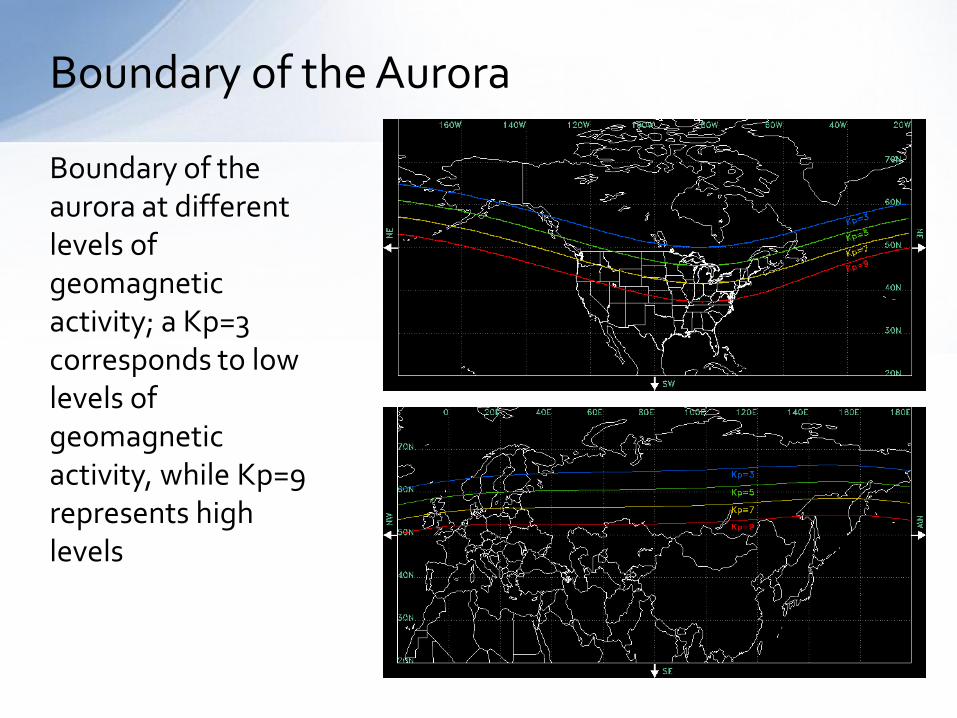
Boundary of the Aurora
Boundary of the aurora at different levels of geomagnetic activity; a Kp=3 corresponds to low levels of geomagnetic activity, while Kp=9 represents high levels

Useful links
ScienceCasts: Here Comes Solar Maximum
https://www.youtube.com/watch?v=k87JdeyQ-m8
Carrington-class CME Narrowly Misses Earth
https://www.youtube.com/watch?v=7ukQhycKOFw
Documentary on Solar Storm https://www.youtube.com/watch?v=Mgt81Kr2Dk4


![INVESTIGATING ISOLATED SUNSPOTS AS SOURCES OF SLOW … · INVESTIGATING ISOLATED SUNSPOTS AS SOURCES OF SLOW SOLAR WIND [Photo G.Gaigals] ARTURS VRUBLEVSKIS Solar Physics Group (B.](https://static.fdocuments.us/doc/165x107/5e355430974de67cd16e1ad2/investigating-isolated-sunspots-as-sources-of-slow-investigating-isolated-sunspots.jpg)

