Can Rose's paradox be useful in crime prevention
23
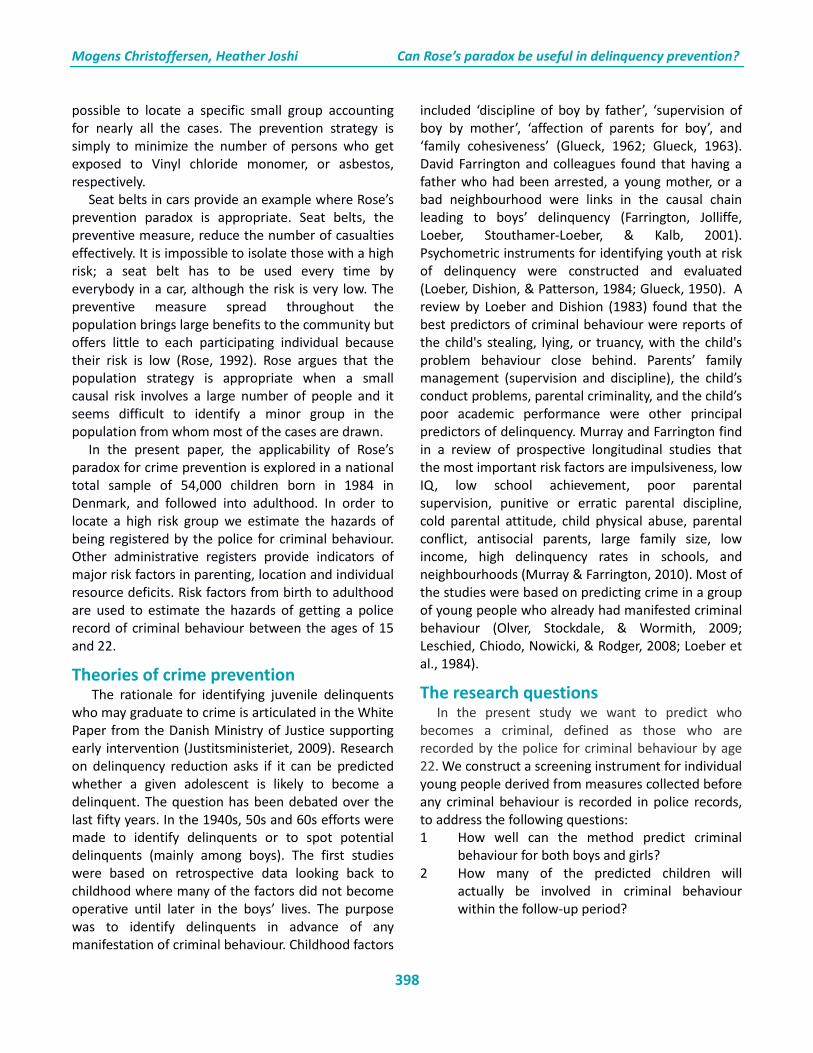
Longitudinal and Life Course Studies 2015 Volume 6 Issue 4 Pp 397 – 419 ISSN 1757-9597 397 Can Rose’s paradox be useful in delinquency prevention? Mogens Nygaard Christoffersen SFI – The Danish National Centre for Social Research, Denmark [email protected] Heather Joshi UCL Institute of Education, UK (Received November 2013 Revised May 2014) http://dx.doi.org/10.14301/llcs.v6i4.274 Abstract Geoffrey Rose’s prevention paradox obtains when the majority of cases with an adverse outcome come from a population of low or moderate risk, and only a few from a minority ‘high risk’ group. Preventive treatment is then better targeted widely than on the ‘high risk’ minority. This study tests whether the prevention paradox applies to the initiation of criminal behaviour, as recorded in longitudinal administrative data from Denmark. Children born in 1984 are followed from birth to early adulthood. A discrete-time Cox model allows for changing covariates over time. The initiation of criminal behaviour is defined as getting a police record between the ages of 15 and 22 as a result of a criminal matter. This outcome was predicted, more accurately than by chance, by a combination of over twenty risk factors, reflecting the major crime reduction paradigms. However, it seems impossible to identify a minor group (<5%) in the population from whom criminals are exclusively recruited. Our example illustrates how the applicability of Rose’s prevention strategy, population based, rather than targeted, depends on how narrowly ’high-risk group’ is defined, for a given distribution of estimated risk, and allows for the possible complementarity of population and targeted measures. Keywords Birth Cohort, Criminal Behaviour, Juvenile Delinquency, Prevention, Life Course, Childhood Risk Factors, Register data. Introduction It is often found that a small group of individuals is responsible for a sizeable proportion of all offending activity. Studies in Britain and Denmark find that about 6% of offenders account for more than half of offending activity (Piquero, Farrington, & Blumstein, 2007; Kyvsgaard, 2002). They imply that the targeting of crime prevention on these high-risk individuals at an early stage, before they have started their criminal career, could bring large benefits to the community, as well as the individuals themselves. This supports an approach to crime prevention which focuses on the few who are most likely to become involved in breaking the law. Such a narrow focus strategy can be contrasted with the ‘population strategy’, based on Geoffrey Rose’s prevention paradox (Rose, 1992). Rose drew attention to some situations where the majority of cases come from the population at low or moderate risk and only a minority from the high risk group. Targeting the minor high risk group in that case may be ineffective. Rose’s prevention paradox does not always apply. In the health field, for example, a certain liver cancer (haemangiosarcoma) can only be caused by exposure to Vinyl chloride monomer and asbestosis can only be caused by exposure to asbestos. In these cases it is
Transcript of Can Rose's paradox be useful in crime prevention
Longitudinal and Life Course Studies 2015 Volume 6 Issue 4 Pp 397 – 419 ISSN 1757-9597
397
Can Rose’s paradox be useful in delinquency prevention? Mogens Nygaard Christoffersen SFI – The Danish National Centre for Social Research, Denmark [email protected] Heather Joshi UCL Institute of Education, UK (Received November 2013 Revised May 2014) http://dx.doi.org/10.14301/llcs.v6i4.274 Abstract
Geoffrey Rose’s prevention paradox obtains when the majority of cases with an adverse outcome come from a population of low or moderate risk, and only a few from a minority ‘high risk’ group. Preventive treatment is then better targeted widely than on the ‘high risk’ minority. This study tests whether the prevention paradox applies to the initiation of criminal behaviour, as recorded in longitudinal administrative data from Denmark. Children born in 1984 are followed from birth to early adulthood. A discrete-time Cox model allows for changing covariates over time. The initiation of criminal behaviour is defined as getting a police record between the ages of 15 and 22 as a result of a criminal matter. This outcome was predicted, more accurately than by chance, by a combination of over twenty risk factors, reflecting the major crime reduction paradigms. However, it seems impossible to identify a minor group (<5%) in the population from whom criminals are exclusively recruited. Our example illustrates how the applicability of Rose’s prevention strategy, population based, rather than targeted, depends on how narrowly ’high-risk group’ is defined, for a given distribution of estimated risk, and allows for the possible complementarity of population and targeted measures.
Keywords Birth Cohort, Criminal Behaviour, Juvenile Delinquency, Prevention, Life Course, Childhood Risk Factors, Register data. Introduction It is often found that a small group of individuals is responsible for a sizeable proportion of all offending activity. Studies in Britain and Denmark find that about 6% of offenders account for more than half of offending activity (Piquero, Farrington, & Blumstein, 2007; Kyvsgaard, 2002). They imply that the targeting of crime prevention on these high-risk individuals at an early stage, before they have started their criminal career, could bring large benefits to the community, as well as the individuals themselves. This supports an approach to crime prevention which focuses on the few who are most likely to
become involved in breaking the law. Such a narrow focus strategy can be contrasted with the ‘population strategy’, based on Geoffrey Rose’s prevention paradox (Rose, 1992). Rose drew attention to some situations where the majority of cases come from the population at low or moderate risk and only a minority from the high risk group. Targeting the minor high risk group in that case may be ineffective. Rose’s prevention paradox does not always apply. In the health field, for example, a certain liver cancer (haemangiosarcoma) can only be caused by exposure to Vinyl chloride monomer and asbestosis can only be caused by exposure to asbestos. In these cases it is
Mogens Christoffersen, Heather Joshi Can Rose’s paradox be useful in delinquency prevention?
398
possible to locate a specific small group accounting for nearly all the cases. The prevention strategy is simply to minimize the number of persons who get exposed to Vinyl chloride monomer, or asbestos, respectively. Seat belts in cars provide an example where Rose’s prevention paradox is appropriate. Seat belts, the preventive measure, reduce the number of casualties effectively. It is impossible to isolate those with a high risk; a seat belt has to be used every time by everybody in a car, although the risk is very low. The preventive measure spread throughout the population brings large benefits to the community but offers little to each participating individual because their risk is low (Rose, 1992). Rose argues that the population strategy is appropriate when a small causal risk involves a large number of people and it seems difficult to identify a minor group in the population from whom most of the cases are drawn. In the present paper, the applicability of Rose’s paradox for crime prevention is explored in a national total sample of 54,000 children born in 1984 in Denmark, and followed into adulthood. In order to locate a high risk group we estimate the hazards of being registered by the police for criminal behaviour. Other administrative registers provide indicators of major risk factors in parenting, location and individual resource deficits. Risk factors from birth to adulthood are used to estimate the hazards of getting a police record of criminal behaviour between the ages of 15 and 22.
Theories of crime prevention The rationale for identifying juvenile delinquents who may graduate to crime is articulated in the White Paper from the Danish Ministry of Justice supporting early intervention (Justitsministeriet, 2009). Research on delinquency reduction asks if it can be predicted whether a given adolescent is likely to become a delinquent. The question has been debated over the last fifty years. In the 1940s, 50s and 60s efforts were made to identify delinquents or to spot potential delinquents (mainly among boys). The first studies were based on retrospective data looking back to childhood where many of the factors did not become operative until later in the boys’ lives. The purpose was to identify delinquents in advance of any manifestation of criminal behaviour. Childhood factors
included ‘discipline of boy by father’, ‘supervision of boy by mother’, ‘affection of parents for boy’, and ‘family cohesiveness’ (Glueck, 1962; Glueck, 1963). David Farrington and colleagues found that having a father who had been arrested, a young mother, or a bad neighbourhood were links in the causal chain leading to boys’ delinquency (Farrington, Jolliffe, Loeber, Stouthamer-Loeber, & Kalb, 2001). Psychometric instruments for identifying youth at risk of delinquency were constructed and evaluated (Loeber, Dishion, & Patterson, 1984; Glueck, 1950). A review by Loeber and Dishion (1983) found that the best predictors of criminal behaviour were reports of the child's stealing, lying, or truancy, with the child's problem behaviour close behind. Parents’ family management (supervision and discipline), the child’s conduct problems, parental criminality, and the child’s poor academic performance were other principal predictors of delinquency. Murray and Farrington find in a review of prospective longitudinal studies that the most important risk factors are impulsiveness, low IQ, low school achievement, poor parental supervision, punitive or erratic parental discipline, cold parental attitude, child physical abuse, parental conflict, antisocial parents, large family size, low income, high delinquency rates in schools, and neighbourhoods (Murray & Farrington, 2010). Most of the studies were based on predicting crime in a group of young people who already had manifested criminal behaviour (Olver, Stockdale, & Wormith, 2009; Leschied, Chiodo, Nowicki, & Rodger, 2008; Loeber et al., 1984).
The research questions In the present study we want to predict who becomes a criminal, defined as those who are recorded by the police for criminal behaviour by age 22. We construct a screening instrument for individual young people derived from measures collected before any criminal behaviour is recorded in police records, to address the following questions: 1 How well can the method predict criminal
behaviour for both boys and girls? 2 How many of the predicted children will
actually be involved in criminal behaviour within the follow-up period?

Mogens Christoffersen, Heather Joshi Can Rose’s paradox be useful in delinquency prevention?
399
3 How many of the young people who do get into trouble with the police will actually come from the ’high risk‘ group?
4 What level of estimated risk should count as ‘high’?
The answers to these questions may help us to choose between a crime reduction programme based on universal measures (Rose’s population strategy) and one focussed on the ’high-risk’. The next section of the paper reviews theories of crime prediction and prevention. This is followed by sections on data sources and methods and results. The discussion section includes a reminder of the research questions, before a brief conclusion. The appendices give details of the register data sources, supplementary regression results and the statistical model.
Theories of crime prediction and prevention The strategy of crime prevention focussed on ‘high risk’ individuals involves screening and early treatment for those at the extreme of the risk distribution. An important aim of this crime prevention strategy is a reduction in the risk factors under the assumption that the risk factors represent a causal link between risk factors and outcome. Per-Olaf Wikström emphasizes the importance of addressing the lack of integration of levels of explanation of how environmental and individual conditions interact (Wikström, 2006). Predictors or risk factors are chosen on the basis of four major paradigms each with its own explanation of crime and potential relevance to crime reduction in primary and secondary crime prevention theories (Hope, 2000; Soothill, Christoffersen, Hussain, & Francis, 2010). 1. Primary crime prevention theory focuses on universal measures to reduce delinquency without reference to individual characteristics. Such a ‘population strategy’ aims at reducing crime by interventions directed at the general population. One paradigm (1.a.) emphasizes the importance of the current situation and opportunities as the most essential factors rather than the individual’s background (Clarke, 1980). Prevention should focus on the setting itself that may prompt, provoke, pressure, or permit an individual to offend (Cornish &
Clarke, 2003; Clarke, 1997). The other primary paradigm (1.b.) links criminal behaviour to localities or neighbourhoods and only to a lesser extent to individual characteristics (Sampson, Morenoff, & Raudenbush, 2005; Wikström, 1998). Segregation differentially exposes members of disadvantaged groups to violence and looser informal community controls. This theory implies that generic interventions to improve neighbourhood conditions and support families may reduce violence in the locality, and that moving individuals out of a high risk area will in itself reduce their risk of offending. 2. Secondary crime prevention targets specific subgroups of the population believed to be at greater risk than others - a ‘high risk’ approach. Here again we have two main paradigms: Paradigm (2.a) focuses on developmental theories, parental child-rearing methods and disadvantages during adolescence as the background for deviant behaviour (Farrington & Welsh, 2007; Farrington, 1994; Loeber & Blanc, 1990). Paradigm (2.b) focuses the decision-making processes of young people at high risk of delinquency, explaining delinquency by resources such as their own lack of education, poverty, unemployment, or unstable family status. According to this paradigm, criminality can be seen as a rational behaviour, one among several possibilities to increase income (Becker, 1968). Under this fourth paradigm the prevalence of crime depends on: the possibilities of illegal compared to legal income; the risk of being caught; the severity of the punishment in case of conviction; the possibilities of legal employment; individual willingness to expose oneself to risks and preferences for crime; and the amount of their social capital – reputation, employment, marriage (Williams & Sickles, 2002). Within this paradigm, crime prevention effort focuses on the options of high-risk groups and how to influence their rational choices. 3. Tertiary crime prevention aims to truncate the criminal career and deals with the treatment of known offenders (Pease, 1997). This is further down the line than the point on which we focus – the first-time contact with the police before the criminal career has taken any further steps. Hence the present study seeks inspiration from the theories of primary and secondary crime prevention. These four paradigms are not mutually exclusive, but constitute
Mogens Christoffersen, Heather Joshi Can Rose’s paradox be useful in delinquency prevention?
400
our frame of reference for selection of potential risk factors to predict crime in a prospective longitudinal study.
Causality If Rose’s prevention paradox is appropriate for forming a crime prevention strategy, there has to be a causal link between effective population intervention measures and criminal activities. There have been several comprehensive reviews on such evidence (for example: Farrington & Welsh, 2007). These measures include: changing parenting practices (Olds et al., 1998); changed environments in preschools (Schweinhart et al., 2005); peer tutoring or mentoring in schools (Hahn, 1999; Welsh, 2007); or school training programs (Pfiffner, R.A.Barkley, & G.J. DuPaul, 2006); and anti-bullying programs in schools (Olweus, 2005). These measures have demonstrated causality via effective prevention in randomized control trials. At the present stage, not all paradigms have been supported when they were implemented as delinquency prevention strategies. Measures targeting localities/neighbourhoods have not yet delivered the expected results in U.S.A. (Welsh & Hoshi, 2006). Prospective longitudinal studies offer the best way to study the predictors of delinquent and criminal behaviour (Murray, Farrington, & Eisner, 2009). A review by Farrington, Ohlin, & Wilson, (1986) found eleven prospective longitudinal surveys with information about crime and delinquency based on samples of at least hundreds of persons. Liberman (2008) found over 60 longitudinal data sets, and more have been published since. Two thirds of the studies were from the U.S., the rest came from ten other developed countries, including Denmark. One in four studies included males only.
Data We use longitudinal data assembling indicators of risk factors for a complete cohort of all children born
in 1984 (N=27,840 boys and 26,618 girls) in Denmark. The children are followed from birth to early adulthood in 2006. A criterion for participation was that the children were resident in Denmark on 1 January 1998 at 14 years of age. Adolescents known to have emigrated or died were censored at the last person year they appeared in the records. The risks are estimated from birth until they first get a police record or until early adulthood. The register includes individual risk factors such as living in a disadvantaged area, parental circumstances and behaviour, and individual resource deficits recorded for the birth cohort from an early age and in early adulthood (table 1 and appendix A). The risk factors and outcome variables were chosen on four criteria: 1) A theoretically grounded choice based on the crime paradigms set out above, and on prior empirical evidence. 2) Predictions should rest on a non-biased population-wide base. 3) The risk factors should be registered in the administrative archives. 4) With these constraints on data availability, the outcome was chosen as the event of first getting a record in the police register of criminal behaviour under the Penalty Code. Someone appears in the police register if they are either charged or confined under the criminal Penalty Code, see appendix A for details. The criterion used indicates the event of embarking on what may turn into a ‘criminal career’. This measure is not a true measure of crime, because some of those with records, say of arrest only, will not be convicted. Equally, some of those who have committed crimes will not have been brought to the notice of the police. However, this indicator is treated as proxy for criminality, subject to these caveats and we sometimes use this term in what follows where we do not explicitly remind readers that the police register is our source.

Mogens Christoffersen, Heather Joshi Can Rose’s paradox be useful in delinquency prevention?
401
Table 1. Information selected from the population-based registers used in the Danish cohort study
Note: information in registers includes both children and parents. Administrative registers, linked together via personal identity numbers, have the advantage, over survey data, of smaller reporting biases. The data they harvest has three positive attributes: 1) They are registered prospectively - that is, information gathered in calendar year ‘t+1’ has no influence whatsoever on data filed in calendar year ‘t’: these register data are not subject to back -filling, even if later information reveals errors, they are not corrected in the files available for research. 2) Data are provided independently from a number of agencies, who have no knowledge of each other’s entries. 3) They have complete coverage of all calendar years from their birth in 1984 until 2006, when the cohort reaches age 22. One drawback to register data is that they only provide information known to the authorities, not for example attitudes or abilities of parents or children, psychiatric disorders not requiring admission to hospital,
unreported domestic violence or undetected offences. Another is that registers are not immune from error. Registers known to be particularly unreliable, according to internal reliability tests or a few external reliability assessments, have not been used here.
Method The analysis proceeds in three stages. First, variables were selected as potential predictors on the basis of relevance to the theories outlined above, from the more reliable sources, as listed in appendix A. Second, the predictive value of these risk factors was tested in model 1, which includes all risk factors selected on a priori grounds at the first stage. It indicates if any of them prove to be redundant. In the third stage, model 2 drops the risk factors whose estimates were not significant in model 1. The improvement of prediction is estimated by the Hosmer & Lemeshow Goodness-of-fit test (table 2). We use a maximum likelihood method to estimate a discrete-time Cox regression model (Allison, 1982). A
Register Variables Years included
Police archives Arrest, pre-trail detention, charges of crime under the Penalty Code 1999-2006
Population statistics Gender, age, marital status, address 1980-2006
Medical register on vital statistics Cause of death, suicide 1979-2006
Employment statistics Unemployment, branch of trade, occupation 1980-2006
Housing statistics Ownership, number of rooms, 1980-2006
Education statistics School achievements, education, vocational training 1981-2006
Social assistance act statistics Children in care, preventive care 1977-2006
Crime statistics Violation, adjudication, imprisonment 1980-2006
Income compensation benefits Social benefit, duration 1984-2006
Income statistics tax register Income 1980-2006
Fertility Database No. of siblings, parity, link to parents 1980-2006
National inpatient register ICD-8/10 diagnoses (somatic) 1977-2006
National psychiatric register ICD-8/10 diagnoses (psychiatric) 1979-2006
Mogens Christoffersen, Heather Joshi Can Rose’s paradox be useful in delinquency prevention?
402
similar method has been used in other crime risk studies (Christoffersen, Soothill & Francis., 2003; Soothill et al., 2010). See appendix B for details of the statistical model. The discrete-time Cox model was chosen to allow for changing covariates over time. The risk factors are divided into three types of time co-variation, according to the number of years for which they are introduced. Type I risk factors identify the presence of that factor in the year before the outcome may occur, for example, living in a disadvantaged area when the subject was 18 will act as a risk factor when the subject is 19 – the following calendar year, and being there at age 19 would be a risk factor for age 20. Type I factors are reversible. Thus, a move out of a disadvantaged area at 20 would affect prediction in for the following year, age 21. Type II risk factors are time-varying, in that they are introduced in the year when they first occur, but once ‘switched on’ are irreversible, applying for all subsequent years. Family separation, for example is one of the factors assumed to have such a lasting effect. Type III risk factors are those that are taken to indicate a permanent condition throughout the risk period from age 15, for example, if the child didn’t ever pass lower secondary ('basic') level this is taken to be an indicator of permanent poor performance.
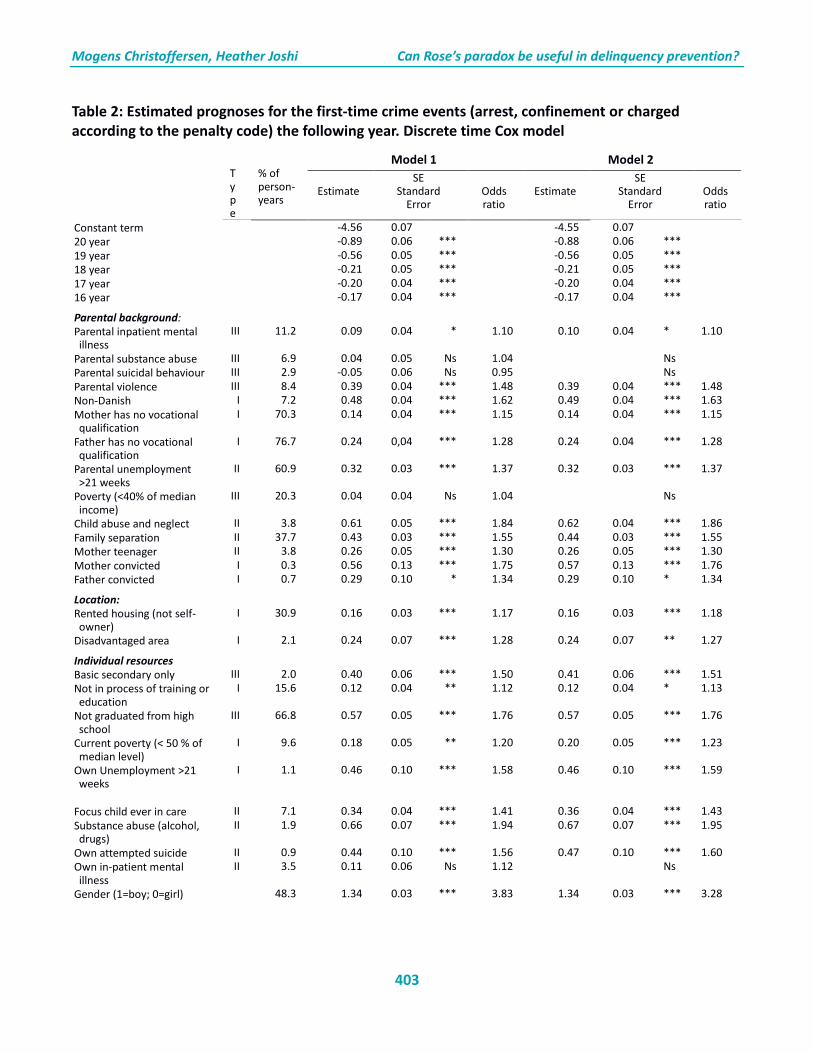
Results Among the birth cohort of 54,458 individuals 11.2% (or 6,075) had experienced at least one contact with the police (arrest, confinement or charge under the Penalty Code) between the ages of 15 and 22. This represents 17.0% of the males and 5.0% of the females. Among the risk factors, whose mean person years are listed in the second column of table 2, parental mental illness during childhood was registered during 11% of person years from 15 to 22. Registered violence to or by parents in the childhood home apply to 8% of the years under observation. In about 60% of the person years, one of the parents had experienced at least one year with more than 21 weeks of unemployment up to that point. During the window when the children were 15 to 22 years old, nearly 38% of person-years had been preceded by a family separation at some point. While these risk factors are examples of relatively common incidence, other predictors are rare. Only 2% of the person-years from age 15 had lived in a disadvantaged
area. Child abuse and neglect are registered for 3.8% of the person-years. The focus-child having ever been in social care covers 7.1% of the person years. Less than 1% of the person-years had followed a parental conviction according to the criminal code (Type I).
Risk factors As shown in table 2, most of the 25 potential risk factors, selected for model 1 on theoretical grounds turned out to be highly significant predictors of getting a police record. Although the effect sizes may be modest for the individual risk factors, the total picture may be predictive. Four turned out to be redundant: parental suicidal behaviour, parental substance abuse, poverty during the young person’s upbringing and the young person’s hospitalisation for psychiatric disorder. If these factors do have an influence, it is absorbed into other risk factors. Odds ratios greater than 1 confirm a positive association with crime. The estimates were not affected by excluding the redundant covariates. Model 2 showed that parental background factors such as domestic violence, parental mental illness, child abuse and neglect, child in (public) care, and family separation all contributed independent information to the prediction of criminality. Structural factors such as parental vocational qualifications and parental unemployment also contributed to the explanation model, as did the young person living in a disadvantaged area or rented housing, and other indictors of a resource deficit in the young person’s ‘human capital’: low education, youth poverty and youth unemployment. Other variables retained in model 2 pertaining to the young person’s behaviour, with relatively high odds ratios, were substance abuse (alcohol or drugs ) and attempted suicide (ORs 1.95 and 1.60 respectively). Convictions of the mother, though very rare (0.3% of person years), were strong predictors of their offspring’s later police contacts with an odds ratio of 1.76. Convicted fathers were not quite as rare (0.7%) and were less strongly associated (OR 1.34). Up to a point, the results conform to the notion that it is the rarer risk factors which have the higher risks, e.g., child abuse and neglect - 3.8 % of person-years and odds ratio of 1.86. However the risk ratios attaching to childhood or adolescent adversity are dwarfed by the relative risk of being male, where the odds of being registered for criminal behaviour is three times higher than for females.
Mogens Christoffersen, Heather Joshi Can Rose’s paradox be useful in delinquency prevention?
403
Table 2: Estimated prognoses for the first-time crime events (arrest, confinement or charged according to the penalty code) the following year. Discrete time Cox model
Type
% of person-years
Model 1 Model 2
Estimate SE
Standard Error
Odds ratio
Estimate
SE Standard
Error
Odds ratio
Constant term -4.56 0.07 -4.55 0.07 20 year -0.89 0.06 *** -0.88 0.06 *** 19 year -0.56 0.05 *** -0.56 0.05 *** 18 year -0.21 0.05 *** -0.21 0.05 *** 17 year -0.20 0.04 *** -0.20 0.04 *** 16 year -0.17 0.04 *** -0.17 0.04 ***
Parental background:
Parental inpatient mental illness
III 11.2 0.09 0.04 * 1.10 0.10 0.04 * 1.10
Parental substance abuse III 6.9 0.04 0.05 Ns 1.04 Ns Parental suicidal behaviour III 2.9 -0.05 0.06 Ns 0.95 Ns Parental violence III 8.4 0.39 0.04 *** 1.48 0.39 0.04 *** 1.48 Non-Danish I 7.2 0.48 0.04 *** 1.62 0.49 0.04 *** 1.63 Mother has no vocational qualification
I 70.3 0.14 0.04 *** 1.15 0.14 0.04 *** 1.15
Father has no vocational qualification
I 76.7 0.24 0,04 *** 1.28 0.24 0.04 *** 1.28
Parental unemployment >21 weeks
II 60.9 0.32 0.03 *** 1.37 0.32 0.03 *** 1.37
Poverty (<40% of median income)
III 20.3 0.04 0.04 Ns 1.04 Ns
Child abuse and neglect II 3.8 0.61 0.05 *** 1.84 0.62 0.04 *** 1.86 Family separation II 37.7 0.43 0.03 *** 1.55 0.44 0.03 *** 1.55 Mother teenager II 3.8 0.26 0.05 *** 1.30 0.26 0.05 *** 1.30 Mother convicted I 0.3 0.56 0.13 *** 1.75 0.57 0.13 *** 1.76 Father convicted I 0.7 0.29 0.10 * 1.34 0.29 0.10 * 1.34
Location:
Rented housing (not self-owner)
I 30.9 0.16 0.03 *** 1.17 0.16 0.03 *** 1.18
Disadvantaged area I 2.1 0.24 0.07 *** 1.28 0.24 0.07 ** 1.27
Individual resources
Basic secondary only III 2.0 0.40 0.06 *** 1.50 0.41 0.06 *** 1.51 Not in process of training or education
I 15.6 0.12 0.04 ** 1.12 0.12 0.04 * 1.13
Not graduated from high school
III 66.8 0.57 0.05 *** 1.76 0.57 0.05 *** 1.76
Current poverty (< 50 % of median level)
I 9.6 0.18 0.05 ** 1.20 0.20 0.05 *** 1.23
Own Unemployment >21 weeks
I 1.1 0.46 0.10 *** 1.58 0.46 0.10 *** 1.59
Focus child ever in care II 7.1 0.34 0.04 *** 1.41 0.36 0.04 *** 1.43 Substance abuse (alcohol, drugs)
II 1.9 0.66 0.07 *** 1.94 0.67 0.07 *** 1.95
Own attempted suicide II 0.9 0.44 0.10 *** 1.56 0.47 0.10 *** 1.60 Own in-patient mental illness
II 3.5 0.11 0.06 Ns 1.12 Ns
Gender (1=boy; 0=girl) 48.3 1.34 0.03 *** 3.83 1.34 0.03 *** 3.28

Mogens Christoffersen, Heather Joshi Can Rose’s paradox be useful in delinquency prevention?
404
Notes for Table 2
Number of first-time events n=6,075. Total number of individuals in the study = 54.458, while the total number of person-years = 300,591.
* p < 0.05; ** p < 0.001; *** p < 0.0001. Ns Non-significant.
Type of time-dependency
Type I: exposed to risk factor at time t then the risk factors is also present at t+1.
Type II: exposed to risk factor at time t then risk factor is also present at all the following years.
Type III: risk factor observed for at time t it also covers the years before and after the years under investigation.
The Hosmer & Lemeshow Goodness-of-fit test shows that prediction capability is increased when using model 2 instead of model 1. Model1: Chi-square 9.32; DF 8; Pr<0.32 while Model 2: Chi-square 8.62; DF 8; Pr<0.38).
Detailed definitions of the variable in Appendix A Source: Table 2 is based on: Register data and PolSas, Police Archive data ( Christoffersen, Skov Olsen, Vammen, Sander Nielsen, Lausten, & Brauner, 2011). These estimates are presented for males and females together, with just this substantial intercept to distinguish them. It might be expected that the relationship with risk factors would be sex-specific. To investigate this we estimated a fully interacted version of model 1 allowing the 25 parameters to vary by sex. Most of them (20 out of 25) were identical for men and women, see appendix C. Four risk factors were more predictive for girls than boys: parental mental illness, the mother having been convicted, the young person having attempted suicide or not being in training. On the other hand, other things equal, boys who left secondary school without qualification showed particularly high levels of criminality. Since gender differences are mainly accounted for by the binary intercept, we proceed with a pooled model, rather than a separate one for females, where offences are quite sparse. Although the girls would be particularly outnumbered in any ‘high risk’ group it might not be possible to exclude them from interventions. Another presumption is that many young people with a police record will have just one episode of offending and none further (Moffitt, 1993). To investigate this we estimated the odds ratio, in the original cohort, for a second contact with the police, and for third, fourth and fifth contacts. We do not estimate transitions to a higher number of contacts
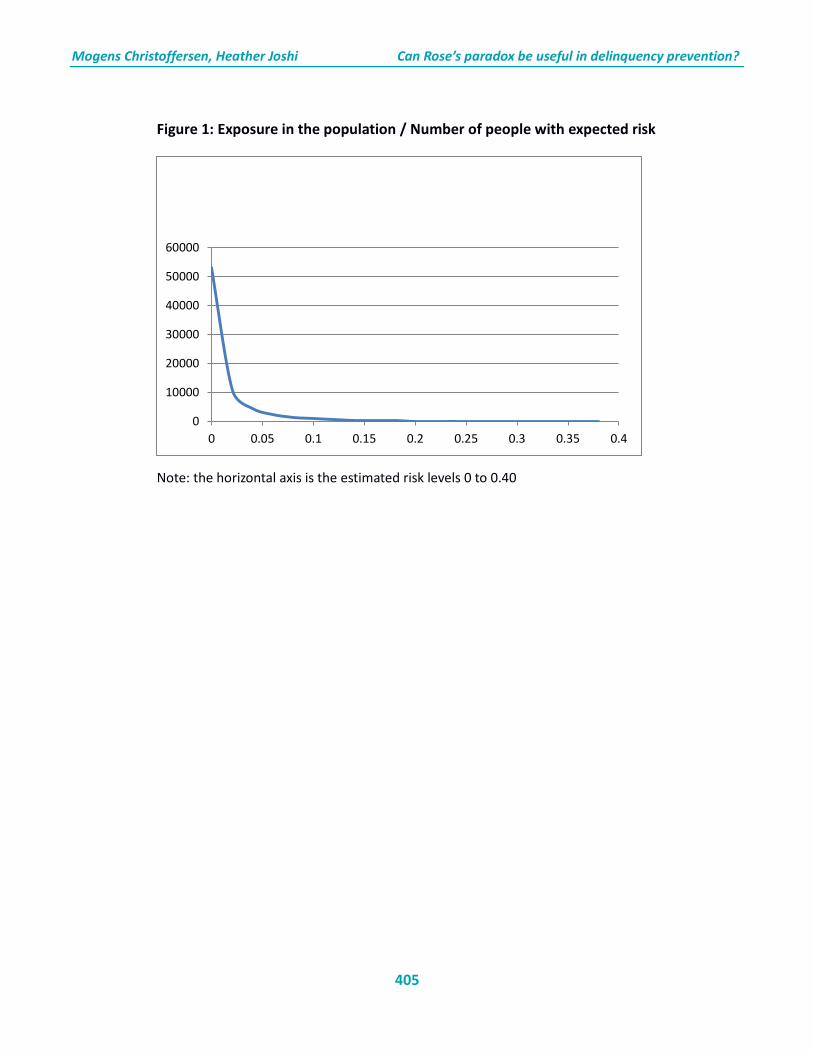
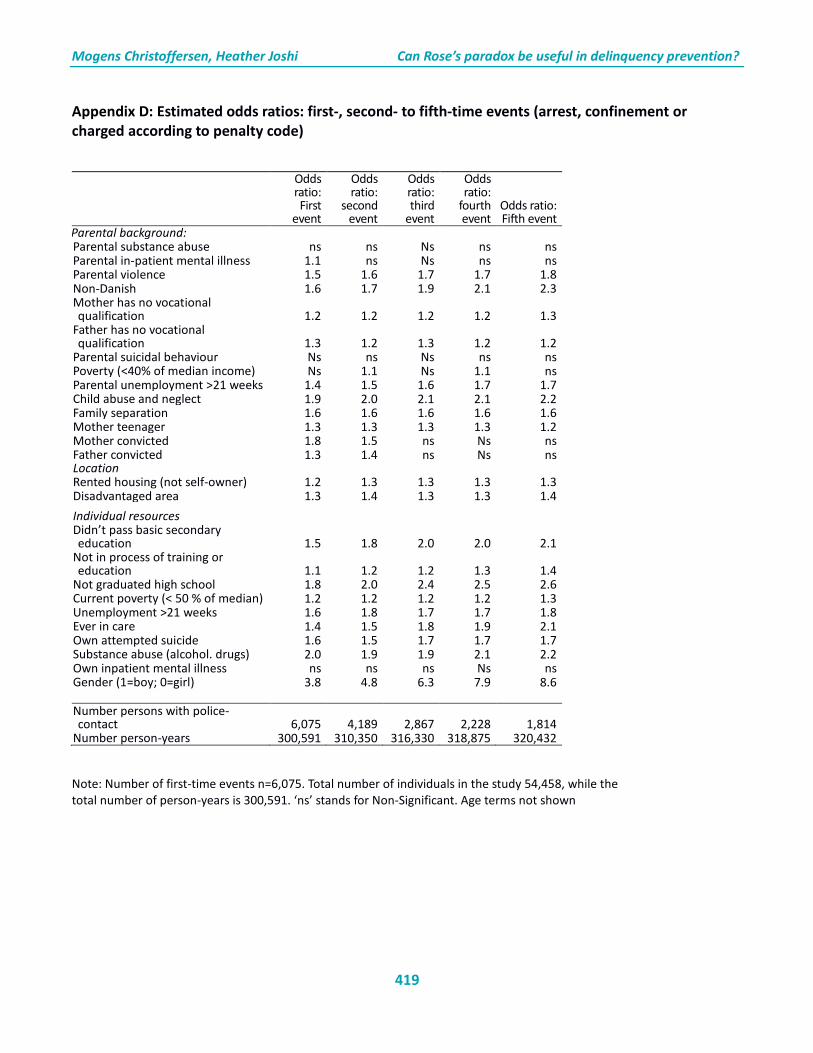
conditional on having reached the previous level since our aim is to explore early interventions based on information about risk factors from before the first contact. Contrary to the assumption that one-time-only offenders have a different risk profile to those who repeat, the parameters estimated for a second contact with the police were similar to that of a first. However the risks did rise slightly for having the third or further registered encounters with the police. This suggests that the minority of ‘hard core recidivists’ were somewhat more strongly associated with some risk factors than those with one or two, as shown in appendix D. Effect sizes (Odds ratios) increased slightly for boys, for young people who had been in care, who had experienced a violent childhood (domestic violence, abuse and neglect), who were non-Danish, and for those with poor school performance. Figure 1 shows the number of people and their estimated risk of being placed on the police criminal register between ages 15 and 22. No-one is estimated to have a risk over 0.4, in fact very few over 0.2. Many are estimated to have very low risks. In trying to predict which of the young people will eventually get a police record of criminal behaviour we need to specify a level of risk that characterises the target.
Mogens Christoffersen, Heather Joshi Can Rose’s paradox be useful in delinquency prevention?
405
Figure 1: Exposure in the population / Number of people with expected risk
Note: the horizontal axis is the estimated risk levels 0 to 0.40
0
10000
20000
30000
40000
50000
60000
0 0.05 0.1 0.15 0.2 0.25 0.3 0.35 0.4

Mogens Christoffersen, Heather Joshi Can Rose’s paradox be useful in delinquency prevention?
406
Table 3: Classification over probability cut-point, estimated expected risk of criminality, and observed criminality in all the years under observation
Numbers
Percentages
Cut-point Criminality:
Probability level
Observed Expected
Not observed
Not expected
Not observed Expected
Observed Not expected
False positive1
%
False- negative2
%
False positive:
False negative:
(a) (b) (c) (d) c/( a+c)% d/(b+d) % 0.00 6075 0 47154 0 88.6 - 0.02 4371 40833 6321 1704 59.1 4.0 0.04 2673 45295 1859 3402 41.0 7.0 0.06 1631 46359 795 4444 32.8 8.7 0.08 1052 46778 376 5023 26.3 9.7 0.10 681 46970 184 5394 21.3 10.3 0.12 467 47060 94 5608 16.8 10.6 0.14 317 47104 50 5758 13.6 10.9 0.16 223 47123 31 5852 12.2 11.0 0.18 146 47132 22 5929 13.1 11.2 0.20 108 47137 17 5967 13.6 11.2 0.22 83 47142 12 5992 12.6 11.3 0.24 51 47148 6 6024 10.5 11.3 0.26 28 47150 4 6047 12.5 11.4 0.28 17 47151 3 6058 15.0 11.4 0.30 16 47152 2 6059 11.1 11.4 0.32 10 47153 1 6065 9.1 11.4 0.34 7 47153 1 6068 12.5 11.4 0.36 5 47153 1 6070 16.7 11.4 0.38 3 47153 1 6072 25.0 11.4
Mogens Christoffersen, Heather Joshi Can Rose’s paradox be useful in delinquency prevention?
407
Maximisation of sensitivity and specificity One aim would be to maximize 'sensitivity' - the proportion of those registered (‘observed’) with a police record who are correctly predicted by the model to have one ('expected'). We also aim to maximize ‘specificity’ - the proportion of those with no police record who are correctly predicted to have no record. To operationalize sensitivity and specificity, we need to set a level of estimated probability sufficiently high to constitute a positive prediction. No individual has an estimated certainty of getting a police record with probability of 100%. Assuming a cut-point to distinguish between cases and non-cases in a target group, we can compute the sensitivity and specificity, as plotted in figure 2. The analytical tool (Receiver Operating Characteristic, ROC) maximises both these measures simultaneously (Woodward, 1999). It turns out that the cut-point at 0.02 maximizes the sum of these two measures. Prediction using the cut-point 0.02 (one in fifty) is much better than chance (P<0.0001). Table 3 shows it predicts 10,692 individuals out of the total birth cohort of 54,458 to have entered police criminal records. This will correctly assign 4,371 out of 6,075 of those observed in the register (71.9%), the’ true positives’. Unfortunately, it also includes 6,321 ‘false positives’, that is those with no police record who were predicted as having one – this is a majority (59.1 per cent) of all ‘expected’ cases. Thus this cut-point will also include some moderate and low risk individuals.
As the cut-point rises, the number of cases falsely assigned to the criminal category declines, but so does sensitivity (see figure 2). By the time the cut-point reaches around 0.2 (one in five) , there are very few ‘positives’, either true or false. Almost all of the criminals would be ‘false negatives’. Attempting to characterize a very high risk minority would miss a lot of offenders.
Rose’s paradox This illustrates Rose's paradox that efforts to prevent criminal behaviour aimed at screening and treatment of individuals at 'very high risk' are likely to have limited population impact, if the majority of cases do not occur in the minority high-risk group. The likelihood of finding empirical support for the prevention paradox rests upon the relative size of the minority high-risk group (Romelsjö & Danielsson, 2012). Table 4 operationalizes the high-risk group as reducing from 20% to 2% of the population as the cut-point rises from 0.02 to 0.10, an increasingly narrow definition of the high risk group. For example, the 5% of the population with an estimated risk of at least 0.06 will include only 27% of the people actually registered for criminal behaviour during the observation period. However, if we drop the cut-point to 0.04, extending the high-risk group to 9% of the population, nearly half of the young persons with police contact (44%) will be correctly predicted. On the other hand, about 41% of the predictions of criminality will be incorrect (false positive).

Mogens Christoffersen, Heather Joshi Can Rose’s paradox be useful in delinquency prevention?
408
Figure 2: Sensitivity, specificity, and their sum against cut-points used to distinguish expected criminals from non-expected criminals for the data in table 3
True positive rate (sensitivity): number of observed and expected criminal persons in relation to number of observed criminals. Specificity: number of expected and observed non-criminals in relation to number of observed non-criminals. The vertical line represents a cut-point of 0.02 Source: Table 2, model 2
Source: Table 3
Table 4: Classification table over probability cut-point: estimated percentage of population, and observed, and expected first-time offenders. (selected cut-points)
Percentage of population
Expected as percentage of observed first-time offenders
(a) (b)
0.02 20 72 0.04 9 44 0.06 5 27 0.08 3 17 0.10 2 11 Total 53,229 6,075

Mogens Christoffersen, Heather Joshi Can Rose’s paradox be useful in delinquency prevention?
409
The cut-point which maximises the sum of sensitivity and specificity, 0.02, extends the target group to 20% of the population. It implies that around one fifth of the population (10,692), including 72% of actual offenders, might be offered a targeted intervention. Less than half the target (41% or 4,371) would have been correctly identified as criminal while 1,704 offenders (3% of the population) would be missed. Screening one fifth of the total population (on the basis of information in principle available in many registers) could be seen as more cost-effective than reaching the wider population, although targeting 20% of the population could not be called a very small minority. A universal intervention would reach all of the cases who actually ended up on the register (no false negatives), but it would also cover the 89% of the population who do not come into police contact – the’ false positives’. They are analogous to the seat-belt users who never have a road accident.
Discussion The first research question was whether accurate predictions of risk of offending could be made. Our analysis of a wide range of information from administrative registers clearly gives a better prediction of future criminal behaviour than chance. It was expected that girls would have a lower risk-level and also a different risk profile than boys, but the risk factors generally had the similar effect sizes in boys and girls - although boys tended to have a higher starting point. We also investigated whether ‘hard core criminals’ had a different childhood risk profile than the young people whose record includes only one offence. Our results indicate only small differences between the first and the second contact with the police. The second and third research questions concerned the sensitivity and specificity of the predictions. The answer to these questions depends on where we draw the line between high and moderate risk. The majority of criminal persons come from a population with low or moderate risk and only a minority of the criminals come from the high-risk population. The optimal cut-point (0.02) in this dataset means that 20% of the population would be targeted as ‘at risk’ but only 8% will be correctly identified as offenders; 12% would be false positive while another 3% of the population would be offenders who get missed (false negative). In other
words, for more than half of the young people whose previous life events predicted a probability of (registered) criminal behaviour above one in fifty, there was no police record during the follow-up years. Thus, this ‘low threshold’ indicator of a (relatively) high risk profile apparently makes a false ‘accusation’ to nearly 60% of the subjects. Although it is possible that they might have engaged in delinquent behaviour which escaped police notice, these results demonstrate the problem of labelling or stigmatising young adults with a high risk profile according to administrative data. There is still a small but widespread risk in the other 80% of the population which accounts for 28% of recorded delinquency. The fourth research question asked what proportion of estimated risk should count as ‘high’. Other empirical studies have operationalized the minority at high risk at between 5% and 35%, although 10% is commonly reported. This exercise has focussed on a definition based on maximising the sum of sensitivity and specificity, which makes the cut at 20% of this population. We have also shown the implications of varying the high risk criterion. What do we conclude about the suitability of a population strategy of universal measures (Rose’s population strategy) rather than one focussed on the ’high-risk’ individuals in a programme of delinquency reduction? We have found that the risk of criminal behaviour displays a continuum in the population. A large number of people have a small risk and give rise to more cases of criminal behaviour than a small number of people with a high risk. Geoffrey Rose found that though it is possible to focus preventive efforts on very high-risk groups these are a relatively small proportion of the population and cases (Rose, 1992). This has led to the impetus to identify the factors that may influence the population distribution of risk factors. Measures that decrease the average level of criminal behaviour will decrease the prevalence of excessive criminal behaviour according to the ‘mass population strategy’. Some primary crime prevention interventions could be recommended on a universal level, at a very early age, before, the prediction of crime is possible. Studies have shown significant crime reducing effect of family training; and home visiting nurses (Barth, Hacking & Ash, 1988; Gray, Cutler, Dean & Kempe,

Mogens Christoffersen, Heather Joshi Can Rose’s paradox be useful in delinquency prevention?
410
1979; Olds, Henderson, Chamberlin & Tatelbaum, 1986; Olds et al. 1998; Olds, Henderson, Tatalbaum & Chamberlin, 1988). Home visiting and pre-schools are provided on a universal basis in Denmark. High Scope and similar pre-school interventions, though they tend to be targeted at vulnerable groups in USA, have been associated with a significant reduction of youth delinquency among low-income families (Berrueta-Clement, Schweinhart, Barnett, Epstein, & Weikart, 1984; Schweinhart, Montie, Xiang, Barnett, Belfield, & Nores, 2005 ; Schweinhart, Barnes, & Weikart, 1993 ). Likewise, some universal school programs such as peer tutoring or mentoring (Hahn, 1999; Welsh, 2007), school non-bullying programs (Olweus, 1994; Olweus, 1995; Olweus, 2005) and cohesive school programs (Gottfredson, Wilson, & Najaka, 2002) seem to be appropriate as universal programs (Farrington, 2013). A crucial question is the huge amount of delinquency prevention measures which have no supporting evidence. The definition of a well-established treatment or intervention is that it has been compared in two or more design manualized experiments and shown to have to have significant effects over another treatment or placebo (Chambless & Ollendick, 2001). Well-established experiments should give information about costs and outcomes of treatment side effects as well as intended effects. Without this, policy makers are unaware of the possible damage and costs of the chosen intervention measures. To consider the relative merits of population based vs high risk strategies when there are unintended side effects, consider two illustrative scenarios, not necessarily exhaustive: • I. Criminal behaviour has devastating
consequences for the individual and for society at large, and the preventive measures have no adverse side effects for the individual.
• II. Criminal behaviour has minor consequences for the individual and society and the side effects of the preventive measures have high costs for the treated persons and society.
In scenario I we would tolerate a large number of false predictions of criminality (false-positives) as side effects are minimal, though one would have to consider the cost of targeting people who did not
‘need’ the intervention – known as deadweight loss. In scenario II we would be less inclined to accept a high false-positive rate. It would be unethical to force or convince people to participate if the side-effects are devastating and many of those treated would not be actual criminals. In scenario II the population strategy looks less attractive In our example, a strategy of targeting the riskiest 5% could only include about a quarter (27%) of those later observed to be criminals; we end up with a relatively high false positive rate using the administrative data to predict future criminal behaviour. The focus should be upon evidence-supported preventive measures which have little or no adverse side-effects and also measures regarded as positive by the participants. This study has a least two important limitations. All the risk factors are correlated with the outcome, and precede it, but the study insufficiently demonstrates a causal link to the outcome and the longitudinal study needs to be combined with experimental prevention programs to test effects of interventions (Murray & Farrington, 2010). Consequently, influencing these risk factors is an uncertain crime prevention strategy. We have also not explored any variation on the functional form of the statistical model to explore the possibility of further interactions between risk factors (Wikström, 2006) beyond those we have tested for gender. We note that the logistic model is inherently multiplicative and it is often not possible to find well-determined estimates of interactions. The model needs to be applied to other administrative data-material, where the distribution of risk may be either more concentrated or more dispersed than in the data used here. It also needs to be supplemented by non-administrative information such as personal interviews which include questions about self-reported criminal behaviour. International comparisons may also add to our knowledge on crime prevention strategies, though few countries outside Scandinavia have such rich linked register data. Thirdly, the present study used administrative data to predict future criminal behaviour and the results revealed some limitations in this method, but also possible guidelines for choosing between crime prevention methods and measures. In accordance with the Rose paradox we illustrate the difficulty of
Mogens Christoffersen, Heather Joshi Can Rose’s paradox be useful in delinquency prevention?
411
using the high-risk approach when predicting a low base-rate event. We found the riskiest 9% of the population accounted for nearly half (44%) of the people with a police record, but this leaves 56% of the criminals outside the high risk group. If there were a population-wide measure or set of measures preventing crime in the same way as seat-belts protect people from injury in car accidents, the wide base from which these young people were drawn into crime would indicate it should be deployed in a Rose-style ‘population’ strategy. The results suggest that supporting young people gaining qualifications in or after school could be part of such a strategy. However the paradox does not mean that particular identifiable groups- such as the children of convicted or mentally ill parents, or those with mental health problems themselves- should be ignored, just that there are not enough of them upon whom to rest prevention efforts. In most of the very high risk situations males are at greater risk than females, and gender-specific interventions may be appropriate if feasible.
It is recommended that early delinquency prevention measures only include (a) measures with convincing demonstration of causal and preventive effects; (b) measures regarded as positive by the participants; and (c) should have a dual focus, targeted and universal. The ‘high risk’ group might be the relatively high risk group in the population from which the majority of those involved in criminal behavior originate (here, say 20%), or a higher risk and smaller minority who only account for a minority of the crime. Universal measures would in any case reach these individuals and for some of the effective early interventions, they could not be identified in advance with certainty. The results support both a selective strategy on a high risk group and a population strategy of measures lowering the low or moderate risk in the majority of the population. Future research needs to find the causal links between risk factors, criminal activities and cost-effective population intervention measures in order to lower risk across the board.
Acknowledgements Brian Francis, Keith Soothill, Bo Vinnerljung, Gorm Gabrielsen and Gerda Engholm are thanked for their comment and advice to a previous version of the paper. The anonymous reviewers and the editor are thanked for their helpful comments. References Allison, P. D. (1982). Discrete-time methods for the analysis of event histories. In S.Leinhardt (Ed.), Sociological
Methodology (61-98). San Francisco: Jossey-Bass. http://dx.doi.org/10.2307/270718 Barth, R. P., Hacking, S., & Ash, J. R. (1988). Preventing child abuse: An experimental evaluation of the child
parent enrichment project. The Journal of Primary Prevention, 8, 201-217. http://dx.doi.org/10.1007/BF01695023
Becker, G. S. (1968). Crime and Punishment: An Economic Approach. The Journal of Political Economy, 76, 169-217. http://dx.doi.org/10.1086/259394
Berrueta-Clement, J. R., Schweinhart, L. J., Barnett, W. S., Epstein, A. S., & Weikart, D. P. (1984). Changed lives: the effects of the Perry Preschool program on youths through age 19. Ypsilanti, Mich: High/Scope Press, cop.
Boligministeriet (1993). Første rapport fra Byudvalget. København: Indenrigsministeriet. Chambless, D. L. & Ollendick, T. H. (2001). Empirically supported psychological interventions: Controversies and
evidence. Annual Review of Psychology, 52, 685-716. http://dx.doi.org/10.1146/annurev.psych.52.1.685 Christoffersen, M. N., Soothill, K., & Francis, B. (2003). An upbringing to violence? Identifying the likelihood of
violent crime among the 1966 birth cohort in Denmark. Journal of Forensic Psychiatry and Psychology, 14, 367-381. http://dx.doi.org/10.1080/1478994031000117830

Mogens Christoffersen, Heather Joshi Can Rose’s paradox be useful in delinquency prevention?
412
Christoffersen, M. N., Soothill, K., & Francis, B. (2005). Who Is Most at Risk of Becoming a Convicted Rapist? The Likelihood of a Rape Conviction among the 1966 Birth Cohort in Denmark. Journal of Scandinavian Studies in Criminology & Crime Prevention, 6, 39. http://dx.doi.org/10.1080/14043850410000839
Christoffersen, M. N., Soothill, K., & Francis, B. (2007). Violent Life Events and Social Disadvantage: A Systematic Study of the Social Background of Various Kinds of Lethal Violence, Other Violent Crime, Suicide, and Suicide Attempts. Journal of Scandinavian Studies in Criminology & Crime Prevention, 8, 157-184. http://dx.doi.org/10.1080/14043850701498469
Christoffersen, M. N., Skov Olsen, P., Vammen, K. S., Sander Nielsen, S., Lausten, M., & Brauner, J. (2011). Tidlig identifikation af kriminalitetstruede børn og unge: risiko- og beskyttelsesfaktorer. København: SFI - Det Nationale Forskningscenter for Velfærd.
Clarke, R. V. G. (1980). "Situational" Crime Prevention: Theory and Practice. British Journal of Criminology, 20, 136-147.
Clarke, R. V. G. (1997). Situational crime prevention. (Second Edition ed.) Criminal Justice Press. Cornish, D. B. & Clarke, R. V. (2003). Opportunities, precipitators and criminal decisions: A reply to Wortley's
critique of situational crime prevention. Crime prevention studies, 16, 41-96. Farrington, D. P. (1994). Early developmental prevention of juvenile delinquency. Criminal Behaviour and Mental
Health, 4, 209-227. Farrington, D. P. (2013). Longitudinal and experimental research in criminology. Crime and Justice, 42, 453-
527. http://dx.doi.org/10.1086/670396 Farrington, D. P., Jolliffe, D., Loeber, R., Stouthamer-Loeber, M., & Kalb, L. M. (2001). The concentration of
offenders in families, and family criminality in the prediction of boys' delinquency. Journal of Adolescence, 24, 579-596. http://dx.doi.org/10.1006/jado.2001.0424
Farrington, D. P., Ohlin, L. E., & Wilson, J. Q. (1986). Understanding and controlling crime toward a new research strategy. New York: Springer-Verlag. http://dx.doi.org/10.1007/978-1-4612-4940-5
Farrington, D. P. & Welsh, B. (2007). Saving children from a life of crime: early risk factors and effective interventions. New York: Oxford University Press.
Glueck, E. T. (1962). Toward improving the identification of delinquents. Journal of Criminal Law, Criminology & Police Science, 53, 164-170. http://dx.doi.org/10.2307/1141070
Glueck, E. T. (1963). Toward further improving the identification of delinquents. Journal of Criminal Law, Criminology & Police Science, 54, 178-180. http://dx.doi.org/10.2307/1141159
Glueck, S. (1950). Unravelling juvenile delinquency. London: Harvard Univ. Press. Gottfredson, D.C., Wilson, D.B., & Najaka, S.S. (2002). School-based crime prevention. In Sherman, L.W.,
Farrington, D.P., Welsh, B.C. & MacKenzie, D. (Eds.): Evidence-based crime prevention. London: Routledge, s. 56-164. http://dx.doi.org/10.4324/9780203166697_chapter_4
Graversen, B. K., Hummelgaard, H., Lemmich, D., & Nielsen, J. B. (1997). Residential mobility in Danish problem housing estates. Copenhagen: AKF Amternes og Kommunernes Forskningsinstitut.
Gray, J. D., Cutler, C. A., Dean, J. G., & Kempe, C. H. (1979). Prediction and Prevention of Child Abuse and Neglect. Journal of Social Issues, 35, 127-139. http://dx.doi.org/10.1111/j.1540-4560.1979.tb00805.x
Hahn, A. (1999). Extending the time of learning. In D.J.Besharov (Ed.), America's disconnected youth: toward a preventive strategy (pp. 233-265). Washington, D.C.: CWLA Press.
Hope, T. (2000). Perspectives on crime reduction. Aldershot, Hants: Ashgate. Hummelgaard, H., Graversen, B. K., Lemmich, D., & Nielsen, J. B. (1997). Udsatte boligområder i Danmark.
København: AKF Amternes og Kommunernes Forskningsinstitut. Justitsministeriet (2009). Indsatsen mod ungdomskriminalitet. Betænkning nr. 1508. København:
Justitsministeriet. Kyvsgaard, B. (2002). The criminal career: The Danish longitudinal study. Cambridge University
Press. http://dx.doi.org/10.1017/cbo9780511499463
Mogens Christoffersen, Heather Joshi Can Rose’s paradox be useful in delinquency prevention?
413
Leschied, A., Chiodo, D., Nowicki, E., & Rodger, S. (2008). Childhood Predictors of Adult Criminality: A Meta-Analysis Drawn from the Prospective Longitudinal Literature. Canadian Journal of Criminology and Criminal Justice, 50, 435-467. http://dx.doi.org/10.3138/cjccj.50.4.435
Liberman, A. (2008). The long view of crime: a synthesis of longitudinal research. New York: Springer. http://dx.doi.org/10.1007/978-0-387-71165-2
Loeber, R. & Dishion, T. (1983). Early predictors of male delinquency: a review. Psychological Bulletin, 94, 68-99. http://dx.doi.org/10.1037/0033-2909.94.1.68
Loeber, R. & Blanc, M. L. (1990). Toward a Developmental Criminology. Crime and Justice, 12, 375-473. http://dx.doi.org/10.1086/449169
Loeber, R., Dishion, T. J., & Patterson, G. R. (1984). Multiple Gating: A Multistage Assessment Procedure for Identifying Youths at Risk for Delinquency. Journal of Research in Crime and Delinquency, 21, 7-32. http://dx.doi.org/10.1177/0022427884021001002
Manuel, C. & Klint Jørgensen, A. M. (2013). Systematic review of youth crime prevention interventions: Published 2008-2012. SFI - Det Nationale Forskningscenter for Velfærd.
Moffitt, T. E. (1993). Adolescence-limited and life-course-persistent antisocial behavior: a developmental taxonomy. Psychological review, 100, 674-701. http://dx.doi.org/10.1037/0033-295X.100.4.674
Murray, J., Farrington, D. P., & Eisner, M. P. (2009). Drawing conclusions about causes from systematic reviews of risk factors: The Cambridge Quality Checklists. Journal of Experimental Criminology, 5, 1-23.
Murray, J. & Farrington, D. P. (2010). Risk factors for conduct disorder and delinquency: Key findings from longitudinal studies. The Canadian Journal of Psychiatry, 55, 633-642.
Olds, D. L., Henderson, C. R., Chamberlin, R., & Tatelbaum, R. (1986). Preventing Child Abuse and Neglect: A Randomized Trial of Nurse Home Visitation. Pediatrics, 78, 65-78.
Olds, D., Henderson, C. R., Cole, R., Eckenrode, J., Kitzman, H., Luckey, D., Pettitt, L., Sidora, K., Morris, P., & Powers, J. (1998). Long-term Effects of Nurse Home Visitation on Children's Criminal and Antisocial Behavior. JAMA: The Journal of the American Medical Association, 280, 1238-1244. http://dx.doi.org/10.1001/jama.280.14.1238
Olds, D. L., Henderson, J., Tatelbaum, R., & Chamberlin, R. (1988). Improving the Life-Course Development of Socially Disadvantaged Mothers: A Randomized Trial of Nurse Home Visitation. American Journal of Public Health, 78, 1436-1445. http://dx.doi.org/10.2105/AJPH.78.11.1436
Olver, M. E., Stockdale, K. C., & Wormith, J. S. (2009). Risk Assessment With Young Offenders. Criminal Justice and Behavior, 36, 329-353. http://dx.doi.org/10.1177/0093854809331457
Olweus, D. (1994). Bullying at School: Basic Facts and Effects of a School Based Intervention Program. Journal of Child Psychology & Psychiatry & Allied Disciplines, 35, 1171-1190. http://dx.doi.org/10.1111/j.1469-7610.1994.tb01229.x
Olweus, D. (1995). Bullying at school: What we know and what we can do. (Reprinted ed.) Oxford: Blackwell. Olweus, D. (2005). A useful evaluation design, and effects of the Olweus Bullying Prevention Program.
Psychology, Crime and Law, 11, 389-402. http://dx.doi.org/10.1080/10683160500255471 Pease, K. (1997). Crime Prevention. In M.Maguire, R. Morgan, & R. Reiner (Eds.), The Oxford Handbook of
Criminology (second edition ed., pp. 963-995). Oxford: Oxford University Press. Pfiffner, L. J., R.A.Barkley, & G.J.DuPaul (2006). Treatment of ADHD in School Settings. In R.A.Barkley (Ed.),
Attention-deficit hyperactivity disorder: a handbook for diagnosis and treatment (3. ed. ed., pp. 547-589). New York: Guilford Press.
Piquero, A. R., Farrington, D. P., & Blumstein, A. (2007). Key issues in criminal career research: New analyses of the Cambridge Study in Delinquent Development. Cambridge University Press. http://dx.doi.org/10.1017/cbo9780511499494

Mogens Christoffersen, Heather Joshi Can Rose’s paradox be useful in delinquency prevention?
414
Romelsjö, A. & Danielsson, A.-K. (2012). Does the prevention paradox apply to various alcohol habits and problems among Swedish adolescents? The European Journal of Public Health, 22, 899-903. http://dx.doi.org/10.1093/eurpub/ckr178
Rose, G. (1981). Strategy of prevention: lessons from cardiovascular disease. British medical journal (Clinical research ed.), 282, 1847-1851. http://dx.doi.org/10.1136/bmj.282.6279.1847
Rose, G. (1992). The strategy of preventive medicine. Oxford: Oxford Medical publications. Rose, G., Khaw, K. T., & Marmot, M. (2008). Rose's strategy of preventive medicine. Oxford University Press,
USA. http://dx.doi.org/10.1093/acprof:oso/9780192630971.001.0001 Rossow, I. & Romelsjö, A. (2006). The extent of the 'prevention paradox' in alcohol problems as a function of
population drinking patterns. Addiction, 101, 84-90. http://dx.doi.org/10.1111/j.1360-0443.2005.01294.x
Sampson, R. J. & Laub, J. H. (1992). Crime and Deviance in the Life Course. Annual Review of Sociology, 18, 63-84. http://dx.doi.org/10.1146/annurev.so.18.080192.000431
Sampson, R. J., Morenoff, J. D., & Raudenbush, S. (2005). Social anatomy of racial and ethnic disparities in violence. American Journal of Public Health, 95, 224-232. http://dx.doi.org/10.2105/AJPH.2004.037705
Schweinhart, L. J., Barnes, H. V., & Weikart, D. P. (1993). Significant benefits: the High-Scope Perry preschool study through age 27. Ypsilanti, MI: High/Scope Press.
Schweinhart, L. J., Montie, J., Xiang, Z., Barnett, W. S., Belfield, C. R., & Nores, M. (2005). Lifetime effects: the High/Scope Perry preschool study through age 40. Ypsilanti, Mich.: High/Scope Press.
Sherman, L. W. (1997a). Communities and crime prevention. In Sherman, L.W., Gottfredson, D. C., MacKenzie, D., Eck, J. E., Reuter, P. & Bushway, S. (Eds.), Preventing crime: what works, what doesn't, what's promising. University of Maryland at College Park: Department of Criminology and Criminal Justice University of Maryland.
Sherman, L. W. (1997b). Preventing crime what works, what doesn't, what's promising: a report to the United States Congress. Washington, DC: U.S. Dept. of Justice, Office of Justice Programs.
Sherman, L. W., Farrington, D. P., Welsh, B. C., & MacKenzie, D. L. (2006). Evidence-based crime prevention. (Rev. ed. ed.) London: Routledge.
Soothill, K., Christoffersen, M. N., Hussain, M. A., & Francis, B. (2010). Exploring Paradigms of Crime Reduction: An Empirical Longitudinal Study. British Journal of Criminology, 50, 222-238. http://dx.doi.org/10.1093/bjc/azp076
Welsh, B. C. (2007). Evidence-based crime prevention scientific basis, trends, results and implications for Canada. Ottawa: National Crime Prevention Centre.
Welsh, B. C. & Hoshi, A. (2006). Communities and crime prevention. In Sherman, L.W. & Farrington, D. P. (Eds.), Evidence-based crime prevention (Rev. ed, pp. 165-197). London: Routledge. http://dx.doi.org/10.1007/1-4020-4244-2
Wikström, P-O. H. (2006). Individuals, settings, and acts of crime: Situational mechanisms and the explanation of crime. In The explanation of crime: Context, mechanisms and development. Cambridge University Press, Cambridge. http://dx.doi.org/10.1017/CBO9780511489341.004
Wikström, P-O. H. (1998). Communities and crime. In Tonry, M. (Ed.). The Handbook of Crime and Punishment. New York: OUP.
Williams, J. & Sickles, R. C. (2002). An analysis of the crime as work model: Evidence from the 1958 Philadelphia birth cohort study. Journal of Human Resources, XXXXVII, 479-509. http://dx.doi.org/10.2307/3069679
Woodward, M. (1999). Epidemiology: Study design and data analysis. Boca Raton, FL: Chapman & Hall/CRC.
Mogens Christoffersen, Heather Joshi Can Rose’s paradox be useful in delinquency prevention?
415
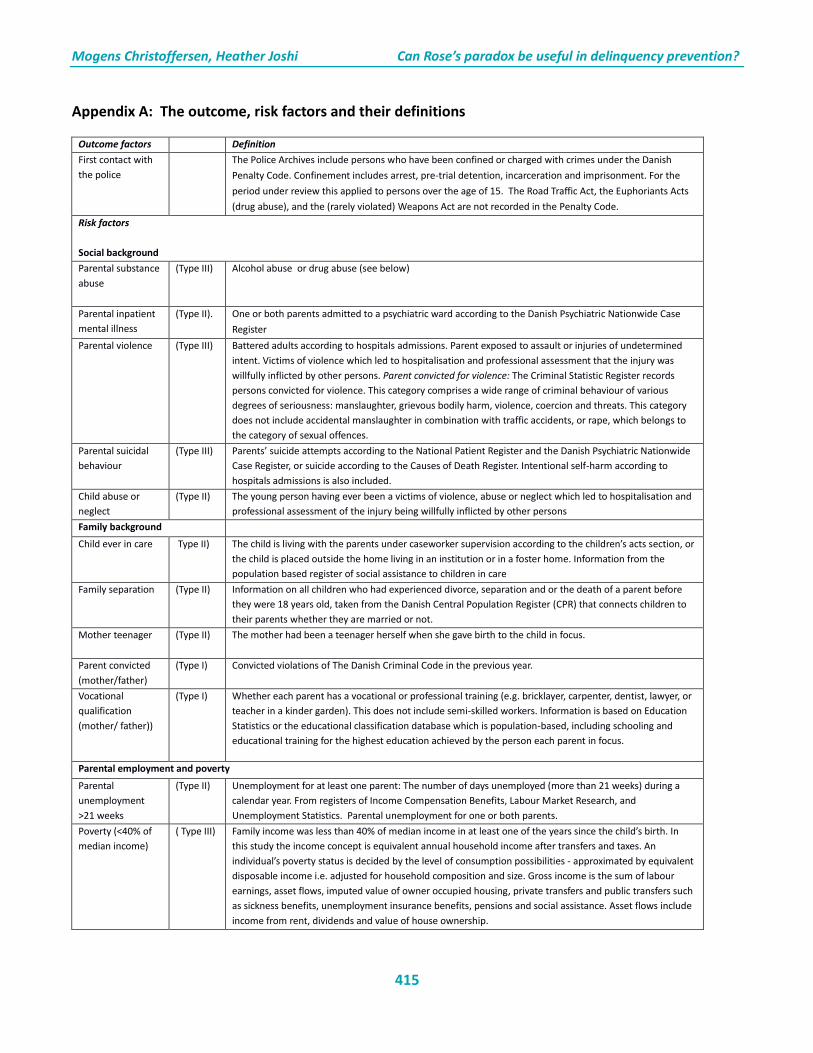
Appendix A: The outcome, risk factors and their definitions
Outcome factors Definition First contact with the police
The Police Archives include persons who have been confined or charged with crimes under the Danish Penalty Code. Confinement includes arrest, pre-trial detention, incarceration and imprisonment. For the period under review this applied to persons over the age of 15. The Road Traffic Act, the Euphoriants Acts (drug abuse), and the (rarely violated) Weapons Act are not recorded in the Penalty Code.
Risk factors Social background Parental substance abuse
(Type III)
Alcohol abuse or drug abuse (see below)
Parental inpatient mental illness
(Type II). One or both parents admitted to a psychiatric ward according to the Danish Psychiatric Nationwide Case Register
Parental violence (Type III) Battered adults according to hospitals admissions. Parent exposed to assault or injuries of undetermined intent. Victims of violence which led to hospitalisation and professional assessment that the injury was willfully inflicted by other persons. Parent convicted for violence: The Criminal Statistic Register records persons convicted for violence. This category comprises a wide range of criminal behaviour of various degrees of seriousness: manslaughter, grievous bodily harm, violence, coercion and threats. This category does not include accidental manslaughter in combination with traffic accidents, or rape, which belongs to the category of sexual offences.
Parental suicidal behaviour
(Type III) Parents’ suicide attempts according to the National Patient Register and the Danish Psychiatric Nationwide Case Register, or suicide according to the Causes of Death Register. Intentional self-harm according to hospitals admissions is also included.
Child abuse or neglect
(Type II) The young person having ever been a victims of violence, abuse or neglect which led to hospitalisation and professional assessment of the injury being willfully inflicted by other persons
Family background
Child ever in care Type II) The child is living with the parents under caseworker supervision according to the children’s acts section, or the child is placed outside the home living in an institution or in a foster home. Information from the population based register of social assistance to children in care
Family separation (Type II) Information on all children who had experienced divorce, separation and or the death of a parent before they were 18 years old, taken from the Danish Central Population Register (CPR) that connects children to their parents whether they are married or not.
Mother teenager (Type II)
The mother had been a teenager herself when she gave birth to the child in focus.
Parent convicted (mother/father)
(Type I) Convicted violations of The Danish Criminal Code in the previous year.
Vocational qualification (mother/ father))
(Type I)
Whether each parent has a vocational or professional training (e.g. bricklayer, carpenter, dentist, lawyer, or teacher in a kinder garden). This does not include semi-skilled workers. Information is based on Education Statistics or the educational classification database which is population-based, including schooling and educational training for the highest education achieved by the person each parent in focus.
Parental employment and poverty
Parental unemployment >21 weeks
(Type II) Unemployment for at least one parent: The number of days unemployed (more than 21 weeks) during a calendar year. From registers of Income Compensation Benefits, Labour Market Research, and Unemployment Statistics. Parental unemployment for one or both parents.
Poverty (<40% of median income)
( Type III) Family income was less than 40% of median income in at least one of the years since the child’s birth. In this study the income concept is equivalent annual household income after transfers and taxes. An individual’s poverty status is decided by the level of consumption possibilities - approximated by equivalent disposable income i.e. adjusted for household composition and size. Gross income is the sum of labour earnings, asset flows, imputed value of owner occupied housing, private transfers and public transfers such as sickness benefits, unemployment insurance benefits, pensions and social assistance. Asset flows include income from rent, dividends and value of house ownership.
Mogens Christoffersen, Heather Joshi Can Rose’s paradox be useful in delinquency prevention?
416
Individual resources
Disadvantaged Area
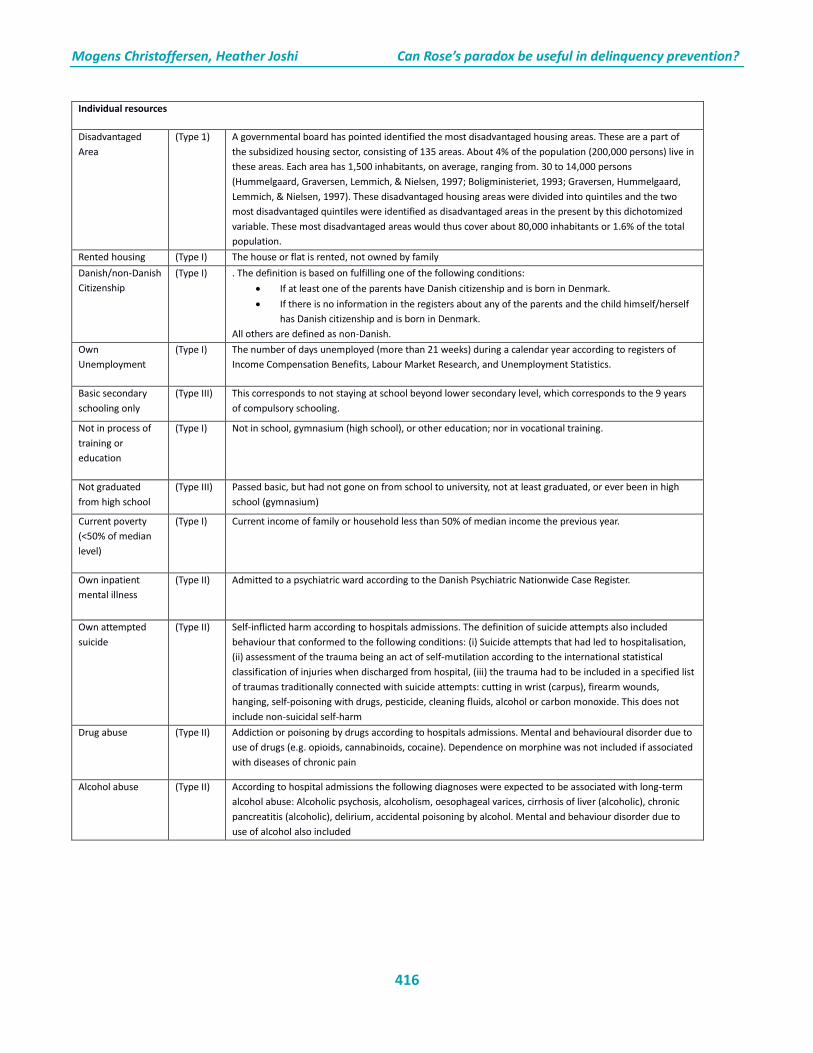
(Type 1) A governmental board has pointed identified the most disadvantaged housing areas. These are a part of the subsidized housing sector, consisting of 135 areas. About 4% of the population (200,000 persons) live in these areas. Each area has 1,500 inhabitants, on average, ranging from. 30 to 14,000 persons (Hummelgaard, Graversen, Lemmich, & Nielsen, 1997; Boligministeriet, 1993; Graversen, Hummelgaard, Lemmich, & Nielsen, 1997). These disadvantaged housing areas were divided into quintiles and the two most disadvantaged quintiles were identified as disadvantaged areas in the present by this dichotomized variable. These most disadvantaged areas would thus cover about 80,000 inhabitants or 1.6% of the total population.
Rented housing (Type I) The house or flat is rented, not owned by family Danish/non-Danish Citizenship
(Type I) . The definition is based on fulfilling one of the following conditions: • If at least one of the parents have Danish citizenship and is born in Denmark. • If there is no information in the registers about any of the parents and the child himself/herself
has Danish citizenship and is born in Denmark. All others are defined as non-Danish.
Own Unemployment
(Type I) The number of days unemployed (more than 21 weeks) during a calendar year according to registers of Income Compensation Benefits, Labour Market Research, and Unemployment Statistics.
Basic secondary schooling only
(Type III)
This corresponds to not staying at school beyond lower secondary level, which corresponds to the 9 years of compulsory schooling.
Not in process of training or education
(Type I)
Not in school, gymnasium (high school), or other education; nor in vocational training.
Not graduated from high school
(Type III)
Passed basic, but had not gone on from school to university, not at least graduated, or ever been in high school (gymnasium)
Current poverty (<50% of median level)
(Type I) Current income of family or household less than 50% of median income the previous year.
Own inpatient mental illness
(Type II) Admitted to a psychiatric ward according to the Danish Psychiatric Nationwide Case Register.
Own attempted suicide
(Type II)
Self-inflicted harm according to hospitals admissions. The definition of suicide attempts also included behaviour that conformed to the following conditions: (i) Suicide attempts that had led to hospitalisation, (ii) assessment of the trauma being an act of self-mutilation according to the international statistical classification of injuries when discharged from hospital, (iii) the trauma had to be included in a specified list of traumas traditionally connected with suicide attempts: cutting in wrist (carpus), firearm wounds, hanging, self-poisoning with drugs, pesticide, cleaning fluids, alcohol or carbon monoxide. This does not include non-suicidal self-harm
Drug abuse
(Type II) Addiction or poisoning by drugs according to hospitals admissions. Mental and behavioural disorder due to use of drugs (e.g. opioids, cannabinoids, cocaine). Dependence on morphine was not included if associated with diseases of chronic pain
Alcohol abuse
(Type II) According to hospital admissions the following diagnoses were expected to be associated with long-term alcohol abuse: Alcoholic psychosis, alcoholism, oesophageal varices, cirrhosis of liver (alcoholic), chronic pancreatitis (alcoholic), delirium, accidental poisoning by alcohol. Mental and behaviour disorder due to use of alcohol also included
Mogens Christoffersen, Heather Joshi Can Rose’s paradox be useful in delinquency prevention?
417
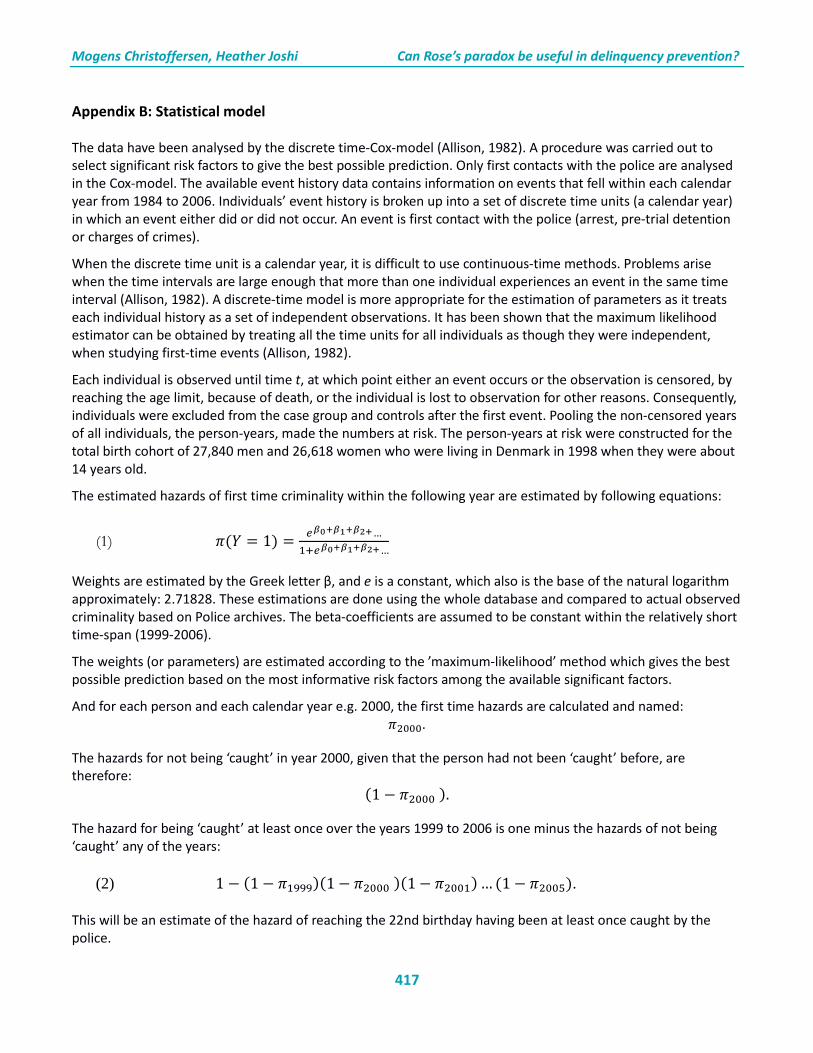
Appendix B: Statistical model The data have been analysed by the discrete time-Cox-model (Allison, 1982). A procedure was carried out to select significant risk factors to give the best possible prediction. Only first contacts with the police are analysed in the Cox-model. The available event history data contains information on events that fell within each calendar year from 1984 to 2006. Individuals’ event history is broken up into a set of discrete time units (a calendar year) in which an event either did or did not occur. An event is first contact with the police (arrest, pre-trial detention or charges of crimes). When the discrete time unit is a calendar year, it is difficult to use continuous-time methods. Problems arise when the time intervals are large enough that more than one individual experiences an event in the same time interval (Allison, 1982). A discrete-time model is more appropriate for the estimation of parameters as it treats each individual history as a set of independent observations. It has been shown that the maximum likelihood estimator can be obtained by treating all the time units for all individuals as though they were independent, when studying first-time events (Allison, 1982). Each individual is observed until time t, at which point either an event occurs or the observation is censored, by reaching the age limit, because of death, or the individual is lost to observation for other reasons. Consequently, individuals were excluded from the case group and controls after the first event. Pooling the non-censored years of all individuals, the person-years, made the numbers at risk. The person-years at risk were constructed for the total birth cohort of 27,840 men and 26,618 women who were living in Denmark in 1998 when they were about 14 years old. The estimated hazards of first time criminality within the following year are estimated by following equations:
(1) 𝜋𝜋(𝑌𝑌 = 1) = 𝑒𝑒𝛽𝛽0+𝛽𝛽1+𝛽𝛽2+…1+𝑒𝑒𝛽𝛽0+𝛽𝛽1+𝛽𝛽2+…
Weights are estimated by the Greek letter β, and e is a constant, which also is the base of the natural logarithm approximately: 2.71828. These estimations are done using the whole database and compared to actual observed criminality based on Police archives. The beta-coefficients are assumed to be constant within the relatively short time-span (1999-2006). The weights (or parameters) are estimated according to the ’maximum-likelihood’ method which gives the best possible prediction based on the most informative risk factors among the available significant factors. And for each person and each calendar year e.g. 2000, the first time hazards are calculated and named:
𝜋𝜋2000.
The hazards for not being ‘caught’ in year 2000, given that the person had not been ‘caught’ before, are therefore:
(1 − 𝜋𝜋2000 ).
The hazard for being ‘caught’ at least once over the years 1999 to 2006 is one minus the hazards of not being ‘caught’ any of the years:
(2) 1 − (1 − 𝜋𝜋1999)(1− 𝜋𝜋2000 )(1− 𝜋𝜋2001) … (1 − 𝜋𝜋2005). This will be an estimate of the hazard of reaching the 22nd birthday having been at least once caught by the police.

Mogens Christoffersen, Heather Joshi Can Rose’s paradox be useful in delinquency prevention?
418
Appendix C: Estimates of Discrete Cox Model 2 (table 2) of first-time crime events when interactions with gender included
Odds ratio 95% Wald Confidence Limits
20 year 0.41 0.37 0.46 19 year 0.57 0.51 0.63 18 year 0.80 0.74 0.88 17 year 0.82 0.76 0.89 16 year 0.85 0.78 0.91 Parental background: Parental inpatient mental illness 1.27 1.11 1.46 Parental violence 1.32 1.14 1.53 Non-Danish 1.59 1.35 1.88 Mother has no vocational qualification
1.15 0.99 1.34
Parental unemployment >21 weeks 1.29 1.11 1.49 Child abuse and neglect 1.79 1.47 2.19 Family separation 1.72 1.52 1.96 Mother teenager 1.31 1.08 1.58 Mother convicted 2.56 1.72 3.80 Father convicted 1.59 1.14 2.22 Location: Rented housing (not self-owner) 1.26 1.11 1.43 Disadvantaged area 1.25 0.98 1.60 Individual resources Not in process of training or education
1.41 1.22 1.62
Not graduated high school 1.77 1.51 2.07 Current Poverty (< 50 % of median) 1.23 1.05 1.45 Own unemployment >21 weeks 1.49 1.09 2.03 Focus child in care 1.49 1.28 1.74 Substance abuse (alcohol. drugs) 2.24 1.75 2.88 Own attempted suicide 1.93 1.45 2.55 Gender (1=boy; 0=girl) 4.01 3.15 5.10 Interaction term: Male*( Parental mental illness) 0.83 0.71 0.97 Male*(did not pass basic secondary level)
1.66 1.23 2.25
Male*( Mother convicted) 0.56 0.33 0.93 Male*( Attempted suicide) 0.67 0.45 1.00 Note: All interaction terms were included in the model, but only significant interaction terms shown in the table.
Mogens Christoffersen, Heather Joshi Can Rose’s paradox be useful in delinquency prevention?
419
Appendix D: Estimated odds ratios: first-, second- to fifth-time events (arrest, confinement or charged according to penalty code)
Odds ratio: First
event
Odds ratio:
second event
Odds ratio: third
event
Odds ratio:
fourth event
Odds ratio: Fifth event
Parental background: Parental substance abuse ns ns Ns ns ns Parental in-patient mental illness 1.1 ns Ns ns ns Parental violence 1.5 1.6 1.7 1.7 1.8 Non-Danish 1.6 1.7 1.9 2.1 2.3 Mother has no vocational qualification 1.2 1.2 1.2 1.2 1.3
Father has no vocational qualification 1.3 1.2 1.3 1.2 1.2
Parental suicidal behaviour Ns ns Ns ns ns Poverty (<40% of median income) Ns 1.1 Ns 1.1 ns Parental unemployment >21 weeks 1.4 1.5 1.6 1.7 1.7 Child abuse and neglect 1.9 2.0 2.1 2.1 2.2 Family separation 1.6 1.6 1.6 1.6 1.6 Mother teenager 1.3 1.3 1.3 1.3 1.2 Mother convicted 1.8 1.5 ns Ns ns Father convicted 1.3 1.4 ns Ns ns Location Rented housing (not self-owner) 1.2 1.3 1.3 1.3 1.3 Disadvantaged area 1.3 1.4 1.3 1.3 1.4 Individual resources Didn’t pass basic secondary education 1.5 1.8 2.0 2.0 2.1
Not in process of training or education 1.1 1.2 1.2 1.3 1.4
Not graduated high school 1.8 2.0 2.4 2.5 2.6 Current poverty (< 50 % of median) 1.2 1.2 1.2 1.2 1.3
Unemployment >21 weeks 1.6 1.8 1.7 1.7 1.8 Ever in care 1.4 1.5 1.8 1.9 2.1 Own attempted suicide 1.6 1.5 1.7 1.7 1.7 Substance abuse (alcohol. drugs) 2.0 1.9 1.9 2.1 2.2 Own inpatient mental illness ns ns ns Ns ns Gender (1=boy; 0=girl) 3.8 4.8 6.3 7.9 8.6 Number persons with police-contact 6,075 4,189 2,867 2,228 1,814
Number person-years 300,591 310,350 316,330 318,875 320,432
Note: Number of first-time events n=6,075. Total number of individuals in the study 54,458, while the total number of person-years is 300,591. ‘ns’ stands for Non-Significant. Age terms not shown