Can Punishment Generate Specific Deterrence without … · Can Punishment Generate Specific...
34
Can Punishment Generate Specific Deterrence without Updating? Analysis of a Stated Choice Scenario Dietrich Earnhart Department of Economics University of Kansas Email: [email protected] Lana Friesen School of Economics University of Queensland Email: [email protected] July 16, 2012 Abstract: This study explores the specific deterrence generated by punishment in the context of regulatory violations with a focus on the distinction between upward revisions to future punishment parameters – likelihood and severity – and the experience of being penalized. In order to avoid the pitfalls of empirically analyzing actual choices made by regulated entities, e.g., measuring entities’ beliefs regarding the likelihood and size of future penalties, our study examines behavior associated with a stated choice scenario presented within a survey distributed to the environmental managers of facilities regulated under the U.S. Clean Water Act. This choice of respondents strengthens the external validity of our empirical results. Based on a variety of statistical methods, our empirical results strongly and robustly reject the standard hypothesis that specific deterrence stems solely from upward revisions to punishment parameters while supporting the alternative hypothesis of experiential deterrence, whereby facilities focus on recent experiences to shape their compliance behavior. Disclaimer: This manuscript was partially developed under a STAR Research Assistance Agreement No. R-82882801-0 awarded by the U.S. Environmental Protection Agency. It has not been formally reviewed by the EPA. The views expressed in this document are solely those of the authors. The EPA does not endorse any products or commercial services mentioned in this manuscript. Acknowledgments: We thank Dylan Rassier and Trisha Shrum for their excellent research assistance. We also thank the University of Queensland for their financial support of our collaboration.
-
Upload
vuongduong -
Category
Documents
-
view
231 -
download
0
Transcript of Can Punishment Generate Specific Deterrence without … · Can Punishment Generate Specific...
Can Punishment Generate Specific Deterrence without Updating? Analysis of a Stated Choice Scenario Dietrich Earnhart Department of Economics University of Kansas
Email: [email protected]
Lana Friesen School of Economics University of Queensland
Email: [email protected]
July 16, 2012 Abstract: This study explores the specific deterrence generated by punishment in the context of regulatory violations with a focus on the distinction between upward revisions to future punishment parameters – likelihood and severity – and the experience of being penalized. In order to avoid the pitfalls of empirically analyzing actual choices made by regulated entities, e.g., measuring entities’ beliefs regarding the likelihood and size of future penalties, our study examines behavior associated with a stated choice scenario presented within a survey distributed to the environmental managers of facilities regulated under the U.S. Clean Water Act. This choice of respondents strengthens the external validity of our empirical results. Based on a variety of statistical methods, our empirical results strongly and robustly reject the standard hypothesis that specific deterrence stems solely from upward revisions to punishment parameters while supporting the alternative hypothesis of experiential deterrence, whereby facilities focus on recent experiences to shape their compliance behavior. Disclaimer: This manuscript was partially developed under a STAR Research Assistance Agreement No. R-82882801-0 awarded by the U.S. Environmental Protection Agency. It has not been formally reviewed by the EPA. The views expressed in this document are solely those of the authors. The EPA does not endorse any products or commercial services mentioned in this manuscript. Acknowledgments: We thank Dylan Rassier and Trisha Shrum for their excellent research assistance. We also thank the University of Queensland for their financial support of our collaboration.
1. Introduction
A major purpose of law enforcement is to deter potential offenders from committing a crime
or violating a regulation. Deterrence generated by punishment may be specific, deterring the same
individual or firm from committing the crime again. At the same time, punishment sends a message
to the wider community, thereby enhancing general deterrence. While empirical work finds evidence
for both types of deterrence, the mechanisms through which specific and general deterrence operate
are not well understood. This lack of understanding is particularly acute for the case for specific1
deterrence.
To improve this understanding, this paper uses a theoretical understanding of deterrence to
construct and test a concept of specific deterrence using the responses of environmental managers
to a stated choice scenario. These managers all work in U.S. chemical manufacturing facilities
whose wastewater discharges are regulated as part of the National Pollutant Discharge Elimination
System (NPDES). The concept of specific deterrence that we test is based on the standard
economics of crime model (Becker, 1968) in which deterrence stems from the anticipation of a
penalty being imposed and is based on two components of penalty imposition: likelihood and size.
According to this model, after the experience of being penalized, a regulated entity should change
its behavior because it anticipates an increase in one or both components of deterrence: (1) increased
subsequent penalty likelihood due to greater monitoring scrutiny, and/or (2) increased subsequent
penalty size (i.e., recidivist facilities receive higher subsequent penalties). From this perspective,
the experience of being penalized should not affect facility behavior absent any increase in future
monitoring scrutiny or penalty size. Put differently, specific deterrence stems exclusively from
updating in the sanction’s likelihood or its magnitude (conditional on imposition). We refer to this
Gray and Shimshack (2011) provide a recent survey on environmental enforcement.1
2
expectation as the hypothesis of initial penalty neutrality.
To test this hypothesis however using actual choices made by regulated entities is difficult.
First, accurately measuring the beliefs of penalized facilities regarding penalty likelihood and size
or constructing appropriate proxies is problematic. Second, most regulated entities never or only
infrequently receive penalties; consequently, any analysis of actual penalties would include only a
small portion of regulated entities, perhaps limiting the generalizability of any empirical results.
Finally, discerning the independent effects of the initial penalty and subsequent penalties on behavior
is difficult due to the strong correlation between the two types of penalties.
In order to avoid these concerns, our study analyzes behavior generated from a stated choice
scenario presented within a survey distributed to entities regulated under the Clean Water Act. Our
study structured the hypothetical scenario to mimic an actual situation in which regulated entities
might respond to enforcement-based deterrence. Specifically, our study constructed a scenario that
involves an initial penalty, described by its likelihood of imposition and size, and a subsequent
penalty, described in the same way. By appropriately selecting the levels of initial and subsequent
penalty size and likelihood, this study tests the hypothesis of initial penalty neutrality. Specifically,
the survey presented a scenario with no increase in the subsequent penalty likelihood or size relative
to the initial penalty after the imposition of the initial penalty. If the hypothesis of initial penalty
neutrality is true, survey respondents should indicate no willingness to increase their effort in
response to the imposition of the initial penalty because neither component of deterrence changes
after the imposition of a penalty.
While the hypothesis of initial penalty neutrality represents the standard theoretical
perspective, a recent body of work suggests an alternative hypothesis: experience itself may change
behavior even absent any change in the underlying parameters (e.g. Keller et al. 2006; Bigoni et al.,
3
2008; Haselhuhn et al., 2012), a notion that we describe as experiential deterrence. Information
received via experience appears to be processed differently by decision makers than information
received via description (Newell and Rakow, 2007; Simonsohn et al., 2008). The “availability
heuristic”, whereby people judge the frequency of an event by how easy it is to recall such an
instance, is one explanation for this effect (Tversky and Kahneman, 1974). More recent and salient
events are the most available (easiest) to recall. Punishment fits this category. For example, the
salience of regulatory compliance rises after imposition of a penalty due to an inherent focus on
recent experiences. From this perspective, the imposition of a penalty prompts better compliance
even in the absence of any upward ratcheting in the likelihood or size of any subsequent penalty.
Our empirical results strongly and robustly reject the standard hypothesis of initial penalty
neutrality, while supporting the alternative hypothesis of experiential deterrence. Our results thus
suggest that behavioral factors have an important role to play in environmental enforcement. Such
behavioral factors have been slow to influence environmental enforcement despite a strong
behavioral law and economics tradition (Jolls et al., 1998), as well as growing policy application in
other regulatory settings.2
The rest of the paper proceeds as follows. In the next section, we describe in more detail the
relevant background and literature for our study, as well as develop the hypotheses to be tested. In
Section 3, we describe our dataset, with the results presented in Section 4. We finish with a
discussion of policy implications in Section 5.
See Cabinet Office Behavioural Insights Team (2012) for examples of how the U.K. government2
is using behavioral insights to reduce various kinds of fraud.
4
2. Background and Hypotheses
2.1. Specific Deterrence
In the standard economics of crime model (Becker, 1968; Polinsky and Shavell, 2000),
crimes are committed when the expected gain from offending exceeds the expected penalty from
offending. Potential offenders possess full information about the enforcement parameters they face
including both the likelihood and severity of punishment. Any increase in these parameters
therefore increases compliance. One mechanism through which specific deterrence may operate is
via upward ratcheting of the enforcement parameters (increased monitoring and/or higher penalties)
for repeat offenders (Harrington, 1988; Polinsky and Rubinfeld, 1991; Polinksy and Shavell, 1998).
This upward ratcheting leads to greater deterrence as punished offenders face an increase in
enforcement. Thus, according to the standard model, in the absence of upward ratcheting of
enforcement (and with full information), the experience of being punished should have no impact
on deterrence. We call this expectation the initial penalty neutrality hypothesis.
Most previous empirical studies of environmental enforcement focus on specific deterrence
and investigate the effects of actual penalties on particular regulated entities. A few studies explore
specific deterrence within a broader context of deterrence but do not investigate (or even discuss)
the mechanism behind specific deterrence (Earnhart, 2004a; Earnhart, 2004b; Shimshack and Ward,
2005; Earnhart and Glicksman, 2011). The remaining empirical studies on the effects of imposed
penalties on particular regulated entities ignore the elements of both specific and general deterrence
(e.g., Eckert, 2004).
To our knowledge, only one empirical study investigates the mechanism through which
specific deterrence operates, while studying specific deterrence within a broader context of
5
deterrence. As the single exception, Scholz and Gray (1990) test a behavioral model of a firm with3
limited attention capacity that is regulated by the Occupational Safety and Health Administration
(OSHA). They find a strong specific deterrence effect, even after controlling for general deterrence,
which may relate to learning by the firm about the probability of being punished. The authors
emphasize the role of surprise in generating specific deterrence.4
This study by Scholz and Gray (1990) reinforces an important point: in practice, regulated
entities have only imperfect knowledge about the enforcement parameters they face (Polinsky and
Shavell, 2000). Instead, they form perceptions of the enforcement process based on their own5
experiences and from observing other regulated entities. Thus, an important second mechanism
through which specific deterrence may operate is learning via experience. In our study, we test this
mechanism for specific deterrence, which we call experiential deterrence, and test whether it
operates absent any upward ratcheting of enforcement.
Despite the importance of perceptions in determining compliance decisions, we are not aware
of any studies considering perceptions of regulatory enforcement regimes. Indeed few theoretical
models separately consider specific and general deterrence or even model perceptions. Other6
Several papers investigate general deterrence in environmental enforcement. Shimshack and Ward3
(2005) study enforcement spillovers generated by learning about regulator reputation and Thornton et al.(2005) investigate regulated facilities’ knowledge of enforcement cases against other facilities.
Earnhart and Friesen (2012) briefly study specific deterrence as part of a larger study of deterrence4
more generally. Their study focuses on corporate culture and individual characteristics of environmentalmanager respondents. In contrast, our paper focuses on specific deterrence, insight drawn from andcontributions to the behavioral literature, and the identification of the regulated facilities’ characteristics thatexplain experiential deterrence.
Enforcement agencies rarely, if ever, announce the probability of detection. Severity too is unclear5
because the imposition and size of penalties is at the discretion of enforcement agencies and the courts, eventhough laws prescribe maximum penalty rates. Further, in the specific environmental context we study,penalties are rare and so opportunities to form accurate perceptions based on experiences are few.
Exceptions are Sah (1991) and Lochner (2007), who model perceptions of the criminal justice6
system. Malik (1990, p. 99) uses “a firm’s subjective probability of being audited” in his environmental
6
models are normative in nature, focusing on the optimal design of sanctions when potential offenders
have imperfect information rather than on how perceptions are formed (e.g., Bebchuk and Kaplow,
1992; Kaplow, 1990).
2.2. Experiential Deterrence
This exploration prompts two key questions: How does learning unfold following the
experience of being punished? How might this learning increase deterrence? One possibility is that
the experience causes an upward revision in perceptions of the likelihood and/or severity of
punishment. The prevalence of the optimism bias (Weinstein, 1980; Garoupa, 2003) implies that
people believe they are less likely to experience bad events than are others; therefore, people tend
to underestimate the likelihood of being caught. The actual experience of being caught and punished
may cause them to revise upwards this overly optimistic assessment. Alternatively, even if the initial
perception is correct, the very act of being punished may cause an (incorrect) upward revision in
perceptions. The underlying mechanism may be similar to that mechanism driving increased
purchases of insurance following natural disasters even when the underlying risk has not changed
(Weinstein et al., 2000; Kunreuther and Pauly, 2006). In both cases, the underlying risk has not
changed, but the perception is revised upward. Similar arguments could also apply to the severity
of punishment.
Interestingly, a recent but growing body of behavioral research has demonstrated in various
contexts that learning from experience can be more salient than learning from description. Indeed,
experience itself can lead to changes in behavior even if the objective parameters are fully described.
Haselhuhn et al. (2012) find that late returns of video rentals significantly decreased for patrons who
had experienced previous fines for late returns despite no change in fine levels. Bigoni et al. (2008)
compliance model but does not formally model the evolution of these beliefs.
7
find in their experimental study of antitrust programs that collusive behavior dropped following
detection and punishment despite no change in the enforcement parameters. Keller et al. (2006) find
that perceptions of flood risk increased for those who had experienced flooding despite the inclusion
of objectively expressed flood risk information. In a different context, Simonsohn et al. (2008) find
in several game theory experiments, that different sources of information are weighted differently,
with a person’s own experience weighted more, even when objectively all sources of information
were equally informative.
The leading explanation for the impact of experience on behavior is the “availability
heuristic”, whereby people judge the frequency of an event by how easy it is to recall such an
instance (Tversky and Kahneman, 1974). More recent and salient events, such as being punished,
are the most available (easiest) to recall. Jolls et al. (1998, p. 1537) point out “that vivid and
personal information will often be more effective than statistical evidence” in changing behavior.7
2.3. Summary and Hypotheses
This discussion confirms that understanding specific deterrence is particularly challenging
because it requires disentangling the effect induced by the experience of penalty imposition from the
effect induced by the upward ratcheting of future enforcement against repeat offenders, these two
effects collectively representing specific deterrence. With this challenge in mind, our study
contributes to the described literature by investigating specific deterrence in a controlled setting
where the only change is the experience of being punished, which represents the treatment, thereby
isolating the effect of penalty imposition (i.e., holding constant the threat and severity of future
enforcement). Given this isolation, we contribute to the literature by testing both the standard
Haselhuhn et al. (2012) conjecture that experience may cause an upwards revision in the expected7
“affect” (essentially negative emotions) associated with being fined, which was initially underestimated. Asa related study, Keller et al. (2006) study the role of affect in perceptions of flooding risk.
8
hypothesis of initial penalty neutrality and the alternative hypothesis of experiential deterrence:
Hypothesis 1 (Neutrality of the Initial Penalty): The imposition of a penalty without any
upward ratcheting in the likelihood of penalty or the size of a penalty relating to
future enforcement leads to no change in compliance behavior.
Hypothesis 2 (Experiential Deterrence): The experience of receiving a penalty increases a
firm’s compliance in future periods even when the objective enforcement parameters
remain unchanged.
3. Data
In order to test these two hypotheses, we assess data drawn from a survey of regulated
facilities and publicly available sources.
3.1. Survey of Regulated Entities
Our study critically draws upon survey data. This sub-section describes the set of regulated
facilities sampled by the survey, the hypothetical scenario, and other information extracted by the
survey.
3.1.1. Survey Sample
Our survey was distributed to a sample of U.S. chemical manufacturing facilities whose
wastewater discharges were regulated by effluent limits imposed within permits issued as part of the
National Pollutant Discharge Elimination System (NPDES) in 2001. By focusing on regulated
facilities, our analysis is able to focus its assessment on compliance with the noted NPDES effluent
limits. We focus on wastewater discharges because these noted effluent limits are numerically
defined so the distinction between compliance and noncompliance is obvious and because these
numeric limits are systematically recorded and publicly available.
Unlike most previous studies of regulated facilities within the realm of environmental
9
protection, our study considers facilities of all sizes. In particular, we examine both “minor
facilities” and “major facilities” as classified by the EPA for the NPDES system. For the
classification of each regulated facility, the EPA calculates a major rating with points assigned on
the basis of toxic pollution potential, flow type, conventional pollutant load, public health impact,
and water quality impact; the EPA classifies any discharger with a point total of 80 or more as a
“major facility”.
We chose the industrial sector of chemical and allied products as the focus of our study
because it serves as an excellent vehicle for examining the efficacy of enforcement on regulated
facilities’ environmental management. First, the EPA has demonstrated a strong interest in this
sector as evidenced by its study, jointly authored with the Chemical Manufacturing Association, on
the root causes of noncompliance in this sector (EPA, 1999) and its study on the compliance history
for this sector (EPA, 1997). Consistent with this interest, two sub-sectors in the industry, industrial
organics and chemical preparations (SIC-codes 2869, 2899), were regarded by the EPA as priority
sectors during a portion of the study period. Second, this sector displays considerable variation in
environmental management and compliance behavior (Earnhart and Glicksman, 2011). Third, this
sector permits the analysis to exploit similarities and differences across sub-sectors. Fourth, this
sector is responsible for a significant portion of the nation’s industrial output and a meaningful
portion of all wastewater discharges by facilities subject to Clean Water Act regulation.8
The population of CWA-regulated facilities in the chemical manufacturing industry was
extracted from the EPA’s Permit Compliance System (PCS) database as of September, 2001. This
extract includes 2,596 chemical facilities. To remain in the survey population, facilities needed to
The chemical industry is not necessarily representative of all industrial sectors. Indeed, its unique8
attributes contribute to our interest in studying it. For example, some firms in the chemical industry havedemonstrated an interest in promoting pollution reduction and prevention through efforts prompted by theResponsible Care program, which is a voluntary initiative supported by the American Chemistry Council.
10
meet the following criteria: (1) possessed a NPDES permit; (2) faced restrictions on their
wastewater discharges, (3) were operating as of 2002, and (4) contact information was available from
either the EPA or alternative sources, e.g., phone books. Application of these criteria identified9
1,003 facilities to contact. Of those facilities contacted between April of 2002 and March of 2003,10
736 refused to participate in the survey, while 268 facilities completed at least 90 percent of the
survey, implying a 27 % response rate. This rate is comparable to previous large-scale surveys of
industrial sectors (e.g., Arimura et al., 2008).11
When administering the survey, we first contacted those individuals responsible for signing
their respective facilities’ wastewater discharge monitoring reports, which facilities are required to
submit to the EPA on a regular basis, generally monthly. This selection of survey participants allows
our survey to exploit the insight of those individuals most knowledgeable about their facilities’
wastewater operations.
3.1.2. Construction of Hypothetical Scenario
This sub-section describes the hypothetical scenario in greater detail. Respondents were told
that their facility would be discharging wastewater over a two-year period and that they would have
to choose one course of action from a set of two available options after each year of the scenario.
As an additional criterion, facilities needed to being discharging pollutants into surface water9
bodies as opposed into systems operated by municipal wastewater treatment facilities. In technical terms,the sample included only direct dischargers while excluding industrial users. We exclude the latter categoryof polluters since they are most directly regulated by municipal wastewater treatment facilities.
We administered the survey over the phone yet mailed or faxed certain components of the survey10
instrument upon request.
To assess the issue of possible sample selection bias, we compare the sample of survey11
respondents to the sample of survey recipients and estimate the decision to complete the survey. Thisanalysis uncovers a bias in a single dimension: major facilities were more likely to respond to the survey thanwere minor facilities. We must, therefore, cautiously interpret the effect of major versus minor status onscenario responses. Otherwise, our study does not correct for any potential sample selection bias consistentwith recent prominently published studies of environmental management practices (Anton et al., 2004;Arimura et al., 2008). Full details of our analysis on sample selection are available from the authors.
11
Respondents were informed that the available options would not vary between years. Finally, the
survey-givers clearly stated that the “choices should reflect how you [the respondent] believe that
your facility (underlining added for emphasis) would respond to the circumstances described” and
that “there are no right or wrong choices”.
Then the survey provided the following information that applied to both years of the scenario:
“Suppose that your facility has the option to improve the maintenance of its wastewater treatment
process. On an annual basis, this improved maintenance costs $ 10,000 net of any side benefits,
such as extending the life of the treatment technology (underlining added for emphasis). In each
scenario, the choice of whether or not to improve maintenance affects the likelihood of your facility
exceeding its permitted discharge limit, which prompts the imposition of a single monetary fine.
Assume that this imposition generates no additional costs, such as exposure to third-party liability,
adverse publicity, or disqualification as a government contractor.”
Note that the instructions take into account any side benefits associated with the improved
maintenance so that the respondents appreciate that the maintenance truly involves costs. More
important, note that the instructions constrain the costs associated with the imposition of a fine.
Consequently, respondents were not free to speculate on peripheral costs. However, the instructions
did not explicitly constrain the benefits associated with compliance even though the same identified
peripheral elements may remain relevant, e.g., compliance leads to positive publicity or qualification
as a government contractor. We have no reason to believe that this lack of symmetry meaningfully
influenced scenario responses.
Then the survey posed the scenario: “Consider the first year of a two-year period. Without
improved maintenance, the chance of exceeding the permitted discharge limit and receiving a
monetary fine equals 10 %. With improved maintenance, there is a 1 % chance of exceeding the
12
permitted discharge limit and receiving a monetary fine. Since no system is fool-proof, better
maintenance reduces but does not eliminate the risk of non-compliance. The monetary fine is a one-
time fine of $10,000. Improved maintenance costs $ 10,000 per year.”
Respondents were then asked, “Would your facility choose to improve maintenance in Year
1?”. After stating their choice, respondents were informed that they had been fined $10,000 at the
end of Year 1. This was regardless of their choice; however the wording was adjusted accordingly,
with those who chose to improve maintenance in Year 1 told that “due to uncontrollable factors”
they had violated their permit limit, while for those who chose not to improve the factors leading to
violation were described as both “controllable and uncontrollable”. Thus, regardless of the
respondent’s choice for Year 1, the survey imposed a fine of $ 10,000 at the end of Year 1. Put
differently, the survey “treated” each respondent to a dose of “penalty imposition” at the end of Year
1. To test for the effect of experiential deterrence, respondents then moved into Year 2 where they
faced exactly the same choice as in Year 1. That is, neither the likelihood of the fine, size of the fine,
nor cost of maintenance was altered from the initial scenario. Indeed the text read to subjects
emphasized this lack of change.
In sum, each respondent faces a scenario involving two years of decisions. In both years of
the scenario, each respondent faces the 10 % likelihood of a $ 10,000 fine if maintenance is not
improved and faces the 1% likelihood of a $10,000 fine if maintenance is improved. The only
difference between the two years is the imposition of a fine at the end of Year 1.
Of the 268 respondents, 245 answered the first-year scenario question. Of these, 87 % chose
to improve maintenance, while 13 % chose not to improve maintenance, as shown in Table 1.a. Of
the 268 respondents, 247 answered the second-year scenario question. Of these, 92 % chose to
improve maintenance, while 8 % chose not to improve maintenance, as also shown in Table 1.a.
13
3.1.3. Other Survey Data
In addition to these scenario responses, the survey gathered data on firm and facility
characteristics: ownership structure, number of facility employees, and year of facility construction.
For the purposes of analysis, we distinguish ownership structure in this way: publicly held
corporation versus “all other structures”. Summary statistics of these factors are in Table 2.12
These factors may influence maintenance decisions. First, ownership structure affects
corporate decisions in many ways. For example, publicly held firms are arguably more beholden to
the short-term interests of investors, which may prompt these firms to ignore the long-term
advantages of investments in environmental management. As another example, publicly held firms
may possess better access to external financing, allowing these firms to invest more in environmental
management. Second, the number of facility employees serves as a proxy for facility size, which
may capture the influence of economies or diseconomies of scale. Third, the age of the facility may
serve as a proxy for the vintage of the facility’s equipment.
3.2. Publicly Available Data on Regulated Entities
To complement the data gathered by our survey, we also collected information from the EPA
Permit Compliance System (PCS) database, which records information on facilities permitted within
the NPDES system. The PCS database provides information on each facility’s (1) location, (2)
NPDES major or minor classification, and (3) four-digit standard industrial classification [SIC]
code. The PCS database also provides data on the following government interventions: inspections13
Given this single distinction in ownership structure, we are able to supplement the survey-reported12
data on ownership structure using publicly available data, mainly from the Compustat Research Insightdatabase, so that we posses ownership structure data on all survey respondents. Details on these publiclyavailable data are available from the authors upon request.
The analysis aggregates the four-digit SIC codes into three broader sectoral categories: organic13
chemicals, inorganic chemicals, and “other” chemicals. The broad category of organic chemicals includesthe following four-digit SIC codes: 2821, 2823, 2824, 2843, 2865, 2869, 2891, and 2899. The broad category
14
performed by federal and state regulators and fines imposed by federal administrative and civil
courts.
Based on these underlying data elements, we construct the following factors that may
influence a facility’s decision to improve maintenance in the face of fines:
(1) EPA-designated status: major versus minor;
(2) industrial sector: organic chemicals versus inorganic chemicals versus “other chemicals”;
(3) state inspections conducted at a particular facility (count):
(a) in the 12-month period preceding the survey’s completion for each respondent,
(b) in the 24-month period preceding the survey’s completion for each respondent;
(4) federal inspections conducted at a particular facility (count):
(a) in the 12-month period preceding the survey’s completion for each respondent,
(b) in the 24-month period preceding the survey’s completion for each respondent.
Table 2 statistically summarizes these factors derived from publicly available data.
The analysis is forced to exclude factors relating to fines because no fines were imposed on
the surveyed facilities in the 24-month period preceding the survey’s completion. As one of this
study’s contributions identified in the introduction, we use hypothetical scenarios to assess the
influence of enforcement-based deterrence in a regulatory context where fines are infrequently
imposed.
All of the identified factors may influence maintenance decisions. First, major facilities may
benefit differently from compliance than do minor facilities. Second, industrial classification reflects
differences in products and production processes. Third, recent experience with inspections may
color facilities’ sensitivity to the threat of fines within the scenarios.
of inorganic chemicals includes the following four-digit SIC codes: 2812, 2813, 2816, 2819, 2873, and 2874.
15
4. Empirical Analysis: Test of Initial Penalty Neutrality and Experiential Deterrence
Based on the reported responses to these scenario-based questions, our study tests the
theoretical hypotheses associated with specific deterrence outlined in Section 2.3. As the primary
analysis, the study tests the hypotheses by determining whether or not a statistically significant
number of respondents decide to modify their environmental behavior in response to the treatment
of penalty imposition when objective measures of the deterrence components do not change. As the
secondary analysis, the study seeks to identify the factors driving the decision to modify
environmental behavior in response to the treatment of penalty imposition. This secondary analysis
helps to assess whether the evidence supporting or rejecting the hypotheses applies uniformly to the
sample of regulated facilities or is more prevalent in certain sub-samples based on facility
characteristics, firm characteristics, and regulatory conditions faced by facilities.
4.1. Primary Analysis
To test the standard hypothesis of initial penalty neutrality (Hypothesis 1) and the alternative
hypothesis of experiential deterrence (Hypothesis 2), the study examines the responses to Year 1 and
Year 2 of the scenario. We first employ univariate tests and then employ multivariate estimation to
check the robustness of our conclusions.
4.1.1. Univariate Statistical Analysis
Of the 268 respondents, 241 provide responses to both years of the scenario. Of these 241
respondents, 202 improve maintenance in both years, while 12 respondents improve maintenance
in neither year, as shown in Table 1.b. These two patterns are consistent with the standard
hypothesis of initial penalty neutrality. However, 20 respondents switch from “no improved
maintenance” in Year 1 to “improved maintenance” in Year 2, as shown in Table 1.b. This pattern
is inconsistent with the standard hypothesis of initial penalty neutrality but consistent with the
16
alternative hypothesis of experiential deterrence. Moreover, seven respondents interestingly switch
from “improved maintenance” in Year 1 to “no improved maintenance” in Year 2, as shown in Table
1.b. While unexpected, perhaps these respondents simply revised their original choice in the second
year, given that they are facing the same deterrence parameters. In other words, these respondents
reflected more fully on the scenario and updated their choice. Alternatively, these respondents may14
be protesting the imposition of a fine even though they had improved maintenance in the first year
(despite the scenario’s clear depiction of this possibility). Regardless of the explanation, this pattern
is inconsistent with both hypotheses.
For the purposes of our analysis, we include or exclude this last set of respondents depending
on the form of the empirical testing. For our first test, we focus on the decision to switch from “no
improved maintenance” in Year 1 to “improved maintenance” in Year 2. We code this decision as
1. If a facility does not switch, we code the decision as 0. We do not attempt to explain the decision
to switch from “improved maintenance” in Year 1 to “no improved maintenance” in Year 2. Instead,
we omit these seven respondents from this particular analysis. A t-test statistic demonstrates that
the proportion of respondents who decided to alter their decision due to the imposition of a fine after
Year 1 (8.6 %) is significantly greater than zero (Z-statistic = 4.666, p-value=0.001). Thus, this test
statistic soundly rejects the standard hypothesis of initial penalty neutrality, while supporting the
alternative hypothesis of experiential deterrence.
Our second series of tests assesses whether the distribution of responses differs between
Scenario Year 1 and Scenario Year 2. The distribution for both years is shown in Table 1.c. Based
In fact, it is not “rational” to improve maintenance given these parameters. Nevertheless, such14
behavior is consistent with the actual environmental management choices made by these facilities, whereby,90 % of the studied chemical manufacturing facilities comply with their effluent limits in a given month andthe average degree of overcompliance is approximately 60 %. Previous studies also document the strongprevalence of compliance and indeed substantial overcompliance at these regulated facilities (Earnhart, 2009;Earnhart and Glicksman, 2011).
17
on numerous tests, the analysis rejects the null hypothesis of identical distributions between Year
1 and Year 2. A sample means test yields a significantly different proportion of respondents
improving maintenance between the two years (87 % versus 92 %; p-value = 0.04). A chi-square
test for two-way tables generates a test statistic of 4.3801, which is statistically significant at levels
equal to or greater than 0.036. A likelihood-ratio chi-square test demonstrates a statistical difference
in the two distributions at significance levels of 0.0352 and greater. A Fishers’ exact test reveals a
statistical difference in the two distributions at significance levels of 0.0511 and greater. These test
results merely serve to buttress the conclusion drawn above.
Finally, since the same respondents make two choices involving Years 1 and 2 of the
scenario, we can use the conservative nonparametric Matched Pairs Sign Test to assess the
hypotheses. When employing this test, we include all respondents who responded to both scenario
years. We use a one-sided test in the direction of increased compliance stemming from improved
maintenance. As noted above, the decisions of 27 respondents changed following the imposition of
a fine, with 20 respondents shifting from no “improved maintenance” to “improved maintenance”,
while seven respondents did the opposite. These shifts collectively reflect a significant increase in
“improved maintenance” (p=0.010). This test result supports the alternative hypothesis of
experiential deterrence (Hypothesis 2), while rejecting the standard hypothesis of initial penalty
neutrality (Hypothesis 1).
4.1.2. Multivariate Statistical Analysis
To test further the hypotheses of initial penalty neutrality and experiential deterrence, we pool
the two scenario responses and employ multivariate analysis to estimate a functional relationship
between the decision whether or not to improve maintenance and the treatment of fine imposition.
This multivariate analysis controls for other factors beyond the treatment of the initial penalty. For
18
this analysis, we include all respondents who responded to both years of the scenario.
The decision to improve maintenance in each year of the scenario represents a binary choice
variable, indicating whether the facility chooses to improve maintenance in a particular year.
itSpecifically, facility i in year t decides either to improve maintenance, as denoted by y =1, or the
itfacility decides not to improve maintenance, as denoted by y =0.
To estimate this decision as a function of various explanatory factors, denoted as X, we
employ a probit model. We motivate this model as a latent variable model, where the latent index,
denoted as y*, reflects the difference between the two levels of expected utility:
y* = EU(improve) - EU(do not improve).
We model this latent index as a linear functional relationship between the dependent variable, y*,
and the set of explanatory factors:
it it ity* = á + X â + ì ,
where á represents the intercept term, â represents the array of slope coefficients related to the
itexplanatory factors, and ì represents the error term. The facility decides to improve maintenance
it it it(y =1) if y* >0; otherwise, the facility decides not to improve maintenance (y =0).
We accommodate and exploit the panel structure of our data – two responses per respondent
– by estimating the constructed linear relationship using a random effects probit model (Maddala,
it i1983). This use implies a division of the error term, ì , into two components: è , which reflects
itunobserved individual heterogeneity, and å , which represents the usual idiosyncratic error term. In
iessence, è represents a random element not known to the researcher yet specific to an individual
respondent facility that does not vary across the two scenario years (which explains the omission of
the subscript t). Use of the random effects probit estimator seems appropriate since the treatment
imposed by the hypothetical scenario is applied to all survey respondents. To assess the robustness
19
of our empirical estimates, we also estimate the functional relationship using a standard probit
model, with and without clustering of the standard errors on the individual respondent.
As the primary regressor in our panel data estimation, we incorporate a scenario year
indicator that reflects the treatment of the imposed fine. Specifically, the Scenario Year 2 indicator
equals one when the observation applies to Year 2 and equals zero otherwise. In terms of our
hypotheses, the scenario year indicator identifies the possible influence of experiential deterrence
that stems from punishment without any increase in either the likelihood or size of any subsequent
fine.
The additional explanatory variables fall into these categories: facility characteristics, firm
characteristics, and government intervention histories. Clearly, we cannot include the likelihood of
a fine, depending on whether or not maintenance is improved, or the size of a fine, regardless of
maintenance, since these parameters are constant across both scenario years and all respondents.
We consider four regressor sets. Model A1 includes only the Scenario Year 2 indicator,
representing the most parsimonious model possible. Model A2 adds facility characteristics based
on publicly available data and the single firm characteristic (ownership structure). Model A3 adds
the full array of facility characteristics along with the firm characteristic. Model A4 additionally
includes government inspection histories (i.e., count of inspections conducted at particular facilities
prior to the survey’s completion).
The probit estimation results are shown in Table 3. Regardless of the specified regressor set,
the estimation results strongly indicate that the treatment of fine imposition prompts facilities to
improve their maintenance in the second year of the scenario. This evidence supports the alternative
hypothesis of experiential deterrence (Hypothesis 2), while rejecting the standard hypothesis of initial
penalty neutrality (Hypothesis 1). For the construction of the inspection-related measures, the
20
analysis considers both the 12-month period and 24-month period preceding the survey’s completion.
Table 3 tabulates results based on the 12-month period. Results based on the 24-month period
equally support the reported conclusion. Use of a standard probit model, with or without clustering,
also generates estimation results that support the reported conclusion so our conclusion is robust to
the choice of estimator.
To gain insight into the magnitude of the experiential deterrence effect, we compute the
average marginal effect of the Scenario Year 2 indicator using the estimation results from Model A4,
which represents the largest regressor set. (Use of the other models generates similar marginal
effects.) The calculated marginal effect indicates that the imposition of a $ 10,000 fine following
Year 1 without any upward ratcheting in the likelihood or size of any subsequent fine prompts a 1.76
percentage point increase in the probability of improved maintenance.
4.1.3. Summary of Results from the Primary Analysis
In sum, the reported test results and estimation results strongly and robustly reject the
standard hypothesis that specific deterrence stems solely from a notion of anticipated enforcement
based on objective measures of the likelihood and size of any future fine. Instead, the imposition
of a fine appears to convey some other type of information to facilities; as the most likely possibility,
the experience of being fined appears to prompt upward revisions to the perceived fine likelihood
and/or fine size.
4.2. Secondary Analysis
Since the primary empirical results support the alternative hypothesis of experiential
deterrence (Hypothesis 2), we extend our analysis in order to explain facilities’ decisions to switch
the provision of improved maintenance between Scenario Year 1 and Scenario Year 2. This
secondary analysis seeks to identify the factors driving the decision to modify environmental
21
behavior in response to the treatment of fine imposition when objective measures of the deterrence
components do not change. Specifically, we analyze the possible decision to switch from “no
improved maintenance” in Year 1 before fine treatment to “improved maintenance” in Year 2 after
fine treatment. This secondary analysis helps to assess whether the evidence supporting the
alternative hypothesis differs across facilities based on their characteristics, ownership structure of
the firm owning a facility, and government intervention histories experienced by facilities.
Our secondary analysis employs multivariate analysis to estimate a functional relationship
between the facility’s maintenance decision and key explanatory factors. For this secondary analysis,
we exclude those respondents who switch from “improved maintenance” to “no improved
maintenance” between Years 1 and 2. Given this exclusion, the dependent variable equals one if the
facility switches from “no improved maintenance” to “improved maintenance” between Years 1 and
2 and equals zero otherwise (i.e., “no improved maintenance” in both years or “improved
maintenance” in both years). Given the dichotomous nature of the dependent variable, we employ
a standard probit model (Maddala, 1983).
To estimate the decision of whether or not to switch maintenance between Years 1 and 2, the
multivariate analysis uses the same regressors sets used in the primary analysis, with the exception
of the Scenario Year 2 indicator. Model B1 includes facility characteristics based on publicly
available data and the single firm characteristic (ownership structure). Model B2 includes the full
array of facility characteristics along with the firm characteristic. Model B3 adds government
inspection histories.
Results from the estimation based on each regressor set are shown in Table 4. Results from
Model B1 reveal that only ownership structure significantly affects the decision to switch. These
results indicate that evidence supporting the alternative hypothesis of experiential deterrence does
22
not differ across facilities based on either their EPA designation or their industrial classification.
Yet, the results indicate that evidence supporting the alternative hypothesis of experiential deterrnece
differs across facilities based on the ownership structure of the firm that owns the facility. In
particular, facilities owned by firms with “other ownership structures” (e.g., privately held
corporations) are more likely to switch from “no improved maintenance” to “improved
maintenance”. This result indicates that more evidence to support the alternative hypothesis lies
within facilities owned by firms with “other ownership structures”. Perhaps these types of firms
possess less complete information on enforcement parameters than do publicly held firms.
Model B2 additionally includes the facility characteristics of age and number of employees.
(By considering facility characteristics drawn from the survey, the sample drops to 223
observations.) Estimation results are shown in the second column of Table 4. They reveal that only
industrial sector significantly affects the decision to switch; the effect of ownership structure is only
marginally significant with a p-value of 0.11. (Relative to the first set of estimation results, by
controlling for additional facility characteristics, the influence of industrial sector strengthens, while
the influence of ownership structure weakens.) The first result indicates that evidence supporting
the alternative hypothesis of experiential deterrence differs across facilities based on industrial
classification. In particular, relative to “other chemical” facilities, inorganic chemical facilities are
less likely to switch. This result indicates that less evidence to support the alternative hypothesis lies
within organic chemical facilities. Perhaps organic chemical facilities possess more complete
information on enforcement parameters.
Model B3 additionally includes government intervention histories. Estimation results are
shown in the third column of Table 4. For the construction of the inspection-related measures, the
analysis considers the 12-month period and 24-month period preceding the survey’s completion for
23
each respondent. The reported conclusions are fully robust to the chosen period for construction:
inspections do not affect the decision to switch. This result implies that evidence supporting the
alternative hypothesis of experiential deterrence does not differ across facilities based on their
exposure to regulatory scrutiny. Perhaps surprisingly, the experience of actual inspections does not
appear to influence a facility’s information set regarding enforcement parameters. Future research
should explore this point more thoroughly.
In sum, the multivariate estimation results indicate that the evidence supporting the
hypothesis of experiential deterrence differs across facilities based on their characteristics and a key
characteristic of the firms owning facilities. To gain insight into the magnitudes of these significant
effects, we compute the average marginal effects of the relevant regressors using the estimation
results from Model B3, which represents the largest regressor set. The calculated marginal effects
indicates that a switch in ownership structure from non-publicly held ownership to publicly held
ownership prompts a 6.68 percentage point decrease in the probability of improved maintenance and
a switch in product from “other chemicals” to inorganic chemicals prompts an 8.46 percentage point
decrease in the probability of improved maintenance.
5. Conclusions
In sum, our study examines specific deterrence generated by punishment for regulatory
violations with a focus on the distinction between upward revisions to future punishment parameters
– likelihood and severity – and the experience of being penalized. In order to avoid the pitfalls of
empirically analyzing actual choices made by regulated entities, e.g., measuring the beliefs of
penalized entities regarding future penalty likelihood and size, our study examines behavior
associated with a stated choice scenario presented within a survey instrument distributed to the
environmental managers of chemical manufacturing facilities regulated under the U.S. Clean Water
24
Act. This choice of respondents strengthens the external validity of our empirical results. Based on
a variety of statistical methods, our empirical results strongly and robustly reject the standard
hypothesis that specific deterrence stems from upward revisions to punishment parameters, while
supporting the alternative hypothesis of experiential deterrence, whereby facilities focus on recent
experiences to shape their compliance behavior.
Our findings possess meaningful policy implications. First, in this context of environmental
enforcement, where environmental managers generally have no experience with fines, experiencing
a hypothetical fine appears to have a large impact on compliance behavior due to the added effect
of experiential deterrence. Thus, one might conclude that even relatively small fines could prove
effective deterrents. Accordingly, environmental agencies may wish to focus on smaller fines since
they are easier and cheaper to impose and less likely to generate resentment or otherwise undermine
cooperation (Cabinet Office Behavioural Insights Team, 2012). Further research is required,
however, to understand the longevity of the effect of experiential deterrence.
Behavioral insights are already being incorporated into policy prescriptions in other areas.
A study of UK policies – Cabinet Office Behavioural Insights Team (2012) – identifies cases where
the British government has applied behavioral insights to reduce fraud, error, and uncollected debt.
The application of behavioral insights for improving environmental enforcement is in its infancy.
The results from this paper provide a first step and suggest that such application will likely prove
fruitful in leveraging the limited resources available for enforcing environmental regulations.
Clearly, more research is needed in this area. As perhaps the best guidance on this point,
Cabinet Office Behavioural Insights Team (2012) explicitly encourages policymakers and
researchers to follow this protocol for assessing the usefulness of behavioral insights for shaping
policies: test insights in a new context, learn which aspect is working (or not), and then adapt the
approach to yield even better results next time.
25
References
Anton, Wilma Rose Q., George Deltas, and Madhu Khanna (2004), “Incentives for Environmental
Self-Regulation and Implications for Environmental Performance,” Journal of
Environmental Economics and Management, 48, pg. 632-654.
Arimura, Toshi H., Akira Hibiki, and Hajime Katayama (2008), “Is a Voluntary Approach an
Effective Environmental Policy Instrument? A Case for Environmental Management
Systems,” Journal of Environmental Economics and Management, 55, pg. 281-295.
Bandyopadhyay, Sushenjit and John Horowitz (2006), "Do Plants Overcomply with Water Pollution
Regulations? The Role of Discharge Variability," B.E. Journal of Economic Analysis and
Policy: Topics in Economic Analysis and Policy, 6(1), pg. 1-32.
Bebchuk, Lucian A. and Louis Kaplow (1992), "Optimal Sanctions When Individuals Are
Imperfectly Informed About the Probability of Apprehension," Journal of Legal Studies, 21,
pg. 365-370.
Becker, Gary S. (1968), "Crime and Punishment: An Economic Approach," Journal of Political
Economy, 76, pg. 169-217.
Bigoni, Maria, Sven-Olaf Fridolfsson,, Chloe Le Coq, and Giancarlo Spagnolo (2008), "Risk
Aversion, Prospect Theory, and Strategic Risk in Law Enforcement: Evidence from an
Antitrust Experiment," SSE/EFI Working Paper Series in Economics and Finance No 696.
Cabinet Office Behavioural Insights Team (2012), “Applying Behavioural Insights to Reduce Fraud,
Error and Debt,” Cabinet Office, U.K.
Earnhart, Dietrich (2004a), “Regulatory Factors Shaping Environmental Performance at Publicly-
Owned Treatment Plants,” Journal of Environmental Economics and Management, 48 (1),
pg. 655-681.
26
Earnhart, Dietrich (2004b), “Panel Data Analysis of Regulatory Factors Shaping Environmental
Performance,” Review of Economics and Statistics, 86 (1), pg. 391-401.
Earnhart, Dietrich (2009), “The Influence of Facility Characteristics and Permit Conditions on the
Effects of Environmental Regulatory Deterrence,” Journal of Regulatory Economics, 36 (3),
pg. 247-273.
Earnhart, Dietrich and Lana Friesen (2012), “Environmental Management Responses to Punishment:
Specific Deterrence and Certainty versus Severity of Punishment”, School of Economics
Discussion Paper No. 463, University of Queensland, Australia.
Earnhart, Dietrich and Robert Glicksman (2011), Pollution Limits and Polluters’ Efforts to Comply:
The Role of Government Monitoring and Enforcement, Palo Alto, CA: Stanford University
Press.
Eckert, Heather (2004), “Inspections, Warnings, and Compliance: The Case of Petroleum Storage
Regulation,” Journal of Environmental Economics and Management, 47 (2), pg. 232-259.
EPA (1997), Chemical Industry National Environmental Baseline Report 1990-1994, Office of
Enforcement and Compliance Assurance, Environmental Protection Agency, EPA 305-R-96-
002, October 1997.
EPA (1999), EPA/CMA Root Cause Analysis Pilot Project: An Industry Survey, Environmental
Protection Agency, EPA-305-R-99-001, May 1999.
Garoupa, Nuno (2003), "Behavioral Economic Analysis of Crime: A Critical Review," European
Journal of Law and Economics, 15, pg. 5-15.
Gray, Wayne B. and Mary E. Deily (1996), "Compliance and Enforcement: Air Pollution Regulation
in the U.S. Steel Industry," Journal of Environmental Economics and Management, 31, pg.
96-111.
27
Gray, Wayne B., and Jay P. Shimshack (2011), "The Effectiveness of Environmental Monitoring and
Enforcement: A Review of the Empirical Evidence," Review of Environmental Economics
and Policy, 5, pg. 3-24.
Harrington, Winston (1988), "Enforcement Leverage When Penalties Are Restricted," Journal of
Public Economics, 37, pg. 29-53.
Haselhuhn, Michael, Devin Pope, Maurice Schweitzer, and Peter Fishman (2012), "The Impact of
Personal Experience on Behavior: Evidence from Video-Rental Fines," Management
Science, 58, 52-61.
Jolls, Christine, Cass R. Sunstein, and Richard Thaler (1998), "A Behavioral Approach to Law and
Economics," Stanford Law Review, 50, pg. 1471-1550.
Kaplow, Louis (1990), "Optimal Deterrence, Uninformed Individuals, and Acquiring Information
About Whether Acts Are Subject to Sanctions," Journal of Law, Economics, &
Organization, 6, pg. 93-128.
Keller, Carmen, Michael Siegrist, and Heinz Gutscher (2006), "The Role of the Affect and
Availability Heuristics in Risk Communication," Risk Analysis, 26, 631-639.
Kunreuther, Howard and Mark Pauly (2006), "Insurance Decision-Making and Market Behavior,"
Foundations and Trends in Microeconomics, 1, pg. 63-127.
Lochner, Lance (2007), "Individual Perceptions of the Criminal Justice System," American
Economic Review, 97, pg. 444-460.
Maddala, G.S. (1983), Limited-Dependent and Qualitative Variables in Econometrics, Cambridge,
UK: Cambridge University Press.
Malik, Arun S. (1990), "Markets for Pollution Control When Firms Are Noncompliant," Journal of
Environmental Economics and Management, 18, pg. 97-106.
28
Nakamura, Masao, Takuya Takahashi, and Ilan Vertinsky (2001), "Why Japanese Firms Choose to
Certify: A Study of Managerial Responses to Environmental Issues," Journal of
Environmental Economics and Management, 42, pg. 23-52.
Newell, Ben and Tim Rakow (2007), "The Role of Experience in Decisions from Description,"
Psychonomic Bulletin & Review, 14, 1133-1139.
Polinsky, A. Mitchell and Daniel Rubinfeld (1991), "A Model of Optimal Fines for Repeat
Offenders," Journal of Public Economics, 46, 291-306.
Polinsky, A. Mitchell and Steven Shavell (1998), "On Offense History and the Theory of
Deterrence," International Review of Law and Economics, 18, 305-324.
Polinsky, A. Mitchell and Steven Shavell (2000), "The Economic Theory of Public Enforcement of
Law," Journal of Economic Literature, 38, pg. 45-76.
Sah, Raj K. (1991), "Social Osmosis and Patterns of Crime," Journal of Political Economy, 99, pg.
1272-1295.
Scholz, John T. and Wayne B. Gray (1990), "OSHA Enforcement and Workplace Injuries: A
Behavioral Approach to Risk Assessment," Journal of Risk and Uncertainty, 3, pg. 283-305.
Shimshack, Jay P. and Michael B. Ward (2005), "Regulator Reputation, Enforcement, and
Environmental Compliance," Journal of Environmental Economics and Management, 50,
pg. 519-540.
Simonsohn, Uri, Niklas Karlsson, George Loewenstein, and Dan Ariely (2008), "The Tree of
Experience in the Forest of Information: Overweighing Experienced Relative to Observed
Information," Games and Economic Behavior, 62, 263-286.
Thorton, Dorothy, Neil A. Gunningham, and Robert A. Kagan (2005), “General Deterrence and
Corporate Environmental Behaviour.” Law & Policy, 27(2), pg. 262-288.
29
Tversky, Amos and Daniel Kahneman (1974), "Judgment under Uncertainty: Heuristics and Biases,"
Science, 185, pg. 1124-1131.
Weinstein, Neil D. (1980), "Unrealistic Optimism About Future Life Events," Journal of Personality
and Social Psychology, 39, pg. 806-820.
Weinstein, Neil D., Judith E. Lyon, Alexander J. Rothman, and Cara L. Cuite (2000), "Changes in
Perceived Vulnerability Following Natural Disaster," Journal of Social and Clinical
Psychology, 19, pg. 372-395.
30
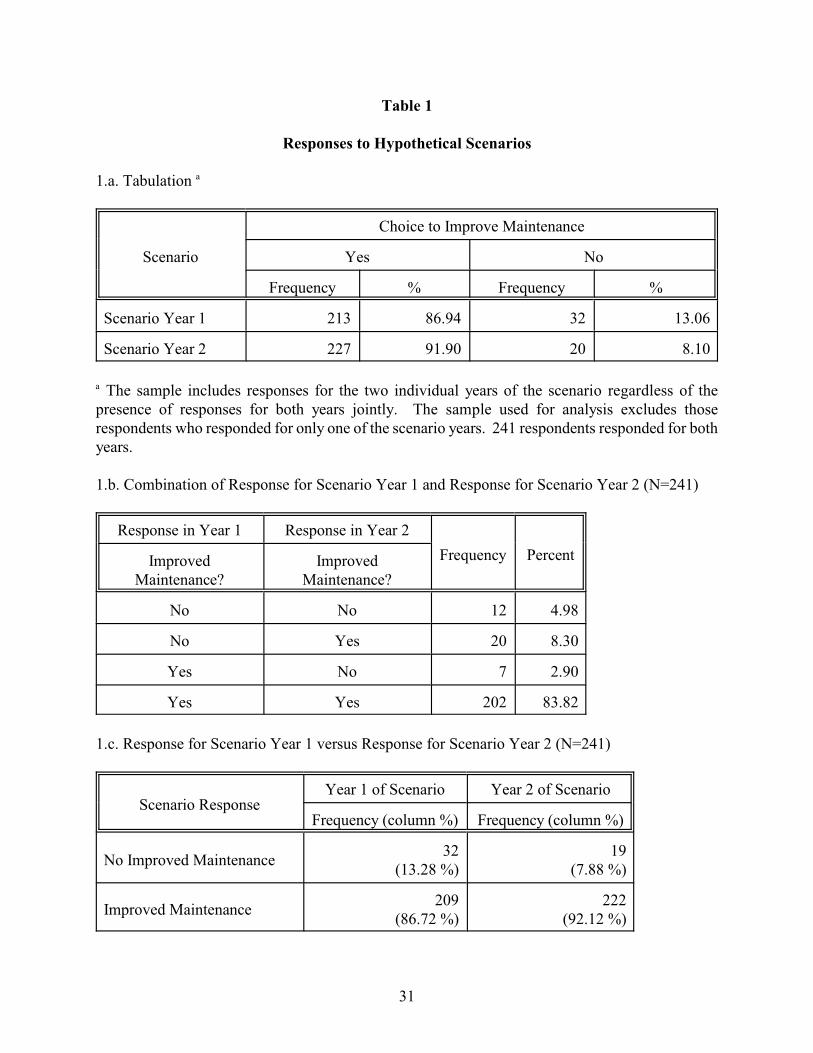
Table 1
Responses to Hypothetical Scenarios
1.a. Tabulation a
Scenario
Choice to Improve Maintenance
Yes No
Frequency % Frequency %
Scenario Year 1 213 86.94 32 13.06
Scenario Year 2 227 91.90 20 8.10
The sample includes responses for the two individual years of the scenario regardless of thea
presence of responses for both years jointly. The sample used for analysis excludes thoserespondents who responded for only one of the scenario years. 241 respondents responded for bothyears.
1.b. Combination of Response for Scenario Year 1 and Response for Scenario Year 2 (N=241)
Response in Year 1 Response in Year 2
Frequency PercentImprovedMaintenance?
ImprovedMaintenance?
No No 12 4.98
No Yes 20 8.30
Yes No 7 2.90
Yes Yes 202 83.82
1.c. Response for Scenario Year 1 versus Response for Scenario Year 2 (N=241)
Scenario ResponseYear 1 of Scenario Year 2 of Scenario
Frequency (column %) Frequency (column %)
No Improved Maintenance32
(13.28 %)19
(7.88 %)
Improved Maintenance209
(86.72 %)222
(92.12 %)
31
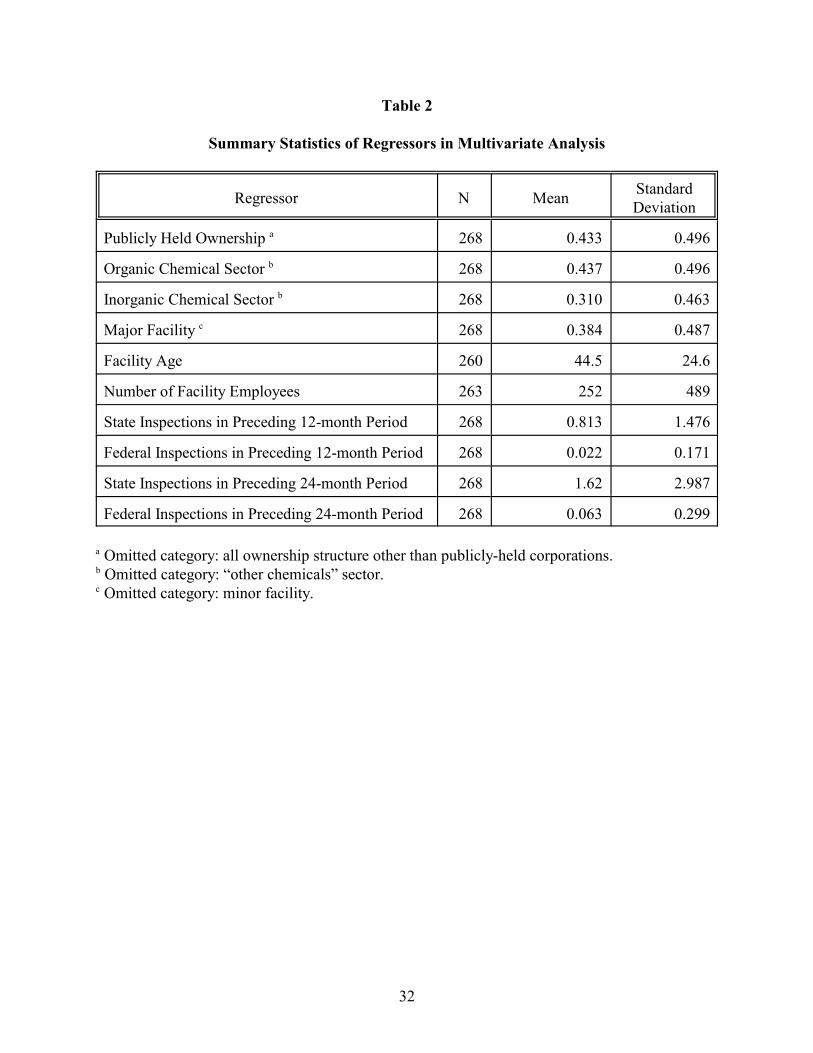
Table 2
Summary Statistics of Regressors in Multivariate Analysis
Regressor N MeanStandardDeviation
Publicly Held Ownership 268 0.433 0.496a
Organic Chemical Sector 268 0.437 0.496b
Inorganic Chemical Sector 268 0.310 0.463b
Major Facility 268 0.384 0.487c
Facility Age 260 44.5 24.6
Number of Facility Employees 263 252 489
State Inspections in Preceding 12-month Period 268 0.813 1.476
Federal Inspections in Preceding 12-month Period 268 0.022 0.171
State Inspections in Preceding 24-month Period 268 1.62 2.987
Federal Inspections in Preceding 24-month Period 268 0.063 0.299
Omitted category: all ownership structure other than publicly-held corporations.a
Omitted category: “other chemicals” sector.b
Omitted category: minor facility.c
32
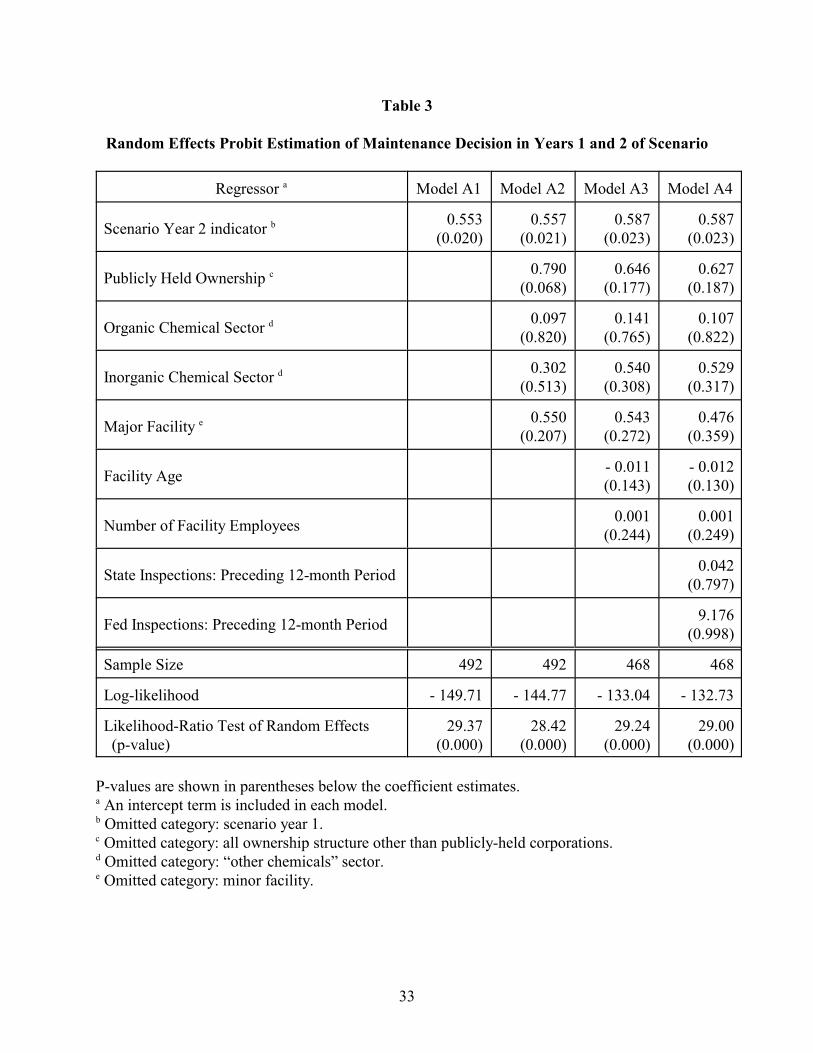
Table 3
Random Effects Probit Estimation of Maintenance Decision in Years 1 and 2 of Scenario
Regressor Model A1 Model A2 Model A3 Model A4a
Scenario Year 2 indicator b 0.553(0.020)
0.557(0.021)
0.587(0.023)
0.587(0.023)
Publicly Held Ownership c 0.790(0.068)
0.646(0.177)
0.627(0.187)
Organic Chemical Sector d 0.097(0.820)
0.141(0.765)
0.107(0.822)
Inorganic Chemical Sector d0.302
(0.513)0.540
(0.308)0.529
(0.317)
Major Facility e 0.550(0.207)
0.543(0.272)
0.476(0.359)
Facility Age- 0.011(0.143)
- 0.012(0.130)
Number of Facility Employees0.001
(0.244)0.001
(0.249)
State Inspections: Preceding 12-month Period0.042
(0.797)
Fed Inspections: Preceding 12-month Period9.176
(0.998)
Sample Size 492 492 468 468
Log-likelihood - 149.71 - 144.77 - 133.04 - 132.73
Likelihood-Ratio Test of Random Effects (p-value)
29.37(0.000)
28.42(0.000)
29.24(0.000)
29.00(0.000)
P-values are shown in parentheses below the coefficient estimates. An intercept term is included in each model.a
Omitted category: scenario year 1.b
Omitted category: all ownership structure other than publicly-held corporations.c
Omitted category: “other chemicals” sector.d
Omitted category: minor facility.e
33
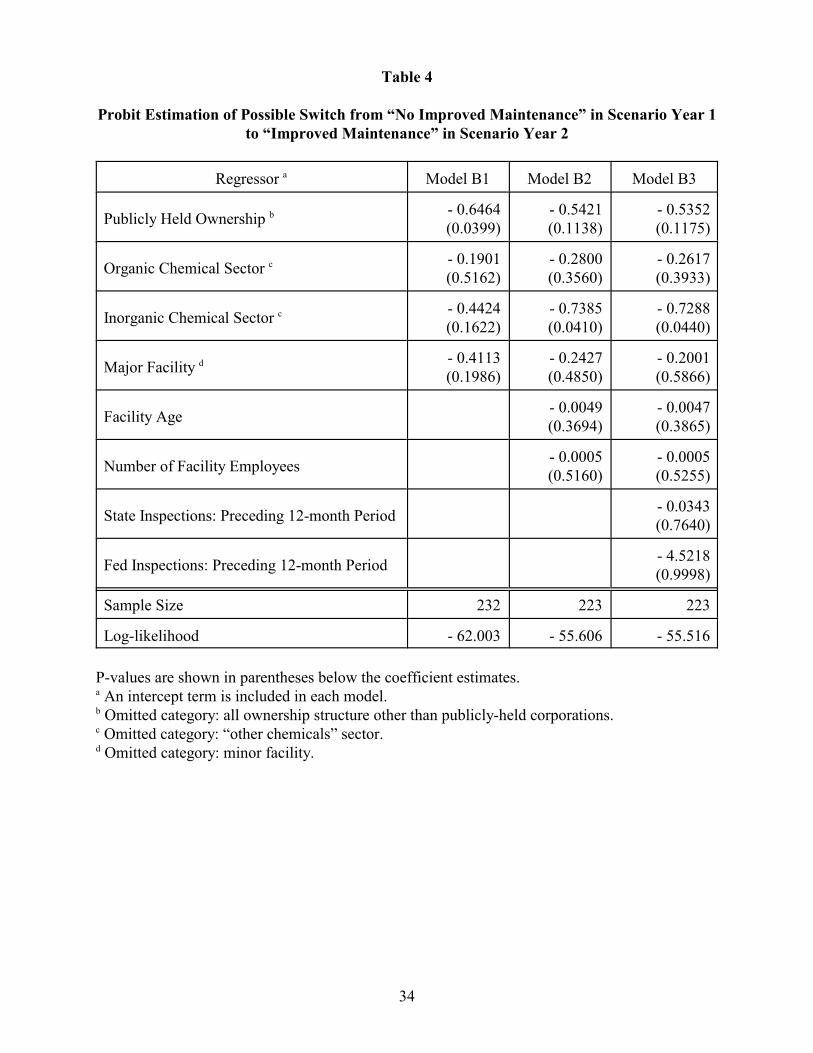
Table 4
Probit Estimation of Possible Switch from “No Improved Maintenance” in Scenario Year 1to “Improved Maintenance” in Scenario Year 2
Regressor Model B1 Model B2 Model B3a
Publicly Held Ownership b - 0.6464(0.0399)
- 0.5421(0.1138)
- 0.5352(0.1175)
Organic Chemical Sector c - 0.1901(0.5162)
- 0.2800(0.3560)
- 0.2617(0.3933)
Inorganic Chemical Sector c- 0.4424(0.1622)
- 0.7385(0.0410)
- 0.7288(0.0440)
Major Facility d - 0.4113(0.1986)
- 0.2427(0.4850)
- 0.2001(0.5866)
Facility Age- 0.0049(0.3694)
- 0.0047(0.3865)
Number of Facility Employees- 0.0005(0.5160)
- 0.0005(0.5255)
State Inspections: Preceding 12-month Period- 0.0343(0.7640)
Fed Inspections: Preceding 12-month Period- 4.5218(0.9998)
Sample Size 232 223 223
Log-likelihood - 62.003 - 55.606 - 55.516
P-values are shown in parentheses below the coefficient estimates. An intercept term is included in each model.a
Omitted category: all ownership structure other than publicly-held corporations.b
Omitted category: “other chemicals” sector.c
Omitted category: minor facility.d
34