Can planetesimals left over from terrestrial planet...
21
Icarus 190 (2007) 203–223 www.elsevier.com/locate/icarus Can planetesimals left over from terrestrial planet formation produce the lunar Late Heavy Bombardment? William F. Bottke * , Harold F. Levison, David Nesvorný, Luke Dones Southwest ResearchInstitute, 1050 Walnut St., Suite 400, Boulder, CO 80302, USA Received 22 August 2006; revised 17 January 2007 Available online 12 March 2007 Abstract The lunar Late Heavy Bombardment (LHB) defines a time between ∼3.8 to possibly 4.1 Gy ago when the Nectarian and early-Imbrium basins on the Moon with reasonably well-constrained ages were formed. Some have argued that these basins were produced by a terminal cataclysm that caused a spike in the inner Solar System impactor flux during this interval. Others have suggested the basins were formed by the tail end of a monotonically decreasing impactor population originally produced by planet formation processes in the inner Solar System. Here we investigate whether this so-called declining bombardment scenario of the LHB is consistent with constraints provided by planet formation models as well as the inferred ages of Nectaris, Serenitatis, Imbrium, and Orientale. We did this by modeling the collisional and dynamical evolution of the post-planet formation population (PPP) for a range of starting PPP masses. Using a Monte Carlo code, we computed the probability that the aforementioned basins were created at various times after the Moon-forming event approximately 4.54 Ga. Our results indicate that the likelihood that the declining bombardment scenario produced Nectaris, Serenitatis, Imbrium, and Orientale (or even just Imbrium and Orientale) at any of their predicted ages is extremely low and can be ruled out at the 3σ confidence level, regardless of the PPP’s starting mass. The reason is that collisional and dynamical evolution quickly depletes the PPP, leaving behind a paucity of large projectiles capable of producing the Moon’s youngest basins between 3.8–4.1 Gy ago. If collisions are excluded from our model, we find that the PPP produces numerous South Pole-Aitken- like basins during the pre-Nectarian period. This is inconsistent with our understanding of lunar topography. Accordingly, our results lead us to conclude that the terminal cataclysm scenario is the only existing LHB paradigm at present that is both viable from a dynamical modeling perspective and consistent with existing constraints. 2007 Elsevier Inc. All rights reserved. Keywords: Asteroids; Asteroids, dynamics; Collisional physics; Impact processes; Origin, Solar System 1. Introduction The lunar Late Heavy Bombardment (LHB) describes a time ∼3.8 to perhaps 4.1 Gy ago (hereafter Ga) when the basins with reasonably well-determined ages on the Moon were formed (see reviews in Hartmann et al., 1981, 2000; Ryder et al., 2000; Warren, 2004). This topic has been fraught with controversy ever since it was introduced by Tera et al. (1974) as a means to explain the absence of lunar rocks with isotopic recrystal- lization ages >4.0 Gy old. Nearly all lunar impact melt breccia samples have been found to have ages between 3.8 and 4.0 Gy old (e.g., Warren, 2004). Tera et al., argued this curious re- * Corresponding author. Fax: +1 303 546 9687. E-mail address: [email protected] (W.F. Bottke). sult was best explained by a terminal cataclysm that was a byproduct of a spike in the inner Solar System impactor flux between ∼3.8–4.0 Ga. Over the last several decades, numerous geologic, cosmochemical, and dynamical arguments have been made in support of the terminal cataclysm model. A few of the more recent articles on this issue include Dalrymple and Ry- der (1993), Ryder et al. (2000), Levison et al. (2001), Cohen et al. (2000), Kring and Cohen (2002), Chambers and Lissauer (2002), Gomes et al. (2005), Norman and Taylor (2005), Strom et al. (2005), Norman et al. (2006), Trail et al. (2007). Others have argued that the LHB was actually the tail end of a monotonically decreasing impactor population originally produced by planet formation processes in the inner Solar System (e.g., Hartmann et al., 2000). We refer to this sce- nario as the declining bombardment. Support for this idea 0019-1035/$ – see front matter 2007 Elsevier Inc. All rights reserved. doi:10.1016/j.icarus.2007.02.010
Transcript of Can planetesimals left over from terrestrial planet...

Icarus 190 (2007) 203–223www.elsevier.com/locate/icarus
Can planetesimals left over from terrestrial planet formationproduce the lunar Late Heavy Bombardment?
William F. Bottke !, Harold F. Levison, David Nesvorn!, Luke Dones
Southwest Research Institute, 1050 Walnut St., Suite 400, Boulder, CO 80302, USA
Received 22 August 2006; revised 17 January 2007
Available online 12 March 2007
Abstract
The lunar Late Heavy Bombardment (LHB) defines a time between "3.8 to possibly 4.1 Gy ago when the Nectarian and early-Imbrium basinson the Moon with reasonably well-constrained ages were formed. Some have argued that these basins were produced by a terminal cataclysm thatcaused a spike in the inner Solar System impactor flux during this interval. Others have suggested the basins were formed by the tail end of amonotonically decreasing impactor population originally produced by planet formation processes in the inner Solar System. Here we investigatewhether this so-called declining bombardment scenario of the LHB is consistent with constraints provided by planet formation models as wellas the inferred ages of Nectaris, Serenitatis, Imbrium, and Orientale. We did this by modeling the collisional and dynamical evolution of thepost-planet formation population (PPP) for a range of starting PPP masses. Using a Monte Carlo code, we computed the probability that theaforementioned basins were created at various times after the Moon-forming event approximately 4.54 Ga. Our results indicate that the likelihoodthat the declining bombardment scenario produced Nectaris, Serenitatis, Imbrium, and Orientale (or even just Imbrium and Orientale) at anyof their predicted ages is extremely low and can be ruled out at the 3! confidence level, regardless of the PPP’s starting mass. The reason isthat collisional and dynamical evolution quickly depletes the PPP, leaving behind a paucity of large projectiles capable of producing the Moon’syoungest basins between 3.8–4.1 Gy ago. If collisions are excluded from our model, we find that the PPP produces numerous South Pole-Aitken-like basins during the pre-Nectarian period. This is inconsistent with our understanding of lunar topography. Accordingly, our results lead usto conclude that the terminal cataclysm scenario is the only existing LHB paradigm at present that is both viable from a dynamical modelingperspective and consistent with existing constraints.! 2007 Elsevier Inc. All rights reserved.
Keywords: Asteroids; Asteroids, dynamics; Collisional physics; Impact processes; Origin, Solar System
1. Introduction
The lunar Late Heavy Bombardment (LHB) describes a time"3.8 to perhaps 4.1 Gy ago (hereafter Ga) when the basins withreasonably well-determined ages on the Moon were formed(see reviews in Hartmann et al., 1981, 2000; Ryder et al., 2000;Warren, 2004). This topic has been fraught with controversyever since it was introduced by Tera et al. (1974) as a meansto explain the absence of lunar rocks with isotopic recrystal-lization ages >4.0 Gy old. Nearly all lunar impact melt brecciasamples have been found to have ages between 3.8 and 4.0 Gyold (e.g., Warren, 2004). Tera et al., argued this curious re-
* Corresponding author. Fax: +1 303 546 9687.E-mail address: [email protected] (W.F. Bottke).
sult was best explained by a terminal cataclysm that was abyproduct of a spike in the inner Solar System impactor fluxbetween "3.8–4.0 Ga. Over the last several decades, numerousgeologic, cosmochemical, and dynamical arguments have beenmade in support of the terminal cataclysm model. A few of themore recent articles on this issue include Dalrymple and Ry-der (1993), Ryder et al. (2000), Levison et al. (2001), Cohenet al. (2000), Kring and Cohen (2002), Chambers and Lissauer(2002), Gomes et al. (2005), Norman and Taylor (2005), Stromet al. (2005), Norman et al. (2006), Trail et al. (2007).
Others have argued that the LHB was actually the tail endof a monotonically decreasing impactor population originallyproduced by planet formation processes in the inner SolarSystem (e.g., Hartmann et al., 2000). We refer to this sce-nario as the declining bombardment. Support for this idea
0019-1035/$ – see front matter ! 2007 Elsevier Inc. All rights reserved.doi:10.1016/j.icarus.2007.02.010

204 W.F. Bottke et al. / Icarus 190 (2007) 203–223
and/or skepticism for the terminal cataclysm scenario is promi-nent in the lunar literature (e.g., Hartung, 1974; Hartmann,1975; Neukum, 1977; Wetherill, 1977; Baldwin 1987a, 1987b,Grinspoon, 1989; Neukum and Ivanov, 1994; Haskin et al.,1998; Morbidelli et al., 2001; Hartmann, 2003; Warren, 2003;Baldwin, 2006; Chapman et al., 2007; see Hartmann et al., 2000for a recent review). If true, the terminal cataclysm as describedabove did not take place, though the declining bombardmentpopulation may have occasionally produced spikes in the lu-nar impact record (Hartmann, 1980). Assuming the decliningbombardment scenario is correct, the Moon and presumablythe other terrestrial planets were subject to highly energetic im-pact events from "4.5 to "3.8 Ga. The paucity of >4.0 Galunar rocks would then be a byproduct of this bombardment,with the oldest lunar rocks continually obliterated and replacedby younger ones (Grinspoon, 1989; see also Hartmann et al.,2000).
Alternatively, these data could simply represent a samplingbias. Haskin et al. (1998) argued that the frontside of theMoon was blanketed by ejecta produced by the Imbrium basin-forming event at #3.85 Ga. If taken to an extreme, this couldimply that nearly every ancient lunar sample from the Apolloand Luna collections, and perhaps most lunar meteorites aswell, were somehow connected to the Imbrium impact. Recentwork by Norman et al. (2006), however, is inconsistent withthis hypothesis. Using modern techniques, they measured highresolution 40Ar–39Ar ages on Apollo 16 impact melt brecciasfound on the central nearside lunar highlands. Their results in-dicate that at least 4 prominent melt-producing impact eventstook place between 3.75 and 3.95 Ga. This implies that conta-mination from Imbrium is limited and the Moon was indeed onthe receiving end of several distinct basin-forming events overthis interval. The nature of this bombardment, however, is stillin dispute.
The resolution of the LHB enigma is critical to our under-standing of not only planet formation but also of how the SolarSystem reached its final configuration. The perennial problem isthat the available information on the LHB from lunar data, col-lected by a wide variety of sources (e.g., the Apollo and Lunaprograms, ground-based observing programs, lunar meteorites,data from unmanned spacecraft, etc.), has led to ambiguousor conflicted conclusions from researchers in the field. In fact,some of the same lunar evidence has been used to support boththe terminal cataclysm and the declining bombardment para-digms.
Regardless of how the LHB constraints are viewed, bothcamps, in the end, need a working dynamical model of their ver-sion of the LHB that is consistent with the most accurate lunardata (e.g., the formation of the large lunar basins Imbrium andOrientale between 3.9–3.7 Ga; see Section 2.3). Over the lastseveral years, significant progress toward such a model has beenmade in the terminal cataclysm camp by Levison et al. (2001),Tsiganis et al. (2005), Morbidelli et al. (2005), and Gomes et al.(2005). We will describe these papers in greater detail in Sec-tion 2.1.
For the declining bombardment scenario, the best availabledynamical model at present is that of Morbidelli et al. (2001).
Using planet formation models, they showed that evolving plan-etary embryos in the terrestrial planet region are likely to scat-ter numerous planetesimals into long-lived high-inclination or-bits. Accordingly, this population of planet formation leftoversmight produce a slow-decaying bombardment on the Moon(and other terrestrial planets) lasting from the Moon’s forma-tion all the way to "3.8 Ga. To check this, Morbidelli et al.(2001) tracked the evolution of test bodies in this scenario for100–300 My using initial conditions taken from planet forma-tion simulations and then extrapolated those results to the LHBepoch. Overall, they found their model did a good job of repro-ducing the population of diameter Dcrater > 10 km craters foundon the ancient lunar cratered terrains as described by Neukumand Ivanov (1994).
A reexamination of Morbidelli et al. (2001) by our team,however, indicates several key aspects of their model may re-quire increased scrutiny. For example, Morbidelli et al. (2001)did not directly compare their results to those large lunar basinswhose ages are reasonably well-constrained by lunar samples(though they did assert that their model would likely have dif-ficulty reproducing the relatively young ages of basins with"3.8–3.9 Ga ages; see Section 2.3). As a second example, itis unclear whether tracking potential lunar projectiles for 100–300 My after the formation of the Moon is sufficiently longto characterize their dynamical behavior all the way to the LHBepoch and beyond. Note that the declining bombardment modelmust not only reproduce the large lunar basins with reason-able age constraints but must also explain why no basins areapparently younger than "3.8 Gy. Numerical integration runsthat track a statistically significant number of test bodies be-yond 600–800 My have yet to be attempted. Finally, insightsgleaned from Bottke et al. (2005a, 2005b, 2006a) suggest thatcollisional evolution between members of the lunar impactingpopulation could diminish the number of projectiles available tostrike the Moon in the declining bombardment paradigm. Col-lisional grinding within the lunar impactor population has yetto be considered in the context of the LHB.
For these reasons, we decided to re-investigate the decliningbombardment paradigm of the LHB. The outline of our paperis as follows. In Section 2, we provide additional backgroundon the terminal cataclysm and declining bombardment modelsof the LHB while also discussing the constraints provided bythe lunar basins whose ages are known to reasonable precision.In Section 3, we describe our initial conditions as well as thenumerical procedure used to simulate the evolution of the post-planet formation population, which we define in this paper asthe PPP. In Section 4, we compute the dynamical decay rate ofthe PPP as well as the impact rate it has with the Moon. We thenuse this information to estimate the size of the initial PPP anddiscuss whether it is consistent with existing planet formationmodels. We then allow the PPP to undergo collisional evolutionas well as dynamical depletion and discuss how these processesaffect our estimate of the initial PPP. Finally, Section 5 con-tains our conclusions and some discussion of the implicationsof this work for the timing of events occurring on the terrestrialplanets early in Solar System history. As an aside, Appendix Aexamines several niches in semimajor axis a, eccentricity e, and

Left over planetesimals and the Late Heavy Bombardment 205
inclination i space where test bodies from our numerical inte-gration work were found to have considerably longer dynamicallifetimes than those of typical near-Earth objects (NEOs).
2. Background on modeling the lunar Late HeavyBombardment
2.1. A dynamical model for the terminal cataclysm paradigm
Before focusing our attention on the declining bombard-ment, we believe it is useful to first describe how its main com-petitor explains the LHB. Recent dynamical modeling work byTsiganis et al. (2005), Morbidelli et al. (2005), and Gomes etal. (2005) indicates that a plausible scenario may now existto not only reproduce the terminal cataclysm but also explainmany other longstanding problems in Solar System dynamics.These papers are commonly referred to as the “Nice” model,named after the Observatoire de la Côte d’Azur in Nice, Francewhere it was developed. For reference, these papers were builton many of the ideas contained in Wetherill (1975), Levison etal. (2001), and Levison et al. (2004).
In the Nice model, the jovian planets were assumed to havegrown on initially nearly circular, coplanar orbits with a morecompact configuration than they have today (all were locatedbetween 5–15 AU). Slow planetary migration was induced inthe jovian planets by gravitational interactions with planetesi-mals leaking out of a "35M$ planetesimal disk residing be-tween "16 to "30 AU. These interactions steadily stretchedthe system of planets over hundreds of My. Eventually, after adelay of "600 My set by the initial configuration of the gasgiants (Gomes et al., 2005), Jupiter and Saturn crossed theirmutual 1:2 mean motion resonance, which caused their e and i
values to jump from values near zero to their current values. Inturn, this caused Uranus and Neptune to become unstable andbe scattered outward, such that they penetrated the disk and mi-grated through it. The orbits of Uranus and Neptune were thencircularized by dynamical friction produced by bodies in thedisk. As described by Tsiganis et al. (2005), this model doesa good job of reproducing the orbital parameters (a, e, i) ofthe jovian planets. Moreover, scattered planetesimals capturedduring the LHB into Jupiter Trojan orbits (i.e., orbits aroundJupiter’s Lagrangian L4 and L5 points) had i values that areconsistent with those of the observed population (Morbidelli etal., 2005). This potentially solves a long-standing problem inunderstanding the formation of those bodies (e.g., Marzari etal., 2002).
With Jupiter and Saturn shifting to new orbits, inner So-lar System resonances like the "6 and "16 secular resonancesmoved to new locations (Gomes et al., 2005). Numerical simu-lations suggest they may have swept across the main belt region.In the process, they would have ejected numerous asteroidsfrom that stable zone. Thus, the Nice model predicts that theterminal cataclysm may be a combination of cometary bodiesscattered by Uranus/Neptune and asteroids pushed out of themain belt.
Gomes et al. (2005) predicted the instability in the Nicemodel should have significantly increased the inner Solar Sys-
tem small body population near 3.9 Gy. Their estimates indi-cate that material ejected from the main belt alone could havecaused the Earth/Moon-crossing populations to grow by 3–4orders of magnitude over their present-day populations for atimescale lasting tens of My to perhaps 100–200 My. 1–10times the current main belt population. The size of this pre-dicted bombardment appears to be consistent with the massaccreted by the Moon during the LHB (see also Levison etal., 2001). It is also interesting to note that the impact sig-nature produced by the LHB on the Moon is consistent withthe current shape of the main belt size distribution (Stromet al., 1992, 2005; A. Cheng, personal communication) aswell as its predicted shape 3.8–3.9 Ga (Bottke et al., 2005a,2005b).
There are still several issues related to the Nice terminal cat-aclysm model that could be better quantified. For example, it isnot known whether the LHB impactors in the Nice model weremostly asteroids, mostly comets, or some roughly equal combi-nation of the two. Note that while Strom et al. (2005) predictedthat the crater size distribution found on the lunar highlandswas consistent with impactors from the main belt, this mightonly tell us that the asteroidal component of the LHB struckafter the cometary component (Gomes et al., 2005). The trueshape of the cometary size distribution at the time of the LHB(and now) is unknown (Bernstein et al., 2004); if the scalinglaws controlling comet breakup events are similar to those ofasteroids, and collisional grinding within the disk of objectsbeyond 15 AU was significant between 4.5–3.9 Gy ago, it isconceivable that the main asteroid belt and cometary sourcesize distributions had similar shapes (O’Brien et al., 2005; seealso Bottke et al., 2005a, 2005b). On the other hand, Kring andCohen (2002) used the siderophile element signatures in lunarimpact melt samples to argue that the projectiles that formedthe major nearside basins could not have had comet-like com-positions (see also Tagle, 2005). The debate on this issue willlikely continue until additional samples are returned from theMoon.
The terminal cataclysm model of the LHB has recentlygained support from studies of Hadean-era zircons on Earth(Trail et al., 2007). These ancient objects, which formed prior tothe LHB, show a sequence of secondary overgrowths that mayhave been formed by shock heating and metamorphism eventsproduced by enormous terrestrial impacts "3.9 Gy ago. Trailet al., argue that the lack of comparable features in pre-Archeanzircons implies that the LHB was most likely a terminal cata-clysm rather than a declining bombardment.
While there are clearly aspects of the Nice model that need tobe better understood, this work has raised the bar for other LHBmodels. For this reason, we believe it is of critical importanceto evaluate the declining bombardment scenario. The rest of thepaper will concentrate on this topic.
2.2. A dynamical model for the declining bombardmentparadigm
In order to probe the declining bombardment paradigm andthe nature of the putative post-planet formation population

206 W.F. Bottke et al. / Icarus 190 (2007) 203–223
(PPP), it is useful to first briefly review what is known aboutthe primordial population of planetesimals that make up the in-ner Solar System planets. The history of small bodies in theinner Solar System begins when dust-sized bodies form out ofthe Solar Nebula. These dust motes eventually grow into km-sized planetesimals through inelastic collisions between parti-cles (e.g., Weidenschilling, 2003) or gravitational instabilities(e.g., Goldreich and Ward, 1973; Youdin and Chiang, 2004;Tanga et al., 2004; Youdin and Goodman, 2005). At this point,objects in distinct feeding zones undergo runaway growth, al-lowing numerous protoplanets to emerge from the swarm ofmaterial that surrounds them (e.g., Greenberg et al., 1978;Wetherill and Stewart, 1989; Weidenschilling et al., 1997;Kokubo and Ida, 2002). This leaves most of the system’s massconcentrated in a relatively small number of bodies. Chaoticinteractions between the protoplanets eventually lead to merg-ers and the formation of the terrestrial planets over a timescaleof several tens of My (e.g., Wetherill, 1992; Weidenschillinget al., 1997; Chambers and Wetherill, 1998; Agnor et al., 1999;Chambers, 2001; Chambers and Wetherill, 2001; Chambers andCassen, 2002; Petit et al., 2001; Levison and Agnor, 2003; Ray-mond et al., 2004; 2006; McNeil et al., 2005; Kenyon andBromley, 2006; Kokubo et al., 2006; O’Brien et al., 2006;Chambers, 2006). At the same time, gravitational perturbationsfrom the embryos dynamically excited the leftover planetesi-mals to high inclinations. This prevented many of them fromagglomerating with the new planets.
We define the PPP to be the inner Solar System planetesimalpopulation that existed after the Moon was formed. The bestavailable evidence indicates the lunar forming impact occurrednear the very end of Earth’s accretion some 30 My after the for-mation of the first solids in the Solar System (see Canup, 2004,for a recent review). There are several possible endstates forobjects in the PPP. Some strike one another at high velocitiesand disrupt. Others strike the Sun or are scattered out of the in-ner Solar System by gravitational interactions with the planets.While a few go on to strike the newly-formed Moon and terres-trial planets, the remainder stay in the inner Solar System and,by necessity, are driven into regions of (a, e, i) space where thetimescales for their removal are long.
The dynamical evolution of the PPP was most recently ex-amined by Morbidelli et al. (2001) (an earlier treatment ofthis problem can be found in Wetherill, 1977). Using latestage planet formation simulations by Chambers and Wether-ill (1998), Morbidelli et al. (2001) generated initial conditionsfor different PPPs and tracked the dynamical evolution of testbodies on these orbits for at least 100 My. Overall, Morbidelli etal. (2001) found the median dynamical lifetime of PPP bodieswas 50–60 My with a decay rate proportional to e%t/77 (time t
in My). Next, using established codes (e.g., Farinella and Davis,1992), they computed the collision probabilities and impact ve-locities between their PPP and the Moon in order to comparetheir results with LHB constraints. Their work focused on dataprovided by Neukum and Ivanov (1994), who estimated thatthe number of D > 10 km craters formed on the Moon between4.4–3.9 Ga was 10%3 per square km or 40,000 craters when in-tegrated over the entire surface. Morbidelli et al. (2001) found
their numerical results for the declining bombardment wereconsistent with these data. It is important to point out, however,that the most ancient craters on the lunar highlands are in sat-uration equilibrium; this would make the Neukum and Ivanovvalues lower limits on the total number of craters formed.
Morbidelli et al. (2001) also compared their results to thenumber of basins formed on the Moon prior to 3.9 Ga, wherea basin was defined as a crater with diameter Dcrater > 300 km.For this test, they assumed that the 28–45 basins tabulated byWilhelms (1987) were formed between 4.4–3.9 Ga and thatthey comprised a complete set. No specific age information wasassumed for any particular basin. The 4 largest lunar basinswere assumed to have formed by D > 50 km projectiles overthe same time span. Their work suggested they could reproducethis basin population if their initial PPP contained "10,000bodies larger than D > 20 km and 1000 bodies larger thanD > 50 km. These values are approximately 5 and 2 times thecurrent main belt population, respectively.
While the Morbidelli et al. (2001) declining bombardmentmodel has many positive attributes, our reexamination of theirwork indicates some of their assumptions and results may beproblematic:
• The Morbidelli et al. (2001) declining bombardment modelpredicts that almost all of the large lunar basins shouldhave formed early in the 4.5–3.8 Ga epoch. As will bedescribed in Section 2.3, however, several prominent lu-nar basins with reasonably constrained ages formed at theend of this time period. This was recognized by Morbidelliet al. (2001) to be at odds with their model results andwas specifically cited in their paper as a potentially se-rious problem for their model. They also assumed thatthe D > 10 km craters discussed by Neukum and Ivanov(1994) formed between 4.4–3.9 Ga. The ages of thesecraters, however, are model dependent; they could havealso have formed during the terminal cataclysm. Withoutadditional age information, these small craters cannot beused to differentiate between the terminal cataclysm anddeclining bombardment models of the LHB.
• They assumed that their test body runs, which only went100–300 My after planet formation, could be extrapolatedto "600 My or beyond. This approximation may be rea-sonable, but it has yet to be confirmed by numerical simula-tions. Moreover, it prevented them from examining whethertheir declining bombardment model produced any basinsyounger than 3.8 Ga (see Section 2.3).
• They assumed that the PPP experienced little collisionalevolution over its lifetime. Given the size of the PPP andthe high collision probabilities and impact velocities of PPPobjects with one another, however, we believe this approx-imation is invalid and in fact may prevent the PPP frommatching the constraints of the LHB.
In Sections 3–4, we will critically reexamine these assump-tions and determine whether they are consistent with existingLHB constraints.
Left over planetesimals and the Late Heavy Bombardment 207
2.3. Constraints on lunar basin formation
In order to constrain the LHB, we need to first understand, asbest as possible with the available data, the early impact historyof the Moon. Since the time of the Apollo program, it has beenknown that the Moon experienced an extraordinarily intensebombardment of comets and/or asteroids some time between"4.5 and 3.8 Ga. While the duration, intensity, and nature ofthe impact flux over this timespan is still being debated, it isagreed that the largest and most prominent lunar impact fea-tures were created during this interval. Wilhelms (1987) claimsthat at least 40 basins were produced on the Moon with ages>3.8 Ga (see also Cook et al., 2000). Some notable examplesinclude the South-Pole Aitken basin (Dcrater " 2600 km), theImbrium basin (Dcrater " 1160 km), and the Orientale basin(Dcrater " 930 km) (a compilation of basin data can be foundat the Impact Basin Database; Wood, 2004).
The production of more than 40 basins on the Moon overa "700 My time period (or less) represents at least a 2–3orders of magnitude increase in the impactor flux over thecurrent flux (e.g., Wilhelms, 1987). For reference, the post-mare cratering rate on the Moon over the last 3 Gy has been"3 & 10%15 km%2 yr%1 for Dcrater ! 20 km (e.g., Grieve andShoemaker, 1994; Shoemaker and Shoemaker, 1996; McEwenet al., 1997; Shoemaker, 1998; see also Bottke et al., 2005a,2005b). The largest impact structure formed on the Moon dur-ing the last "3 Gy is Langrenus, a 132 km crater that is toosmall to qualify for basin status (McEwen et al., 1993). We in-fer from this data that the early impact history of the Moon wasvery different from that of the last few Gy.
The ages of some of the lunar basins described above havebeen inferred from an analysis of (i) lunar samples collectedby the Apollo and Luna programs (e.g., crystallization ages ofrock units, ages of impact melts, degree of crustal contamina-tion by meteoritic material), (ii) geologic investigations of thestratigraphy and degree of degradation of observed basins, and(iii) crater counts and the superposition of basins and craters.Using this information as a guide, Wilhelms (1987) divided lu-nar history prior to the formation of the Orientale basin, theyoungest multi-ring basin on the Moon (3.84–3.72 Ga; Stöfflerand Ryder, 2001), into 3 phases: pre-Nectarian, Nectarian, andearly-Imbrium. For the Nectarian and early-Imbrium periods,Wilhelms (1987) assumed the deposits of the Nectaris andImbrium basins defined the pre-Nectarian/Nectarian and Nec-taris/Imbrium boundaries. We discuss each period below.
2.3.1. Pre-Nectarian periodThe pre-Nectarian period represents the earliest observable
phase of lunar history. Much of its terrain is located on thefar side of the Moon. Wilhelms (1987) identified 30 multi-ringbasins and/or their ejecta formed during this epoch, includ-ing the South Pole-Aitken basin and Procellarum, the latter ofwhich may not be an impact basin (Smith et al., 1997). Digitalelevation models and stereoimagery of the Moon have recentlyincreased this number to 36 (Cook et al., 2000). Unfortunately,not only do most of these basins have indeterminate ages, butthe starting time of the pre-Nectarian period is poorly under-
stood. For example, some argue this period extends all the wayback to the oldest recorded lunar material (4.52 Ga; Lee et al.,1997; Halliday, 2000), while others claim that the oldest pre-Nectarian basins formed between 4.2–4.1 Ga (Wilhelms, 1987)or even 3.9 Ga (e.g., Stöffler and Ryder, 2001).
Another problem with interpreting the record of pre-Necta-rian basins is that they may be incomplete. It is likely that atleast a few ancient basins have been covered up or obliteratedby impact events occurring later in lunar history. It is also con-ceivable that the lunar surface was, at some time in the distantpast, saturated with basins (C. Chapman, personal communica-tion). If true, a significant portion of the Moon’s early historycould have been erased.
With this said, saturated lunar terrains cannot hide end-less numbers of giant basins without leaving behind sometraces (e.g., Norman and Taylor, 2005). As an example, con-sider South Pole-Aitken, the largest undisputed basin on theMoon with Dcrater = 2600 km. Zahnle and Sleep (1997) esti-mate the energy needed to form South Pole-Aitken was roughly1 & 1034 ergs, give or take a factor of 4. Topographic mapson the Moon from the Clementine spacecraft show South Pole-Aitken to be an easily recognizable, singular feature that is 12km lower than the surrounding highlands (Smith et al., 1997;Cook et al., 2000). The only comparable feature in the innerSolar System is the Chryse Basin on Mars (Taylor, 1998). If ad-ditional South Pole-Aitken-like basins had formed on the Moonin the pre-Nectarian period, they would have presumably leftbehind deep scars that would readily show up on a lunar topo-graphic map. The fact that we have yet to find evidence forsuch deep holes nor lunar mantle material excavated by big im-pacts implies that the South Pole-Aitken basin may have beenthe largest impact event on the Moon since the formation of itscrust. Analysis of a ferroan noritic anorthosite clast from a lu-nar breccia indicates that lunar crust formation on the Moonoccurred at 4.46 ± 0.04 Gy, roughly 100 My after the forma-tion of the earliest datable solids found in primitive meteorites(Norman et al., 2003). This value, if accurate, places an im-portant limit on the nature of the population striking the Moonbetween 4.46 Ga and today.
2.3.2. Nectarian periodThe boundary of the pre-Nectarian/Nectarian period is
marked by the formation of the Nectaris basin (Dcrater =860 km). The age of this basin is controversial. Using photoge-ologic methods and stratigraphy alone, Nectaris appears to beolder than Imbrium and Serenitatis (Wilhelms, 1987; Baldwin,2006). The most frequently cited age for Nectaris, based onan analysis of 40Ar–39Ar ages from Apollo 16 impact clasts,is 3.92 Ga, though some prefer an age as young as 3.85 Ga[see Stöffler and Ryder (2001) and Warren (2004) for recent re-views]. The detection of 4 large impact events in the Apollo16 data between 3.75–3.95 Ga by Norman et al. (2006) pro-vides some evidence, albeit circumstantial, that these ages arereasonable. On the other hand, others have argued that at leastsome Apollo 16 samples are ejecta from the Imbrium impact,and that the true Nectaris age is 4.12 Ga (Korotev et al., 2002;Warren, 2003).

208 W.F. Bottke et al. / Icarus 190 (2007) 203–223
The ambiguous age of Nectaris has allowed it to be citedas evidence both for and against the terminal cataclysm sce-nario (Hartmann et al., 2000). By superposition arguments, ayoung Nectaris pushes some basin formation events towardages younger than 3.9 Ga. This provides support to those whoargue that the LHB was a cataclysm rather than a decliningbombardment. Alternatively, an older Nectaris lends credenceto the idea that basin-forming impacts took place on the Moonover most of its early history.
Observations indicate 12 multi-ring basins were formed inthe Nectarian period (i.e., defined as the age sequence betweenthe formation of the Nectaris and Imbrium basins; Wilhelms,1987). A few of these basins have reasonably precise age es-timates (e.g., Crisium, a Dcrater = 740 km crater formed 3.84–3.89 Ga; Serenitatis, a Dcrater = 920 km crater formed 3.893–3.87 Ga; see Stöffler and Ryder, 2001). The age estimate ofSerenitatis may have been affected by Imbrium ejecta (Haskinet al., 1998). Using photogeologic arguments alone, however,Wilhelms (1987) and Baldwin (2006) claim that Serenitatisformed after Crisium but before Imbrium.
2.3.3. Early-Imbrium periodThe formation of the Imbrium basin marks the end of the
Nectarian and the beginning of the early-Imbrium period. De-pending on the samples used, Imbrium has several possibleages. According to materials returned by the Apollo program,Imbrium has an estimated age of 3.85 ± 0.02 or 3.77 ± 0.02 Ga(Stöffler and Ryder, 2001). On the other hand, using the lu-nar meteorite Sayh al Uhaymir, Gnos et al. (2004) estimatedImbrium’s age to be 3.909 ± 0.013 Ga. The early-Imbriumperiod terminates with the formation of the Orientale basin,which may be 3.84–3.72 Gy old (Stöffler and Ryder, 2001).The younger constraint is set by the oldest age of nearby ex-posed mare basalts of Upper Imbrium age produced after Ori-entale (Wilhelms, 1987). The consensus opinion based on cratercounts and photogeology is that the Imbrium and Orientalebasins formed close in time to one another and marked the endof large basin-formation events on the Moon (Wilhelms, 1987;Baldwin, 2006).
2.3.4. Summary of constraintsGiven this information, we conclude that the largest Nectar-
ian and early-Imbrium basins provide the best constraints forour LHB model results. The early-Imbrium basins are of par-ticular importance because there is relatively little debate overtheir absolute ages; they simply do not suffer from the same age
ambiguities that afflict the other lunar basins. As we will show,this means the very existence of Imbrium and Orientale them-selves may be enough to rule out the declining bombardmentscenario.
In order to give the declining bombardment scenario as fairan opportunity as possible, we assumed the Nectarian and early-Imbrium basins formed over a wide range of ages, with the Nec-tarian period beginning 4.12 or 3.92 Ga, the early-Imbrium pe-riod beginning 3.91 or 3.85 Ga, and the early-Imbrium ending3.82 or 3.72 Ga (Table 1). These ages are used below as mile-posts to test whether the Nectarian and early-Imbrium basinswere formed by the PPP. The four largest basins formed in theNectarian and early-Imbrium periods, in order of decreasingsize, were Imbrium, Orientale, Serenitatis, and Nectaris (1160,930, 920, and 860 km, respectively). The two largest basinsformed in the early-Imbrium period were Imbrium and Orien-tale.
Zahnle and Sleep (1997) estimate the energy needed to formImbrium and Orientale were 1–3 & 1033 and 1 & 1033 ergs, re-spectively. Given that Orientale, Serenitatis, and Nectaris allhave similar-sized multi-ring structures (see Wood, 2004), weassume here that all were formed with roughly the same amountof impact energy. To be conservative in favor of the decliningbombardment scenario, the lower end of this energy range isused in our modeling work.
The remaining "12 basins of the Nectarian and early-Imbrium periods were produced by considerably lower energyimpacts than the largest basins (e.g., 1–4 & 1031 ergs or less)(Levison et al., 2001). While these smaller basins can alsobe used to tell us about the LHB, we are unsure whetherthey comprise a complete set. For example, several putativebasins with unknown ages have been classified as “uncertain”or “proposed” at the Impact Basin Database (Wood, 2004).This means they lack central depressions, surrounding ejectadeposits, or multiple rings. In a few cases, the only evidence fortheir existence may come from circular depressions observed inClementine altimetry data. This leads us to believe that an un-known number of small basins were obliterated by subsequentbasin/cratering events and/or the emplacement of mare basalts.As such, we choose not to use them as constraints in this pa-per.
The LHB constraints used in our modeling work below aresummarized here:
1. We assume that the starting time for the PPP (t = 0 My)was the Moon-forming event that took place 4541 Ma, 30
Table 1The approximate starting and ending times for the lunar time-stratigraphic units discussed in this paper
Lunar period Start (Ga) Start (t after MFE in My) End (Ga) End (t after MFE in My)
Pre-Nectarian Unknown Unknown 4.12 or 3.92 421 or 621Nectarian 4.12 or 3.92 421 or 621 3.91 or 3.85 631 or 691Early Imbrium 3.91 or 3.85 631 or 691 3.82 or 3.72 721 or 821
The third and fifth columns provide the same information in an alternative manner. Here elapsed time is measured after the Moon-forming event (MFE) at t = 0 My.For reference, we assume the MFE occurred 4.541 Ga. Our model constraints are as follows. Basin set A assumes Nectaris, Serenitatis, Imbrium, and Orientaleformed in the Nectarian and early-Imbrium periods. Basin set B assumes Imbrium and Orientale formed in the early-Imbrium period.

Left over planetesimals and the Late Heavy Bombardment 209
My after the formation of the first solids 4571 Ma (Kleineet al., 2002; Shukolyukov and Lugmair, 2002). Here t isdefined as the time after the Moon formed. The use of sig-nificant figures here does not imply degree of accuracy;rather it is included for mathematical convenience in ourmodeling work.
2. The approximate ages of the large basins described aboveare used as constraints in the LHB models described be-low. Given uncertainties about the age of Nectaris as well asthe possible contamination of both Nectaris and Serenitatisby Imbrium ejecta, we are careful to use two sets of basinages to test our model results. For basin set A, we use thefour largest Nectarian and early-Imbrium basins that mayhave formed over intervals of (using point 1, from shortestto longest): t = 621–721 My, 621–821 My, 421–721 My,and 421–821 My (Table 1). For basin set B, we confineourselves to Imbrium and Orientale, whose ages are rea-sonably well-dated. We assume they formed over intervalsof t = 691–721 My, 631–721 My, 691–821 My, and 631–821 My (Table 1).
3. No Dcrater > 900 km basins have formed on the Moon sincethe end of the early-Imbrium period. This is a less restric-tive version of the observation that no Dcrater > 300 kmbasins can be found on terrains younger than the early-Imbrium period. Given the robust nature of our conclu-sions, we decided it was unnecessary to adopt the latterconstraint in our paper, though it can readily be applied tofuture modeling work if needed.
We can also test our results against the reality check describedbelow. While interesting, we believe point #4 should not yet beconsidered as quantitative or diagnostic as the above constraintsuntil more is understood about the pre-Nectarian history of theMoon.
4. The impact event that created the South Pole-Aitken basintook place in the pre-Nectarian period, defined here as thetime period between the solidification of the lunar crust,presumed to be 4.46 ± 0.04 Ga (Norman et al., 2003), andthe formation of the Nectaris basin (see above). Given thelarge depth and diameter of South Pole-Aitken, we believeit is unlikely that many similar-sized basins were producedand erased during the pre-Nectarian. Thus, any LHB modelthat creates large numbers of South Pole-Aitken-like basinsin the pre-Nectarian should be treated with skepticism.
3. Numerical methods
In this section, we track the dynamical evolution of bodies inthe PPP residing in the terrestrial planet region. Our procedureis as follows. First, we define the initial conditions of the PPP(Section 3.1). Next, we numerically integrate the test bodies inour PPP for over 1 Gy of simulation time, following the pro-cedure described in Section 3.2. The goal is to produce outputthat can be used in Section 4 to determine the decay and lunarimpact rate of the PPP over time.
3.1. Initial conditions for the post-planet formation population
Our first task is to establish initial conditions for the PPP.This is challenging to do with precision because current planetformation models capable of tracking planetesimal evolutionare unable as of yet to reproduce the orbital parameters (a, e, i)
and sizes of Mercury, Venus, Earth, and Mars (e.g., Wetherill,1992; Weidenschilling et al., 1997; Chambers and Wether-ill, 1998; Agnor et al., 1999; Chambers and Wetherill, 2001;Chambers and Cassen, 2002; Petit et al., 2001; Raymond et al.,2004, 2006; Kenyon and Bromley, 2006; Kokubo et al., 2006;O’Brien et al., 2006). This problem may be solved in the nearfuture by the inclusion of computationally-expensive physicalprocesses such as gravitational interactions between planetaryembryos and a massive disk of planetesimals that produces dy-namical friction (Levison et al., 2005) and those between solidbodies and the remnant gas nebula that produces gas drag andembryo migration (Agnor and Ward, 2002; Kominami and Ida,2004; McNeil et al., 2005; Kominami et al., 2005). Until thattime, however, all researchers wanting to explore the PPP areforced to make certain compromises.
For example, Morbidelli et al. (2001) chose to investigatethe PPP by tracking the evolution of test bodies started be-tween 1–2 AU within the late stage planet formation simula-tions described by Chambers and Wetherill (1998). They foundthat interactions with Moon- to Mars-sized embryos drove asmall fraction of the test bodies to high inclinations. In fact, thea < 2 AU bodies that survived 100 My generally had i > 39'.The planets responsible for driving their test bodies to theseorbits, however, are only vaguely similar to our terrestrial plan-ets; in many cases, they consisted of two planets comparable insize to Earth/Venus with eccentricities and inclinations reaching>0.1 and >10', respectively. While we agree with the conclu-sions of Morbidelli et al. (2001) that the long-lived survivorsof the PPP are likely to have high inclinations, the somewhatextreme orbits of their terrestrial planets may have driven theirPPP to higher inclinations than would be expected from a moredynamically quiescent planetary population. This means thatsome particles may fill niches of orbital parameter space unob-tainable by real objects.
To avoid this potential problem while still exploiting the in-sights gleaned from the Morbidelli et al. (2001) simulations,we selected test bodies for our PPP that had the same orbitalparameters as the observed near-Earth objects (NEOs) witha < 2 AU and i > 40'. We found that 83 of the 2400 knownNEOs with a < 4 AU (as of September 2003) matched thiscriterion. Their (a, e, i) orbits, which are shown in Fig. 1, aresimilar to the “Model 2” PPP from Morbidelli et al. (2001);the main difference is that the NEOs used here contain fewerobjects with extreme inclinations (i > 60'). According to thenumerical integration results from Bottke et al. (2002), whotracked the evolution of numerous test bodies from the mainbelt to the NEO region and beyond, these bodies have longersurvival times than most NEOs. Thus, if there is some problemwith our PPP initial conditions, we believe it would be one thatfavors longer rather than shorter dynamical lifetimes. As shownin Section 4.1, our results provide a reasonable match to an ex-

210 W.F. Bottke et al. / Icarus 190 (2007) 203–223
Fig. 1. The 2400 objects of the known near-Earth object (NEO) populationwith a < 4 AU as of September 2003. The 83 objects with semimajor axisa < 2 AU and inclination i > 40' are shown as stars on the plot. These objectswere chosen as starting conditions for our post-planet formation population(PPP). Those NEOs located between the solid lines in (a, e) space are on Earthand Moon-crossing orbits. Objects with perihelion q " 1.017 AU and aphelionQ ! 0.983 AU fit this criterion.
trapolation of the Morbidelli et al. (2001) results for the basinformation times examined here (t = 421–821 Gy).
To better understand why high inclination NEOs have lowloss rates (and why we use them as initial conditions for ourPPP), it is useful to examine dynamical lifetimes among theentire NEO population. Bottke et al. (2002) found that mostNEOs on a > 2 AU orbits only last a few My (at best), whilethose on a < 2 AU orbits may last as long as several tens tohundreds of My. NEOs with a > 2 AU have short lifetimesbecause the 2 < a < 3.5 AU region is crisscrossed by power-ful resonances (e.g., the 3:1, 5:2, and 2:1 mean motion reso-nances with Jupiter; the "6 secular resonance) and overlappingweaker resonances produced by Mars and other planets. Thegravitational perturbations produced by these resonances, whencombined with the orbit-changing effects of planetary encoun-ters, readily push a > 2 AU NEOs onto orbits that allow themto strike the Sun or be readily ejected from the inner SolarSystem by encounters with Jupiter. The resonances located inthe a < 2 AU region are weak by comparison (Michel, 1998;Michel et al., 2000). This means that objects achieving a <2 AU orbits may wander the inner Solar System for an extendedtime before they strike a terrestrial planet or are pushed backonto an orbit with a > 2 AU. The time to reach a > 2 AU canbe even longer for high inclination NEOs, in large part becausetheir relative velocities with the terrestrial planets prevent closeencounters from significantly modifying their orbits.
3.2. Numerical methods for tracking the evolution of thepost-planet formation population
Numerical simulations completed on thousands of test NEOsto date have yet to identify any that can survive 600–800 My inthe inner Solar System (i.e., the time from the Moon-formingevent to the presumed end of the basin-forming era; Table 1).This does not mean that such long-lived objects do not or cannot
exist, but rather that the runs completed to date have inadequatestatistics to properly measure the long-lived tail of the NEOpopulation.
There are two ways to directly determine the fraction of thepopulation that can survive 600–800 My. The first is to trackmillions upon millions of test bodies until they are removedfrom the inner Solar System. While simple, this method re-quires far more CPU power than our team has available to it.The second way, which we adopt here, is to follow limitednumbers of test bodies until some arbitrary fraction of the pop-ulation has been removed from the system. The survivors arethen cloned and the simulation continued until they are reducedby the same arbitrary fraction. This procedure is repeated untilsome test bodies reach 600–800 My after the start of the sim-ulation. Ideally, the derived test body decay curve should besimilar to that of the first method, provided the survivors circu-late far enough within the inner Solar System to encounter allreachable (a, e, i) regions. Particles finding their way into lo-cal zones of stability within this space will live longer and thuswill be more likely to be cloned at the end of each run. Overtime, the lifetimes of these bodies should dominate the decayrate of the ensemble. Our goal is to determine the fraction ofthe PPP that survives long enough to produce the Nectarian andearly-Imbrium basins via a declining bombardment.
The dynamical evolution of our PPP was computed usingswift_rmvs3, a numerical integrator written by Levison andDuncan (1994) that was based on a symplectic algorithm pub-lished by Wisdom and Holman (1991). The gravitational pertur-bations of planets Venus through Neptune on their current orbitswere included. The effect of Yarkovsky thermal drag on the PPP(e.g., Bottke et al., 2006b) was neglected because dynamicsin NEO space for km-sized asteroids is dominated by plane-tary encounters and powerful resonances (Gladman et al., 1997;Migliorini et al., 1998; Bottke et al., 2000, 2002, 2006b). Testasteroids were tracked until they collided with the Sun, a planet,or were thrown beyond 6 AU from the Sun (usually by a closeencounter with Jupiter). The timestep for our integrations waschosen to be 15 days.
To improve the statistics of our PPP, we cloned the 83 NEOsdescribed above (Fig. 1) 16 times by giving them slight dis-placements to their orbital velocity vectors (10%6 AU yr%1).(Note that because the Lyapunov times for our objects are typi-cally shorter than 1000 years, even tiny velocity displacementsto the starting conditions of our clones allow them to orbitallydiverge on short timescales). We then sub-divided the 1328 par-ticles into 8 groups of 166 particles apiece so they could run oneight processors devoted to long-term integrations. For refer-ence, we define a test case as a run started on an individualprocessor. The orbits of the particles and their loss rate wereoutput every 10,000 years. When the initial population fromeach test case was reduced to 12 particles, we cloned the re-maining particles 10 times (for a total of 120 particles) andrestarted the integrations. This will be referred to below as ageneration. Each test case, made up of multiple generations,was followed for at least 1 Gy. In two test cases, we followedthe clones all the way to "4 Gy.

Left over planetesimals and the Late Heavy Bombardment 211
4. Results
Here we use the results from the previous section to com-pute whether the PPP can produce the lunar basins with knownages (Section 2.3). Our procedure is as follows. First, we calcu-lated the decay rate of our PPP as well as its normalized impactrate with the Moon (Sections 4.1–4.2). In this case, the initialsize-frequency distribution of the PPP was treated as a free pa-rameter. Next, we chose a shape for the PPP size distributionand used a Monte Carlo code to determine how big the ini-tial PPP had to be to statistically produce the largest Nectarianand Early-Imbrium basins within various time intervals (Sec-tion 4.3). Finally, we explored how collisional evolution withinthe PPP affected the number of basin-forming projectiles avail-able to strike the Moon during the LHB, with the results againtested using a Monte Carlo code (Section 4.4).
4.1. Dynamical decay rates for the post-planet formationpopulation
An example of a six generation single test case is shownin Fig. 2. The fraction leaving the simulation has been scaledto properly account for loss rates among different generations,such that Fig. 2 shows the decay rate of the initial PPP vs time.The basin formation times are given in Table 1.
The time needed to reduce the first generation to 12 particlesout of 166 (7%) was # 60 My. The second generation parti-cles had longer dynamical lifetimes than the first generationbecause many of the cloned survivors found zones of relative
Fig. 2. The decay rate for a PPP test run started on a single processor. This initialtest run contained 166 particles; two sets of 83 bodies with (a, e, i) orbits verysimilar to those described in Fig. 1. When this PPP was reduced to 12 particles,we cloned the remaining particles 10 times (for a total of 120 particles) andrestarted the integrations. There are 6 generations in this test run. Our resultswere scaled from generation to generation so the decay rate can be referencedback to a population of arbitrary starting size. The black dots represent thestarting times of various generations. The numbers adjacent to the dots are thegeneration number. Hence, the second and third generations of this test run startat 60 My and # 270 My, respectively. We terminated the test run at the end ofthe sixth generation, when the surviving 12 particles had reached 4.34 Gy ofcumulative time. The (a, e, i) location of test bodies from this long-lived tailare discussed in Section 5.
stability in the inner Solar System. In all, these bodies took# 270 My to reach the 10% level (12 out of 120). Starting withthe third generation, particle lifetimes began to follow a lineartrend in log–log space, with the decay times growing steadilylonger as the survivors in each generation find and/or residewithin regions with long dynamical lifetimes. A line fit to theresults in log–log space between the beginning of the third gen-eration at 276 My and the end of the simulation at 4.34 Gyyields log10 fleft(t) = 5.69 % 3.15 log10 t , where fleft(t) is thefraction of the population remaining in the simulation and t isthe elapsed time in My. By extrapolating these results from thisparticular test run to 4.6 Gy, we estimate that "1 & 10%6 ofthe original PPP population should be left in the inner SolarSystem region. In other words, the PPP survivors in this purelydynamical test case are literally one in a million. These resultsindicate there are indeed some zones of relative stability in theinner Solar System. Their (a, e, i) location will be discussed inAppendix A.
The results for all eight of our test runs are shown in Fig. 3.Here we see a second long-lived tail in a different test case af-ter six generations. These two long-lived tails mean there areat least two quasi-stable refugia for particles within the innerSolar System, though it should be pointed out that the parti-cles in both test cases took several hundreds of My or moreto find these regions (see Appendix A). The remaining six test
Fig. 3. The dynamical decay rate for 8 different PPP test runs. The initial con-ditions for each test run is described in Fig. 2. Each test run was tracked formultiple generations until they exceeded 1 Gy of cumulative simulation time.The two test cases that developed long-lived tails were tracked to "4 Gy. Theseresults indicate there are at least two quasi-stable refugia for particles withinthe inner Solar System. These zones were not found by our test bodies until thenominal time of the LHB (i.e., 0.6 Gy). The mean of these curves fleft(t) atour LHB mileposts (Table 1) at the start of the Nectarian period (t = 421 My(4.12 Ga) or 621 My (3.92 Ga)) are 2.1 & 10%3 or 4.0 & 10%4, respectively, atthe beginning of the early-Imbrium period (t = 631 My (3.91 Ga) or 691 My(3.85 Ga)) is 3.6 & 10%4 or 2.1 & 10%4, respectively; and the end of theearly-Imbrium period (t = 721 My (3.82 Ga) or 821 My (3.72 Ga)) they are1.7 & 10%4, and 9.5 & 10%5, respectively. If we extrapolate the existing trendsto t = 4.6 Gy, we find that "2.5 & 10%7 of the initial PPP survived 4.6 Gy. Thedotted line shows the PPP decay rate for Morbidelli et al. (2001), whose resultswere proportional to e%t/77 with time in My. The curves agree with ours at thecritical time of 421–812 My.

212 W.F. Bottke et al. / Icarus 190 (2007) 203–223
cases were terminated at various times after 1 Gy, well beyondthe 600–800 My limit for determining the fate of the PPP atthe end of the LHB. Despite this, we found no signs that anyof these particles found zones where their dynamical lifetimescould grow to anomalously long values. These results providesupport for the idea that our runs should do a reasonable job ofrepresenting the broad-scale dynamical behavior of PPP popu-lations made of millions of particles.
For reference, we have also plotted the Morbidelli et al.(2001) PPP decay rate of e%t/77, with time t in My. We findour results are in good agreement with this estimate for the crit-ical LHB time of t = 421–821 My.
Using these eight test cases, we computed the average frac-tion of the PPP left in the inner Solar System as a function oftime. Our results indicate that fleft(t) at our LHB mileposts(Table 1) range from 2.1 & 10%3 for the earliest start of theNectarian period (t = 421 My) to 9.5 & 10%5 for the latest ter-mination of the early-Imbrium period (t = 821 My). In otherwords, the size of the PPP drops 3 to 4 orders of magnitude bythe time it reaches the basin formation period. As we will showin Section 4.4, inclusion of collisional evolution within the PPPpopulation decreases these values even more.
4.2. The normalized lunar impact rate
The orbital evolution data computed in Section 3 can alsobe used to compute the impact rate of PPP bodies on the Moonas a function of time. Ignoring collisional evolution within thePPP, we defined the cumulative number of objects striking theMoon between times t1 and t2 with a projectile diameter largerthan D as:
(1)
nimp(>D) = 14
(!
D
Ninit(D)[DMoon + D]2 dD
&t2!
t1
Pi(t)Fgrav"V((t), t
#fleft(t)dt.
Here Ninit(D) is the number of PPP objects between D andD + dD at t = 0 My. Integrating Ninit(D) over the limits inEq. (1) yields Ninit(>D), the cumulative number of initial PPPobjects larger than D.
The value Pi(t) is the intrinsic collision probability betweentest bodies in the PPP and the Moon at time t . This quantitydepends solely on the (a, e, i) orbits of both the projectilesand the Moon (Opik, 1951; Wetherill, 1967; Greenberg, 1982;Farinella and Davis, 1992; Bottke and Greenberg, 1993). Thegravitational focusing factor for PPP projectiles with the Moonis denoted by Fgrav(V((t), t), where V((t) is the speed of theprojectile at time t before the gravitational acceleration by theEarth and Moon is included. The parameter DMoon is the diam-eter of the Moon.
To calculate the collision probabilities and encounter/impactvelocities between bodies in the PPP and the Moon, we ap-plied the methodology described in Bottke et al. (1994b). Weassumed the Moon had the same (a, e, i) parameters as the
Fig. 4. The mean intrinsic collision probabilities (top) and impact velocities(bottom) between the Moon and test bodies in the PPP. The mean intrinsic col-lision probability of test bodies on Moon-crossing orbits is labeled as Pi(Cross) ,while that of the entire population is Pi(Pop) . The difference between the twovalues over time shows that the longest-lived test bodies evolve away fromMoon-crossing orbits. Note that Pi(Cross) and the mean impact velocity oftest bodies on Moon-crossing orbits only changes by relatively small amountsthroughout the simulation.
Earth, with the Earth’s orbital information given by our numeri-cal integration results. At each output timestep of 10,000 years,we computed the quantities Pi(t) and the velocities V((t) andVimp(t) between the Moon’s (a, e, i) orbit and the (a, e, i) or-bits of those test bodies on Earth/Moon-crossing orbits. Themean values of these quantities at each time t were defined asfollows: )Pi(t)*Cross is the mean Pi value of those test bodieson Earth/Moon-crossing orbits; )V((t)* and )Vimp(t)* are themean (weighted by Pi ) encounter and impact velocities for thesame set of bodies; and )Pi(t)*Pop is )Pi(t)*Cross & #, where #
is the fraction of test bodies at time t on Earth/Moon-crossingorbits. In Eq. (1), we substituted )Pi(t)*Pop and )V((t)* for thePi(t) and V((t) values.
Fig. 4 shows our results for )Pi(t)*Cross, )Pi(t)*Pop, and)Vimp(t)*. We do not show )V((t)* because their values weresimilar to the )Vimp(t)* values. We found that )Pi(t)*Cross in-creased from 30&10%18 km%2 yr%1 near t = 0 My to 30%46&10%18 km%2 yr%1 near t = 800 My. When we factor in #, wefind that )Pi(t)*Pop decreases from 25 & 10%18 km%2 yr%1 neart = 0 My to "10 & 10%18 km%2 yr%1 near t = 800 My. Thisindicates that only a small fraction of the PPP is actually ca-pable of impacting the Moon when the early-Imbrium basinswere formed. For reference, the lunar impact rate derived from

Left over planetesimals and the Late Heavy Bombardment 213
)Pi(t)*Pop near t = 0%10 My is similar to that from Morbidelliet al. (2001) (i.e., "8 & 10%5 per My between 0–100 My).
The quantity )Vimp(t)* decreases from "29 to "23 km s%1
over t = 0%821 My. The reason it drops with time is becausethe surviving test bodies find zones of stability with highersemimajor axes and lower inclinations than those in the ini-tial PPP. For reference, the mean impact velocities found inMorbidelli et al. (2001) between 0–100 My ranged from 22–25 to "30 km s%1, depending on the model PPP distributionused in their runs.
We define the gravitational focusing factor between PPPbodies and the Moon in this simulation as:
(2)Fgrav(t) =$
1 +v2
esc,M
v2(
%,
where vesc,M is the escape speed from the Moon. Note thata completely rigorous definition would also include a correc-tion factor that accounts for gravitational focusing producedby Earth’s gravity at the Moon’s distance as well as how theMoon’s distance r changes between the Moon-forming impactand the end of the simulation (e.g., Touma and Wisdom, 1994;Ward and Canup, 2000). These factors are negligible for thePPP, however, because )v(* is well over 20 km s%1 (i.e., com-parable to )Vimp(t)*). Accordingly, the gravitational focusingfactor Fgrav(t) # 1.
Fig. 5 shows the number of lunar impacts between 0 and1,200 My as a function of time for a PPP population normal-ized to be comprised of a single body. Because we assume PPPdynamics is independent of its mass, this function can be mul-tiplied by any PPP population of choice to obtain the numberof lunar impacts occurring at a given time after the Moon’sformation. These results assume that the projectiles strikingthe Moon are substantially smaller than the Moon itself (i.e.,Dmoon + D). We find that the PPP impact rate drops by twoorders of magnitude over the first 100 My. It then enters into aslower decline between 100 and 1200 My. A line in log-linearspace fit to the results between t = 100 and 1200 My has theform log10[nimp(>D)/Ninit(>D)] = %5.6 % 0.0038t , with t inunits of My.
It is instructive to compare the values in Fig. 5 to those inFig. 8.6.1 of Hartmann et al. (1981), who plotted the densityof D > 4 km craters per square km on the Moon vs their esti-mated crater retention age (see also Neukum and Ivanov, 1994;Stöffler and Ryder, 2001). We find that our numerically de-rived lunar impact rate decreases by over 4 orders of magnitudebetween t = 0 and 721–821 My, while the crater density-age re-lationship of Hartmann et al. (1981) only drops by "2 orders ofmagnitude over roughly the same time interval. If the Hartmannet al. (1981) estimates were not influenced by crater saturation,our PPP impact flux drops off too quickly to reproduce theirresults.
Using Fig. 5, we can derive the number of PPP impactson the Moon needed to produce basin sets A and B over thetime intervals described in Table 1 as a function of Ninit(>D).For reference, the total number of basin-forming impacts fromt1 = 0 My to t2 = 1200 My is log[nimp(>D)/Ninit(>D)] #%2.837. For basin set A, log[nimp(>D)/Ninit(>D)] ranges
Fig. 5. The number of lunar impacts produced per My by the PPP, where thesize of the PPP has been normalized to a single object. The t = 0 My time wasassumed to be the Moon-forming event. The PPP impact rate drops sharply overthe first 100 My and then transitions to a more steady decline between 100 to1200 My. The largest lunar basins formed in Nectarian and early-Imbrium timeperiods are, in order of decreasing size, Imbrium, Orientale, Serenitatis, andNectaris. The plausible formation intervals for basin sets A and B are given inTable 1. The interval with a maximum at 4.12 Ga and a minimum at 3.72 Gacorresponds to basin set A. The interval with maximum at 3.91 Ga and mini-mum at 3.72 Ga corresponds to basin set B. No basins formed after these times.
from %5.218 to %6.156, while for basin set B, it goes from%6.066 to %6.853. These values are used in the next section.
4.3. The probability of basin formation by a collisionlesspost-planet formation population
4.3.1. Estimating the initial size of the post-planet formationpopulation
In Section 4.2, we computed the number of basin-formingimpacts over a given time interval as the ratio log[nimp(>D)/
Ninit(>D)]. We can now use constraints from basin sets A andB to determine nimp(>D). In turn, this allows us to estimatethe optimum size of an initial, collisionless PPP populationNinit(>D) capable of making those basins.
The energy needed to produce the Imbrium basin was 1%3&1033 ergs, while the energy needed to make Orientale, Sereni-tatis, and Nectaris was "1 & 1033 ergs (see Section 2.3). If weassume these basins were formed by the PPP, we can use Fig. 4to estimate the impact velocities of the basin-forming projec-tiles. Fig. 4 shows that )Vimp(t)* between t = 421%812 Mywas "23 km s%1. This implies that the PPP projectile capa-ble of forming Imbrium had a mass of (8 ± 4) & 1020 g, whilethose capable of forming Orientale, Serenitatis, and Nectariswere "4 & 1020 g. If the PPP projectiles had a bulk densitycomparable to S-type asteroids (2.7 g cm%3; Britt et al., 2002),these values yield projectile diameters of D = 64%93 km forImbrium and D " 64 km for the other large basins. Accord-ingly, to explain these basins as a byproduct of PPP impacts,we need four D > 64 km projectiles to strike the Moon duringthe Nectarian and early-Imbrium periods to make basin set A(nimp(D > 64 km) # 4), while two D > 64 km projectiles must
214 W.F. Bottke et al. / Icarus 190 (2007) 203–223
strike the Moon during the early-Imbrium period to make basinset B.
We now have everything we need to solve for Ninit(D >
64 km). Using the time intervals for basin set A described inTable 1, we estimate that Ninit(D > 64 km) could range from0.66 to 5.8 & 106. For basin set B, these values range from 2.3to 14 & 106.
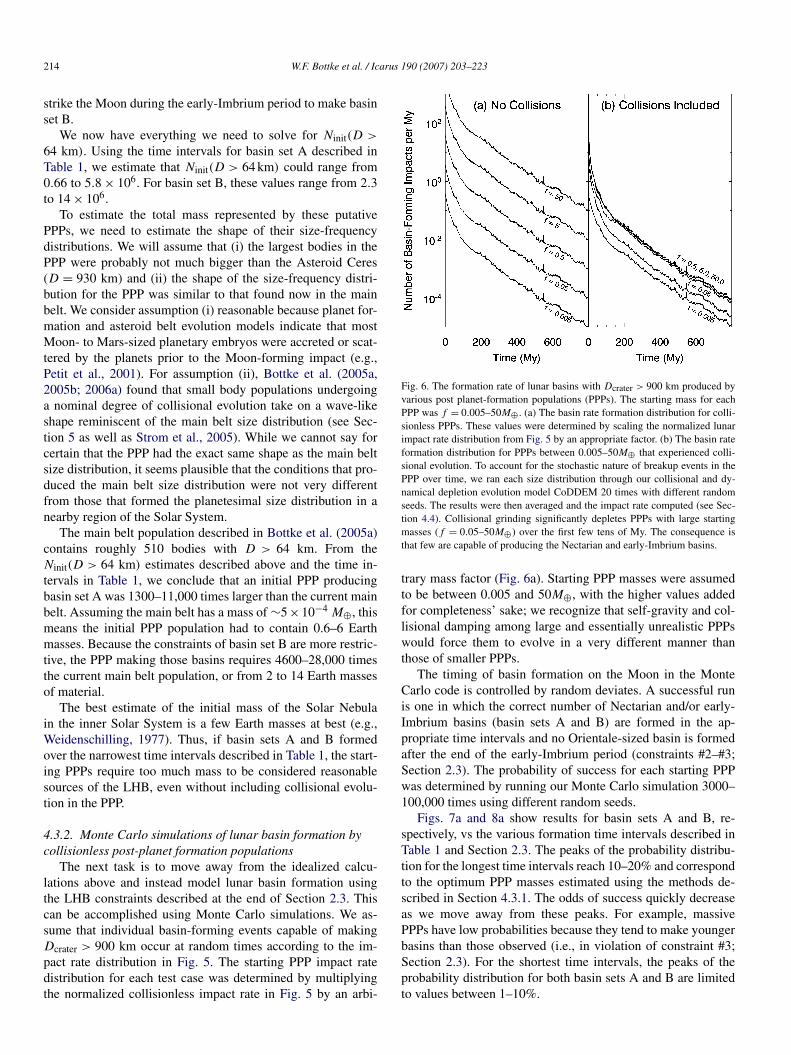
To estimate the total mass represented by these putativePPPs, we need to estimate the shape of their size-frequencydistributions. We will assume that (i) the largest bodies in thePPP were probably not much bigger than the Asteroid Ceres(D = 930 km) and (ii) the shape of the size-frequency distri-bution for the PPP was similar to that found now in the mainbelt. We consider assumption (i) reasonable because planet for-mation and asteroid belt evolution models indicate that mostMoon- to Mars-sized planetary embryos were accreted or scat-tered by the planets prior to the Moon-forming impact (e.g.,Petit et al., 2001). For assumption (ii), Bottke et al. (2005a,2005b; 2006a) found that small body populations undergoinga nominal degree of collisional evolution take on a wave-likeshape reminiscent of the main belt size distribution (see Sec-tion 5 as well as Strom et al., 2005). While we cannot say forcertain that the PPP had the exact same shape as the main beltsize distribution, it seems plausible that the conditions that pro-duced the main belt size distribution were not very differentfrom those that formed the planetesimal size distribution in anearby region of the Solar System.
The main belt population described in Bottke et al. (2005a)contains roughly 510 bodies with D > 64 km. From theNinit(D > 64 km) estimates described above and the time in-tervals in Table 1, we conclude that an initial PPP producingbasin set A was 1300–11,000 times larger than the current mainbelt. Assuming the main belt has a mass of "5&10%4 M$, thismeans the initial PPP population had to contain 0.6–6 Earthmasses. Because the constraints of basin set B are more restric-tive, the PPP making those basins requires 4600–28,000 timesthe current main belt population, or from 2 to 14 Earth massesof material.
The best estimate of the initial mass of the Solar Nebulain the inner Solar System is a few Earth masses at best (e.g.,Weidenschilling, 1977). Thus, if basin sets A and B formedover the narrowest time intervals described in Table 1, the start-ing PPPs require too much mass to be considered reasonablesources of the LHB, even without including collisional evolu-tion in the PPP.
4.3.2. Monte Carlo simulations of lunar basin formation bycollisionless post-planet formation populations
The next task is to move away from the idealized calcu-lations above and instead model lunar basin formation usingthe LHB constraints described at the end of Section 2.3. Thiscan be accomplished using Monte Carlo simulations. We as-sume that individual basin-forming events capable of makingDcrater > 900 km occur at random times according to the im-pact rate distribution in Fig. 5. The starting PPP impact ratedistribution for each test case was determined by multiplyingthe normalized collisionless impact rate in Fig. 5 by an arbi-
Fig. 6. The formation rate of lunar basins with Dcrater > 900 km produced byvarious post planet-formation populations (PPPs). The starting mass for eachPPP was f = 0.005–50M$ . (a) The basin rate formation distribution for colli-sionless PPPs. These values were determined by scaling the normalized lunarimpact rate distribution from Fig. 5 by an appropriate factor. (b) The basin rateformation distribution for PPPs between 0.005–50M$ that experienced colli-sional evolution. To account for the stochastic nature of breakup events in thePPP over time, we ran each size distribution through our collisional and dy-namical depletion evolution model CoDDEM 20 times with different randomseeds. The results were then averaged and the impact rate computed (see Sec-tion 4.4). Collisional grinding significantly depletes PPPs with large startingmasses (f = 0.05–50M$) over the first few tens of My. The consequence isthat few are capable of producing the Nectarian and early-Imbrium basins.
trary mass factor (Fig. 6a). Starting PPP masses were assumedto be between 0.005 and 50M$, with the higher values addedfor completeness’ sake; we recognize that self-gravity and col-lisional damping among large and essentially unrealistic PPPswould force them to evolve in a very different manner thanthose of smaller PPPs.
The timing of basin formation on the Moon in the MonteCarlo code is controlled by random deviates. A successful runis one in which the correct number of Nectarian and/or early-Imbrium basins (basin sets A and B) are formed in the ap-propriate time intervals and no Orientale-sized basin is formedafter the end of the early-Imbrium period (constraints #2–#3;Section 2.3). The probability of success for each starting PPPwas determined by running our Monte Carlo simulation 3000–100,000 times using different random seeds.
Figs. 7a and 8a show results for basin sets A and B, re-spectively, vs the various formation time intervals described inTable 1 and Section 2.3. The peaks of the probability distribu-tion for the longest time intervals reach 10–20% and correspondto the optimum PPP masses estimated using the methods de-scribed in Section 4.3.1. The odds of success quickly decreaseas we move away from these peaks. For example, massivePPPs have low probabilities because they tend to make youngerbasins than those observed (i.e., in violation of constraint #3;Section 2.3). For the shortest time intervals, the peaks of theprobability distribution for both basin sets A and B are limitedto values between 1–10%.

Left over planetesimals and the Late Heavy Bombardment 215
Fig. 7. The probability that post planet-formation populations (PPPs) of varying starting masses will produce the four large basins found in the Nectarian andearly-Imbrium periods (i.e., basin set A from Section 2.3: Imbrium, Nectaris, Orientale, and Serenitatis). The basins were assumed to have formed from 4.12 or3.92 Ga to 3.82 or 3.72 Ga (t = 421 or 621 My to 721 or 821 My) (Table 1). The values were computed using a Monte Carlo code run 3000–100,000 times (seeSections 4.3.2 and 4.4.2 for details). A successful test case was defined as one in which all four basins were formed in the labeled time interval and no basins wereformed after the end of the interval. (a) The success probabilities for PPP runs without collisional evolution. (b) The success probabilities for PPP runs in whichcollisional evolution is included. Note that collisional evolution reduces the likelihood of a successful outcome in the declining bombardment paradigm below the3! threshold. No successful runs were found for 621–721 My and 621–821 My intervals.
Overall, these results indicate that a collisionless PPP hasa small but non-negligible chance to create the Nectarian andearly-Imbrium basins, but only if the initial population had 0.4to several M$ of material in the form of D < 1000 km bodies.Even then, much depends on the timing of the basin forma-tion events in basin sets A and B. Advocates of the terminalcataclysm scenario could argue that the PPP masses with thehighest probabilities are unlikely to exist in the inner Solar Sys-tem after the Moon-forming event. As we will see in the nextsection, however, it is unnecessary to employ such argumentsbecause collision evolution among PPP bodies has a importantnegative effect on the results.
Before moving on, it is useful to check these results againstreality. For our first check, we computed the total number ofOrientale-sized basins made on the Moon. Using our MonteCarlo simulations with the highest probability of success andbasin set A constraints, we predict that the declining bom-bardment paradigm should have produced 100–700 Dcrater >
900 km basins in the pre-Nectarian period, defined here asthe interval between the formation of the lunar crust 4.46 ±0.04 Ga (Norman et al., 2003) and the formation of Nectaris(see Section 2.3). Using basin B constraints alone, the num-ber of Dcrater > 900 km basins created in the pre-Nectarianand Nectarian periods is 340–600. These numbers are ex-ceedingly high compared to observations (Wilhelms, 1987;Baldwin, 2006). This discrepancy, however, might be elimi-nated if the largest pre-Nectarian basins were in saturation equi-librium, with newly-created basins covering up and/or erasingolder basins. At present, we cannot say whether this scenario isconsistent with existing lunar data.
For our second check, we examined the South-Pole Aitkenbasin constraint described at the end of Section 2.3 (point#4). Using the procedure described in Section 4.2, we findthat South Pole-Aitken-like formation energies of 0.25%4 &1034 ergs (Section 2.3) require the impact of PPP projectileswith 90 < D < 220 km. If the shape of the PPP size distri-bution was indeed comparable to that in the observed mainbelt, the declining bombardment should have produced tens ofSouth Pole-Aitken-like basins. Given the extreme depth andunique nature of South Pole-Aitken itself, it seems unlikelythat these putative basins could have completely escaped de-tection on existing lunar topographic maps (Smith et al., 1997;Cook et al., 2000).
4.4. Collisional evolution within the post-planet formationpopulation
Numerical modeling work has shown that dynamically ex-cited small body populations in the inner Solar System signifi-cantly larger than the main belt population are highly efficientat losing mass via catastrophic disruption events (e.g., Bottkeet al., 2005a, 2005b, 2006a). These factors imply that the PPPsmodeled in Section 4.3 should undergo a rather intense phaseof collisional evolution, perhaps enough to dramatically mod-ify the number of D > 64 km objects available to create lunarbasins. Here we explore what happens to our declining bom-bardment model results if we include collisions between bodiesin the PPP.
Before starting, it is useful to point out a few caveats rel-evant to our more extreme test cases. For simplicity, we haveassumed in this paper that (i) collisions do not affect the dy-

216 W.F. Bottke et al. / Icarus 190 (2007) 203–223
Fig. 8. The probability that post planet-formation populations (PPPs) of varying starting masses will produce the basins Imbrium and Orientale in the early-Imbriumperiod (i.e., basin set B from Section 2.3). The basins were assumed to have formed from 3.91 or 3.85 to 3.82 Ga or 3.72 Ga (t = 631 or 691 My to 721 or 821 My)(Table 1). See Fig. 7 for additional details. (a) The success probabilities for PPP runs without collisional evolution. (b) The success probabilities for PPP runs inwhere collisional evolution is included. As in Fig. 7, collisions are effective at reducing the success probabilities for the declining bombardment paradigm below the3! threshold.
namics of the PPP and (ii) PPP dynamics is accurately modeledusing massless test bodies. These assumptions break down forextremely massive PPPs. In such systems, mutual collisions candamp the orbital excitation of the PPP, while collective gravi-tational effects modify the orbital evolution of the PPP in waysthat are not simulated here. Hence, while we model the evo-lution of very massive PPPs using our codes, the outcomesfrom these particular runs should not be considered accurate;they are merely included for completeness’ sake. (Note thatsuper-massive PPPs can be ruled out according to Solar Neb-ula constraints; Weidenschilling, 1977.)
4.4.1. A demonstration of the effects of collisional evolutionon the PPP
To demonstrate how collisions can affect the PPP over time,we describe a representative test case. We will assume that basinset A formed between 4.12–3.72 Ga (t = 421%821 My) andwas produced by an initial PPP that contained "0.6M$ in theform of D < 1000 km planetesimals. This starting mass pro-duced the optimum probabilities found in Fig. 7a. For reference,this value is "6%8 times larger than the estimated populationof D < 1000 km bodies in the primordial (not the current) mainbelt population (Bottke et al., 2005a, 2005b).
Catastrophic disruption events within the PPP were trackedusing the 1-D collisional evolution code CoDDEM (Colli-sional and Dynamical Depletion Evolution Model) describedin Bottke et al. (2005b). This code accepts as input an ini-tial size-frequency distribution where the population has beenbinned between 0.001 km < D < 1000 km in logarithmic in-tervals d logD = 0.1. The particles in the bins are assumedto be spherical and are set to a bulk density of 2.7 g cm%3.CoDDEM computes how collisions, fragmentation, and dy-namical effects modify this size distribution over a selected
time interval. For additional details about CoDDEM, see Bot-tke et al. (2005a, 2005b). Note that the accuracy of CoD-DEM’s results has been checked by modeling the evolutionof the main belt population and matching numerous con-straints.
Two parameters used as input for CoDDEM include the in-trinsic collision probabilities (Pi ) and impact velocities (Vimp)of PPP bodies colliding with one another. We obtained thesevalues using the test runs described in Sections 3–4. At eachtimestep, we computed Pi and Vimp between all possible pairsof test bodies on crossing orbits (Bottke et al., 1994a). Thesebodies tend to have high velocities with respect to one another,a byproduct of their high inclinations. Overall, we found thatreasonable representative values for our runs over time werePi " 15 & 10%18 km%2 yr%1 and Vimp " 20 km s%1.
We assumed our initial PPP size-frequency distribution fol-lowed the same trends as those determined for the primordialmain belt from dynamical and collisional models (Bottke etal., 2005a, 2005b). The initial size distribution of the PPP forD " 100%1000 km planetesimals was set to "1200 times thecurrent main belt population (0.6M$) and was given a differ-ential power law index q " %4.5, the same as the observedmain belt over the same size range (see Bottke et al., 2005a,2005b). For D < 100 km, we assumed a shallow initial slope(q = %1.2). The shape of this population can be found in Fig. 9at t = 0 My. It is important to point out that the shape of thissize distribution is a favorable one for minimizing collisionalevolution. If we had extended the q = %4.5 slope to diameterssmaller than D < 100 km, the degree of comminution in thePPP would have been even more severe.
Our runs neglect collisional evolution among PPP planetes-imals prior to the Moon-forming impact (at t = 0 My). Webelieve this approximation has minimal impact on our results

Left over planetesimals and the Late Heavy Bombardment 217
Fig. 9. The collisional evolution and dynamical depletion of the post-planet for-mation population (PPP) in which the initial mass is 0.6M$ (see Section 4.3).The t = 0 My timestep shows the initial shape of the PPP size distribution,which was generated using results from Bottke et al. (2005a, 2005b). Thedashed vertical line corresponds to D > 64 km projectiles, the size neededto make the four largest Nectarian and early-Imbrium basins. The black dotshows what the depletion of D > 64 km projectiles would be when collisionalevolution is excluded. The bump observed in most frames near D " 2-4 kmis driven by asteroid disruption scaling law, which undergoes a transition atD " 0.2 km between the strength and gravity-scaling regimes. The intermedi-ate timesteps show how quickly comminution can reduce the initial populationin addition to the bodies lost from dynamical depletion. By the t = 421 and821 My timesteps, collisional evolution has reduced the number of D > 64 kmobjects in the PPP by nearly a factor of 20 below the expected depletion pro-duced by dynamics alone. Accordingly, only a few D > 64 km projectiles areleft in the PPP to produce the large Nectarian and early-Imbrium basins in thisinterval.
because we are mainly concerned with the size of the PPPbetween t = 421%821 My. Tests indicate that adding an ex-tra "30 My of comminution to the beginning of our CoD-DEM runs does not significantly affect the PPP after t >
421 My.The dynamical loss of PPP planetesimals from the inner So-
lar System was also included in CoDDEM. At every timestep,which was 50,000 years or less depending on the rate of col-lision events taking place within the code, we removed theappropriate fraction of the PPP across all size bins based on
the numerically-derived decay rates described in Section 4.1(see Fig. 3). To compare collision/no-collision test cases, thedepletion level of a D > 64 km population experiencing zerocollisions is plotted as a black dot in Fig. 9.
Fig. 9 shows several snapshots of the collisional evolutionof the PPP between t = 0 and 821 My. After 1 My, collisionsamong large asteroids have created numerous smaller frag-ments that increase the slope of the D < 100 km size distribu-tion. Catastrophic disruption events among the PPP also gener-ate a bump in the size distribution near D " 3%4 km. The bumpis a by-product of the “V”-shaped asteroid disruption func-tion that shifts from strength- to gravity-scaling regimes nearD = 0.2 km (e.g., Durda, 1993; Campo Bagatin et al., 1994;Durda et al., 1998; Davis et al., 2002; O’Brien and Greenberg,2003; Bottke et al., 2005a, 2005b). At smaller sizes, the PPPenters into a Dohnanyi-like collisional equilibrium (Dohnanyi,1969) with a differential power law index near %3.6 (e.g.,O’Brien and Greenberg, 2003).
At t = 10 and 50 My, we find that collisional and dynamicalevolution have significantly depleted the D > 64 km popula-tion, with the original PPP dropping to 0.07 and 0.01 of the ini-tial PPP, respectively. Only a portion of this is from dynamicalloss mechanisms; we find that the fraction of the PPP dynam-ically removed from the inner Solar System at these times is0.51 and 0.13. This means that collisional grinding is responsi-ble for most of the D > 64 km bodies removed from the PPP atthese times.
By t = 421 and 821 My, collisional and dynamical processeshave reduced the number of D > 64 km bodies in the PPPto 9.8 & 10%4 and 4.7 & 10%6 of the initial PPP, respectively.For reference, the fraction of the PPP left by dynamics aloneshould be 1.9 & 10%3 and 9.5 & 10%5, respectively. This meansthat 95% of the D > 64 km bodies were eliminated from thePPP via collisional evolution. Even without running our MonteCarlo code, it is clear that this drop in the available number ofbasin-forming projectiles should produce much lower successprobabilities than those found in Fig. 7a.
One could try to compensate for this difference by increas-ing the initial PPP by an additional factor of 20 at the startof the runs. Such an increase, however, would be unlikely tohelp us match constraints. First of all, it would make the ini-tial size of the PPP equivalent to "11 Earth masses, far inexcess of Solar Nebula constraints for the terrestrial planet re-gion (Weidenschilling, 1977). Second, a massive populationlike this one would most likely experience (i) an intense col-lisional phase, enough that the orbital excitation of the pop-ulation would be damped and (ii) strong mutual gravitationalinteractions between PPP bodies. We are unsure what wouldhappen in this hypothetical situation, but it is clear that theresulting system would not resemble our terrestrial planet sys-tem.
These results lead us to predict that this particular PPP is un-likely to have produced the Nectarian and early-Imbrium basins(basin sets A or B) during any of the time intervals described inTable 1.

218 W.F. Bottke et al. / Icarus 190 (2007) 203–223
4.4.2. Monte Carlo simulations of lunar basin formation usingcollisionally evolved post-planet formation populations
Returning to the Monte Carlo code described in Sec-tion 4.3.2, we now examine how collisions within the PPPaffect the role of lunar basin formation. Input for this code wasobtained by using CoDDEM to track the collisional evolutionand dynamical depletion of PPP size distributions with initialmasses 0.01%50M$ from t = 0 to 1200 My. We determinedthe initial size distributions for these PPPs by multiplying thesize distribution shown in the t = 0 My timestep from Fig. 9by an appropriate “mass” factor. Because catastrophic disrup-tion events are stochastic, these PPP size distributions were runthrough CoDDEM 20 times with different random seeds foreach run. The number of D > 64 km bodies tabulated at everyoutput timestep was then averaged across the runs and multi-plied by the normalized lunar impact rate distribution describedin Section 4.1 (Fig. 5). A representative sample of the PPP basinformation rate distributions obtained from this method is shownin Fig. 6b.
These results indicate that collisional evolution within thePPP has a dramatic effect on lunar basin formation. In Fig. 6b,we see that test runs with starting masses between 0.05 and50M$ undergo an intense phase of collisional evolution andrapid depletion within the first few My of their existence. Thesepopulations effectively self-destruct, leaving behind few D >
64 km planetesimals capable of creating the observed Nectar-ian and/or early-Imbrium basins. Moreover, we find that largestarting masses for the PPP produce an increased number ofcatastrophic disruption events, such that the 0.5%50M$ runsproduce comparable numbers of basins for the intervals listedin Table 1.
When these data are input into our Monte Carlo code, wefind the probability of reproducing the Nectarian and/or early-Imbrium basins drops precipitously from that found in Sec-tion 4.3.1. Figs. 7b and 8b show results for basin sets A and B,respectively. The highest probability for success over the testedbasin formation time intervals is only #0.1%, much smallerthan the results from the no-collision scenario (Figs. 7a and 8a).
Overall, we found that collisional evolution prevents PPPswith large starting masses from providing significant numbersof basin-forming projectiles to the Moon during the Nectarianand early-Imbrium periods. This explains why our Monte Carlosimulations cannot match constraints at the 3! confidence levelin basin sets A or B, regardless of our choice of starting PPPmass. More positively, these runs only produce on the orderof 10 Orientale-sized basins and a few South Pole-Aitken-likebasins in the pre-Nectarian period. These runs provide a bet-ter match to our reality check (constraint #4) than those fromSection 4.3.1.
In summary, the declining bombardment as modeled herecannot match the constraints from either basin set A or B. Webelieve these are sufficient grounds to reject it as a plausiblemodel for the LHB. This leaves the terminal cataclysm as thebest available paradigm for producing the late-forming lunarbasins. The only terminal cataclysm model capable of match-ing LHB constraints at present (as well as other Solar Systemconstraints) is the Nice model described in Section 2.1.
5. Conclusions and implications
In this paper, we used several different numerical simula-tions to examine whether the declining bombardment paradigmfor producing the LHB was consistent with constraints pro-vided by the largest lunar basins formed during the Nectarianand early-Imbrium periods (Nectaris, Serenitatis, Imbrium, andOrientale; basin set A) and during the early-Imbrium periodalone (Imbrium and Orientale; basin set B) (see Section 2.3and Table 1). Basin set B was explicitly used to ensure thatany controversies about the ages of Nectaris and Serenitatis didnot affect our results. Our methods allowed us to reexaminethe numerical modeling work and LHB constraints described inMorbidelli et al. (2001). We assumed the energy needed to pro-duce the Imbrium basin was assumed to be 1%3 & 1033 ergs,while the energy needed to make Orientale, Serenitatis, andNectaris was "1 & 1033 ergs (see Zahnle and Sleep, 1997).
Our model of the declining bombardment population (i.e.,PPP) was assumed to be comparable to high inclination aster-oids from the observed NEO population with a < 2 AU andi > 40'. It was tracked using numerical integration codes untilmost of its test bodies had been dynamically eliminated. Theremnants were then cloned and restarted. We followed mul-tiple generations of this population for at least 1 Gy and, insome cases, >4 Gy. At the same time, we computed their colli-sion probabilities and impact velocities with the Moon betweent = 0 My (defined here as the Moon-forming event) and theend of our simulations (Fig. 3). This yielded the informationneeded to compute the normalized lunar impact rate distribu-tion for the PPP (Fig. 5). The number of Orientale-sized andlarger basin-forming impacts on the Moon was found to dropoff precipitously over the first 100 My of the simulation beforetransitioning into a more steady decline between 100–1200 My.Using the lunar impact velocity results and the basin forma-tion energies described above, we estimated that D > 64 kmprojectiles would be needed to produce Imbrium, Orientale,Serenitatis, and Nectaris.
Using codes described in Bottke et al. (2005a, 2005b), wetracked how PPPs of varying starting mass were affected by col-lisional evolution and dynamical depletion between t = 0 and1200 My. Mutual gravitational effects and collisional damp-ing of orbital e, i’s within the PPP were ignored, though thesemechanisms are only likely to affect massive PPPs that are al-ready inconsistent with Solar Nebula constraints. Our results,when combined with our normalized lunar impact rate distrib-ution, were input into a Monte Carlo code in order to track thelikelihood that basin sets A and B were created over varioustime intervals. As an added constraint, we rejected solutions inwhich basins were formed after the end of the early-Imbriumperiod.
Our results indicate that the declining bombardment para-digm as modeled here is extremely unlikely to have formed theNectarian and early-Imbrium basins and can be ruled out at the99.7% (3! ) confidence level for all of the basin formation timeintervals described above (Figs. 6a and 6b). Our solutions areindependent of the starting mass of the PPP. These results leadus to conclude that the declining bombardment did not pro-

Left over planetesimals and the Late Heavy Bombardment 219
duce the Moon’s late-forming basins and thus cannot explainthe LHB. In contrast, the Nice terminal cataclysm model forthe LHB described in Section 2.1 appears to be viable from adynamical modeling perspective and is consistent with existingconstraints.
These results have several important implications for our un-derstanding of the chronology of events that occurred early inSolar System history. If the LHB did not come from the declin-ing bombardment, it implies that the lunar (and terrestrial) im-pact rate in the interim between the Moon-forming impact andthe LHB was lower than previously thought, at least in termsof basin-forming events. This may allow us to glean new in-sights into the measured shock degassing ages of lunar sam-ples between 4.5–3.9 Ga (e.g., Bogard, 1995; Grinspoon, 1989;Hartmann, 2003; Chapman et al., 2007).
If any pre-Nectarian basins were produced by the PPP, theymost likely formed relatively soon after the Moon-forming im-pact. This would provide the easiest explanation for the curiousabsence of secondary overgrowths on Hadean-era terrestrial zir-cons prior to "4.0 Ga (Trail et al., 2007; see Section 2.1).A paucity of lunar and terrestrial impactors between 3.9–4.4 Gawould also imply that pre-Nectarian basins like South Pole-Aitken either had to form earlier than the oldest terrestrialzircons (!4.4 Ga) or during the LHB epoch "3.9 Ga. Whileinsufficient information exists to further constrain the ages ofthe pre-Nectarian basins, we argue that the paucity of lunar im-pact melt clasts and crustal rocks older than 3.8–4.0 Ga is mostconsistent with a large number of pre-Nectarian basins formingduring the LHB (Ryder et al., 2000; Stöffler and Ryder, 2001;Cohen et al., 2000; Cohen, 2002; see also Kring and Cohen,2002). It also provides the easiest way to explain why multi-ple basin-forming events occurred on the Moon 3.75–3.95 Ga(Norman et al., 2006).
If the declining bombardment paradigm is indeed inopera-ble, it may have important implications for the estimated forma-tion times of basins on Mercury and Mars. For example, a com-monly used chronology for features on Mars assumes a steadilydeclining bombardment between 4.5–3.8 Ga was the source ofthe oldest basins and craters (e.g., Neukum and Ivanov, 1994;Hartmann and Neukum, 2001; Neukum et al., 2001a). If Marshad an impact history analogous to that of the Moon, how-ever, many of the oldest and largest martian craters may haveformed in a terminal cataclysm occurring during an abbrevi-ated period "3.9 Ga. It is likely that many of the buried basinsdiscovered in the Mars Observer Laser Altimeter (MOLA)data formed during this epoch as well (Frey et al., 2002;Buczkowski et al., 2005; Frey, 2006). The estimated age ofbasins and features on Mercury would be similarly affected(Strom and Neukum, 1988; Neukum et al., 2001b). This sce-nario also raises the possibility that most of the morphologyexisting on Mars or Mercury prior to "3.9 Ga was obliteratedby the LHB and thus is permanently hidden from our view. Iftrue, it is plausible that most of the early events still observ-able on the martian surface took place over a more compressedtimescale than previously thought. We believe a revised martianchronology based on the Nice terminal cataclysm model (Sec-
tion 2.1) might help us glean many new insights into ancientmartian history.1
Acknowledgments
We thank Don Bogard, Clark Chapman and Steve Mojz-sis for their helpful discussions and insights into many ofthe issues related to the Late Heavy Bombardment. We alsothank Alessandro Morbidelli and Kleomenis Tsiganis for theircareful, constructive, and useful reviews. Research funds forWilliam Bottke were provided by NASA’s Origins of SolarSystems Program (Grant NAG5-10658) and NASA’s PlanetaryGeology and Geophysics Program (Grant NAG513038).
Appendix A. Long lived niches for inner Solar Systemasteroids
The current configuration of planets in the inner Solar Sys-tem contains several regions of phase space where small bodiescan survive for timescales considerably longer than the typ-ical lifetimes of NEOs (e.g., see Hartmann et al., 2000, fora review). The most well-known ones are stable and containasteroids today: the main asteroid belt, the high inclinationHungaria and Phocaea asteroids at "1.7%1.9 AU and 2.3–2.5 AU, respectively; the Hilda and Thule asteroids in the 3:2and 4:3 mean motion resonances with Jupiter, respectively; andthe Mars- and Jupiter-Trojan asteroids. Others have only re-cently been discovered using numerical integration methodsand may or may not be stable over timescales approaching theage of the Solar System. For example, Evans and Tabachnik(1999, 2002) tracked the orbits of test bodies on nearly-circular,low-inclination orbits throughout the inner Solar System andfound that some objects placed between 0.09–0.21 and 1.08–1.28 AU can survive at least 100 My (see also Hartmann et al.,2000). The former region is the putative home of the vulcanoidasteroids (e.g., Leake et al., 1987; Stern and Durda, 2000;Vokrouhlick! et al., 2000). At present, we have yet to positivelyidentify an indigenous body in either region. A few candidateobjects have been spotted in the 1.08–1.28 AU region (Evansand Tabachnik, 1999, 2002), but these objects may also be tem-porarily trapped in minor resonances that intersect the region(e.g., Bottke et al., 2002). Extensive searches for Vulcanoid as-teroids are on-going (e.g., Durda et al., 2000).
Our results from Fig. 3 indicate there are at least two addi-tional long-lived niches reachable by small bodies in the innerSolar System. They have been in place as long as the planets
1 As follow-up to this idea, it is interesting to consider whether a terminalcataclysm brought large quantities of volatiles to Mars "3.9 Ga. Levison et al.(2001) predicted that comets striking Mars during the LHB delivered "6&1022
g of material. Because much of this material would consist of various ices, theseimpacts would have transported considerable water to Mars and would haveproduced a temporary CO2 atmosphere with surface pressures greater than 1bar (Stern and Levison, 1999). Individual impacts would have also distributedwarm ejecta around the planet, enough to heat surface ice and even inject steaminto the atmosphere (Segura et al., 2002). Collectively, these effects might haveinduced prolonged periods where rainfall was possible. Hence, Mars’ inferredearly wet environment may have been a direct byproduct of the LHB.

220 W.F. Bottke et al. / Icarus 190 (2007) 203–223
have had their current configuration. They were identified inour runs by their shallow decay curves that break away from theother test runs at "0.6 and 1.2 Gy. The 0.6 Gy tail, which is alsoseen in Fig. 2, is characterized by test bodies with orbital para-meters a = 2.13%2.16 AU, e = 0.16%0.30, and i = 17'%26'.Note that this region lies directly between the stable Hungariaand Phocaea asteroid regions. Fig. 10 shows the orbital evolu-tion of a single test body that wandered into this region. The testbody in question was a third generation clone that stayed at highinclinations with a < 2 AU for several hundreds of My. Eventu-ally, a planetary close encounter (most likely with Mars) movedit to an a > 2 AU orbit, where further Mars encounters and dy-namical resonances drove the body to the a, e, i parameters de-scribed above. In contrast, the 1.2 Gy tail is characterized by testbodies with orbital parameters a # 2.29 AU, e = 0.15%0.30,and i = 23'%30'. This sub-population was produced by a sixthgeneration test body that found a tiny resonance intersectingthe Phocaea asteroid region. A portion of its orbital traverse isshown in Fig. 11.
In hindsight, it is perhaps no surprise that the most long-lived test bodies in our simulations are those that reached orbitsnear the stable Hungaria and Phocaea asteroid regions. Theselong-lived niches are far from Venus, Earth, or Jupiter-crossingorbits. As seen in Fig. 4, however, the trade-off is that these PPPsurvivors are unlikely to re-emerge from this region to strike theMoon.
A search for asteroids in our two refugia yields the follow-ing information. There are 10 bodies with absolute magnitude15 < H < 19 that have orbital parameters consistent with the0.6 Gy long-lived tail (a = 2.13%2.16 AU, e = 0.16–0.30,and i = 17'%26') and 15 bodies with 14 < H < 16 that haveorbital parameters consistent with the 1.2 Gy long-lived tail(a # 2.29 AU, e = 0.15%0.30, and i = 23'%30'). The spectro-scopic signature of these bodies may eventually help us identifywhere they came from and the dynamical mechanisms that putthem there.
At present, we cannot say whether these two long-livedniches and the regions that surround them, let alone any otherunidentified regions like them with a > 2 AU, were heavilypopulated early in Solar System history. This means we cannotcompletely rule out the possibility that the declining bombard-ment was produced by bodies that leaked out from refugia at theappropriate times to produce the Nectarian and early-Imbriumbasins. With that said, the refugia populations would need size-frequency distributions and decay timescales that (i) producebasin sets A and B at the right times, (ii) avoid making lunarbasins between 0–3.7 Ga, and (iii) avoid leaving behind a reser-voir of small objects readily detected by small body surveys.Though we have yet to numerically model all of the possibili-ties, insights gleaned from this paper’s results make us skepticalthat any population residing in refugia could match these con-straints.
As an example, consider the objects identified in our twolong-lived niches. As stated above, there are 10 objects with ab-solute magnitude 15 < H < 19 in the 0.6 Gy long-lived tail and15 bodies with 14 < H < 16 in the 1.2 Gy long-lived tail. Forreference, an H = 15 NEO with a 14% albedo has a diameter of
Fig. 10. A small portion of the dynamical evolution of a test body finding thelong-lived niche described in Fig. 2. The black dots show the known aster-oids of the inner Solar System with absolute magnitude H < 15. For reference,mean motion resonances with Jupiter (J3:1, J4:1, J5:1) and secular resonances("5,"6) are shown as dotted lines. Planetary close encounters caused the bodyto move from an a < 2 AU orbit to an a > 2 AU orbit. The test body spendsmost of its time in a region between the stable Hungaria and Phocaea aster-oid regions with orbital parameters a = 2.13–2.16 AU, e = 0.16–0.30, andi = 17'–26' .
Fig. 11. A small portion of the dynamical evolution of a test body finding thesecond long-lived niche described in Fig. 3 (i.e., where the curve breaks awayfrom the others at 1.2 Gy). The black dots show the known asteroids of the innerSolar System with H < 15. The star shows the starting orbit of this test bodyat the beginning of the sixth generation, while the square shows its orbit at theend of the sixth generation. Like the particle shown in Fig. 10, planetary closeencounters caused the body to move from an a < 2 AU orbit to an a > 2 AUorbit. The body then settles in near the square and stays there for its remainingtime. We characterize this region as having orbital parameters a # 2.29 AU,e = 0.15–0.30, and i = 23'–30' . This region also includes a resonance thatintersects the Phocaea asteroid region.
3.5 km. Using the decay rates in Fig. 3, the 0.6 Gy tail has lost0.06% of its population per My for the last several Gy, while the1.2 Gy tail has lost 0.03% of its population per My for the lastseveral Gy. Extrapolating these values back to 3.8 Ga, we findtheir initial populations were only 10–20 times as large as they

Left over planetesimals and the Late Heavy Bombardment 221
are today. This translates into each niche having the order of 100D > 3.5 km bodies at the time the early-Imbrium basins wereproduced. These values are far too small to expect the refugia-populations to produce the large numbers of D > 64 km objectsneeded to create basin sets A and B, particularly when one fac-tors in the modest lunar collision probabilities shown in Fig. 4.
References
Agnor, C.B., Canup, R.M., Levison, H.F., 1999. On the character and conse-quences of large impacts in the late stage of terrestrial planet formation.Icarus 142, 219–237.
Agnor, C.B., Ward, W.R., 2002. Damping of terrestrial-planet eccentricities bydensity–wave interactions with a remnant gas disk. Astrophys. J. 567, 579–586.
Baldwin, R.B., 2006. Was there ever a terminal lunar cataclysm? Icarus 184,308–318.
Baldwin, R.B., 1987a. On the relative and absolute ages of seven lunar frontface basins. I. From viscosity arguments. Icarus 71, 1–18.
Baldwin, R.B., 1987b. On the relative and absolute ages of seven lunar frontface basins. II. From crater counts. Icarus 71, 19–29.
Bernstein, G.M., Trilling, D.E., Allen, R.L., Brown, M.E., Holman, M., Malho-tra, R., 2004. The size distribution of trans-neptunian bodies. Astron. J. 128,1364–1390.
Bogard, D., 1995. Impact ages of meteorites: A synthesis. Meteoritics 30, 244–268.
Bottke, W.F., Greenberg, R., 1993. Asteroidal collision probabilities. Geophys.Res. Lett. 20, 879–881.
Bottke, W.F., Nolan, M.C., Greenberg, R., Kolvoord, R.A., 1994a. Velocity dis-tributions among colliding asteroids. Icarus 107, 255–268.
Bottke, W.F., Nolan, M.C., Greenberg, R., Kolvoord, R.A., 1994b. Collisionallifetimes and impact statistics of near-Earth asteroids. In: Gehrels, T.,Matthews, M.S. (Eds.), Hazards Due to Comets and Asteroids. Univ. ofArizona Press, Tucson, pp. 337–357.
Bottke, W.F., Jedicke, R., Morbidelli, A., Petit, J.-M., Gladman, B., 2000.Understanding the distribution of near-Earth asteroids. Science 288, 2190–2194.
Bottke, W.F., Morbidelli, A., Jedicke, R., Petit, J., Levison, H.F., Michel, P.,Metcalfe, T.S., 2002. Debiased orbital and absolute magnitude distributionof the near-Earth objects. Icarus 156, 399–433.
Bottke, W.F., Durda, D., Nesvorny, D., Jedicke, R., Morbidelli, A., Vokrouh-licky, D., Levison, H., 2005a. The fossilized size distribution of the mainasteroid belt. Icarus 175, 111–140.
Bottke, W.F., Morbidelli, A., Jedicke, R., Petit, J., Levison, H.F., Michel, P.,Metcalfe, T.S., 2005b. Linking the collisional history of the main asteroidbelt to its dynamical excitation and depletion. Icarus 179, 63–94.
Bottke, W.F., Nesvorn!, D., Grimm, R.E., Morbidelli, A., O’Brien, D.P., 2006a.Iron meteorites as remnants of planetesimals formed in the terrestrial planetregion. Nature 439, 821–824.
Bottke, W.F., Vokrouhlicky, D., Rubincam, D.P., Nesvorny, D., 2006b. TheYarkovsky and YORP effects: Implications for asteroid dynamics. Annu.Rev. Earth Planet. Sci. 34, 157–191.
Britt, D.T., Yeomans, D., Housen, K., Consolmagno, G., 2002. Asteroid density,porosity, and structure. In: Bottke, W.F., Cellino, A., Paolicchi, P., Binzel,R.P. (Eds.), Asteroids III. Univ. of Arizona Press, Tucson, pp. 485–500.
Buczkowski, D.L., Frey, H.V., Roark, J.H., McGill, G.E., 2005. Buried impactcraters: A topographic analysis of quasi-circular depressions, Utopia Basin,Mars. J. Geophys. Res. 110. 3007.
Canup, R.M., 2004. Dynamics of lunar formation. Annu. Rev. Astron. Astro-phys. 42, 441–475.
Campo Bagatin, A., Cellino, A., Davis, D.R., Farinella, P., Paolicchi, P., 1994.Wavy size distributions for collisional systems with a small-size cutoff.Planet. Space Sci. 42, 1079–1092.
Chambers, J., 2006. A semi-analytic model for oligarchic growth. Icarus 180,496–513.
Chambers, J.E., 2001. Making more terrestrial planets. Icarus 152, 205–224.
Chambers, J.E., Cassen, P., 2002. The effects of nebula surface density pro-file and giant-planet eccentricities on planetary accretion in the inner SolarSystem. Meteor. Planet. Sci. 37, 1523–1540.
Chambers, J.E., Lissauer, J.J., 2002. A new dynamical model for the lunar LateHeavy Bombardment. Lunar Planet. Sci. 33. Abstract 1093.
Chambers, J.E., Wetherill, G.W., 1998. Making the terrestrial planets: N-bodyintegrations of planetary embryos in three dimensions. Icarus 136, 304–327.
Chambers, J.E., Wetherill, G.W., 2001. Planets in the asteroid belt. Meteor.Planet. Sci. 36, 381–399.
Chapman, C.R., Cohen, B.A., Grinspoon, D.H., 2007. What are the real con-straints on the existence and magnitude of the late heavy bombardment?Icarus, in press.
Cohen, B.A., 2002. Geochemical and geochronological constraints on early lu-nar bombardment history. Lunar Planet. Sci. 33. Abstract 1984.
Cohen, B.A., Swindle, T.D., Kring, D.A., 2000. Support for the lunar cataclysmhypothesis from lunar meteorite impact melt ages. Science 290, 1754–1756.
Cook, A.C., Watters, T.R., Robinson, M.S., Spudis, P.D., Bussey, D.B.J., 2000.Lunar polar topography derived from Clementine stereoimages. J. Geophys.Res. 105, 12023–12034.
Dalrymple, G.B., Ryder, G., 1993. 40Ar–39Ar age spectra of Apollo 15 impactmelt rocks by laser step-heating and their bearing on the history of lunarbasin formation. J. Geophys. Res. 98, 13085–13095.
Davis, D.R., Durda, D.D., Marzari, F., Campo Bagatin, A., Gil-Hutton, R.,2002. Collisional evolution of small body populations. In: Bottke, W.F.,Cellino, A., Paolicchi, P., Binzel, R.P. (Eds.), Asteroids III. Univ. of Ari-zona Press, Tucson, pp. 545–558.
Dohnanyi, J.W., 1969. Collisional models of asteroids and their debris. J. Geo-phys. Res. 74, 2531–2554.
Durda, D.D., 1993. The collisional evolution of the asteroid belt and its contri-bution to the zodiacal cloud. Ph.D. thesis, Univ. of Florida.
Durda, D.D., Greenberg, R., Jedicke, R., 1998. Collisional models and scal-ing laws: A new interpretation of the shape of the main-belt asteroid sizedistribution. Icarus 135, 431–440.
Durda, D.D., Stern, S.A., Colwell, W.B., Parker, J.W., Levison, H.F., Hassler,D.M., 2000. A new observational search for vulcanoids in SOHO/LASCOcoronagraph images. Icarus 148, 312–315.
Evans, N.W., Tabachnik, S., 1999. Possible long-lived asteroid belts in the innerSolar System. Nature 399, 41.
Evans, N.W., Tabachnik, S.A., 2002. Structure of possible long-lived asteroidbelts. Mon. Not. R. Astron. Soc. 333, L1–L5.
Farinella, P., Davis, D.R., 1992. Collision rates and impact velocities in themain asteroid belt. Icarus 97, 111–123.
Frey, H.V., 2006. Impact constraints on the age and origin of the lowlands ofMars. Geophys. Res. Lett. 33. L08S02.
Frey, H.V., Roark, J.H., Shockey, K.M., Frey, E.L., Sakimoto, S.E.H., 2002.Ancient lowlands on Mars. Geophys. Res. Lett. 29. 1384.
Greenberg, R., 1982. Orbital interactions–A new geometrical formalism. As-tron. J. 87, 184–195.
Greenberg, R., Hartmann, W.K., Chapman, C.R., Wacker, J.F., 1978. Planetes-imals to planets—Numerical simulation of collisional evolution. Icarus 35,1–26.
Gladman, B.J., Migliorini, F., Morbidelli, A., Zappalà, V., Michel, P., Cellino,A., Froeschlé, C., Levison, H.F., Bailey, M., Duncan, M., 1997. Dynamicallifetimes of objects injected into asteroid belt resonances. Science 277, 197–201.
Gnos, E., Hofmann, B.A., Al-Kathiri, A., Lorenzetti, S., Eugster, O., White-house, M.J., Villa, I.M., Jull, A.J., Eikenberg, J., Spettel, B., Krähenbühl,U., Franchi, I.A., Greenwood, R.C., 2004. Pinpointing the source of a lu-nar meteorite: Implications for the Evolution of the Moon. Science 305,657–659.
Grieve, R.A.F., Shoemaker, E.M., 1994. The record of past impacts on Earth.In: Gehrels, T., Matthews, M.S. (Eds.), Hazards Due to Comets and Aster-oids. Univ. of Arizona Press, Tucson, pp. 417–462.
Grinspoon, D.H., 1989. Large impact events and atmospheric evolution on theterrestrial planets. Ph.D. thesis.
Goldreich, P., Ward, W.R., 1973. The formation of planetesimals. Astrophys.J. 183, 1051–1062.

222 W.F. Bottke et al. / Icarus 190 (2007) 203–223
Gomes, R., Levison, H.F., Tsiganis, K., Morbidelli, A., 2005. Origin of thecataclysmic Late Heavy Bombardment period of the terrestrial planets. Na-ture 435, 466–469.
Halliday, A.N., 2000. Terrestrial accretion rates and the origin of the Moon.Earth Planet. Sci. Lett. 176, 17–30.
Hartmann, W.K., 1975. Lunar ‘cataclysm’—A misconception. Icarus 24, 181–187.
Hartmann, W.K., 1980. Dropping stones in magma oceans—Effects of earlylunar cratering. In: Papike, J., Merrill, R. (Eds.), Conference on the Lu-nar Highlands Crust, Houston, Texas, November 14–16, 1979, Proceedings.Pergamon, New York, pp. 155–171.
Hartmann, W.K., 2003. Megaregolith evolution and cratering cataclysmmodels–Lunar cataclysm as a misconception (28 years later). Meteor.Planet. Sci. 38, 579–593.
Hartmann, W.K., Neukum, G., 2001. Cratering chronology and the evolution ofMars. Space Sci. Rev. 96, 165–194.
Hartmann, W.K., Strom, R.G., Grieve, R.A.F., Weidenschilling, S.J., Diaz, J.,Blasius, K.R., Chapman, C.R., Woronow, A., Shoemaker, E.M., Dence,M.R., Jones, K.L., 1981. Chronology of planetary volcanism by compara-tive studies of planetary cratering. In: Basaltic Volcanism on the TerrestrialPlanets, Basaltic Volcanism Study Project. Pergamon, New York, pp. 1048–1127. Full text at http://adsbit.harvard.edu/books/bvtp/.
Hartmann, W.K., Ryder, G., Dones, L., Grinspoon, D., 2000. The time-dependent intense bombardment of the primordial Earth/Moon system. In:Canup, R., Righter, K. (Eds.), Origin of the Earth and the Moon. Univ. ofArizona Press, Tucson, pp. 805–826.
Hartung, J.B., 1974. Can random impacts cause the observed AR 39/40 agedistribution for lunar highland rocks? Meteoritics 9, 349.
Haskin, L.A., Korotev, R.L., Rockow, K.M., Jolliff, B.L., 1998. The case for anImbrium origin of the Apollo Th-rich impact-melt breccias. Meteor. Planet.Sci. 33, 959–975.
Kenyon, S.J., Bromley, B.C., 2006. Terrestrial planet formation. I. The transi-tion from oligarchic growth to chaotic growth. Astron. J. 131, 1837–1850.
Kleine, T., Münker, C., Mezger, K., Palme, H., 2002. Rapid accretion and earlycore formation on asteroids and the terrestrial planets from Hf-W chronom-etry. Nature 418, 952–955.
Korotev, R.L., Gillis, J.J., Haskin, L.A., Jolliff, B.L., 2002. On the Age of theNectaris Basin. In: Lawrence, D.J., Duke, M.B. (Eds.), The Moon Beyond2002: Next Steps in Lunar Science and Exploration, vol. 3029. The Lunarand Planetary Institute, Houston.
Kokubo, E., Ida, S., 2002. Formation of protoplanet systems and diversity ofplanetary systems. Astrophys. J. 581, 666–680.
Kokubo, E., Kominami, J., Ida, S., 2006. Formation of terrestrial planets fromprotoplanets. I. Statistics of basic dynamical properties. Astrophys. J. 642,1131–1139.
Kominami, J., Ida, S., 2004. Formation of terrestrial planets in a dissipating gasdisk with Jupiter and Saturn. Icarus 167, 231–243.
Kominami, J., Tanaka, H., Ida, S., 2005. Orbital evolution and accretion of pro-toplanets tidally interacting with a gas disk. Icarus 178, 540–552.
Kring, D.A., Cohen, B.A., 2002. Cataclysmic bombardment throughout the in-ner Solar System 3.9–4.0 Ga. J. Geophys. Res. 107. 4-1 to 4-6.
Leake, M.A., Chapman, C.R., Weidenschilling, S.J., Davis, D.R., Green-berg, R., 1987. The chronology of Mercury’s geological and geophysicalevolution—The vulcanoid hypothesis. Icarus 71, 350–375.
Lee, D.-C., Halliday, A.N., Snyder, G.A., Taylor, L.A., 1997. Age and originof the Moon. Science 278, 1098.
Levison, H.F., Agnor, C., 2003. The role of giant planets in terrestrial planetformation. Astron. J. 125, 2692–2713.
Levison, H.F., Duncan, M.J., 1994. The long-term dynamical behavior of short-period comets. Icarus 108, 18–36.
Levison, H.F., Dones, L., Chapman, C.R., Stern, S.A., Duncan, M.J., Zahnle,K., 2001. Could the lunar “Late Heavy Bombardment” have been triggeredby the formation of Uranus and Neptune? Icarus 151, 286–306.
Levison, H.F., Thommes, E., Duncan, M.J., Dones, L., 2004. A fairy tale aboutthe formation of Uranus and Neptune and the lunar Late Heavy Bombard-ment. In: Debris Disks and the Formation of Planets. In: ASP Conf. Ser.,vol. 324, p. 152.
Levison, H., Nesvorny, D., Agnor, C., Morbidelli, A., 2005. The role of dy-namical friction in terrestrial planet formation. Bull. Am. Astron. Soc. 37.Abstracts 25.01.
Marzari, F., Scholl, H., Murray, C., Lagerkvist, C., 2002. Origin and evolutionof trojan asteroids. In: Bottke, W.F., Cellino, A., Paolicchi, P., Binzel, R.P.(Eds.), Asteroids III. Univ. of Arizona Press, Tucson, pp. 725–738.
McEwen, A.S., Moore, J.M., Shoemaker, E.M., 1997. The Phanerozoic impactcratering rate: Evidence from the farside of the Moon. J. Geophys. Res. 102,9231–9242.
McEwen, A.S., Gaddis, L.R., Neukum, G., Hoffmann, H., Pieters, C.M., Head,J.W., 1993. Galileo observations of post-imbrium lunar craters during thefirst Earth–Moon flyby. J. Geophys. Res. 98, 17207–17234.
McNeil, D., Duncan, M., Levison, H.F., 2005. Effects of type I migration onterrestrial planet formation. Astron. J. 130, 2884–2899.
Michel, P., Migliorini, F., Morbidelli, A., Zappalà, V., 2000. The populationof Mars-crossers: Classification and dynamical evolution. Icarus 145, 332–347.
Michel, P., 1998. Dynamical behavior of near-Earth asteroids in the terrestrialplanet region: The role of secular resonances. Planet. Space Sci. 46, 905–910.
Migliorini, F., Michel, P., Morbidelli, A., Nesvorn!, D., Zappalà, V., 1998.Origin of Earth crossing asteroids: A quantitative simulation. Science 281,2022–2024.
Morbidelli, A., Petit, J.-M., Gladman, B., Chambers, J., 2001. A plausible causeof the late heavy bombardment. Meteor. Planet. Sci. 36, 371–380.
Morbidelli, A., Levison, H.F., Tsiganis, K., Gomes, R., 2005. Chaotic captureof Jupiter’s Trojan asteroids in the early Solar System. Nature 435, 462–465.
Neukum, G., 1977. Different ages of lunar light plains. Moon 17, 383–393.Neukum, G., Ivanov, B.A., 1994. Crater size distributions and impact probabil-
ities on Earth from lunar, terrestrial-planet, and asteroid cratering data. In:Gehrels, T., Matthews, M.S. (Eds.), Hazards Due to Comets and Asteroids.Univ. of Arizona Press, Tucson, pp. 359–416.
Neukum, G., Ivanov, B.A., Hartmann, W.K., 2001a. Cratering records in theinner Solar System in relation to the lunar reference system. Space Sci.Rev. 96, 55–86.
Neukum, G., Oberst, J., Hoffmann, H., Wagner, R., Ivanov, B.A., 2001b. Ge-ologic evolution and cratering history of Mercury. Planet. Space Sci. 49,1507–1521.
Norman, M.D., Taylor, L.A., 2005. Testing the lunar cataclysm: Identificationof lunar impact melts possibly older than Nectaris. Lunar Planet. Sci. 36.Abstract 1570.
Norman, M.D., Duncan, R.A., Huard, J.J., 2006. Identifying impact eventswithin the lunar cataclysm from 40Ar–39Ar ages and compositions ofApollo 16 impact melt rocks. Geochim. Cosmochim. Acta 70, 6032–6049.
Norman, M.D., Borg, L.E., Nyquist, L.E., Bogard, D.D., 2003. Chronology,geochemistry, and petrology of a ferroan noritic anorthosite clast fromDescartes breccia 67215: Clues to the age, origin, structure, and impacthistory of the lunar crust. Meteor. Planet. Sci. 38, 645–661.
O’Brien, D.P., Greenberg, R., 2003. Steady-state size distributions for col-lisional populations: Analytical solution with size-dependent strength.Icarus 164, 334–345.
O’Brien, D.P., Morbidelli, A., Bottke, W.F., 2005. Collisional evolution of theprimordial trans-neptunian disk: Implications for planetary migration andthe current size distribution of TNOs. Bull. Am. Astron. Soc. 37, 676.
O’Brien, D.P., Morbidelli, A., Levison, H.F., 2006. Terrestrial planet formationwith strong dynamical friction. Icarus 184, 39–58.
Opik, E.J., 1951. Collision probability with the planets and the distribution ofplanetary matter. Proc. R. Irish Acad. 54, 165–199.
Petit, J., Morbidelli, A., Chambers, J., 2001. The primordial excitation andclearing of the asteroid belt. Icarus 153, 338–347.
Raymond, S.N., Quinn, T., Lunine, J.I., 2006. High-resolution simulations ofthe final assembly of Earth-like planets. I. Terrestrial accretion and dynam-ics. Icarus 183, 265–282.
Raymond, S.N., Quinn, T., Lunine, J.I., 2004. Making other Earths: Dynamicalsimulations of terrestrial planet formation and water delivery. Icarus 168,1–17.
Ryder, G., Koeberl, C., Mojzsis, S.J., 2000. Heavy bombardment on the Earth at3.85 Ga: The search for petrographic and geochemical evidence. In: Canup,

Left over planetesimals and the Late Heavy Bombardment 223
R.M., Righter, K. (Eds.), Origin of the Earth and Moon. Univ. of ArizonaPress, Tucson, pp. 475–492.
Segura, T.L., Toon, O.B., Colaprete, A., Zahnle, K., 2002. Environmental ef-fects of large impacts on Mars. Science 298, 1977–1980.
Shukolyukov, A., Lugmair, G.W., 2002. Chronology of asteroid accretion anddifferentiation. In: Bottke, W.F., Cellino, A., Paolicchi, P., Binzel, R.P.(Eds.), Asteroids III. University of Arizona Press, Tucson, pp. 687–695.
Shoemaker, E.M., Shoemaker, C.S., 1996. The Proterozoic impact record inAustralia. AGSO J. Aust. Geol. Geophys. 16, 379–398.
Shoemaker, E.M., 1998. Long term variations in the impact cratering rate onEarth. In: Grady, M., Hutchison, R., McCall, G.J.H., Rothery, D.A. (Eds.),Meteorites: Flux with Time and Impact Effects. In: Special Publications,vol. 140. Geological Society, London, pp. 7–10.
Smith, D.E., Zuber, M.T., Neumann, G.A., Lemoine, F.G., 1997. Topographyof the Moon from the Clementine lidar. J. Geophys. Res. 102, 1591–1611.
Stern, S.A., Durda, D.D., 2000. Collisional evolution in the vulcanoid region:Implications for present-day population constraints. Icarus 143, 360–370.
Stern, S.A., Levison, H.F., 1999. A warm early Mars and CO2 influx from theLate Heavy Bombardment. Lunar Planet. Sci. 30. Abstracts 1141.
Stöffler, D., Ryder, G., 2001. Stratigraphy and isotope ages of lunar geo-logic units: Chronological standard for the inner Solar System. Space Sci.Rev. 96, 9–54.
Strom, R.G., Neukum, G., 1988. The cratering record on Mercury and the originof impacting objects. In: Vilas, F., Chapman, C.R., Matthews, M.S. (Eds.),Mercury. Univ. of Arizona Press, Tucson, pp. 336–373.
Strom, R.G., Croft, S.K., Barlow, N.G., 1992. The martian impact crateringrecord. In: Kieffer, H.H., Jakosky, B.M., Snyder, C.W., Matthews, M.S.(Eds.), Mars. Univ. of Arizona Press, Tucson, pp. 383–423.
Strom, R.G., Malhotra, R., Ito, T., Yoshida, F., Kring, D.A., 2005. The origin ofplanetary impactors in the inner Solar System. Science 309, 1847–1850.
Tagle, R., 2005. LL-ordinary chondrite impact on the Moon: Results from the3.9 Ga impact melt at the landing site of Apollo 17. Lunar Planet. Sci. 36.2008.
Tanga, P., Weidenschilling, S.J., Michel, P., Richardson, D.C., 2004. Gravita-tional instability and clustering in a disk of planetesimals. Astron. Astro-phys. 427, 1105–1115.
Taylor, G.J., 1998. The biggest hole in the Solar System. Planetary ScienceResearch Discoveries. http://www.psrd.hawaii.edu/July98/spa.html. Postedon July 17, 1998.
Tera, F., Papanastassiou, D.A., Wasserburg, G.J., 1974. Isotopic evidence for aterminal lunar cataclysm. Earth Planet. Sci. Lett. 22, 1–21.
Touma, J., Wisdom, J., 1994. Evolution of the Earth–Moon system. Astron.J. 108, 1943–1961.
Trail, D., Mojzsis, S.J., Harrison, T.M., Levison, H.F., 2007. Do Hadean zir-cons retain a record of the Late Heavy Bombardment on Earth? Geochim.Cosmochimi. Acta, in press.
Tsiganis, K., Gomes, R., Morbidelli, A., Levison, H.F., 2005. Origin of theorbital architecture of the giant planets of the Solar System. Nature 435,459–461.
Vokrouhlick!, D., Farinella, P., Bottke, W.F., 2000. The depletion of the putativevulcanoid population via the Yarkovsky effect. Icarus 148, 147–152.
Ward, W.R., Canup, R.M., 2000. Origin of the Moon’s orbital inclination fromresonant disk interactions. Nature 403, 741–743.
Warren, P.H., 2003. Lunar prospector data imply an age of 4.1 Ga for the Nec-taris Basin, and other problems with the lunar “Cataclysm” hypothesis. In:Large Meteorite Impacts Conference, p. 4129.
Warren, P.H., 2004. The Moon. In: Holland, H.D., Turekian, K.K. (Eds.), Trea-tise on Geochemistry. Elsevier, Amsterdam, pp. 559–599.
Weidenschilling, S.J., 1977. The distribution of mass in the planetary systemand solar nebula. Astrophys. Space Sci. 51, 153–158.
Weidenschilling, S.J., 2003. Radial drift of particles in the solar nebula: Impli-cations for planetesimal formation. Icarus 165, 438–442.
Weidenschilling, S.J., Spaute, D., Davis, D.R., Marzari, F., Ohtsuki, K., 1997.Accretional evolution of a planetesimal swarm. Icarus 128, 429–455.
Wetherill, G.W., 1967. Collisions in the asteroid belt. J. Geophys. Res. 72,2429–2444.
Wetherill, G.W., 1975. Late heavy bombardment of the moon and terrestrialplanets. Proc. Lunar Sci. Conf. 6, 1539–1561.
Wetherill, G.W., 1977. Evolution of the Earth’s planetesimal swarm subsequentto the formation of the Earth and Moon. Proc. Lunar Sci. Conf. 8, 1–16.
Wetherill, G.W., 1992. An alternative model for the formation of the asteroids.Icarus 100, 307–325.
Wetherill, G.W., Stewart, G.R., 1989. Accumulation of a swarm of small plan-etesimals. Icarus 77, 330–357.
Wilhelms, D.E., 1987. The Geologic History of the Moon. US Geol. Surv. Prof.Pap. 1348, 302 pp. (full text at http://ser.sese.asu.edu/GHM/).
Wisdom, J., Holman, M., 1991. Symplectic maps for the N-body problem. As-tron. J. 102, 1528–1538.
Wood, C., 2004. Impact basin database. http://www.lpod.org/cwm/DataStuff/Lunar%20Basins.htm.
Youdin, A.N., Goodman, J., 2005. Streaming instabilities in protoplanetarydisks. Astrophys. J. 620, 459–469.
Youdin, A.N., Chiang, E.I., 2004. Particle pileups and planetesimal formation.Astrophys. J. 601, 1109–1119.
Zahnle, K.J., Sleep, N.H., 1997. Impacts and the early evolution of life. In:Thomas, P.J., Chyba, C.F., McKay, C.P. (Eds.), Comets and the Origin andEvolution of Life. Springer-Verlag, New York, pp. 175–208.