Measuring Physical Activity in Outdoor-Gyms in Public Parks - ortal keren
Can Parks Inhibit Outdoor Water Use?
Eve Halper, PhD. Water Resources Research Center, University of Arizona
October 27, 2011

Thanks to … • Dr. Rosalind Bark, co-investigator
• Initial Funding: UA TRIF Program, Julia Fonseca, Pima County Flood Control District
• Faculty Advisors: Dr. Chris Scott and Dr. Stephen Yool
• Data Provider: Tom Arnold, Tucson Water
• GIS Data: Pima County
• Bureau of Reclamation, especially Lynne Fisher, Eric Holler and Bob Michaels
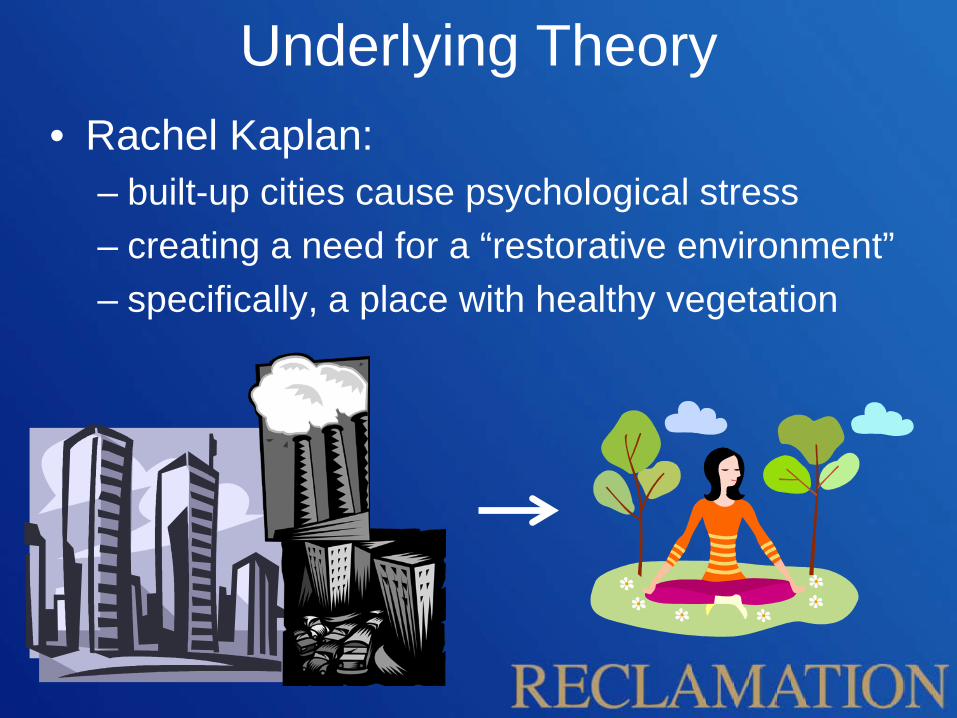
Underlying Theory • Rachel Kaplan:
– built-up cities cause psychological stress – creating a need for a “restorative environment” – specifically, a place with healthy vegetation

How can we measure the benefits of green space?
• Better physical health (Cohen, et al., 2007; Maller et al, 2006)
• Better psychological health (Mowen, et al., 2007)
• Faster healing (Ulrich, 1984)
as well as
• Higher property values (Anderson and West, 2006; Lutzenhiser and Netusil, 2001; Morancho, 2003 )
“Green” environments are associated with:
Applications to Arid Cities
• Green vegetation is scarce, found at – Higher altitudes – Some riparian areas – Irrigated areas
• Landscape irrigation consumes scarce water resources (no potential for reuse)
• Target for conservation programs

Application to Tucson
• 45% of water served to single-family residences (SFR) is used outdoors
• Estimated 2007 Tucson Water SFR outdoor use: 31,000 acre-ft
• Potential for future scarcity
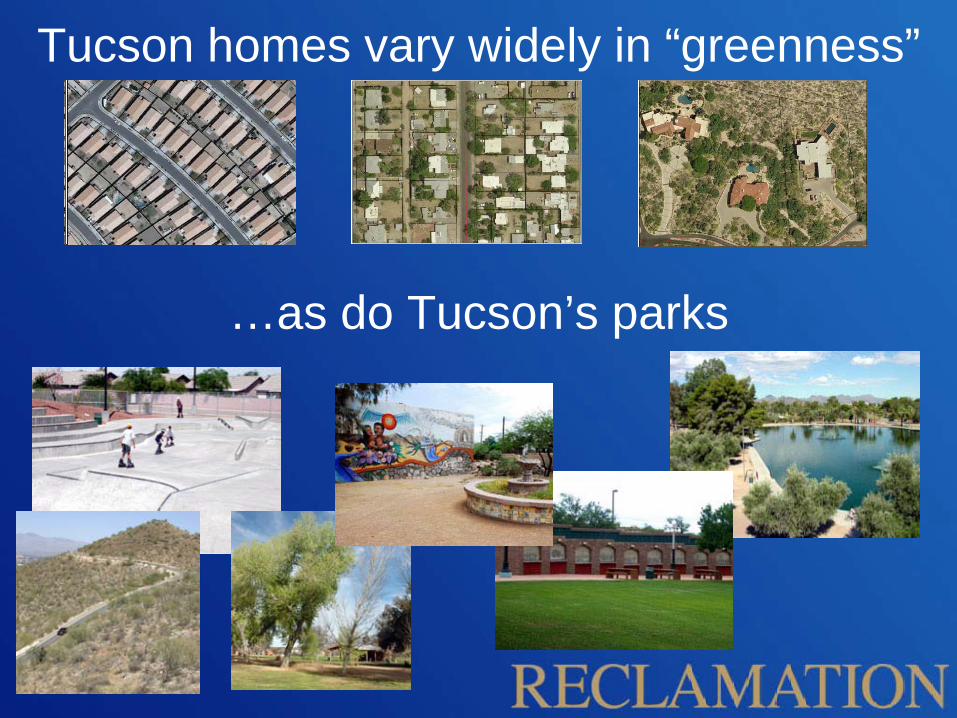
Tucson homes vary widely in “greenness”
…as do Tucson’s parks

How to measure “greenness”? • “Normalized Difference” Vegetation Index (NDVI) derived
from red and infrared bands, ranges from 0 to 1 • I meter resolution aerial photography, acquired 6/25/2007
Source: Natural Resources Canada
Courtesy of Philip Ronan and Wikipedia
Source: NASA
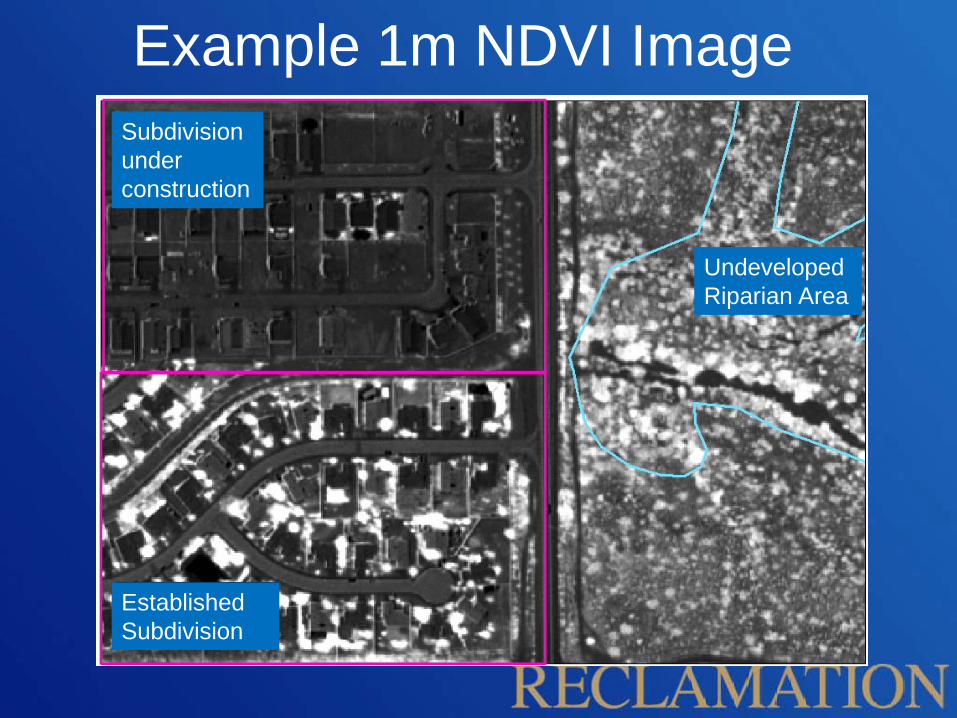
Example 1m NDVI Image Subdivision under construction
Established Subdivision
Undeveloped Riparian Area

Use of Dry Season Image to Isolate Irrigated Areas
0
0.2
0.4
0.6
0.8
1
1.2
1.4
Jan-07 Feb-07 Mar-07 Apr-07 May-07 Jun-07
Tota
l Mon
thly
Prec
ip (
inch
es)
Date
1971 - 2000 Average Total Precipitation (inches) 2007 Total Monthly Precipitation (inches)
Swimming Pools
• Another “quality-of-life” feature
• In especially high demand in hot, arid climates
• Consumes potable water resources

How to meet the need for green space / swimming pools?
Provided individually Provided as a shared resource
• "Everything is related to everything else, but near things are more related than distant things.“ (Tobler, 1970)
• If the presence of a park influence home water use behavior, homes close to a park should be subject to a greater influence than those further away.
The first law of geography

• Do homes close to a “green” park use less water outdoors than those further away?
• What park characteristics affect residential outdoor water use?
• Do homes with private pools behave differently?
• Are public parks and pools net water savers?
Research Questions

Factors known to influence household outdoor water use
House Size and Age
Lot Size Home Pool
Type of Cooling
Outdoor Irrigation
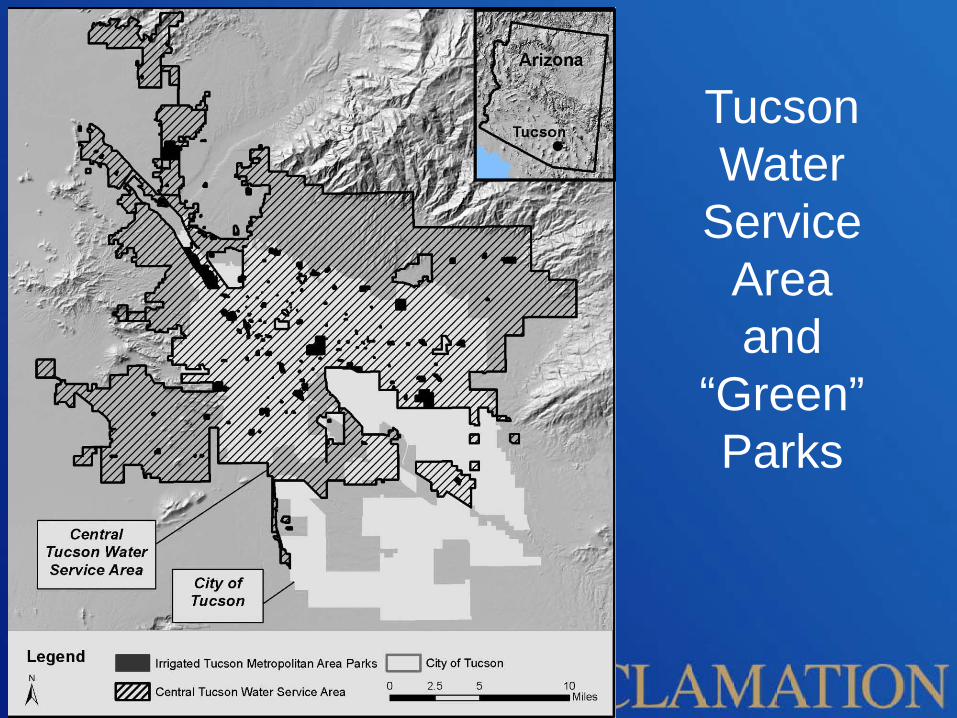
Tucson Water
Service Area and
“Green” Parks

Effect of Park Proximity
vs.
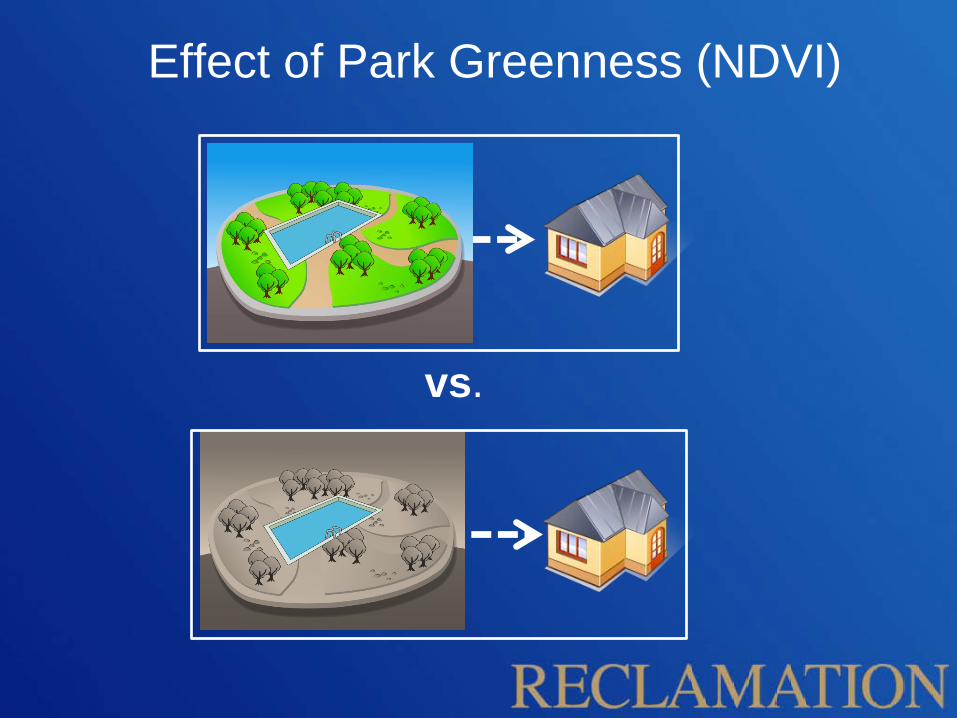
Effect of Park Greenness (NDVI)
vs.
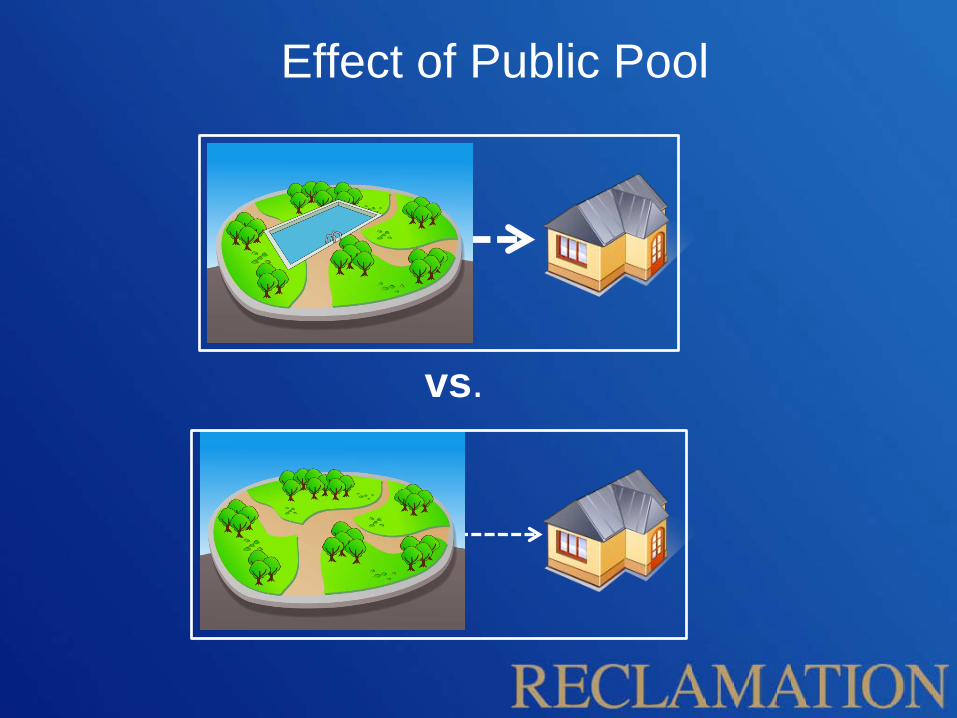
Effect of Public Pool
vs.
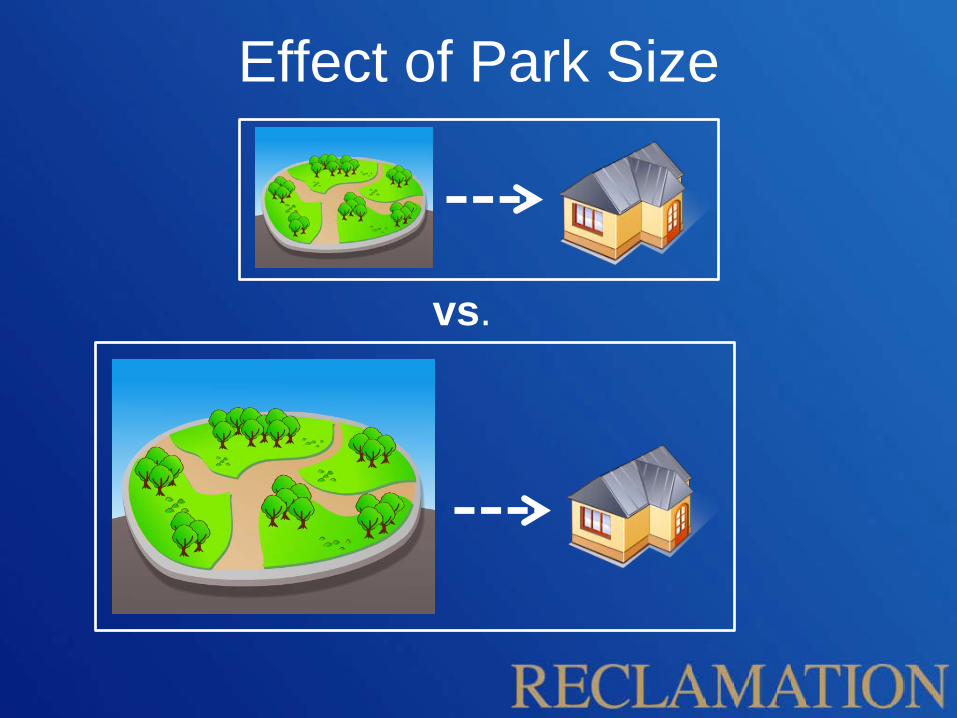
Effect of Park Size
vs.

In conceptual terms, what factors influences SFR use, and how much?
“Property” Variables:
• House Size • House Age • Yard Size • Pool • Evaporative Cooler • Elevation • Yard “Greenness”
“Neighborhood” Variables
• Distance to Park • “Greenness” of Park • Public Pool • Size of Park / Facilities

Hypothesis in mathematical terms.. “Spring 2007 outdoor water use” is a function of:
Home Characteristics: House Age, House Size, Yard Size, Yard Greenness,
Elevation, Presence of Pool, Evap. Cooler
+ Park Characteristics:
Proximity, Greenness, Size, Presence of Pool
+ Error Term
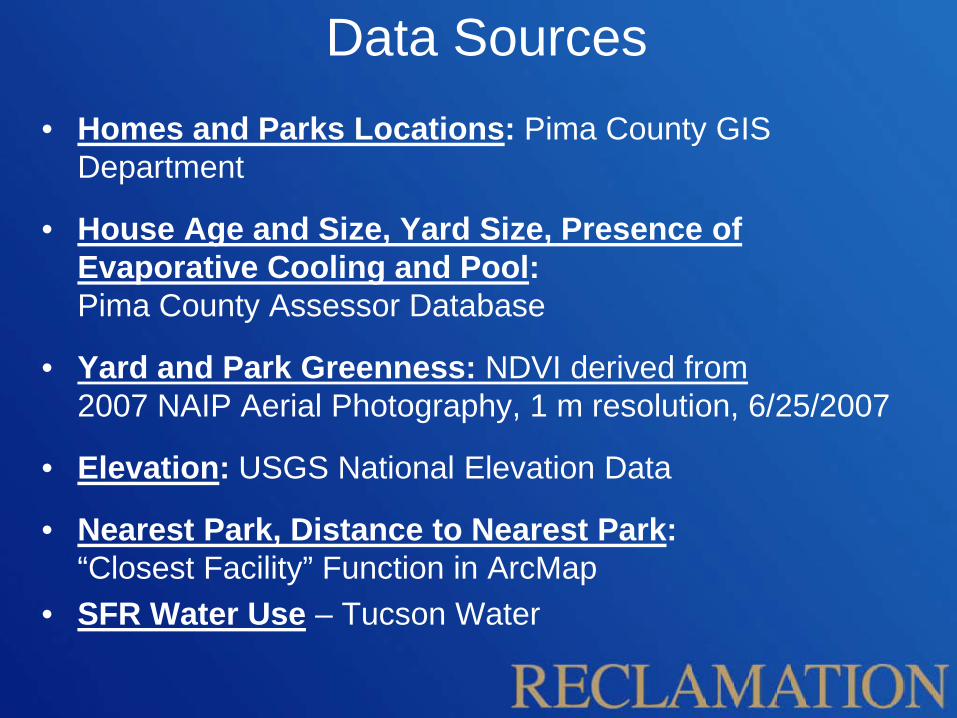
Data Sources • Homes and Parks Locations: Pima County GIS
Department
• House Age and Size, Yard Size, Presence of Evaporative Cooling and Pool: Pima County Assessor Database
• Yard and Park Greenness: NDVI derived from 2007 NAIP Aerial Photography, 1 m resolution, 6/25/2007
• Elevation: USGS National Elevation Data
• Nearest Park, Distance to Nearest Park: “Closest Facility” Function in ArcMap
• SFR Water Use – Tucson Water

Estimating Outdoor Water Use (Average of April, May, June 2007
SFR water use, gphd)
- (Minimum 2006 – 2007 winter water use or
349 gphd, whichever is smaller)
If winter water use was greater than 349 gallons per household per day, we assumed that watering occurred
during winter months
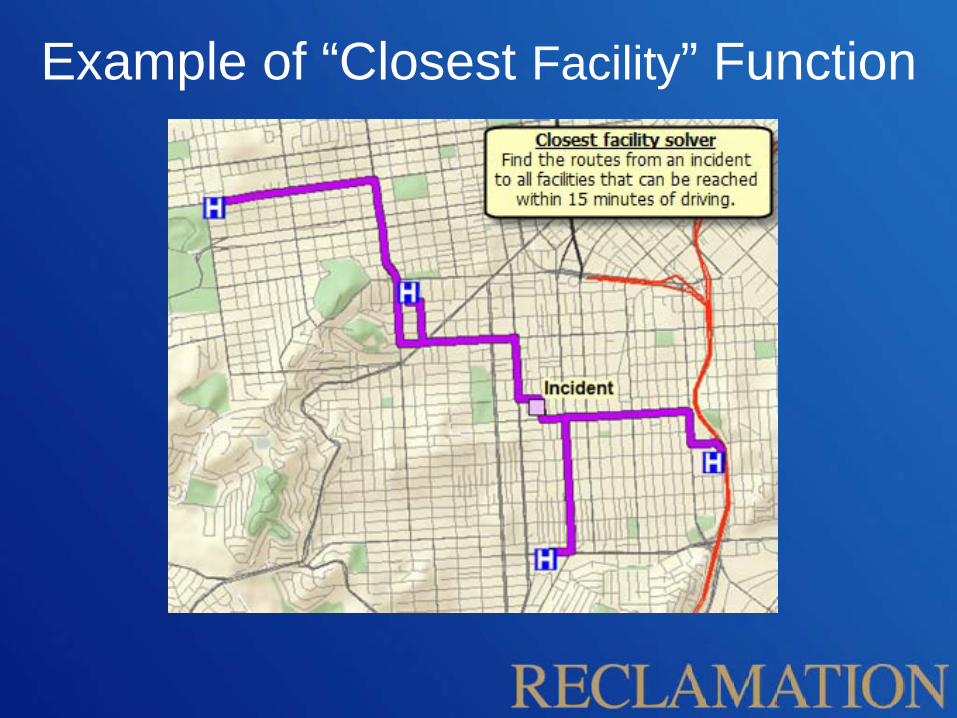
Example of “Closest Facility” Function
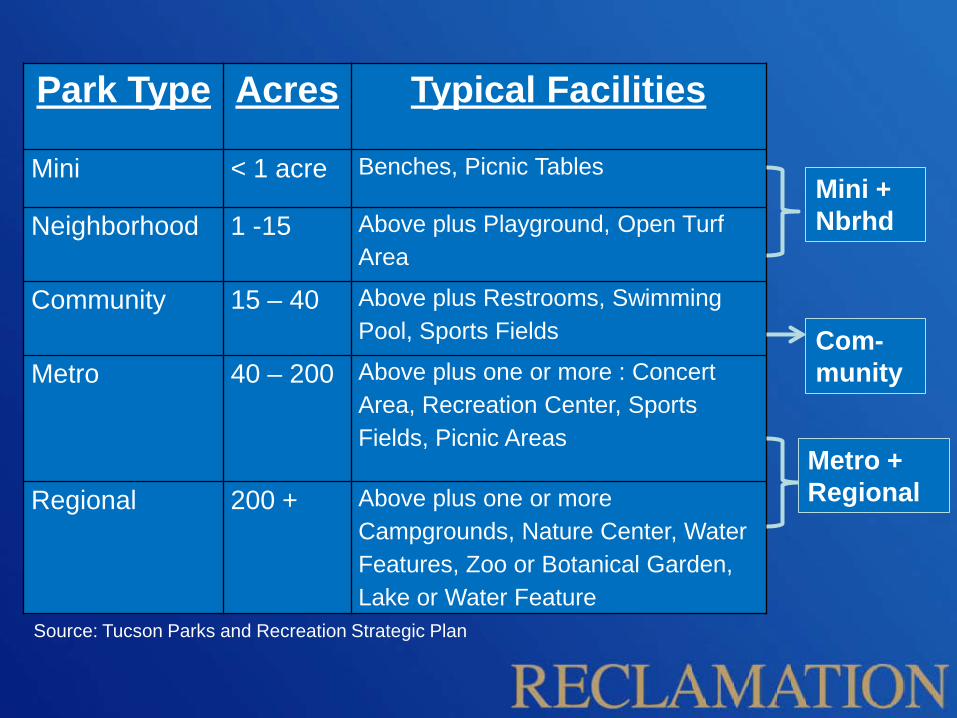
Park Type Acres Typical Facilities
Mini < 1 acre Benches, Picnic Tables
Neighborhood 1 -15 Above plus Playground, Open Turf Area
Community 15 – 40 Above plus Restrooms, Swimming Pool, Sports Fields
Metro 40 – 200 Above plus one or more : Concert Area, Recreation Center, Sports Fields, Picnic Areas
Regional 200 + Above plus one or more Campgrounds, Nature Center, Water Features, Zoo or Botanical Garden, Lake or Water Feature
Mini + Nbrhd
Metro + Regional
Com-munity
Source: Tucson Parks and Recreation Strategic Plan

Methods • Linear Regression Analysis (Ordinary Least Squares)
• N (number of data samples) = 110,111
• Analyzed homes with and without pools separately
• Used parks under 10 acres (no ool) as base case
• R2 Full Model:
– Without home pool = 0.169; With home pool = 0.207
• Variance Explained by Park-related Variables
– Without pools: 0.13%; With home pool: 0.31%
-30
-20
-10
0
10
20
30
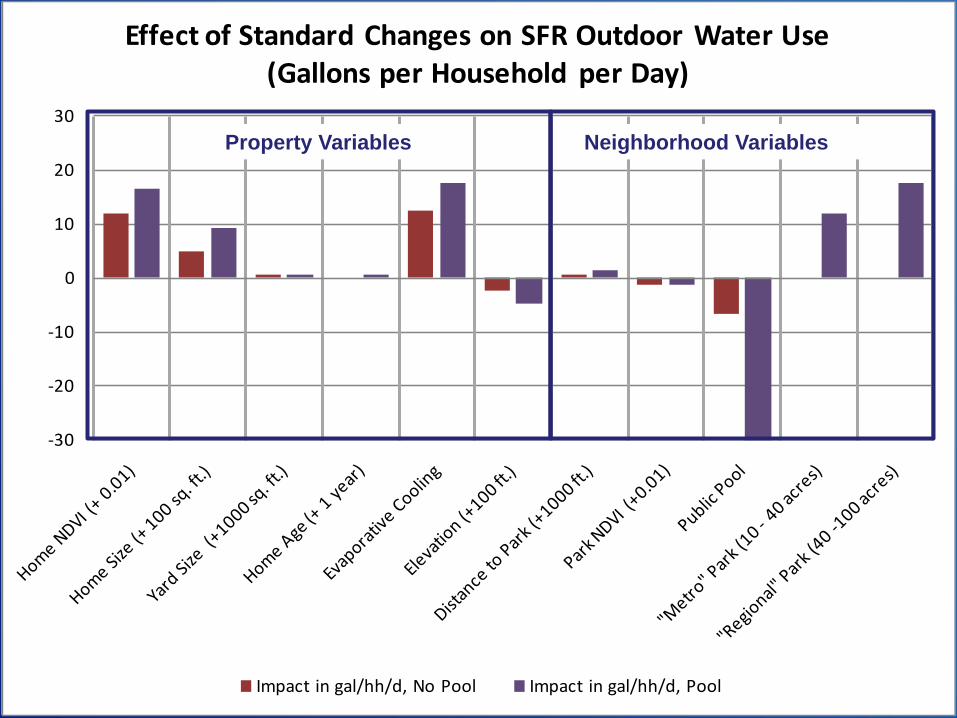
Effect of Standard Changes on SFR Outdoor Water Use (Gallons per Household per Day)
Impact in gal/hh/d, No Pool Impact in gal/hh/d, Pool
Neighborhood Variables Property Variables

• Influence of all home characteristics behaved as expected.
• Homes with pools more sensitive to most factors
• Being close to a green park and a public pool inhibited outdoor water use in SFRs
• For homes with pools, proximity to larger parks appears to promote water use.
Observations

-1,000,000
0
1,000,000
2,000,000
3,000,000
4,000,000
5,000,000
Total Class Potable Water Use (A)
Total Class Reclaimed Water
Use (B)
Total Water Use, Potable +
Reclaimed(A+B=C)
Sum of Park Effects on Water
Use (D)
Total Park Use - Sum of SFR Effects (C-D)
Acre
-Fee
t, Ap
ril, M
ay, J
une
2007
2007 Water Use by Tucson Area "Green" Parks
Mini + Nbrhd Community Metro + Regional (no golf courses) Metro + Regional (with golf courses)
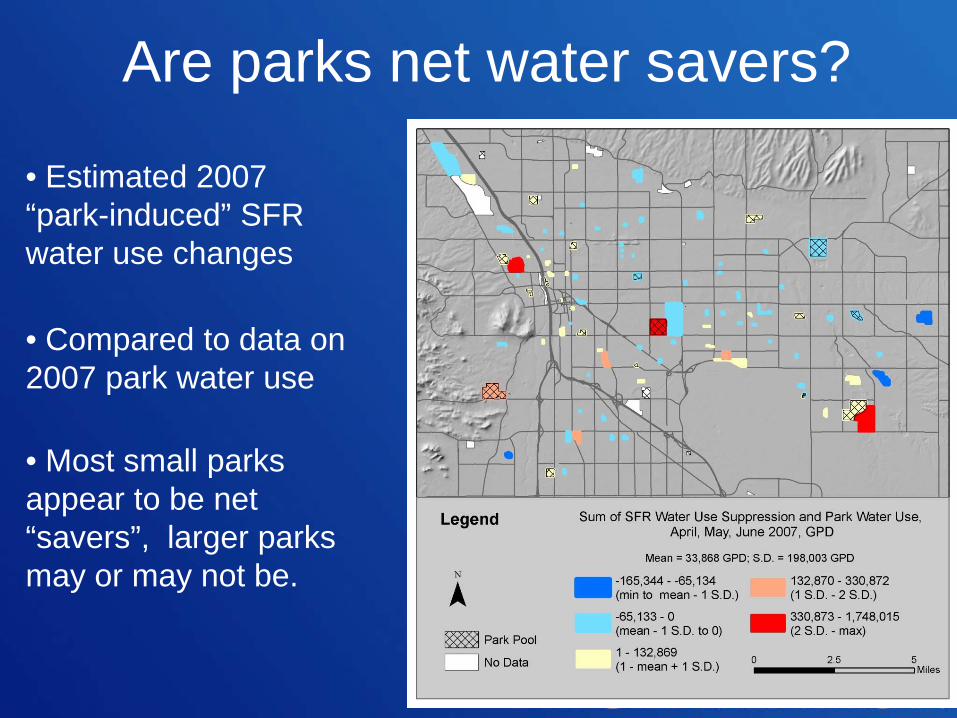
• Estimated 2007 “park-induced” SFR water use changes
• Compared to data on 2007 park water use
• Most small parks appear to be net “savers”, larger parks may or may not be.
Are parks net water savers?
• Proximity to a green park reduces SFR outdoor water use
• Proximity to a public pool reduces SFR outdoor water use, even for homes with pools
• Homes with pools appear to be more sensitive to most variation in home size and age, yard NDVI, elevation and presence of evaporative cooling
Do Parks Inhibit Outdoor Water Use by Tucson area SFRs?
• Small parks generally show net water savings
• Large parks may or may not generate net savings
• Greater proportion of reclaimed water use in large parks promotes conservation of potable supplies
Can Parks Conserve Water?
Questions?