Can Mobile Diaries Accurately Capture Consumer Behavior?...
57
“Can Mobile Diaries Accurately Capture Consumer Behavior? A Large-scale Test on TV Viewing and Empirically-based Guidelines” © 2015 Mitchell J. Lovett and Renana Peres; Report Summary © 2015 Marketing Science Institute MSI working papers are distributed for the benefit of MSI corporate and academic members and the general public. Reports are not to be reproduced or published in any form or by any means, electronic or mechanical, without written permission. Marketing Science Institute Working Paper Series 2015 Report No. 15-125 Can Mobile Diaries Accurately Capture Consumer Behavior? A Large-scale Test on TV Viewing and Empirically-based Guidelines Mitchell J. Lovett and Renana Peres
Transcript of Can Mobile Diaries Accurately Capture Consumer Behavior?...

“Can Mobile Diaries Accurately Capture Consumer Behavior? A Large-scale Test on TV
Viewing and Empirically-based Guidelines” © 2015 Mitchell J. Lovett and Renana Peres;
Report Summary © 2015 Marketing Science Institute
MSI working papers are distributed for the benefit of MSI corporate and academic members
and the general public. Reports are not to be reproduced or published in any form or by any
means, electronic or mechanical, without written permission.
Marketing Science Institute Working Paper Series 2015
Report No. 15-125
Can Mobile Diaries Accurately Capture Consumer
Behavior? A Large-scale Test on TV Viewing and
Empirically-based Guidelines
Mitchell J. Lovett and Renana Peres

Report Summary
Mobile consumer diaries can capture many interesting behaviors not captured in passive data
measurement. They are increasingly used in psychology, geography, and medicine, and
commercial marketing. However, scholarly quantitative research in marketing tends to focus on
passive data measurements rather than on self-reports. To become a standard tool, mobile diary
methods require more research on their accuracy, as well as guidance on how to design more-
accurate consumer mobile diaries.
Here, in a large-scale mobile diary study, Mitchell Lovett and Renana Peres evaluate the
accuracy of mobile diary studies and provide empirically-based design guidance. They use
mobile diary data collected by the Council for Research Excellence (CRE), the Keller Fay
Group, and Nielsen. Over a three-week period, 1,702 U.S. TV viewers reported on viewing and
communications related to prime-time TV shows. A subsample of 151 respondents was passively
monitored using Nielsen’s People Meter. Their data were used to evaluate the accuracy of the
diary reports.
Findings
Overall, respondent compliance was high, with 92% of the diarists completing three weeks of
reporting. Overall, respondents tended not to generate false reports, but they failed to report
some viewings. Specifically, 65% of People Meter records were reported in the diary and 93% of
diary reports had a matching People Meter record. Mobile diary reports were highly correlated
(.90) with aggregate ratings.
Among other findings:
Long viewings (3 minutes or higher) had a higher recall rate (up to 80%).
Reporting showed a pulsing pattern: individuals either do not report at all on a given day
or report accurately.
Alarms increased the recall rate, but generated a small increase in false entries.
Respondents’ compliance level was high, with only a slight decrease in accuracy after
participation incentives ended.
Non-smartphone owners were more accurate, but otherwise exhibited minimal biases in
activity.
Marketing implications
Mobile diaries can complement passive data measurement such as Nielsen’s People Meter Panel;
diaries capture out-of-home viewing and viewing on non-metered devices (associated with sports
programs, day-time periods, younger viewers, and viewing with other people).
In addition, mobile diaries can be a powerful tool to capture behavioral and process variables that
cannot be monitored through passive data measurement: consumption through multiple channels,
lower stages in the hierarchy of effects, exposures and perceptions, and experiences in the
moment.
Marketing Science Institute Working Paper Series 1

Mitchell J. Lovett is Associate Professor of Marketing, Simon Business School, University of
Rochester. Renana Peres is Professor of Marketing, School of Business Administration, Hebrew
University of Jerusalem.
Acknowledgments We thank all those who helped to collect the dataset. Our industry collaborators include Ed
Keller, Brad Fay, and Ben Schneider from the Keller Fay Group, Beth Rockwood and Richard
Zackon from the Council for Research Excellence, and Jessica Hogue and David Chester from
Nielsen. We thank Peter Fader from the Wharton School for creating the contact with the CRE.
We gratefully thank our research assistants at the Hebrew University: Aliza Busbib, Yoav
Haimi, Dana Leikehmacher, Sria Louis, and Haneen Matar for the hours and hours of their life.
We thank Garrett Johnson, Jacob Goldenberg, Eitan Muller, and Christine Pierce for their
insights on an earlier draft of the paper.
This study was also supported by the Marketing Science Institute, The Israel Internet
Association, Kmart International Center for Marketing and Retailing at the Hebrew University of
Jerusalem, and the Israel Science Foundation.
Marketing Science Institute Working Paper Series 2
Introduction
Diaries recorded on smartphones are growing as a mode of research in a variety of
domains including marketing, psychology, geography, health, and medicine. Such diaries, named
hereafter as "mobile diaries," have been extensively used in health research, including studies on
physical exercise (Heinonen et al 2012), sexual encounters (Hensel et al 2012) and alcohol
consumption (Collins, Kashdan, and Gollnisch 2003), and in research on family dynamics
(Rönkä et al 2010), mood (Matthews et al 2008) and mental symptoms such as anxiety or stress
(Proudfoot et al 2010). In marketing, mobile diaries are being increasingly used in marketing
practice: research companies have developed mobile diary practices and some companies now
specialize in mobile diary research (e.g., OnDevice Research). Scholarly marketing research,
however, has thus far used mobile diaries sparingly and primarily for qualitative research
(Patterson 2005; Elliott and Elliott 2003). Quantitative researchers are only now starting to
consider using mobile diaries to collect data (Cooke and Zubcsek 2015).
This lack of adoption by marketing scholars might not be surprising in the current world
where large-scale databases collected via passive measurement are widely available. Passive data
collection is less intrusive, and produces more objective data that is believed to be more accurate
(e.g., Einav, Leibtag, and Nevo 2010). Though in the past, many scholarly marketing studies
relied on pen and paper diaries (Wind and Lerner 1979; Kahn, Kalwani and Morrison 1986;
Sudman and Ferber 2011 for a review), as technology enabled more passive measurement,
quantitative research shifted away from diaries and self-reports in general.
However, we suggest that mobile diaries represent a large, untapped potential for
research in marketing. Many phenomena in marketing cannot be captured using passive data
measurement, and, even for those that can, passive measurements may provide too little
Marketing Science Institute Working Paper Series 3
information to identify the underlying processes. Mobile diaries have the potential to fill this data
gap. For example, while the recent explosion in word-of-mouth (WOM) research has focused
where the data is (online WOM), Keller and Fay (2012) estimate that over 85% of conversations
about brands occur offline where passive measurement is non-existent. Mobile diaries can
provide data on such offline WOM activity. Other currently "hot" topics that can benefit from
data collected via mobile diaries are product usage (Lin and Chang 2012), social interactions
(Chen, Wang and Xie 2011), the use of subjective expectations to evaluate dynamic trade-offs
(Khan, Chu, and Kalra 2011), attitudes, and experiences in the moment. In each of these
domains, mobile diaries have the potential to complement passive measurement to provide a
richer understanding of the process and context of decisions.
For mobile diaries to provide value as a research tool in quantitative marketing, they need
to be able to attain an acceptable level of accuracy. As with any self-report, the accuracy of
mobile diaries might suffer from various issues including forgetfulness (McKenzie 1983),
subjective retrospective interpretation of events (recall bias), and compliance issues (Toh and Hu
2009; Bolger, Davis, and Rafaeli, 2003, Green et al 2006). Prior to the advent of mobile diaries,
electronic collection of diary data (e.g., personal digital assistants (PDAs)) already had the
potential to alleviate some of these concerns through the ability to signal or alert respondents,
obtain time-stamps, and check and ensure response completeness during entry (Bolger, Davis,
and Rafaeli 2003). Indeed, research documents that PDA diaries have higher compliance rates
than traditional diaries (Stone et al. 2002). However, despite this higher compliance, in three
studies across varied contexts, Green et al. (2006) find that paper diaries and electronic diaries
collected via PDAs and beepers were equivalent in data quality.
Marketing Science Institute Working Paper Series 4

Mobile diaries (via smartphones) have the potential to provide more accurate data than
collection via PDAs. In contrast to PDAs, which never served a meaningful role in the lives of a
majority of the population, smartphones have a 71% penetration rate (Nielsen 2014a), are deeply
embedded in their owners lives (Smith 2015) with 80% of owners having their smartphones with
them 22 hours a day (Stadd 2013). This constant availability and attention that smartphones
receive could translate into high levels of diary compliance and accuracy. Yet, to the best of our
knowledge, the accuracy of mobile diaries has not been evaluated. The first goal of this paper is
to provide an estimate of the level of accuracy for a large-scale mobile diary study.
The second goal of this paper is to provide empirical evidence on the relationship
between key mobile diary design decisions and the accuracy of the resulting data. Research has
also not yet provided empirically-based guidance on the design of mobile diary studies.
Currently, guidance on designing mobile diaries is based on logical argument, rather than
empirical evidence (e.g., Bolger, Davis, & Rafaeli 2003; Shiffman, Stone, and Hufford 2008;
Reis, Gable, and Maniaci 2014). Because mobile diaries are a new methodology, understanding
how compliance and accuracy vary by the research design can help to inform appropriate use of
this tool in marketing.
To achieve our research goals we sought data on a sample of individuals that both
completed a mobile diary study and were simultaneously monitored via a widely-accepted
measurement device that can serve as a benchmark. The data we use come from a large-scale,
mobile diary study that was a collaboration with the Council for Research Excellence (CRE), a
consortium of research professionals from TV networks and media and research agencies who
support research on audience measurement issues, the Keller Fay Group, a marketing research
firm, and Nielsen, the primary organization that provides TV ratings. Although the primary focus
Marketing Science Institute Working Paper Series 5
of the study was on the drivers of TV viewing, the study also contained a “research-on-research”
component that allowed evaluation of the mobile diary methodology itself. To be clear, this
context is attractive not because we in any way wish to suggest mobile diaries should replace
People Meters, but rather because of the availability of the widely-accepted benchmark on which
to base our accuracy measurements.
The study was fielded over a six-week period during the opening of the fall television
season of 2013. The sample contains 1702 U.S. TV viewers, ages 15-54, who reported on
viewing and communications related to prime time TV shows. In a rare opportunity for an
academic study, our mobile diary sample includes 151 individuals who have a Nielsen People
Meter (NPM) installed in their home (they are part of the Nielsen Convergence Panel, which we
describe in more detail below). From this group we obtain over 420,000 People Meter log
entries. Similar to the evaluation of paper and pencil diaries (e.g., McKenzie 1983, Lee, Hu, and
Toh 2000), we compare these People Meter entries to their diary reports.
We find that respondents were compliant with the procedure: 92% completed the
incentivized 3-week period. Comparing their reports to the individual-level People Meter
records, we find that diary reports show Precision (the percent of viewing reports correspond to
actual viewing) is 92.7% , Recall (the percent of metered viewing that is captured by diary
entries) is 64.7% indicating low levels of false positive reports (diary reports with no matching
People Meter records). Many of the false positive reports can be attributed to out-of-home
viewing, delayed viewing, and other non-metered viewing (e.g., Hulu, network website, or non-
TV viewing). Many of the false negative reports can be attributed to non-alarmed periods and to
short viewings of less than 15 minutes. We also evaluate the accuracy by comparing aggregate
Nielsen National People Meter ratings to the weighted sample percentage of viewing from the
Marketing Science Institute Working Paper Series 6
mobile diaries. We find a correlation of 0.90 and that 85% of the ratings predicted by the mobile
diary study fall within one rating point of the metered Nielsen ratings. Overall, our findings are
quite positive about the accuracy of mobile diary data between the individual-level accuracy
results and these aggregate accuracy results.
However, we also document two issues that can reduce accuracy and are important to
address in any mobile diary study. First, mobile diary reporting exhibits a "pulsing" pattern
across days where people often report on most of their viewing, but sometimes do not report at
all in a day. We describe the potential measurement problems, and provide an example of how to
test for it. Second, Recall increases with the length of viewing. When viewing less than four
minutes Recall is below 30%, and Recall levels increase to 77% by 24-minutes. Hence, short
activities may need special care in order to capture them accurately with mobile diaries.
We also examined the data for guidance on alarming, study length, incentives, and the
need to include non-smartphone owners. Because alarm timing was randomly assigned, we used
this experimental variation to identify that alarms increase the likelihood to report by 16
percentage points with only a small increase in false positives. However, alarms alone may not
be sufficient for many settings, as even for viewing 33.7% of responses are not alarmed. We
recommend a combination of both relatively frequent alarms and an allowance for self-initiated
entries.
How long can mobile diaries be? Our mobile diary study is long and demanding for
respondents, yet reporting levels and the levels of Recall (False Positive Rate) are consistently
high (low) for the three incentivized weeks. Further, 39% of respondents voluntarily completed
at least one additional week, levels of Recall decline only slightly after incentives end, and
activity levels remained consistent with passive measurement. This lack of fatigue is notable
Marketing Science Institute Working Paper Series 7
since sweeps weeks diaries last only one week. These results suggest that longer diary studies are
feasible, but incentives appear important to maintain participation.
Do mobile diary studies need to recruit non-smartphone owners? In our study,
respondents from this group were given a smartphone to complete the diary. Although these
individuals differ demographically (belong more to the youngest and oldest age groups, and
contain relatively fewer African-Americans), their activity and reporting levels are similar to
smartphone owners, and their accuracy level is slightly higher. As a result we find accounting for
non-smartphone owners to not be critical to measurement in our setting.
Because the context of our study is television viewing, this study also contributes to the
practice of measuring TV audiences. TV ratings are a central measurement in marketing practice,
forming the basis of more than $60 billion in annual television advertising (eMarketer 2014).
The national measurement system largely relies on People Meters and has faced a number of
critical challenges and debate (Boyer 1987; Carter 1990; Milavsky 1992; Danaher and Beed
1993; Napoli 2005; Carter and Steel 2014). Viewing is now shifting to multiple devices, out-of-
home, and on-the-go (Ericsson 2013). Out-of-home viewing is important to ratings (Nielsen
2009), 72% of TV viewers watch videos on a mobile device at least weekly, and 42% do it out of
the home (Ericsson 2013). This shift leaves the traditional People Meter measurement, which is
connected to a TV at home, unable to capture these important behaviors. By contrast, mobile
diaries almost always stay with the owner, suggesting their potential to capture these new
viewing behaviors. Indeed, we demonstrate that mobile diaries can capture these non-metered
behaviors. This ability to capture behaviors that metered measurements miss is indicative of the
potential of mobile diaries to augment passively collected data in quantitative marketing
research.
Marketing Science Institute Working Paper Series 8

The rest of the paper is organized as follows. First, we present the study methodology and
discuss the key design decisions. Second, we evaluate the quality of the mobile diary data, by
checking the reporting activity and accuracy of diary reporting and comparing it to Nielsen
People Meter data. Finally, we discuss these results for their implications for designing mobile
diary studies.
Marketing Science Institute Working Paper Series 9

Designing the Mobile Diary Study
As mentioned above, our data come from a CRE-supported industry collaboration whose
primary purpose was to evaluate divers of television viewing. Our industry partners at Nielsen
and Keller Fay managed the programming and data collection implementation. Although we
were able to make recommendations regarding the study design, we did not have a full control
over the study design nor direct involvement in data collection.
The study period covers the beginning of the fall broadcast season running from
September to November of 2013. The mobile diary study focused on primetime TV and aimed to
capture both viewing and communications about these programs. We focus on the viewing diary
entries. Below we discuss the design. We focus on four design decisions that take on greater
importance for gaining accuracy in mobile diary studies--the sample, the diary entry task, the
monitoring design, and the study duration.
Decision: The Sample of Diarists
Samples for mobile diaries are in most respects ideally constructed in the same manner as other
diary studies where the main issue is ensuring sufficient sample for low response groups (see
Toh and Hu 2009). We use a quota sample with 1,702 respondents that for all aggregate
calculations is weighted to be representative of the U.S. population age 15-54. We use standard
approaches here, which we discuss in Appendix A.
Two issues specific to diaries relate to smartphone ownership. First, the majority of
participants (1,386, 81.4%) used their personal smartphones as the platform for their mobile
diary. However, some participants were recruited who did not own a smartphone (316, 18.6%) in
order to ensure some representation of non-smartphone users. These participants were provided
Marketing Science Institute Working Paper Series 10

with a smartphone for the duration of the study. We discuss in Appendix A how this sample
differs from the main sample in terms of demographics, and, in the results section, we address
how this sample differs in terms of activity, reporting, and accuracy. The second issue is the
mobile phone operating system. The app was available for panelists using iOS (58.7%) or
Android (41.3%), but quotas were not set based on the operating system. We did not find
significant differences in demographic, viewing, or reporting patterns between these two groups.
Decision: The Diary Entry Task
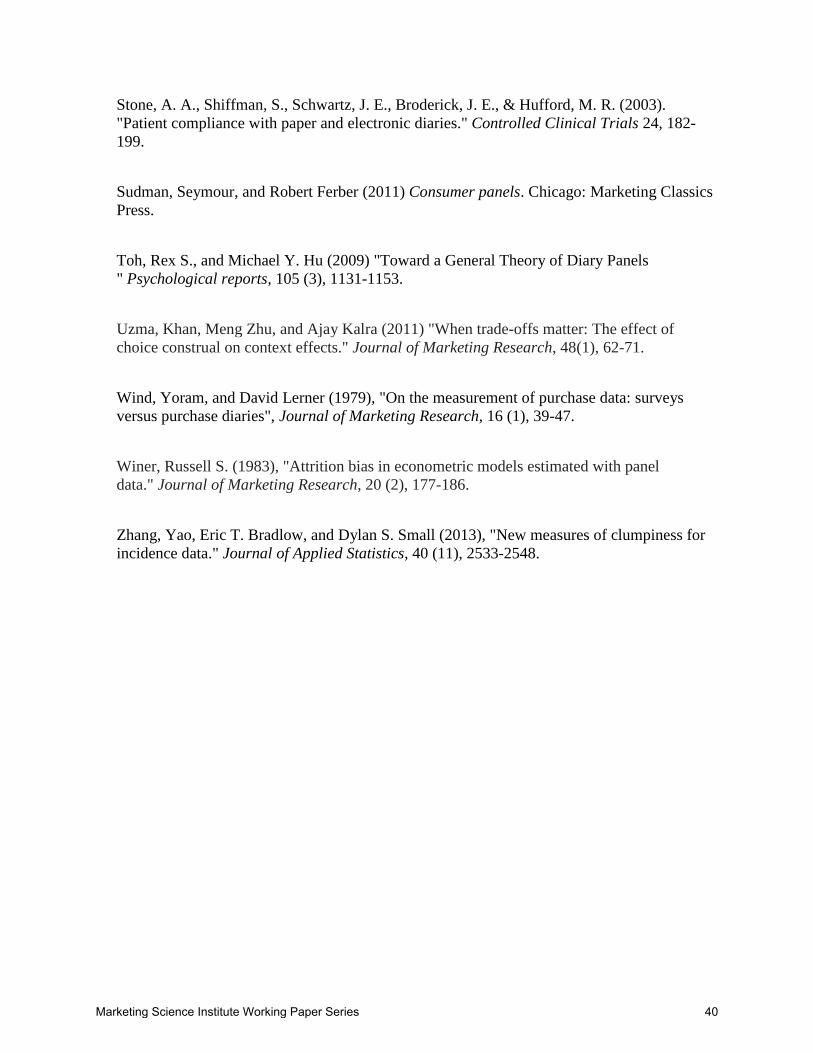
Each diary entry began via a "home screen" similar to the one depicted in the left panel of Figure
1. If indicating they watched or communicated about a prime time TV show in the past hour,
then they were led through a series of questions about that experience. The relevant questions for
a viewing entry are presented in schematic form in Figure 2. If respondents completed an entry,
they were prompted to complete another if they had watched or communicated about multiple
programs in the past hour. (Figures follow References throughouttables.)
An important aspect of diary surveys is keeping a low burden for completing diary
entries. In question 4 of Figure 2, which is illustrated in the right panel of Figure 1, we seek to
obtain a precise indicator of the program the respondents viewed so that we can link our diary
data to other data. This linking is challenging because thousands of programs are available,
Tribune program lists available prior to the airings are imperfect, respondents may not have
knowledge of the exact show name or spelling, and respondents might become frustrated if they
cannot find a desired program. We designed the program identification question so that
respondents would choose the program they viewed from a dynamic "look-up" list where they
entered the first few letters and show options appeared. The list included 2755 shows. The list
was designed to include the most viewed shows on national TV, as well as new shows for the
Marketing Science Institute Working Paper Series 11
season. If the show was not on the list, the respondent had the option to type it manually. These
manual entries were then recoded into the complete show listing.
Decision: Time-based and Event-based Monitoring Designs
The next decision relates to the way entries are initiated. Two different designs are common:
diarists can be prompted according to a schedule (signal-contingent design) or the time of entries
can be selected by the diarists with the intention of matching the activity of interest (event-
contingent design) (Reis, Gable, and Maniaci 2014). Those authors suggest the signal-contingent
design is best for establishing relative frequencies of events, whereas the event-contingent design
is better for relatively rare activities. In our case, we were trying to monitor two different
activities: communications and viewing. Based on prior research, communications were expected
to be relatively rare and sporadic, whereas viewing was expected to be more predictable and
common. The concern was to balance prompting to ensure some coverage of the day for
communications and non-live viewing, while still obtaining sufficient information about prime
time without being overly taxing.
As a result, we used a combination of signal-contingent alarms and event-contingent self-
initiated reports. The signal-contingent component included 3 daily alarms during prime time
(20:00-23:00 Eastern). 1
The time of the first prime time alarm was randomly set to 20:30 or
21:00 (EST), and the following two alarms were in intervals of one hour. In addition,
respondents were prompted randomly twice during non-prime time hours – one alarm at a
random time between 8:00-13:30, and one at a random time between 14:30 and 19:30. Alarms
were random both within and between participants. If a participant did not respond to an alarm,
1 Most shows are broadcast in dual feed mode, where a 20:00 show is broadcast at 20:00 in both Eastern and Pacific
time zones, but 19:00 in Central and Mountain. Therefore, primetime starts at 20:00 in Eastern and Pacific, and
19:00 in Central and Mountain.
Marketing Science Institute Working Paper Series 12

there were no reminders, and he/she was prompted as scheduled for the next alarm. The
respondents were given the option to indicate "going to sleep," which stopped alarms until the
next random alarm after 08:00 the next day.
The app also allowed so-called event-contingent entries; that is, diarists were encouraged
to self-initiate responses in the app at any time they were viewing (or communicating about) TV
but not prompted. A self-initiated report did not cancel the subsequent alarm, so alarm timing
was independent of the self-initiated reports. In this way, we balance the need for a signal-
contingent design to obtain the frequency of viewing activities and the need for an event-
contingent design to obtain the less regularly occurring viewing and communications events.
Although we allow self-initiated entries at any time, we focus our analysis on the prime time
period. In the analysis below, we also leverage our random alarming and self-initiated design to
investigate reporting accuracy under different alarm conditions.
Decision: Study Duration and Incentives
The appropriate study length and incentives depend heavily on the population studied, but since
our study focused on a general population, our experience and choices could be informative to
others. We designed the incentive to last for the first three weeks of each panelist's diary period.
Diarists received a monetary incentive of $50, which required a minimum of 14 days of
participation during the first three weeks of their diary period. This was considered an aggressive
target by the field team and raised concerns about fatigue and attrition. For comparison, a
standard paper and pencil viewing diary during sweeps weeks lasts only 1 week, but involves
tracking more time periods per day.
Marketing Science Institute Working Paper Series 13

We also investigated how willing respondents were to participate in even longer studies.
After three weeks, the respondents were instructed that they had completed the study for
payment, but that they could continue to participate with no payment for up to 3 additional
weeks. If the participant did not remove the app from their smart phone, alarms would continue,
and many respondents continued to complete diary entries. In the next section we examine how
the diary tenure of respondents relates to activity, reporting, and attrition.
Marketing Science Institute Working Paper Series 14
Evaluating the Quality of Mobile Diary Data
Based on this design, we obtained 173,035 diary reports. We define “report” to include every
diary entry. A “viewing” report is defined as any report in which option 1 was selected in Q1
(see Figure 2 above). Aggregating to the respondent day, we have 42,380 days in which
respondents completed at least one report (which we call respondent reporting days). In line with
the literature on mobile diaries from medical research ( Henselet al 2012), respondents
demonstrated high reporting activity with 1559 (92%) panelists completing at least 21 days in the
diary. Hence, attrition was not a major concern here (Toh and Hu 2009).
Table 1 provides summary statistics on reporting activity. The average lifetime (number
of days from first report to last report) of a respondent is 27.7 days, on which he/she reported on
almost 90% of the days (24.9 days) on average. The average number of reports per respondent-
day is 4.1. Our focus in this paper is on the viewing reports. On average, 1.7 out of the 4.1 (41%)
reports (per respondent reporting day) were viewing reports, and not all respondent reporting
days include a viewing report. On average a respondent had 24.9 days in which he/she generates
at least one diary entry, and only 17.8 days with viewing reports. For the rest of the section, we
evaluate the quality of the mobile diary data, focusing on just the viewing reports. (Tables follow
References throughout.)
Individual-level People Meter Data for Benchmarking
We evaluate the quality of the mobile diary data by comparing the respondents’ self-
reported viewing to their viewing records from Nielsen's People Meter. For these analyses, we
use the sample of 151 individuals from the Nielsen Convergence Panel who have People Meters
installed in their home and who also completed the mobile diary study.
Marketing Science Institute Working Paper Series 15
Convergence Panel households are recruited from those exiting the Nielsen National
People Meter panel who provide passive viewing data for Nielsen ratings. When they are forced
to exit the National People Meter panel after two-years, some panelists are recruited to become
members of the Convergence Panel. In this capacity, they continue to be monitored following the
standard procedure for National NPM panel members. Hence, the Convergence Panel
households are experienced with the People Meter procedure and considered by Nielsen as
highly cooperative (Nielsen 2015). However, their data are no longer included in the rating
calculations, and instead used for testing purposes. In a rare opportunity for academic studies, we
were able to obtain access to this panel for our study.
For this group we have both their diary reports as well as People Meter data for the same
period as the diary study. We term this group “The metered-diary” group. Over the survey
period, the metered-diary group generated 3,927 mobile diary viewing reports, and over 420,000
People Meter records for 28,000 airings.2 Appendix A describes how this sample differs from the
main sample. We use this data for most of the analysis contained in this section. Except where
noted, we focus our analysis on prime-time viewing hours during the first 3 diary weeks when
participants were incentivized (i.e., the study focus).
In the following subsections, we use this individual-level data to address six design-
related issues and offer empirically-based guidelines. We end this section by demonstrating the
level of aggregate accuracy of our mobile diary study by comparing it to aggregate TV ratings
provided by Nielsen.
2 Matching the program and channel name of the people meter (which based on internal Nielsen coding) to the
viewer-familiar name used in the mobile diary was a major challenge. The match combined automated matching
with a large-scale manual matching process.
Marketing Science Institute Working Paper Series 16

Reporting Exhibits “Random” Pulsing
We observe a non-uniform reporting pattern, which we term "pulsing." Figure 3 presents
three panelists as examples of pulsing. The figure contains for the first 21 days of each
respondent's diary, the number of daily prime time diary viewing reports (number of boxes)
along with the extent of prime time viewing according to the People Meter (vertical lines with
longer lines mean more viewing in prime time). Although the diary reports clearly relate to the
metered behavior, the diary reports appear to have a "pulsing" pattern where reports tend to
cluster together more than actual activity. Of the days when the People Meter identifies that a
person had at least one prime time viewings 66.9% also have at least one diary entries about
viewing during prime time. For comparison, 79.9% of days with diary entries about prime time
viewing (henceforth, active diary days) have People Meter viewing during prime time. This
difference, we suggest, in part, arises from pulsing.
To measure pulsing we modify the entropy measure of Zhang, Bradlow and Small
(2013), what they call "clumpiness," to allow comparison between individuals and between the
two datasets. Specifically, we normalize the entropy measure by dividing it by the logarithm of
the number of viewings. We find that the clumpiness for the diary data is 10.9, whereas that of
the People Meter data is 6.6 (the difference is significant with t=3.87 and p-value<.001). Hence,
metered viewings are more uniformly spread than diary reporting.
How problematic is pulsing for capturing activities? First, we find that 28% of total prime
time viewing minutes (as measured by the People Meter) is on days without a diary viewing
entry about prime time, and only 22% is on days without any viewing diary entries. So most
viewing is occurring when people are "pulsed" on. Second, according to the People Meter, the
average minutes of prime time viewing on days without a viewing diary entry (5.7 minutes) is
Marketing Science Institute Working Paper Series 17

much lower than with one (22.0 minutes). Third, the percent of days without diary reports with at
least 15 minutes of prime time viewing is much smaller than the days with diary report (15.6%
vs. 56.6%). Hence, in our setting the mobile diary reports are active during the time periods
when most viewing (according to the People Meter) occurs.
Hence, although pulsing may not be too severe an issue in our setting, other settings
could face greater problems. Pulsing generates missingness in intervals at the individual-level,
and such missingness could lead to bias in individual-level and correlational analyses if not
handled properly. As practical advice, prior to conducting the study, the researcher can (a)
pretest for pulsing behavior to identify whether it exists for the specific study context, (b) pretest
for non-random arrival (e.g., checking for day of week effects and relationship with types of
activity), and (c) adjust design elements in order to reduce it (e.g., emphasis in instructions,
alternative alarms, check-ins, etc.).
After the study is complete, if non-reporting is concentrated in a few individuals or times,
those individuals or times can be considered for dropping. That said, we found that identifying
pulsing without knowledge of the passive measurement was very difficult in our setting. We
found little systematic variation (e.g., it does not correlate significantly with day-of-week or
week of diary effects), and it is not overly concentrated in a few individuals suggesting it could
be a more universal aspect of compliance in mobile diaries. Hence, if pulsing is more severe in a
given study, it may not be easy to identify heavy pulsing times or individuals in order to reduce
the problem. Further, respondents in our study were alarmed multiple times every day, the
alerting scheme we used on the smart phone is not sufficient to avoid the observed pulsing in the
reporting behaviors. Though our data does not allow a closer examination of pulsing, future
Marketing Science Institute Working Paper Series 18

research on mobile diary methods should examine the causes of and potential ways to reduce
pulsing.
Individual-Level Accuracy Measures Show 93% Precision and 65% Recall
We now provide a more detailed examination of reporting accuracy. We present the
accuracy at the level of a respondent-day for the half-hours in the prime time period (8-8:30,
8:30-9:00, etc. up to 10:30-11:00 pm Eastern). We count any viewing with a People Meter record
(even of 1 minute) in that half-hour period as a People Meter viewing, and mobile diary entries
are assumed to last for the length of the corresponding People Meter viewing if a match is found,
otherwise, it is assumed to start in the half-hour prior and last for the length of the telecast.
We present the accuracy measures building on a 2x2 contingency matrix as presented in
Figure 4. Assuming the People Meter data represent the true condition (with two caveats
explained below), the numbers in the four cells of the matrix (from the top left clockwise) are the
True Positive (A), False Negative (B), False Positive (C), and True Negative (D). Based on these
numbers and following ROC terminology (Fawcett 2006, Powers 2011), we present the
following measures:
The % Recall (% Reporting) is the percent of all half-hours viewed according to the
People Meter that have a matching diary viewing report (A/(A+B) = 64.7%).
The % False Positive Rate (C/(C+D) = 7.7%) is the percent of all half-hours with no
viewing according to the People Meter that have a diary viewing report.
The % False Omission Rate (B/(B+D) = 36.6%) is the percent of all half-hours with no
viewing according to the diary that NPM indicates are viewing.
The % Precision (A/(A+C) = 92.7%) is the percent of all half-hours with viewing
according to the diary that NPM indicates are viewing.
Marketing Science Institute Working Paper Series 19

The contingency matrix was calculated on active diary days (i.e., a day when the
respondent had at least one diary report). We augment the People Meter data to identify true
positives. Diary entries without corresponding People Meter records are considered as true
positives if (1) they are reported as live viewing and when evaluated against the Tribune program
listings they match a live airing (to account for the fact that out-of-home viewing is not captured
by the People Meter) or (2) they are reported as viewed, but in a way not measured by the People
Meter (e.g., not on TV). Appendix B provides more detail on the measurement and considers
alternative approaches to identifying true positives.
As depicted in Figure 4 the Precision (92.7%) and False Positive Rate (7.7%) indicate
high levels of accuracy. To put these numbers in context, the People Meter is estimated to have a
8-10% error rate due to the person ID entry (Sharot 1991, Danaher and Beed 1993). Hence, the
magnitude of these errors is similar to the expected People Meter error (and in fact these errors
could entirely result from errors in the People Meter).
The False Omission Rate is 36.6% and Recall is 64.7%. Previewing the results in the
remainder of this section, we find two main reasons that Recall appears to be lower than
Precision: (1) short viewings are not reported and (2) our alarming scheme. First, many viewings
are quite short and these short viewings are counted in Cell B of Figure 4. Of the half-hours in
Cell B, 33.3% have no more than 15 minutes of viewing, whereas in Cell A only 13.0% do. In
the section below that examines length of viewing, we find that respondents are unlikely to
report these short viewings and that viewings of 24 minutes have 77% Recall, twelve percentage
points higher than the average. Second, as we show below, the half-hours with alarms have
almost 16 percentage points higher Recall. As a result, our design of alarming every other half-
hour leads to lower Recall for the non-alarmed half-hours.
Marketing Science Institute Working Paper Series 20

We now investigate whether the errors are concentrated in a few individuals. In Figure 5,
we present the individual-level Recall (x’s) and False Positive Rate (circles) in descending order
by respondent. For Recall the distribution is wide, but not overly concentrated on either end, with
relatively few individuals having very low Recall. For the False Positive Rate, most of the
distribution has no such diary entries, and none have a very large portion with a max around
30%. This suggests that although individuals vary, the errors are not overly concentrated in a
small set of individuals. Further, the correlation between Recall and False Positive Rate is 0.045,
suggesting no meaningful correlation in who makes these two errors.
In the subsections that follow, we analyze how the various design elements relate to the
level of accuracy in order to direct how to further improve accuracy. The remainder of this
section considers how reporting is related to viewing duration, alarms, diary tenure, and non-
smartphone owners. We conclude this section by evaluating the diary accuracy in predicting
aggregate ratings.
Longer Viewing Increases Recall
Consistent with prior research (Deng and Mela 2014), the NPM data contain many
instances of individuals sampling programs for a short period of time: 27% of the viewings are
three minutes or less in length, and 43% are less than 1/4 of the telecast length. We expect
respondents will be less likely to report such short viewings. Figure 6 presents the percent
reporting by minutes of activity duration within the half-hour. The expected positive relationship
is evident in the lowess-smoothed curve (solid line). Half-hours with less than four minutes of
viewing have below 30% Recall and Recall increases rapidly until ten minutes of viewing when
it slows as it reaches 60% reporting. The highest point estimate of Recall is for half-hours with
24 minutes of viewing, which have a 77% Recall.
Marketing Science Institute Working Paper Series 21

The under-reporting of shorter activities leads to systematic reporting biases. Although
less concerning for audience measurement since shorter viewings naturally should have
proportionately less weight, for some activities such as word-of-mouth conversations, the length
of the activity might be unrelated to its influence and importance to the measures.
Alarms Improve Recall With Only a Small Increase in False Positives
We used a combination of time-based (alarms) and event-based (self-initiation) designs.
On average, panelists responded to 46% of the alarms, and 33.7% of the total reports were self-
initiated. Alarms should raise the attention of the respondents to enter a diary if they are
watching, just watched, or plan to watch when the alarm arrives, but it could also potentially
generate false entries (Adams et al 2005). We test whether alarms have an impact on our
individual-level accuracy measures using the randomization of the alarms to provide
experimental variation in the alarm “treatment” vs. no alarm “control” conditions.3 Table 2
tabulates the accuracy measures broken out by alarmed and non-alarmed conditions.
The results indicate a statistically significant (via chi-squared tests) improvement in
Recall (16.1%), and significant worsening of the False Positive Rate (8.8%), and Precision
(6.6%), but no significant change in the False Omission Rate. Importantly, the increase in Recall
is much larger than the increase in the False Positive Rate or the decrease in Precision. Overall,
these results suggest that the design decision to alarm participants, trades off the percent
reporting with the likelihood of false positives, but that, at the frequency of alarms in this study,
more is gained from alarming than lost. Hence, it appears that more alarms leads to more
accurate data without sacrificing too much in terms of the False Positive Rate and Precision.
3 Because the alarm periods were randomized and not separately identified in the data, we can only identify which
half-hour the person was alarmed by later diary reports that were alarmed. Therefore, the analysis could be done
only for active days.
Marketing Science Institute Working Paper Series 22

These results suggest that studies should alarm at time intervals when the activity is most
likely to occur and to be relatively aggressive in the frequency of alarms. Future research could
evaluate how many more alarms are feasible without leading to overall study fatigue and a
significantly higher False Positive Rate.
Until Incentives End Recall and Precision Levels Are High and Flat
A major issue in diary studies relates to how the amount and accuracy of reporting vary by how
long the diarist is participating (i.e., fatigue). Recall, that, to receive full incentive payment,
participants had to have at least 14 days between the first and last report. Since the diary app was
not automatically removed after 21 days, most (61.5%) of the panelists continued to report: 656
(39%) completed the 4th
week (28 days), 415 (24%) continued to complete the 5th
week, and 234
(14%) completed 6 full weeks of reporting. This high level of voluntary continuation is
surprising given the high demands on respondents. However, even these high voluntary
participation rates reduce the sample size and potential generate attrition bias (Winer 1983).
We first study the quantity and accuracy of reporting over time and then turn to whether
any differences could be attributed to attrition. First, we check whether the weekly reporting
quantity of respondents is aligned with the weekly amount of viewing as measured in the People
Meter. Figure 7 presents the percent of total programs viewed (bars with vertical black lines for
+/- 2 standard errors) and viewing reports per respondent (solid line) by tenure in the diary study.
The two measures track very closely over time and are statistically indistinguishable. Hence,
total viewing activity and reporting are closely linked, and the correspondence does not diminish
with tenure or incentivized vs. non-incentivized periods. These reporting quantity results suggest
mobile diaries longer than 3 weeks are feasible.
Marketing Science Institute Working Paper Series 23

Second, we check how accuracy, namely Recall and False Positive Rate, vary over the
respondents’ diary tenure. Figure 8 presents the average percent Recall and False Positive Rate
by the week of the respondent in the diary. The False Positive Rate is flat with no significant
week-to-week differences. Recall levels are flat when the incentive is in place and the first three
weeks of week-to-week differences are not significant. However, the Recall point estimates
decrease from week 3 to week 4 (from 67% to 60%, chi-squared=11.9,p-value<.001) after the
incentives end. No other week-to-week differences in Recall are statistically significant,
suggesting the decrease is due to the incentives rather than fatigue. Overall, the average Recall is
64.7% for first 3 weeks versus 59.8% for the second three weeks, and this difference is
statistically significant (chi-squared=11.9 again, p-value=<.001). By contrast, the False Positive
Rates for the first 3 weeks (7.7%) and the latter 3 weeks (7.6%) are not statistically different.
Hence, the modest decrease in Recall after incentives end does not also bring a worsening in
terms of increased false positives.
We now turn to whether the lower recall in the post-incentive period is likely to be due to
a selection of who voluntarily continues. We evaluate whether the accuracy for those that
continue differs from those that do not during the incentive period. We find the difference is
small (1.3%) and insignificant. However, unsurprisingly, the individuals who continue did
exhibit significantly higher activity levels (44.8 vs. 31.2 half-hours of viewing, t-stat for
difference is 3.54). Demographically, in Appendix A, we show that women and the two youngest
age groups are significantly more likely to voluntarily continue after the incentive period. Hence,
selection exists in voluntary participation periods, but that selection can't explain the decrease in
reporting (volunteers report more, not less than non-volunteers) and it doesn't cause a worsening
in accuracy or compliance.
Marketing Science Institute Working Paper Series 24

To summarize, these results suggest that the long diary (3 weeks) did not induce fatigue
in respondent reporting levels, but that incentives are important to keep (representative)
respondents in the sample, and to a lesser degree to maintain higher reporting accuracy levels.
Hence, we find that mobile diaries of up to six weeks for a regular activity like TV viewing
appear to be feasible while maintaining a consistent level of accuracy.
Non-Smartphone Owners Report More Accurately
The last design-related issue we discuss is related to smartphone ownership. Because smartphone
ownership is non-random and owners make up a large, but far from complete proportion of the
population, obtaining a representative sample could require including respondents who do not
own smartphones. As noted in Appendix A, compared to the owners, the non-owners have a
higher percentage of men, belong more to the youngest (15-17) and oldest (45-54) age groups,
and have a lower percentage of ethnic minorities than do smartphone owners.
We examine how this sub-population differs in terms of the viewing reporting and
activity levels as well as the accuracy of the reporting. Non-smartphone owners appear to report
(26.4 vs. 26.2 half-hours with viewing reports during the first three weeks) and view (36.7 vs.
37.7 half-hours of viewing during the first three weeks) approximately the same amount as
smartphone owners, and neither difference is statistically significant. Hence, activity and
reporting levels do not appear to be related to smartphone ownership. Interestingly, we find that
the non-smartphone owners are significantly more accurate in their reporting on all four
dimensions, as indicated in Table 3 below.
To summarize, although the non-smartphone population appears to differ in terms of
demographics, they do not differ in terms of activity and reporting levels, and are slightly more
accurate. These results suggest that smartphone ownership is a non-issue for our study. However,
Marketing Science Institute Working Paper Series 25

we recommend caution in generalizing these findings about smartphone ownership because this
study is for only a single type of activity (television viewing) and a nationally representative
sample. Although our results suggest it is possible that including non-smartphone owners may
not be necessary for representativeness of activity levels, the type of activity could affect the
relative influence of smartphone ownership on activity levels. A pre-test could evaluate the
potential size of this issue for other domains.
Mobile Diary Ratings Very Accurately Match Nielsen Telecast Ratings
The above analysis evaluates the individual-level diary data against individual-level
People Meter data for the metered diary group (a subset of the mobile diarists). We now evaluate
how aggregates calculated based on our full mobile diary sample (1702 respondents) correlate
with aggregate NPM ratings. For this comparison, we obtain from Nielsen the (aggregate)
National NPM TV ratings for 15-54 year olds (the same population as our mobile diary sample)
for the top 200 programs (as determined by our mobile diary study). We consider only original
telecasts that overlap with our mobile diary study period. We use the Nielsen "MC US AA %"
measure, which is the most current national average audience measure (Nielsen 2014b). Nielsen
calculates these ratings by taking the weighted minutes of viewing by the National People Meter
panel members and dividing by the weighted total sample (the “weighted intab”). While in the
individual-level analysis we included all the People Meter viewings, whether live or delayed, for
this analysis we focus on the core measure used in TV ratings, the “live plus same day” Nielsen
rating measure. This measure captures both live viewing and delayed viewing by DVR that
occurs on the same day as the telecast.
From our mobile diary we calculate the aggregate viewing percentage for each relevant
telecast. To match with these Nielsen ratings, we consider only entries on the same day as the
Marketing Science Institute Working Paper Series 26
program telecast that were self-reported as live or DVR TV viewing, and not as an older episode.
We use the sample weights, 𝑤𝑖 provided by the survey provider, which are designed to produce a
demographically representative sample (see Appendix A). These weights were calculated to be
the ratio between the sample and the quotas, in order to correct for the small discrepancies in the
sample. The quotas were constructed from population values or best estimates of those values.
The percent of viewing (i.e., ratings) based on the mobile diary, 𝑠𝑗𝑚, is a weighted average of the
viewing indicators, 𝑣𝑖,𝑗, 𝑠𝑗𝑚 = ∑ 𝑣𝑖,𝑗𝑖 𝑤𝑖/∑ 𝑤𝑖𝑖 .
We focus our discussion on telecasts that aired when our mobile diary sample was
relatively large (n>1660). For this sample, we have 243 telecasts over 10 days. The simple
correlation between this data and the NPM ratings is 0.90. This high correlation suggests we can
recover the basic pattern of viewing well. The high level of accuracy is robust to changes in the
required daily sample size and to including non-prime time telecasts of the top 200 shows.4
Further, we find, even after introducing both program fixed effects and date effects, the mobile
diary estimate of percent viewing has a significant relationship with the Nielsen ratings (p-value
<0.001), suggesting the mobile diary data can capture not only cross-sectional, but also within-
program time variation.
We previously demonstrated that diary reports miss some viewings with lower recall for
shorter viewings. This would suggest that the diary reports would understate the People Meter
viewing. However, we do not obtain self-reports of the viewing length for diary entries. We
instead assume the viewing is the full program length, an upper bound on the potential length of
the viewing. As a result, the diary could over or understate the total viewing minutes.
4 For example, if including airings when the mobile diary sample size is 1000 (n=446 over 22 days) the correlation is
0.87. Similarly, if we include both prime and non-prime time telecasts (n=364 over 10 days), the correlation is 0.86.
Marketing Science Institute Working Paper Series 27
To directly compare the mobile diary viewing percent, 𝑠𝑗𝑚, with NPM ratings, 𝑠𝑗
𝑁, we
need to allow a scaling adjustment for this under/over-reporting. To do so, we run a regression of
𝑠𝑗𝑁 = 𝛽𝑠𝑗
𝑚 + 𝜖𝑗 to get the optimal homogeneous weighting. We find that 𝛽=0.62 for our sample.
Using this weighting, a full 85% of the mobile diary ratings are within 1 rating point of the NPM
measure and 72% are within 0.5 rating points. Like the correlation reported above, the accuracy
level and weighting are quite robust to alternative required sample sizes. Again, this suggests
accuracy is quite high, since one could likely improve these estimates by using a more
complicated scaling model with heterogeneous 𝛽 weights, for example based on the program
length (e.g., 30 vs. 60 minutes) or type (e.g., sporting events, episodic programs). Figure 9
presents the plot of the NPM ratings vs. these ratings based on the mobile diary data. Overall, the
comparison suggests that mobile diaries can quite accurately match metered data.
Marketing Science Institute Working Paper Series 28
Contributing to Television Audience Measurement
Like most metered measurements of behavior, the People Meter doesn't perfectly capture
viewing. People Meter errors can arise from at least three causes: (a) errors in entering the person
ID when watching (Sharot 1991and Danaher and Beed 1993), (b) viewing in unmetered ways
including on laptops, tablets, smartphones, and on TV via Hulu and other network or streaming
apps, or (c) viewing out of the home. In this section, we shed light on the extent of viewing
behaviors that People Meters currently miss and mobile diaries capture. In the process, we
demonstrate that mobile diaries can complement observational data in valuable ways.
For this analysis, we classify all mobile diary viewing reports as via metered TV or not,
and whether the TV viewing has a matching People Meter record. Because respondents were
asked to report on their viewing in the past hour, we considered as a match any diary entry with a
People Meter record within 1.5 hours after and 1 hour before the diary entry and a matching
program name. Importantly, this analysis differs from that of the previous section in three ways:
(1) the unit of analysis is a diary entry, not a half-hour, (2) the time window is not restricted to
prime time, and (3) TV listings are not used to refine the accuracy of live viewing diary entries.
The results aggregated for the metered-diary group (i.e. those with both mobile diary and
People Meter data) are presented in Table 4. As Table 4 indicates, 67% of the mobile diary
reports have a matching People Meter record (Category 1), indicating that the diary entry was an
accurate report of metered viewing on TV. Approximately 5% of diary viewing reports are self-
reported as being non-metered including through an app or on a non-TV device (Category 2).
Consistent with this self-report, only 1.4% of these reports have a corresponding People Meter
record (i.e., on TV). Also consistent with diary viewing not on metered TV, Category 2 reports
are significantly less likely to be watched with someone else (26% less) or during prime time
Marketing Science Institute Working Paper Series 29
(24% less). The remaining entries (28%) are viewing entries, which are self-reported as on TV
but have no matching People Meter record (Category 3).
We argue that Category 3 entries are likely to be out-of-home or on-the-go viewing. In
2014, Nielsen found that ratings increased by 7% to 9% after accounting for out-of-home
viewing and that the lift was largest for daytime programming and sports programming (Nielsen
2014c). An earlier study by Nielsen (2009) also found that out-of-home viewing was higher for
daytime and sports programming, and that the impact of out-of-home viewing was higher for
weekend programming and among younger persons compared to older persons.
We find Category 3 viewing is consistent with these patterns for out-of-home viewing.
Category 3 is significantly higher than Category 1 for Daytime programming (15% points higher,
t-stat=11.7, 11% base rate), Sports programming (12% points, t-stat 11.2, 7% base rate), and
Weekend viewing (10% points higher, t-value 6.35, 21% base rate). To examine the age
relationship, we regress gender (male), ethnicity (non-white), age (in years), and activity
(number of diary viewing reports) on the percent of non-matching (Category 3) per person. Only
age and activity are significant with coefficients -0.006 (stderr =0.002, p-value<.05) and -0.002
(stderr=0.001, p-value<.05) respectively. Although the R-squared is relatively low (0.10), the
qualitative finding is consistent with Nielsen (2009). Further, we find that Category 3 is more
likely to be viewed with others (6% points higher, t-value 3.47) and more likely to be self-
initiated (7% points higher, t-value 4.66), which both appear consistent with out-of-home
viewing. Overall, these results suggest that out-of-home viewing plays a meaningful role in the
make-up of our Category 3 diary entries.
Taken together and combined with our finding of a 92.7% Precision, we conclude that the
mobile diary can be useful to capture viewing both on unmetered devices and out-of-home, both
Marketing Science Institute Working Paper Series 30

types of viewing that the People Meter measurement misses and that are increasingly important
to measuring viewing behaviors today. We are not arguing that mobile diaries can or should
replace People Meters, but instead that they can be used to gain information about behaviors that
People Meters cannot.
Marketing Science Institute Working Paper Series 31
Discussion
This paper aims to be the first to provide an evaluation of accuracy of mobile diaries and
empirically-based recommendations for how to design mobile diary studies in marketing. We
carried out a 21-day mobile diary study covering TV viewing on a representative sample of 1702
respondents. Despite high demands on respondents, compliance was high throughout both the
incentivized first three weeks and the following voluntary three weeks. Comparing self-reports
for a subset of 151 respondents to their individual-level Nielsen People Meter data we find a
Recall is 64.7% and Precision is 92.7%. Comparing the self-reports to the overall rating of the
shows, we find a high correlation of 0.9. Together our findings indicate a high level of accuracy.
In the previous section, we demonstrate that mobile diaries can capture activities which are not
measured by the People Meter such as viewing on non-metered devices and out of home
viewing. Hence, our findings indicate that mobile diaries can be a reliable source of new data in
future marketing research that can augment passive measurement. Our study also provides
empirically-based guidance on how to conduct future mobile diary studies. Table 5 summarizes
our main findings and the implied guidelines.
Although we evaluated accuracy compared to a metered viewing, we do not recommend
replacing passive measurement. The power of mobile diary studies is to provide insights on
behaviors that are hard to capture using passive measures. We demonstrated this in the context of
viewing where some types of viewing cannot be captured by the People Meter. More broadly,
mobile diaries can be used as a standalone data source, or in combination with other data sources
such as People Meter, scanner data, web browsing, or location tracking. Specifically, we think
mobile diary data can benefit studies that aim to (1) capture a spectrum of influences/behaviors
on an individual; (2) focus on earlier stages in the hierarchy of effects; (3) focus on exposures
Marketing Science Institute Working Paper Series 32

(the customer perception) rather than resource allocation by the firm; (4) focus on describing
process rather than simply outcomes, or (5) understand the deeper context of decisions and
behaviors. Here are some specific examples:
1. The relative importance of marketing communication mix elements on purchase – Mobile
diaries enable a customer to report exposures to different elements of marketing
communication: social interactions, advertising, PR, in-store promotions, and events that
an individual is exposed to. Such data can serve as an input into evaluating the effect of
communications on consumer attitudes and behaviors of interest, including purchase, and
these data are generally not available at the individual-level.
2. Processes in the personal social network – The structure and information flow of the
personal social network of an individual are important to the formation of beliefs and
attitudes as well as to purchase. Mobile diaries can document this structure, flow, and
interactions. Of special importance are the offline interactions, which are not captured in
available online social network data.
3. Determining the choice set – In many purchases, the exact choice set faced by the
customer depends both on the context and decisions of the consumer that are not
observed. Mobile diary entries can provide such information. For example, using the
phone camera, customers can take photos of the store shelves they are looking at, so the
exact brands, prices, and shelf-space become available.
4. Measuring brand encounters – Attitudes and brand choices are formed through brand
encounters. Using a mobile diary, respondents can report the exposure to brands not only
in advertising, but through interactions with people and displays. As importantly, brand
usage and experiences can be tracked including the location, the actual experience (e.g.,
wait time), the perceived experience, and the context (e.g., picture of complete meal or
restaurant at time of ordering).
5. Measuring brand attitudes – On-the-go recording of emotions and attitudes towards
brands using the mobile handset (as a report or through recording) could provide a richer
and more reliable measure than brand perception questionnaires used today.
Marketing Science Institute Working Paper Series 33
6. Purchase and use of services – A considerable part of purchases of individuals are for
services (e.g., movies, financial services, restaurants). Mobile diaries can complement
scanner data to provide a fuller picture of purchases through self-reports and receipt
scanning via the phone camera. The mobile diary can also add information such as the
time of purchase, location, social setting, weather, etc. that can further enrich data on the
context of the decision.
We have demonstrated that mobile diaries can be accurate and can augment existing metered
measures. However, our empirical analysis also revealed two potential issues--pulsing and short
activities--where mobile diaries may have limitations. Below we offer a brief summary and
recommendations:
1. Pulsing – Pulsing can limit the usefulness of individual-level data. While pulsing in our
context of TV viewing appears to be random and not too severe, studies in other contexts
that plan to use individual-level data need to evaluate for the presence of pulsing and
whether it is systematic. The presence of pulsing could lead to selection biases.
2. Short behaviors – Our results indicate that short viewing behaviors are not captured well
by the mobile diary. Particularly for studies focused on short activities, pre-testing the
accuracy of reporting can be important. One might consider enhancing collection of such
events by using observational methods via the smartphone to predict likely times when an
activity is occurring and to signal to the individual asking whether an event is occurring.
For instance, if tracking consumer commuting activities, one could track whether the
smartphone is leaving the home and alarm the individual to complete a diary entry.
Limitations and future research
This paper presents a first assessment of the accuracy of mobile diaries in a marketing context as
well as empirically-based guidance on how to design mobile diaries. While it uses large scale
data, it has several shortcomings which should be addressed in further research. First, the study
was designed in the context of TV viewing, and some findings might be limited to this context.
Future studies can help to more confidently generalize these findings to other domains. Second,
Marketing Science Institute Working Paper Series 34

the study is largely descriptive. Although we used randomized assignment to assess the effect of
alarms, we did not conduct experiments to isolate the other design factors. Third, some aspects
such as incentives or duration were not varied at all. In these cases, our positive findings serve as
an existence proof, and based on our findings, we speculate, for instance, that longer studies are
feasible as long as incentives are maintained throughout. Fourth, we believe the pulsing
phenomenon in particular needs further investigation. We identify the potential issue of pulsing
and find it present, but not too severe, in our data. Solving this issue could greatly increase the
value of mobile diaries for individual-level data collection. Hence, future research could pursue
evaluating the ubiquity, causes, and effects of pulsing.
Marketing Science Institute Working Paper Series 35
References
Adams, Swann Arp, Charles E. Matthews, Cara B. Ebbeling, Charity G. Moore, Joan E.
Cunningham, Jeanette Fulton, and James R. Hebert (2005), "The effect of social desirability
and social approval on self-reports of physical activity", American journal of
epidemiology 161 ( 4), 389-398.
Bolger, Niall, Angelina Davis, and Eshkol Rafaeli (2003), "Diary methods: Capturing life as
it is lived", Annual review of psychology 54 (1), 579-616.
Boyer, Peter J (1987), "TV turning to people meters to find who watches what". The New
York Times, (June 1).
Broderick, Joan E. (2008), "Electronic Diaries", Pharmaceutical medicine, 22 (2), 69-74.
Carter, Bill (1990) "The media business: Television; are there fewer viewers? Networks
challenge Nielsen", The New York Times (April 30).
———,Emily Steel (2014) "TV ratings by Nielsen had errors for months", The New York
Times (October 10).
Chen, Yubo, Qi Wang, and Jinhong Xie (2011) "Online Social Interactions: A Natural
Experiment on Word of Mouth Versus Observational Learning", Journal of Marketing
Research, 48 (2), 238-254.
Collins, R. Lorraine, Todd B. Kashdan, and Gernot Gollnisch. (2003) "The feasibility of
using cellular phones to collect ecological momentary assessment data: Application to alcohol
consumption." Experimental and clinical psychopharmacology 11 (1), 73.
Cooke, Alan D. and Peter P. Zubcsek (2015), “The Promise and Peril of Behavioral Research
on Mobile Devices” Working paper, University of Florida.
Danaher, Peter J., and Terence W. Beed (1993), "A coincidental survey of people meter
panelists: comparing what people say with what they do." Journal of Advertising
Research, 33 (1), 86-92.
Marketing Science Institute Working Paper Series 36
Deng, Yiting and Carl F. Mela (2014), "A Household Level Model of Television Viewing
with Implications for Advertising Targeting." Working paper.
Elliott, Richard and Nick Jankel-Elliott (2003),"Using ethnography in strategic consumer
research", Qualitative Market Research: An International Journal, 6 (4), 215 - 223
eMarketer, (2014), "US TV Ad Market Still Growing More than Digital Video. " (accessed
July 27, 2015),[available at http://www.emarketer.com/Article/US-TV-Ad-Market-Still-
Growing-More-than-Digital-Video/1010923].
Ephron, Erwin (1997), "Forum: how to curb TV’s sweeps ratings game: buyers can ease the
problem without foisting costs on stations", Advertising Age (February 3-).
Ericsson (2013), "TV and Media – Identifying the needs of tomorrow's video consumers",
Company Report, Ericson Consumer Lab, Ericsson.
Fawcett, Tom (2006), "An introduction to ROC analysis", Pattern recognition letters, 27(8),
.861-874
Heinonen, Reetta, Riitta Luoto, Pirjo Lindfors, and Clas-Håkan Nygård (2012), "Usability
and feasibility of mobile phone diaries in an experimental physical exercise
study", Telemedicine and e-Health 18 (2), 115-119.
Hensel, Devon J., James D. Fortenberry, Jaroslaw Harezlak, and Dorothy Craig (2012), "The
feasibility of cell phone based electronic diaries for STI/HIV research."BMC medical
research methodology, 12 (75), 1-12.
Kahn, Barbara E., Manohar U. Kalwani and Donald G. Morrison (1986), "Measuring
Variety-Seeking and Reinforcement Behaviors Using Panel Data", Journal of Marketing
Research, 23 (2), 89-100.
Keller, Ed, and Brad Fay (2012), The Face-To-Face Book, New York: Free Press.
Lin, Ying-Ching, and Chiu-chi Angela Chang (2012), "Double Standard: The Role of
Environmental Consciousness in Green Product Usage", Journal of Marketing, 76 (5), 125-
134.
Marketing Science Institute Working Paper Series 37
Lee, Eunkyu, Michael Y. Hu and Rex S. Toh (2000), "Are Consumer Survey Results
Distorted? Systematic Impact of Behavioral Frequency and Duration on Survey Response
Errors", Journal of Marketing Research, 37 (1), 125-133.
Lovett Mitchell J., Renana Peres and Ron Shachar (2013), "On Brands and Word of Mouth".
Journal of Marketing Research, 50 (4) 427-444.
Matthews, Mark, Gavin Doherty, John Sharry, and Carol Fitzpatrick (2008). "Mobile phone
mood charting for adolescents." British Journal of Guidance & Counselling, 36 (2), 113-129.
McKenzie, John (1983). "The accuracy of telephone call data collected by diary methods."
Journal of Marketing Research, 20 (4), 417-427.
Milavsky, J. Ronald (1992), "How good is the AC Nielsen people-meter system? A review of
the report by the committee on nationwide television audience measurement", Public Opinion
Quarterly, 56 (Spring), 102-115.
Napoli, Philip M. (2005) "Audience measurement and media policy: Audience economics,
the diversity principle, and the local people meter." Communication Law and Policy, 10 (4)
349-382.
Nielsen (2009), "A Close Look at Out-Of-Home Viewing," Company Report.
——— (2014a), "Mobile Millennials: Over 85% of Generation Y Owns Smartphones,"
Company Report (September 5).
——— (2014b), "National TV Toolbox User Guide Version 7.1," Company Report, revised
08/24/2014.
——— (2014c), "Nielsen Measures 7-9% Ratings Lift From Out-Of-Home TV Test in
Chicago," (accessed July 27, 2015), [available at http://www.nielsen.com/us/en/press-
room/2014/nielsen-measures-7-9-percent-ratings-lift-from-out-of-home-tv-test-in-
chicago.html].
Nielsen (2015) An interview of the authors with Christine Pierce, SVP of Data Science at
Nielsen, October 2, 2015, 3:30-4:15.
Marketing Science Institute Working Paper Series 38
Nonis, Sarath A., Melodie J. Philhours, and Gail I. Hudson (2006) "Where does the time go?
A diary approach to business and marketing students’ time use."Journal of Marketing
Education, 28 (2), 121-134.
Powers, David M.W. (2011), "Evaluation: from precision, recall and F-measure to ROC,
informedness, markedness and correlation," International Journal of Machine Learning
Technology, 2 (1), 37-63
Patterson, Anthony (2005) "Processes, relationships, settings, products and consumers: the
case for qualitative diary research" Qualitative Market Research: An International Journal, 8
(2), 142-156.
Proudfoot, Judith, Gordon Parker, Dusan Hadzi Pavlovic, Vijaya Manicavasagar, Einat Adler,
and Alexis Whitton (2010). "Community attitudes to the appropriation of mobile phones for
monitoring and managing depression, anxiety, and stress." Journal of medical Internet
research, 12 (5).
Reis, Harry T., Shelly L. Gable and Michael R. Maniaci (2014), "Methods for studying
everyday experience in its natural context," in Handbook of research methods in social and
personality psychology, Harry T. Reis and Charls M. Judd, eds. New-York: Cambridge
University Press, 373.
Rönkä, Anna, Kaisa Malinen, Ulla Kinnunen, Asko Tolvanen, and Tiina Lämsä (2010),
"Capturing daily family dynamics via text messages: development of the mobile diary."
Community, Work & Family, 13 (1), 5-21.
Sharot, Trevor (1991), "Attrition and Rotation in Panel Surveys", Journal of the Royal
Statistical Society Series D (The Statistician), 40 (3), 325-331
Shiffman, Saul, Arthur A. Stone, and Michael R. Hufford (2008) "Ecological momentary
assessment." Annual Review of Clinical Psychology, 4, 1-32.
Smith, Aaron (2015). "US Smartphone Use in 2015"(accessed July 27, 2015), [available at
http://www.pewinternet.org/files/2015/03/PI_Smartphones_0401151.pdf]
Stadd, Allison (2013), "79% Of People 18-44 have Their Smartphones with Them 22 Hours a
Day", (accessed July 27, 2015), [available at
http://www.adweek.com/socialtimes/smartphones/480485].
Marketing Science Institute Working Paper Series 39
Stone, A. A., Shiffman, S., Schwartz, J. E., Broderick, J. E., & Hufford, M. R. (2003).
"Patient compliance with paper and electronic diaries." Controlled Clinical Trials 24, 182-
199.
Sudman, Seymour, and Robert Ferber (2011) Consumer panels. Chicago: Marketing Classics
Press.
Toh, Rex S., and Michael Y. Hu (2009) "Toward a General Theory of Diary Panels
" Psychological reports, 105 (3), 1131-1153.
Uzma, Khan, Meng Zhu, and Ajay Kalra (2011) "When trade-offs matter: The effect of
choice construal on context effects." Journal of Marketing Research, 48(1), 62-71.
Wind, Yoram, and David Lerner (1979), "On the measurement of purchase data: surveys
versus purchase diaries", Journal of Marketing Research, 16 (1), 39-47.
Winer, Russell S. (1983), "Attrition bias in econometric models estimated with panel
data." Journal of Marketing Research, 20 (2), 177-186.
Zhang, Yao, Eric T. Bradlow, and Dylan S. Small (2013), "New measures of clumpiness for
incidence data." Journal of Applied Statistics, 40 (11), 2533-2548.
Marketing Science Institute Working Paper Series 40

Table 1: Reporting statistics (42,380 respondent-reporting days).
Table 2: Accuracy measures for alarmed vs. non alarmed time periods.
Alarmed Non-Alarmed Difference (p-value)
% Recall 73.7% 57.6% 16.1% (<.001)
% False Positive Rate 9.8% 1.0% 8.8% (<.001)
% Precision 91.7% 98.3% -6.6% (.005)
% False Omission Rate 29.8% 30.4% -0.6% (0.93)
Note: Sample is the half-hours that can be identified as alarmed (n=654) or not (n=598), where the
difference in size arises from greater technical difficulties in identifying late vs. early alarmed cases.
Mean
Standard deviation Minimum Maximum
Number of days in the diary (per respondent) (date of last report - date of first report) 27.7 8.3 14 46
Total reports (per respondent) 101.7 72.5 10 1031
Number of viewing reports (per respondent) 42.2 34.3 0 466
Number of days with at least one report (per respondent) 24.9 7.8 7 46
Number of days with at least 1 viewing report (per respondent) 17.8 8.7 0 42
Number of daily reports (per respondent reporting day) 4.1 3.2 1 101
Number of daily viewing reports (per respondent reporting day) 1.7 1.8 0 57
Marketing Science Institute Working Paper Series 41

Table 3: Accuracy measures for smartphone vs. non-smartphone owners
Smartphone owners
Non-smartphone owners
Difference (p-value)
% Recall 63.7% 69.5% 5.7% (<.001)
% False Positive Rate 8.5% 3.8% 4.7% (<.001)
% Precision 91.9% 96.5% 4.6% (<.001)
% False Omission Rate 37.4% 32.6% 4.8% (.007)
Table 4: Match of diary reports to people meter, n=3,927 entries for 151 respondents.
Category
% of reports of metered-diary group
1 Matching NPM record (on TV) 66.8%
2 Diary viewing not on metered TV 5.3%
3 No Matching NPM record (on TV) 27.9%
Marketing Science Institute Working Paper Series 42

Table 5: Main findings and design implications
Topic Empirical finding Design implications
Reporting activity levels
92% of the panelists completed 21 days of reporting. Reporting levels were consistent with activity levels even in post-incentive period.
1. Long (3-6 week) mobile diary studies are feasible with panelists maintaining high compliance.
Reporting activity pattern
Reporting exhibits "random" pulsing. On some days respondents provide more comprehensive reports of their activity than on other days; on some days they do not report at all but do watch TV. Diary reporting is "lumpier" than viewing, but no systematic pattern was found in who pulses or when pulsing occurs.
1. Pretest to see whether pulsing exists in the specific context, and whether it shows a systematic pattern. 2. Match alarming to natural reporting ebb to reduce pulsing. 3. Individual-level data may have missing data at random at the daily level.
Accuracy Individual-level accuracy shows Precision is 93% and Recall is 65%. Neither error is overly concentrated in a small number of individuals and the two types of errors are not correlated within individual.
1. Qualifying completes on reporting levels over a longer window appears to work. 2. Such qualification limits the concentration of errors so that all respondents are useable.
Length of activity
Longer viewing increases Recall. Viewings less than four minutes have below 30% Recall and 24-minute viewings have 77% Recall.
1. Mobile diaries might not be as accurate for capturing short activities as long activities. Pretests should check how effectively short activities are captured. 2. If calculating total length of activity, need to calibrate from self-reported activities to total activity duration.
Alarms Alarms improve Recall with only a small increase in False Positives. Alarmed prime time periods show 16 percentage points higher Recall than non-alarmed prime time periods. Of all responses, 33.7% are self-initiated.
1. Alarm regularly during times of day the focal activities are frequently observed. 2. Allow self-initiated entries to capture activities during non-alarmed times. 3. Pretest to evaluate how many alarms are feasible without severe fatigue and drop-out.
Study length and incentives
Reporting activity and accuracy remain high for incentivized period. Of respondents, 39% completed at least one full extra week, but accuracy slightly decreases after the incentivized period. Post-incentive volunteers differ demographically and have higher activity levels than non-volunteers.
1. Long (over 3 weeks) mobile diary studies are feasible, incurring only minor fatigue. 2. Keep incentivizing for the entire study length to obtain high participation, representativeness, and accuracy.
Smartphone ownership
Non-smartphone owners belong more to the youngest and oldest age groups, and have fewer respondents from ethnic minorities, but activity levels do not differ from smartphone owners. Non-smartphone owners have a slightly higher accuracy than smartphone owners.
1. Non-owners perform mobile diary tasks and are more accurately. 2. Including non-smartphone owners may not be necessary for accuracy. Pretest whether non-smartphone owners differ from owners in generating reporting and accuracy.
Marketing Science Institute Working Paper Series 43
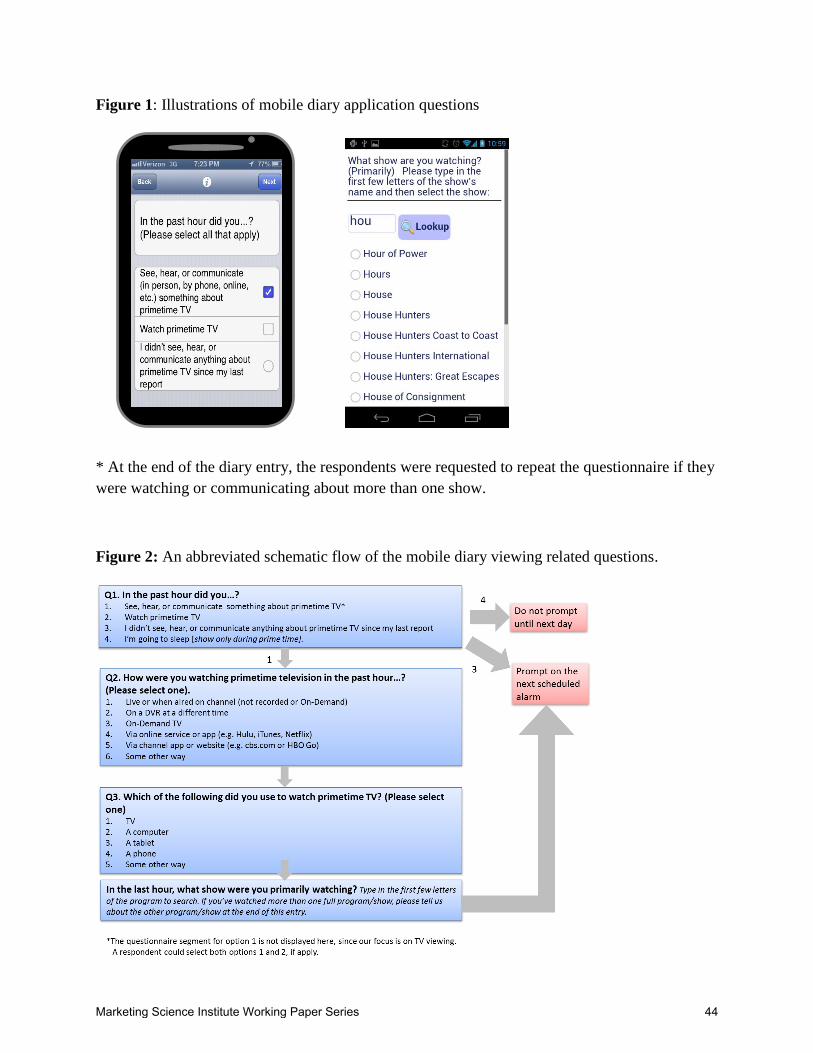
Figure 1: Illustrations of mobile diary application questions
* At the end of the diary entry, the respondents were requested to repeat the questionnaire if they
were watching or communicating about more than one show.
Figure 2: An abbreviated schematic flow of the mobile diary viewing related questions.
Marketing Science Institute Working Paper Series 44
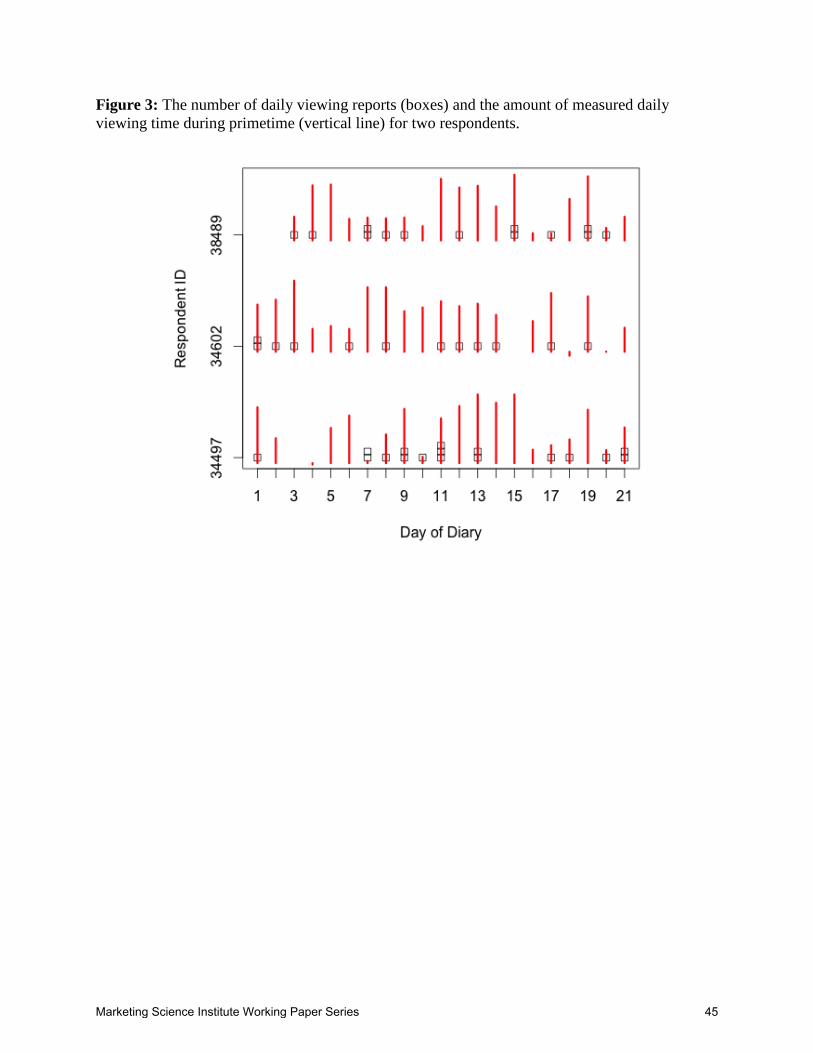
Figure 3: The number of daily viewing reports (boxes) and the amount of measured daily
viewing time during primetime (vertical line) for two respondents.
Marketing Science Institute Working Paper Series 45
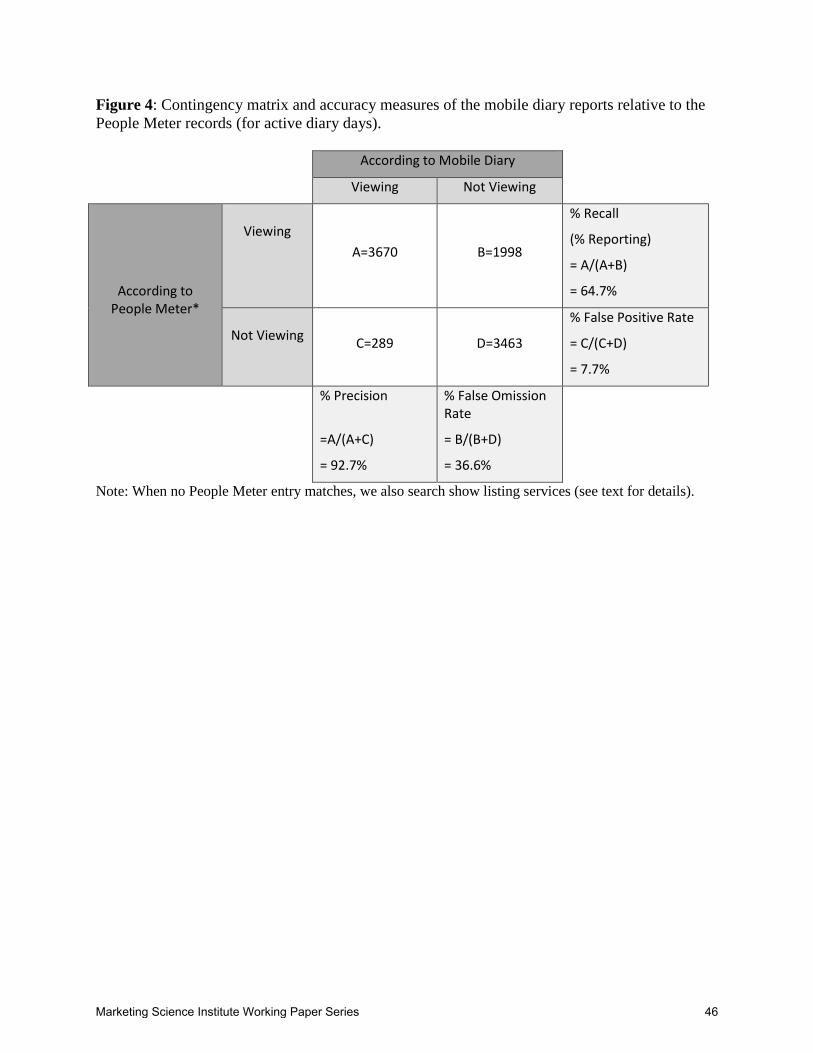
Figure 4: Contingency matrix and accuracy measures of the mobile diary reports relative to the
People Meter records (for active diary days).
According to Mobile Diary
Viewing Not Viewing
According to People Meter*
Viewing
A=3670
B=1998
% Recall
(% Reporting)
= A/(A+B)
= 64.7%
Not Viewing
C=289
D=3463
% False Positive Rate
= C/(C+D)
= 7.7%
% Precision
=A/(A+C)
= 92.7%
% False Omission Rate
= B/(B+D)
= 36.6%
Note: When no People Meter entry matches, we also search show listing services (see text for details).
Marketing Science Institute Working Paper Series 46
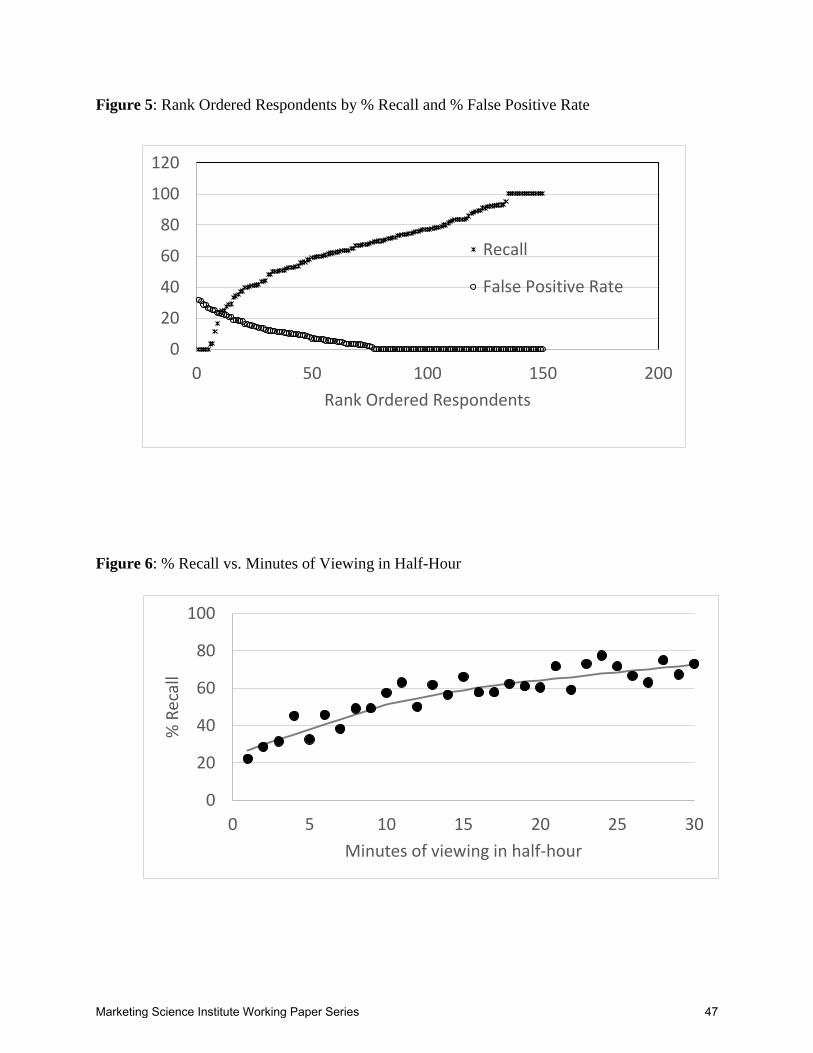
Figure 5: Rank Ordered Respondents by % Recall and % False Positive Rate
Figure 6: % Recall vs. Minutes of Viewing in Half-Hour
0
20
40
60
80
100
120
0 50 100 150 200
Rank Ordered Respondents
Recall
False Positive Rate
0
20
40
60
80
100
0 5 10 15 20 25 30
% R
ecal
l
Minutes of viewing in half-hour
Marketing Science Institute Working Paper Series 47

Figure 7: Average People Meter (bars with vertical black lines for +/- 2 standard errors) vs.
reporting (solid line) percentages per respondent by tenure in study
Figure 8: % Recall and % False Positive Rate vs. week in diary
0
5
10
15
20
25
1 2 3 4 5 6
Perc
ent
of
per
res
po
nd
ent
rep
ort
/pro
gram
vie
wed
Week in Diary
NPM Mean
Diary Mean
0
20
40
60
80
100
1 2 3 4 5 6 7
Week in Diary
Percent Recall Percent False Positive
Marketing Science Institute Working Paper Series 48
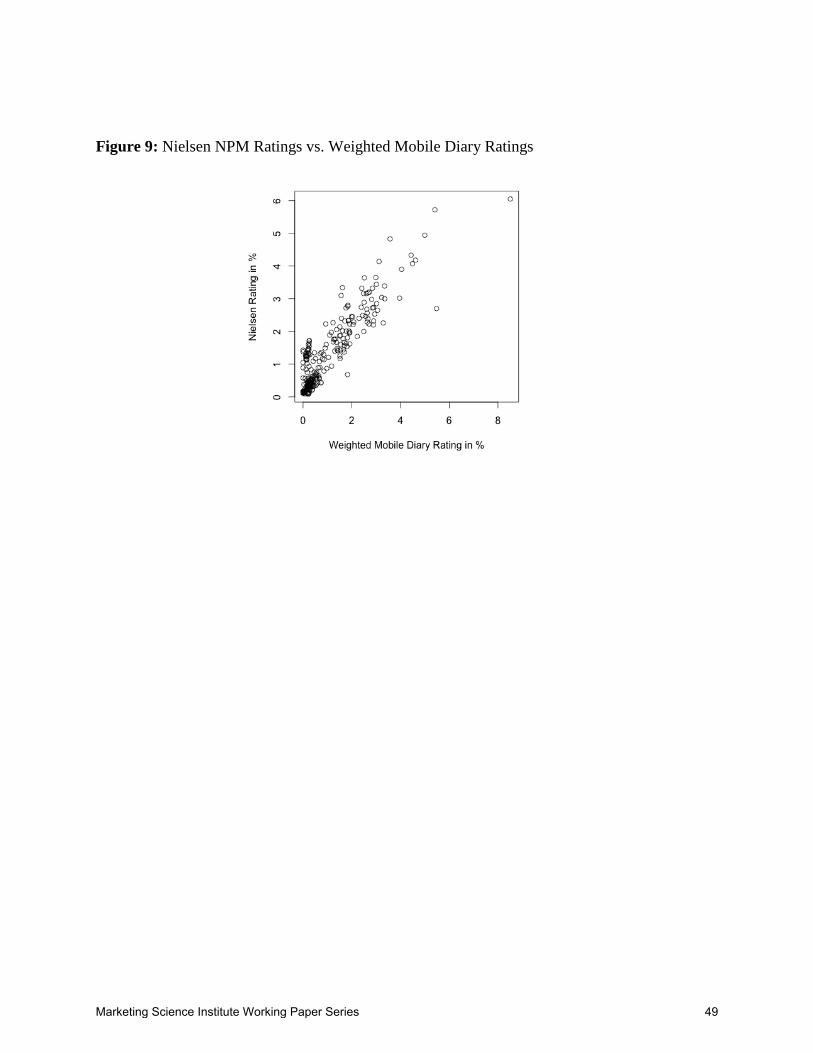
Figure 9: Nielsen NPM Ratings vs. Weighted Mobile Diary Ratings
Marketing Science Institute Working Paper Series 49
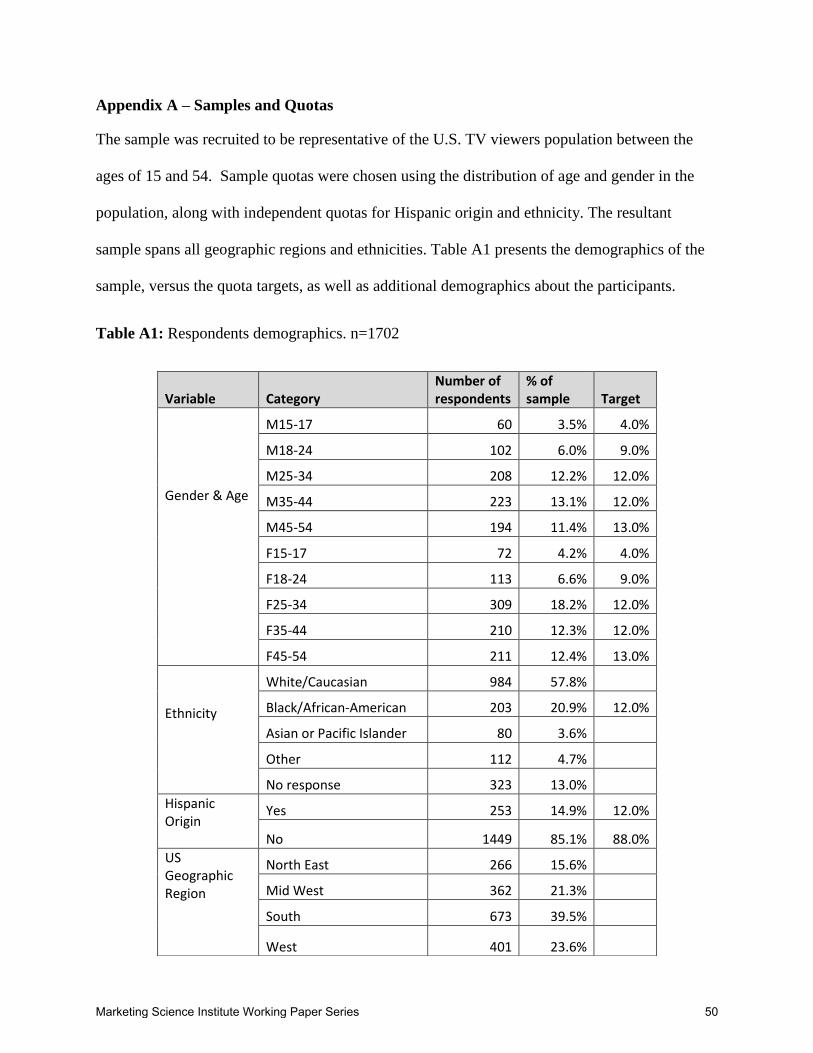
Appendix A – Samples and Quotas
The sample was recruited to be representative of the U.S. TV viewers population between the
ages of 15 and 54. Sample quotas were chosen using the distribution of age and gender in the
population, along with independent quotas for Hispanic origin and ethnicity. The resultant
sample spans all geographic regions and ethnicities. Table A1 presents the demographics of the
sample, versus the quota targets, as well as additional demographics about the participants.
Table A1: Respondents demographics. n=1702
Variable Category Number of respondents
% of sample Target
Gender & Age
M15-17 60 3.5% 4.0%
M18-24 102 6.0% 9.0%
M25-34 208 12.2% 12.0%
M35-44 223 13.1% 12.0%
M45-54 194 11.4% 13.0%
F15-17 72 4.2% 4.0%
F18-24 113 6.6% 9.0%
F25-34 309 18.2% 12.0%
F35-44 210 12.3% 12.0%
F45-54 211 12.4% 13.0%
Ethnicity
White/Caucasian 984 57.8%
Black/African-American 203 20.9% 12.0%
Asian or Pacific Islander 80 3.6%
Other 112 4.7%
No response 323 13.0%
Hispanic Origin
Yes 253 14.9% 12.0%
No 1449 85.1% 88.0%
US Geographic Region
North East 266 15.6%
Mid West 362 21.3%
South 673 39.5%
West 401 23.6%
Marketing Science Institute Working Paper Series 50
Overall, the sample matches quite well with age-gender quotas excepting ages 18-24,
which are under-represented and women 25-34, which are over-represented. The sample percent
of African-Americans is also higher than the target. However, in general, the sample is quite
reasonable. Sample weights were constructed by the panel provider to adjust the small
discrepancies in demographics to be nationally representative on age, gender, education,
Hispanic, African Americans, and geographic region. We use these weights when comparing the
mobile diary to the aggregate NPM data.
We note that the study also included oversampling a group of respondents referred to as
"superconnectors" because their general usage of social media related to TV programming was
higher than average. This over-sampling of superconnectors was not drawn from the metered-
diary group, so that it does not affect our primary analyses here. Further, in constructing the
sample weights, this disproportionate sampling was addressed by underweighting these
individuals and overweighting the non-superconnectors.
We also note that because in our study dropout was virtually non-existent for the
incentivized period, we were not concerned with comparing the sample over the incentivized
period. However, in general, this can be a concern for longitudinal studies like ours (see Toh and
Hu 2009).
Sample of Non-Smartphone Owners
In Table A2 we present the demographics for the smartphone ownership vs. non-
ownership subgroups. For statistically significant differences, we find that non-smartphone
owners have significantly more men (58% vs. 44% of the smartphone owners), are more
concentrated in the youngest (15-17) and oldest (44-55) age groups, and have fewer African-
Americans. No significant differences were found in geographic regions or in Hispanic origin.
Marketing Science Institute Working Paper Series 51

Table A2: Respondents demographics for smartphone vs non smartphone owners. n=1702
Sample of Mobile Diary Respondents with People Meters (metered diary Group)
Although the pool of metered diary respondents was more limited in scope due to the limited
availability of tenured People Meter members, Nielsen recruited in order to have this group
demographically similar to the full sample. As Table A3 reports, the metered diary group has a
Variable Category
% of smartphone owners n=1386
% of non smartphone owners n=316
Gender & Age
M15-17 2% 9%
M18-24 6% 5%
M25-34 13% 8%
M35-44 13% 12%
M45-54 8% 24%
F15-17 3% 9%
F18-24 7% 3%
F25-34 21% 7%
F35-44 14% 6%
F45-54 11% 17%
Ethnicity
White/Caucasian 57% 60%
Black/African-American 13% 8%
Asian or Pacific Islander 5% 3%
Other 6% 8%
No response 19% 21%
Hispanic Origin
Yes 15% 16%
No 85% 84%
US Geographic Region
North East 16% 16%
Mid West 20% 25%
South 40% 35%
West 24% 24%
Marketing Science Institute Working Paper Series 52

larger proportion of women over 25, whites, and Western geography, and a smaller proportion of
young men relative to the full sample. None of these differences, however, are statistically
significant.
Table A3: Respondents demographics, the metered Diary sub-sample. n =151.
Variable Category Number of respondents
% of sample
Target
Gender & Age
M15-17 1 0.68% 4.0%
M18-24 2 1.37% 9.0%
M25-34 17 11.64% 12.0%
M35-44 18 12.33% 12.0%
M45-54 14 9.59% 13.0%
F15-17 1 0.68% 4.0%
F18-24 4 2.74% 9.0%
F25-34 30 20.55% 12.0%
F35-44 28 19.18% 12.0%
F45-54 31 21.23% 13.0%
Ethnicity
White/Caucasian 119 81.51%
Black/African-American
11 7.53% 12.0%
Asian or Pacific Islander
8 5.48%
Other 8 5.48%
Hispanic Origin
Yes 20 13.70% 12.0%
No 126 86.30% 88.0%
US Geographic Region
North East 23 15.8%
Mid West 20 13.7%
South 55 37.7%
West 48 32.9%
Sample of Mobile Diary Respondents who continued after 21 days
Of all respondents, 61.5% kept reporting for more than the incentivized 21 reporting days. It is of
interest to compare the demographics of this group to those who completed 21 days or less. The
Marketing Science Institute Working Paper Series 53

statistically significant differences are in gender, with 65% of the females continue for more than
21 days vs only 57% of the males. Also, panelists from the two youngest age groups tend not to
go over the 21 days. No other significant differences were found.
Table A4: Respondents demographics, comparing those who completed 21 reporting days or
less to those with more than 21 reporting days. n=1702.
Variable Category % of <=21 days n=654
% of > 21 days n=1048
Gender & Age
M15-17 4% 3%
M18-24 9% 4%
M25-34 14% 11%
M35-44 14% 13%
M45-54 10% 12%
F15-17 5% 4%
F18-24 8% 6%
F25-34 16% 19%
F35-44 9% 14%
F45-54 10% 14%
Ethnicity
White/Caucasian 57% 58%
Black/African-American 11% 13%
Asian or Pacific Islander 5% 4%
Other 6% 7%
No response 21% 18%
Hispanic Origin Yes 13% 16%
No 87% 84%
US Geographic Region
North East 16% 16%
Mid West 22% 21%
South 37% 41%
West 25% 23%
Marketing Science Institute Working Paper Series 54

Appendix B – Accuracy measures for additional subsets of the data
The accuracy measures in the results section were calculated for active diary days where diary
entries with no People Meter records are considered as true positives if (1) they are reported as
live viewing and when evaluated against program listings they match a live airing or (2) they are
reported as viewed in a way not measured by the people meter (e.g. not on TV). The numbers
show reasonably high level of Precision and Recall and relatively low level of errors.
For completeness, we present here the accuracy measures for two additional cases. The
leftmost column in the table below displays the results including all the primetime reports, both
from active and non-active days. The middle column displays accuracy including only reports
from active days, where all diary entries with no matching People Meter records are counted as
false positives, and the rightmost column is the one used in the paper and presented in Figure 4.
To explain better the switch from the middle column to the rightmost column, we focus
our attention on cell C, for which the People Meter indicates no viewing, but the respondent
reports viewing in the diary during prime time hours. For the full data, the number of reports in
All data Active days all non-matches are false positive
Active days +refinement of false positives
A. True Positive 3035 3023 3670
B. False Negative 3363 1998 1998
C. False Positive 936 936 289
D. True Negative 8467 3463 3463
% Recall 47.4% 60.2% 64.7%
% False Positive Rate 10.0% 21.3% 7.7%
% Precision 76.4% 76.4% 92.7%
% False Omission Rate 23.6% 36.6% 36.6%
Marketing Science Institute Working Paper Series 55

this cell is 936. However, when looking at the diary entries, we can see that most of these should
not be considered as false positives. First, approximately 14.4% of the diary reports in this cell
were reported by respondents as either not viewed on TV or were not viewed on TV in a way
that the People Meter registers. In either case, this viewing is not necessarily “incorrect,” and,
though we have no other data to further validate this viewing, on the surface it seems very likely
to be valid. Second, for live viewing reports, we compare the diary programs against the Tribune
listings of telecasts (and also use online sources for missing data). Although finding a
corresponding airing does not ensure the individual was in fact watching, again on the surface,
the viewing report seems very likely to be valid. We find that 75.9% of these live viewing cases
have a corresponding program airing for the same time window, and these programs account for
79.2% of the live viewing half-hours. This high percentage suggests that the People Meter may
be missing a meaningful proportion of viewing. Unfortunately, we do not have a similar way to
verify the delayed viewing cases, so in the refinement of cell C, we simply keep as false
positives these delayed viewing cases without matching People Meter records. This assumption
is likely to produce a conservative measure of our accuracy.
Marketing Science Institute Working Paper Series 56