Incorporation of Carbon Footprint Estimates into Remedial Alternatives Evaluations

Département de GéographieDépartement de GéographiePlace Pasteur 3, 1348 LouvainPlace Pasteur 3, 1348 Louvain --LaLa--Neuve, BelgiqueNeuve, Belgique
Airborne Imaging Spectroscopy Workshop, Bruges, 8 October 2004
In collaboration with:
Can Can hyperspectral hyperspectral techniques techniques
improve estimates improve estimates of of carbon carbon
stocks in agricultural stocks in agricultural soilssoils??A. Stevens
B. van Wesemael, S. Touré,
G. Vandenschrick & B. Tychon
A. Stevens - Department of Geography, U.C.L. - Airborne Imaging Spectroscopy Workshop, Bruges, 8 October 2004
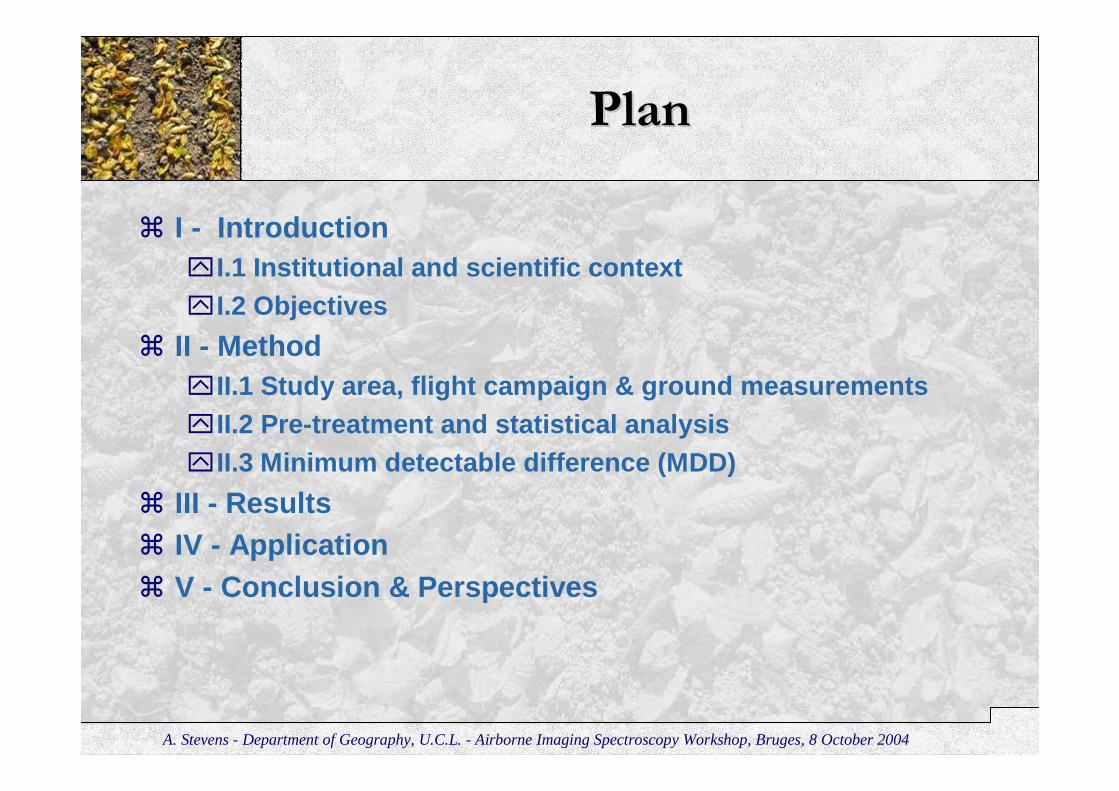
PlanPlan
� I - Introduction�I.1 Institutional and scientific context�I.2 Objectives
� II - Method�II.1 Study area, flight campaign & ground measureme nts �II.2 Pre-treatment and statistical analysis�II.3 Minimum detectable difference (MDD)
� III - Results� IV - Application� V - Conclusion & Perspectives

A. Stevens - Department of Geography, U.C.L. - Airborne Imaging Spectroscopy Workshop, Bruges, 8 October 2004
I I -- IntroductionIntroduction1.1. InstitutionalInstitutional & & scientific contextscientific context
� Kyoto Protocol, art. 3.3 et 3.4�Land use change and agriculture = most important car bon
source before industrial revolution� Soils constitute a major global carbon pool (2000 PgC = 4 x
carbon in the vegetation pool).�There is a potential of sequestration in soils, using
improved management options and land use change. �Soil Organic Carbon (SOC) sequestration is a cost effe ctive
strategy that could satisfy at least a part of the Ky otocommitments
� Ancillary benefits: SOC improves soil quality &biodiversity
1

A. Stevens - Department of Geography, U.C.L. - Airborne Imaging Spectroscopy Workshop, Bruges, 8 October 2004
I I -- IntroductionIntroduction1.1. InstitutionalInstitutional && scientific contextscientific context
� Soil C sequestration studies:�High spatial variability of SOC�Slow response of SOC upon land use conversion�Differences between treatments have to be statistic ally
significant�Need a large amount of samples to detect small change s
�Difficult to assess the impact of land use or management change
� Under-sampling
2

A. Stevens - Department of Geography, U.C.L. - Airborne Imaging Spectroscopy Workshop, Bruges, 8 October 2004
I I -- IntroductionIntroduction2. Objectives2. Objectives
� Contribute to the calibration and validation of hyperspectral techniques to measure SOC stocks of arable soils in Belgium
� Evaluate the potential of airborne hyperspectral (C ASI) and portable NIR techniques (ASD Fieldspec Pro) to conduct SOC inventories
3

A. Stevens - Department of Geography, U.C.L. - Airborne Imaging Spectroscopy Workshop, Bruges, 8 October 2004
II II -- MethodMethod1.a1.a Study areaStudy area
� First study area :�35 km 2, near La
Roche-en-Ardennes�Silty, shallow, stony
soils�Croplands consist
mainly of cereals (60%) and silage corn fields (30%)
� The second study area is located in the Belgian Jura.
4

A. Stevens - Department of Geography, U.C.L. - Airborne Imaging Spectroscopy Workshop, Bruges, 8 October 2004
II II -- MethodMethod1.b Flight 1.b Flight campaign campaign & & ground measurementground measurement
� 13 parcels, freshly tilled, were sampled
� 138 soil samples taken and analyzed:carbon (Walkley-Black) and moisture(gravimetric & ThetaProbe)
5

A. Stevens - Department of Geography, U.C.L. - Airborne Imaging Spectroscopy Workshop, Bruges, 8 October 2004
II II -- MethodMethod1.b1.b Flight Flight campaigncampaign && ground measurementground measurement
� Another data set wasanalyzed, from aprevious flight campaign conducted by the FUL & covering a wider spectral range (CASI+SASI sensors : 444 to 2500 nm)
6
� 121 soil spectra (ASD) were taken by the VITO team. ASD ranges from 350 to 2500 nm
� Airborne hyperspectral data was acquired from the CASI -2 (405 to 950 nm). The flight took place on a clear and windy day, in October 2003

A. Stevens - Department of Geography, U.C.L. - Airborne Imaging Spectroscopy Workshop, Bruges, 8 October 2004
II II -- MethodMethod2.a2.a PrePre--treatmenttreatment
� Soil spectra were processed with Matlab to eliminate the noise and enhance the spectral response
� Different combinations of standard pre-treatment wer e applied on the 3 data sets (ASD, CASI, CASI+SASI).
-0.4
0
0.4
0.8
1.2
400 900 1400 1900 2400
Wavelength
Log
(1/R
)
(a)
(b)
(c)
(d)
Examples on CASI+SASI:
(a) without pre-treatment
(b) moving average
(c) moving average + gap derivative (1st)
(d) Savitsky-Golay algorithm (1st derivativeand smoothing)
7

A. Stevens - Department of Geography, U.C.L. - Airborne Imaging Spectroscopy Workshop, Bruges, 8 October 2004
II II -- Method Method 2.b 2.b Statistical analysisStatistical analysis
� Stepwise and Partial Least Square (PLS) Regressions were applied on each different (combination of) pre-treat ed data with SAS.
� Data sets were split randomly into one set of calibr ation (3/4) and one set of validation (1/4).
� Models were sorted according to SEC-to-SD ratio:�SEC is the Standard Error of Calibration, defined as t he SD of all
points from the reference values in the calibration set:
( )1
1
2
−
−=∑
n
valuevalueSEC
n
obspred
� Other useful statitstics were computed as well to asses sthe predictive ability of the models (Standard Error ofPrediction (SEP), Bias, r 2)
8
A. Stevens - Department of Geography, U.C.L. - Airborne Imaging Spectroscopy Workshop, Bruges, 8 October 2004
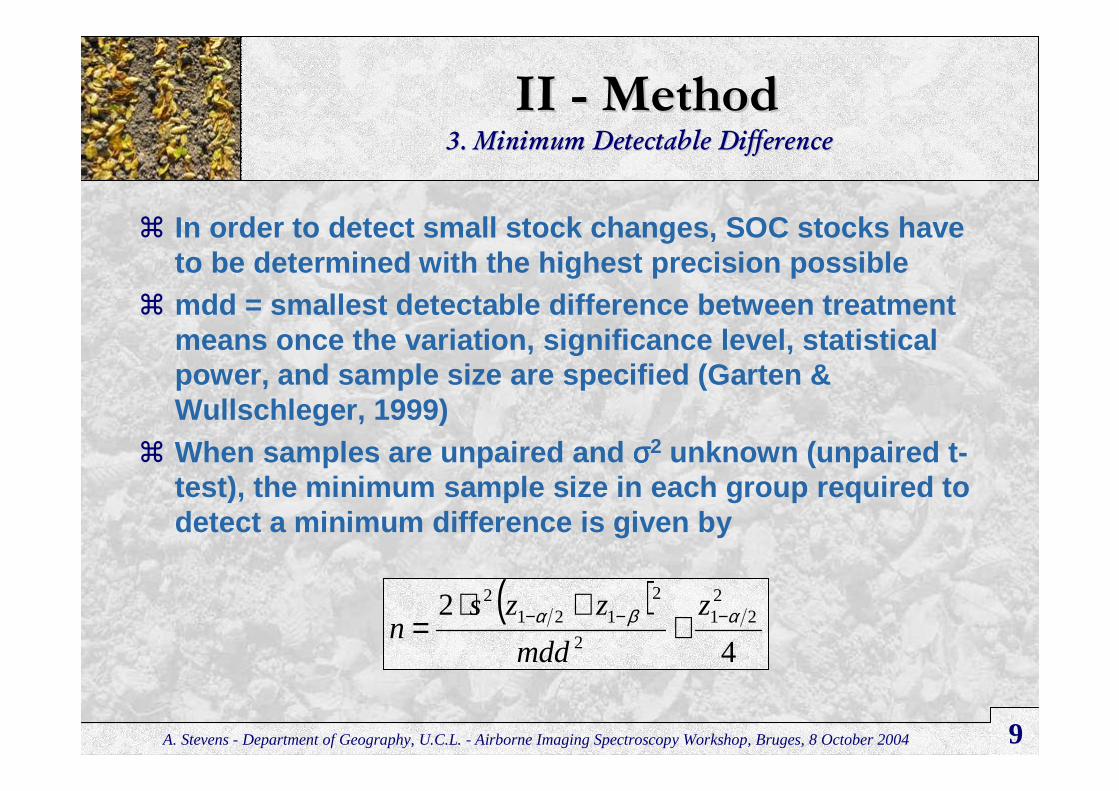
II II -- MethodMethod3. Minimum 3. Minimum Detectable DifferenceDetectable Difference
� In order to detect small stock changes, SOC stocks h ave to be determined with the highest precision possibl e
� mdd = smallest detectable difference between treatme nt means once the variation, significance level, stati stical power, and sample size are specified (Garten & Wullschleger, 1999)
� When samples are unpaired and σσσσ2 unknown (unpaired t-test), the minimum sample size in each group requir ed to detect a minimum difference is given by
( )4
2 221
2
2121
2αβα −−− +
+⋅=
z
mdd
zzsn
9

A. Stevens - Department of Geography, U.C.L. - Airborne Imaging Spectroscopy Workshop, Bruges, 8 October 2004
III III -- ResultsResults
� Soil moisture can disturb the spectral response of SOC. However, moisture measurements taken during the fieldcampaign did not represent actual moisture of the top of the layer
� ASD spectra were taken during 2 days (1 day beforeand after the flight) with 2 different topsoil moisture conditions. ASD spectrawere split into 2 data sets: ASD in ‘ wet ’ conditions and ASD in ‘ dry ’ conditions
10

A. Stevens - Department of Geography, U.C.L. - Airborne Imaging Spectroscopy Workshop, Bruges, 8 October 2004
III III -- ResultsResults
� Stepwise regression yielded good SEC but high SEP d ue to collinearity and over-fitting
� PLS models performed better than stepwise Calibration - Best treatment - ASD
2
2.5
3
3.5
2 2.5 3 3.5
Observed carbon (%)
Pre
dic
ted
car
bo
n (
%)
dry
wet
SEC = 0.01 ; SD = 0.36
SEC = 0.05 ; SD = 0.27
Validation - Best treatment - ASD
2
2.5
3
3.5
2 2.5 3 3.5
Observed carbon (%)
Pre
dic
ted
car
bo
n (
%)
dry
wet
SEP = 0.19 ; R^2 = 0.84 ; SEC-to-SD = 0.04 ; Bias = 0.0046
SEP = 0.23 ; R^2 = 0.59 ; SEC-to-SD = 0.17 ; Bias = -0.0261
11

A. Stevens - Department of Geography, U.C.L. - Airborne Imaging Spectroscopy Workshop, Bruges, 8 October 2004
III III -- ResultsResults
� SEP and SEC of CASI were too high to make reliablequantitative predictions of changes in SOC stocks
� CASI+SASI performed better than CASI aloneBest treatment - Validation - CASI+SASI
1
2
3
4
1 2 3 4
Predicted carbon (%)
Obs
erve
d ca
rbon
(%
)
SEP = 0.34 ; R^2 = 0.87 SEC-to-SD = 0.36 ; Bias = 0.0536
Best treatment - Calibration - CASI+SASI
1
2
3
4
1 2 3 4
Predicted carbon (%)
Obs
erve
d ca
rbon
(%
)
SEC = 0.23 ; SD = 0.63
12

A. Stevens - Department of Geography, U.C.L. - Airborne Imaging Spectroscopy Workshop, Bruges, 8 October 2004
III III -- ResultsResults
� Weights indicate where each PLS factor is projected : it shows which predictor is the most represented in ea ch factor
1st PLS factor - CASI+SASI
-0.3
-0.2
-0.1
0
0.1
0.2
400 900 1400 1900 2400
Wave length
X-w
eig
hts
� SEP appeared too high in comparison with SD to predict accurately carbon or to conduct precision farming studies
� Low Bias allowed the use of NIRS to estimate the mean of a population with confidence
� Calibration should be done simultaneously with the flight to monitor disturbing factors
13
A. Stevens - Department of Geography, U.C.L. - Airborne Imaging Spectroscopy Workshop, Bruges, 8 October 2004
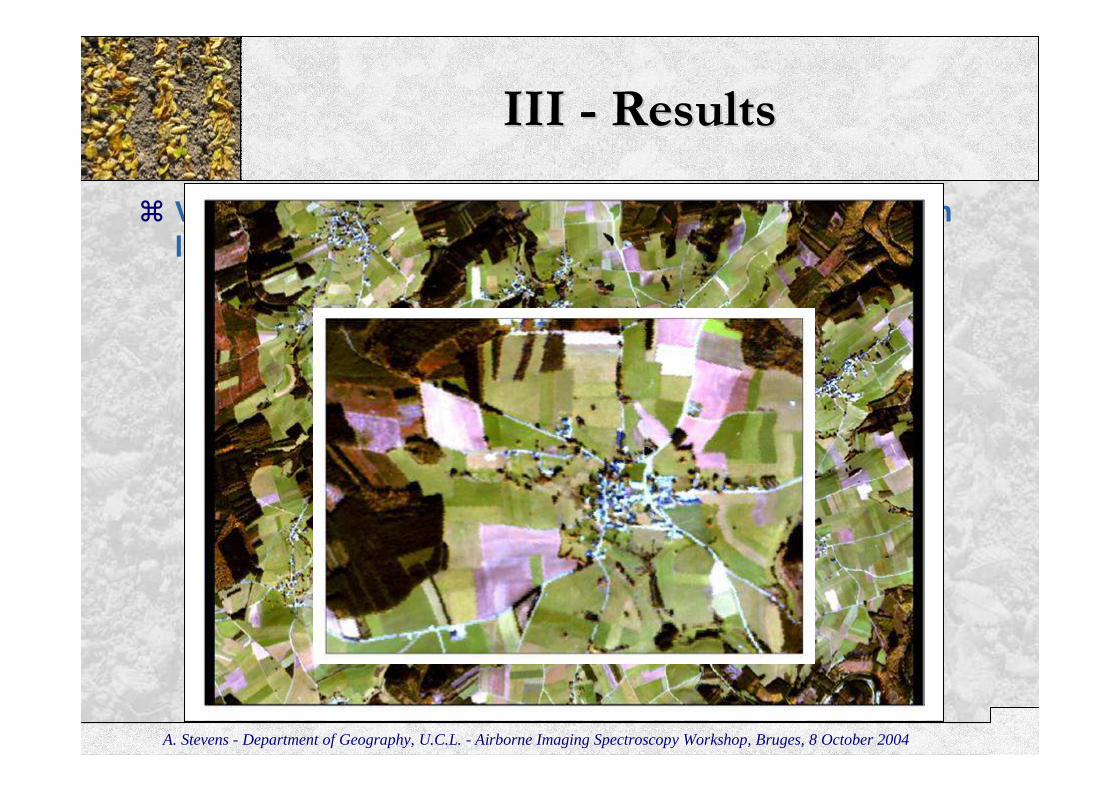
III III -- ResultsResults
� Visual analysis : difference in spectral signal agre e with land use change history

A. Stevens - Department of Geography, U.C.L. - Airborne Imaging Spectroscopy Workshop, Bruges, 8 October 2004
IV IV -- ApplicationApplication
14
ID N Variance Coeff. Var. MDD nA 7 11.83 0.03 5.55 8B 10 166.36 0.14 17.00 105C 11 21.24 0.06 5.76 14L 11 149.37 0.12 15.28 95M 11 52.20 0.08 9.03 34N 11 124.04 0.12 13.93 79O 11 21.05 0.07 5.74 14P 11 101.08 0.14 12.57 64Q 11 105.64 0.11 12.85 67R 11 113.09 0.12 13.30 72S 11 25.04 0.06 6.26 17T 11 91.26 0.12 11.95 58U 11 68.54 0.09 10.35 44ALL 121 148.58 0.14 4.41 94
� Soil sequestration studies have to cope with spatia l variability.�e.g. in the study area: intra-field variability of SOC content
is the same order of magnitude as the variability acr oss all fields
�It requires many samples to calculate significant d ifference in SOC stock
0.00
10.00
20.00
30.00
40.00
50.00
1 10 100 1000 10000
Sam ple s ize (n)
MD
D (
tC h
a)
MDD min
MDD max
MDD Ortho
Management change

A. Stevens - Department of Geography, U.C.L. - Airborne Imaging Spectroscopy Workshop, Bruges, 8 October 2004
IV IV -- ApplicationApplication
15
� Using conventional techniques, such sampling intensi ty can only be achieved on larger spatial units (considered ashomogeneous)
� Remote hyperspectral and portable NIR sensors are a ble to provide such amount of samples
� As the bias is close to zero, such techniques can b e used to estimate the population mean. However:�Calculations are based on classical statistical theory using
independent samples. Number of samples depends on th e distance at which SOC samples are related (range of the semivariogram)
�Valid only for arable soils ⌧need of bare soils⌧surface SOC represent the SOC of whole tillage layer (approx. 30
cm)

A. Stevens - Department of Geography, U.C.L. - Airborne Imaging Spectroscopy Workshop, Bruges, 8 October 2004
V V -- Conclusion & PerspectivesConclusion & Perspectives
� Portable NIRS is more accurate than hyperspectral r emote sensing
� ASD performed better when data was split in two cla sses representing soil surface moisture conditions
� Quantitative prediction should be done with caution but low bias allowed to estimate the population mean
� Spatial variability of SOC reduces the ability to det ect a change � Such techniques are able to provide large amount of sample
required to reduce the MDD� Pooling of the hyperspectral data and ground measure ments
with the FUL will enable to calibrate over a wider range of soils with more samples
16