Functional Literacy for All: “Making Schools Continuously Improve”
Can HRM Improve Schools’ Performance? Alex Bryson Lucy Stokes David Wilkinson
Department of Quantitative Social Science
Working Paper No. 18-01 Feb 2018

Disclaimer Any opinions expressed here are those of the author(s) and not those of the UCL Institute of Education. Research published in this series may include views on policy, but the institute itself takes no institutional policy positions. DoQSS Workings Papers often represent preliminary work and are circulated to encourage discussion. Citation of such a paper should account for its provisional character. A revised version may be available directly from the author. Department of Quantitative Social Science, UCL Institute of Education, University College
London,
20 Bedford Way, London WC1H 0AL, UK

3
Can HRM Improve Schools’ Performance? Alex Bryson1, Lucy Stokes2 and David Wilkinson3
Abstract
Evidence on schools’ performance is confined to comparisons across schools, usually based on value-added measures. We adopt an alternative approach comparing schools to observationally equivalent workplaces in the rest of the British economy using measures of workplace performance that are common across all workplaces. We focus on the role played by management practices in explaining differences in the performance of schools versus other workplaces, and performance across the schools’ sector. We find intensive use of HRM practices is correlated with substantial improvement in workplace performance, both among schools and other workplaces. However, the types of practices that improve school performance are different from those that improve performance elsewhere in the economy. Furthermore, in contrast to the linear returns to HRM intensity in most workplaces, improvements in schools’ performance are an increasing function of HRM intensity. JEL codes: I21 Keywords: School performance; Human resource management; Matching; first differences
Contact Details: Alex Bryson ([email protected]), University College London, National
Institute of Social and Economic Research and Institute for the Study of Labor
Acknowledgements: We thank the Nuffield Foundation (grant EDU/41926) for funding. We
also thank Simon Burgess, Francis Green and seminar participants at the University of Pisa
for valuable comments. The authors acknowledge the Department for Business, Energy and
Industrial Strategy, the Economic and Social Research Council, the Advisory, Conciliation
and Arbitration Service and the National Institute of Economic and Social Research as the
originators of the Workplace Employee Relations Survey data, and the Data Archive at the
University of Essex as the distributor of the data. All errors and omissions remain the sole
responsibility of the authors.
1 University College London, National Institute of Social and Economic Research and Institute for the Study of
Labor 2 National Institute of Social and Economic Research 3 University College London, National Institute of Social and Economic Research

4
1. INTRODUCTION
In recent decades, a large literature has emerged devoted to identifying factors
explaining variance in schools’ performance, as indicated by their ability to improve
pupil attainment, which is usually measured in terms of improvements in pupils’
academic achievements since joining the school (value added). The literature has
focused on factors amenable to government action, such as class size, teacher quality,
teachers’ salaries, pedagogic techniques, the nutritional intake of students and school
resources. The broader economic literature on factors affecting workplace and firm
performance has investigated a wide range of capital and labour inputs standard in
the production function literature but, in part motivated by remarkable within-industry
variance in performance, the factors under consideration have been extended to
include managerial practices, leadership skills and corporate governance. In these
literatures analysts tend to focus on profitability or performance metrics such as sales
growth which are applicable across much of the for-profit sector.
We contribute to the literature on schools’ performance by comparing them with the
performance of other workplaces in Britain using an index combining their financial
performance, labour productivity and quality of their services provided. The
comparisons control for potential confounding factors using regression, matching and
panel estimation techniques. First, we establish whether there are differences in the
performance of schools relative to other observationally equivalent workplaces, and
whether these persist over time, having conditioned on workplace traits which are
plausibly exogenous, such as their size and workforce composition. Second, we focus
on the choices schools and other workplaces make in terms of the managerial
practices they adopt and their style of management. We investigate how schools differ

5
from other workplaces in terms of the managerial practices they deploy and the
intensity of their Human Resource Management (HRM) systems. Third, we establish
whether specific HRM practices and overall HRM intensity measures relate to school
performance and the performance of other workplaces.
We find intensive use of HRM practices is correlated with substantial improvement in
workplace performance, both among schools and other workplaces. However, the
types of practices that improve school performance are different from those that
improve performance elsewhere in the economy. Furthermore, in contrast to the linear
returns to HRM intensity in most workplaces, improvements in schools’ performance
are an increasing function of HRM intensity.
The remainder of the paper is organized as follows. In Section Two we review the
literature on school performance briefly before focusing on the literature exploring links
between managerial practices and performance, and identify hypotheses to be tested
in the data. In Section Three we present the data and our estimation techniques before
presenting our results in Section Four and concluding in Section Five.
2. LITERATURE AND HYPOTHESES
A burgeoning literature examines attributes that may be linked to schools’
performance, as indicated by their ability to improve pupil attainment. School
performance is usually measured in terms of improvements in pupils’ academic
achievements since joining the school. Accurately identifying which schools are
performing better than others matters, not only because government wishes to

6
maximise the value of schooling to pupils but also because, in many countries schools
are ranked on performance metrics and parents and pupils seek to choose between
schools based on their relative merits. Countries are also judged on the relative quality
of their education systems using metrics that are harmonised across countries, such
as PISA (Programme for International Student Assessment) scores (Jerrim, 2016).
The schools’ literature focuses on factors amenable to government action, such as
class size (Jepsen, 2015), school resources (Jackson et al., 2016), teachers’ salaries
(Dolton and Marcenaro-Gutierrez, 2011), the nutritional intake of students (Anderson
et al., 2017), pedagogic techniques (Machin and McNally, 2008), teacher quality
(Slater et al., 2012) and school governance arrangements (Eyles and Machin, 2015).
However, this literature has been divorced somewhat from the wider literature on firm
and workplace performance which has investigated the role played by a broader range
of capital and labour inputs which augment the standard production function. This
wider economics literature is motivated by remarkable within-industry variance in
performance, even in very narrowly defined markets and industrial sectors (Syverson,
2011). Recently analysts have focused on choices made by firms in relation to factors
such as managerial practices (Bloom et al., 2014), leadership skills (Besley et al.,
2011) and corporate governance (Bhagat and Bolton, 2008). In these literatures
analysts tend to focus on profitability or performance metrics such as sales growth
which are applicable across much of the for-profit sector.
The literature on management tends to find positive associations between the number
of what they term “structured” management practices deployed and a range of
economic outcomes such as higher profitability, improved labour productivity and

7
lower closure rates (Bloom et al., 2017). Bloom et al. (2017) argue that this link is
plausibly causal and, using a range of quasi-experimental methods, find support for
this proposition among manufacturing establishments in the United States. They
demonstrate that there is substantial variance in the number of practices deployed
across manufacturing plants, even among those belonging to the same firm, and that
around a third of the dispersion in these practices is linked to a combination of
competition, business environment, the available supply of human capital, and
learning from the most productive workplaces in the locality. Bloom et al. (2017) focus
their attention on practices relating to worker monitoring, targets, and incentives, but
other studies using a broader array of management practices have also found positive
independent associations between the intensity with which management deploy
practices and workplace or firm performance (Appelbaum et al., 2000).
In a related literature, White and Bryson (2016) and Bryson and White (2013) find the
association between the use of management practices and employee job attitudes
that are conducive to improved workplace performance is curvilinear, with low-intensity
use of management practices lowering employee commitment and satisfaction,
whereas intensive use is linked to improved job attitudes. They argue that their finding
is consistent with Bowen and Ostroff’s (2004: 206) contention that management
practice systems perform a “symbolic or signalling function” requiring an intensive
system to alter employee behaviours and performance”. The u-shaped association
between management practice intensity and job attitudes like organizational
commitment and job satisfaction is consistent, they argue, with employers signalling
insincerity in their use of high-performance practices until they reach a threshold of
intensive usage.
8
This literature begs the question as to whether the management practices often
viewed as optimal for profit-maximising firms might have similar beneficial effects in
the not-for-profit sector. Underlying the practice intensity metric used to identify good
quality management in Bloom et al. (2017) is the assumption that the types of
management practices they focus on would be beneficial to any organization choosing
to adopt them and that the returns to their adoption will rise with the intensity with
which the organization invests in them. However, related literatures suggest that the
optimal configuration of management practices may differ across organizations,
depending on the degree to which they “fit” with other internal features of the
organization, or “external” factors such as the market it operates in (Delery and Doty,
1996). It may be that, in the case of schools, some practices are more valuable for
performance than others but that the intensity with which they are deployed may
nevertheless matter.
Evidence is sparse, but some studies do indicate that practices that have been
deployed successfully in the for-profit sector have also proven valuable in a school
setting. Sun and Van Ryzin (2014) in the United States, Tavares (2015) in Brazil,
Argon and Limon (2016) in Turkey, and Di Liberto et al. (2014) in Italy all find
indications of a positive relationship between various management practices and
performance in a school setting. Perhaps the most pertinent one is the study by Bloom
et al. (2015) which focuses on high schools in eight countries. They find substantial
variance in management practices across and within countries, with the latter
determined in large part by differences in school governance (particularly
accountability for performance) and school leadership. They confirm that

9
management practices typically found in more profitable firms also improve school
value added. They focus on twenty practices falling into one of four domains:
operations, monitoring, target setting and people management (which relates largely
to the management and incentivisation of talent). They find a linear association
between management practice intensity and pupil attainment.4
In a series of field experiments Fryer (2014, 2017) provides causal evidence identifying
the impact of management practices on school value added in the United States. He
finds value added in traditional public schools in Houston rose following the adoption
of five managerial practices that were common in high-achieving Charter Schools
(namely increased instructional time, a more rigorous approach to building human
capital of teachers and administrators, high-dosage tutoring, frequent use of data to
inform instruction, and a culture of high expectations) (Fryer, 2014). In a second field
experiment involving 58 schools in Houston Fryer (2017) finds intensive school
principal training in relation to instructional planning, data-driven instruction, and
observation and coaching raise school value added at a low marginal cost to schools.
However, other studies indicate that management systems linked to high-performance
in the private sector do not perform so well in the public sector which harbours most
schools. For example, Bryson et al. (2017) find performance pay is negatively
associated with workplace performance in the public sector. The finding is consistent
with principal–agent theories regarding the difficulties of implementing performance
pay in scenarios where monitoring output is costly (Lemieux et al., 2009). More
4 Reflecting the broader economics literature recent contributions have also emphasised the importance of the
quality of management in the form of school leadership (eg. Ahn and Vigdor, 2014; Stokes et al., 2017) and
governance arrangements (eg. Eyles and Machin, 2015).

10
broadly, there may be difficulties using financial instruments to incentivise “mission-
oriented” employees such as teachers whose motivation is often linked to intrinsic job
rewards (Besley and Ghatak, 2005).
In the light of this literature we test three hypotheses. First, we hypothesise that school
performance will improve with the intensity of HRM. Second, whereas some HRM
practices found valuable in the for-profit sector may also be beneficial in schools,
others may be less useful in schools. For instance, incentive pay may be difficult to
implement and employees may be strongly motivated by non-pecuniary aspects of
their jobs. Third, the association between HRM intensity and workplace performance
is likely to be linear, as Bloom et al. (2017) found, suggesting “more is better”.
3. METHODS
In this section, we introduce our data, present the key measures used in our analyses,
and describe our estimation strategy.
3.1 Data
Our data are the Workplace Employment Relations Survey (WERS) 2004 and 2011.
Appropriately weighted, they are nationally representative surveys of workplaces in
Britain with 5 or more employees covering all sectors of the economy except
agriculture and mining (van Wanrooy et al., 2013). The analysis exploits two aspects
of the survey. The first is the cross-sectional data based on management interviews,
conducted face-to-face with the most senior workplace manager responsible for
employee relations. The 2011 survey interviews were conducted in 2,680 workplaces
between March 2011 and June 2012 with a response rate of 46%. The 2004 survey

11
interviews were conducted in 2,295 workplaces between February 2004 and April
2005 with a response rate of 64% (Kersley et al., 2006). The second element of the
survey we exploit is the panel component nested within the cross-sectional surveys.
Among the 2,680 productive workplaces in 2011, 989 were panel workplaces that had
previously been interviewed in 2004. The management response rate among this
group of panel workplaces was 52%.
Survey weights have been devised for each element of WERS to account for sample
selection probabilities and observable non-response biases (Van Wanrooy et al, 2013:
212-3). All analyses are survey-weighted.
Schools: schools are identified using their five-digit Standard Industrial Classification.
In addition to a dummy variable identifying schools (0, 1 where 1=school) we also
distinguish between primary schools, secondary schools and Technical/Vocational
schools.5 Managers are asked the formal status of the organization to which their
workplace belongs, from which we distinguish public and private sector workplaces.
We label private sector schools as private schools and public sector schools “state
schools”, to avoid confusion regarding the term “public school”.6
There are 406 schools in the pooled cross-sectional data, over half of which are
primary schools (Appendix Table A1). The panel contains 87 schools. Of these, 69
remain schools in both 2004 and 2011, 5 stop being schools and 13 become schools.
Most of the switchers are Technical/vocational schools switching into or out of being
adult education centres or providers of specialist education.
5 Under the SIC 2003 classification the codes identifying schools are 80100, 80210, 80220. Under the SIC 2007
classification the relevant codes are 85100, 85200, 85310, and 85320. Primary schools are coded 80100 under
SIC 2003 and 85100 or 85200 in SIC 2007. Secondary schools are coded 80210 in SIC 2003 and 85310 in SIC
2007. Technical and Vocational schools are coded 80220 in SIC 2003 and 85320 in SIC 2007. 6 In the UK “public schools” are private sector fee-paying schools.

12
Workplace performance: our main dependent variable is workplace performance
which is measured using the manager’s subjective assessment on three separate
measures.7 We follow Bryson et al. (2017) in the construction of the dependent
variable. It is an additive scale combining managers' responses to three questions:
"Compared to other workplaces in the same industry how would you assess your
workplace's...financial performance; labour productivity; quality of product or service".
Responses are recorded on a 5-point Likert scale from "a lot better than average" to
"a lot below average". The "a lot below average" and "below average" codes are
collapsed and scales scored from 0 to 3 where 3="a lot above average". Summing
them gives a scale of 0 (‘below average’ performance on all three items) to 9
(performance ‘a lot better than average’ on all 3 items). The pairwise correlations
between the three measures vary between 0.57 (financial performance and
product/service quality) and 0.63 (financial performance and labour productivity).
Factor analysis identifies a single factor with an eigen value of 2.19, and an alpha
reliability coefficient for the composite performance scale is 0.81. The mean for
schools is slightly above that for non-schools (5.36 versus 5.08) and the distributions
are similar (standard deviations of 1.86 and 1.71 respectively). The full unweighted
workplace performance distributions for the whole sample and schools and non-
schools separately is presented in Appendix Figure A1. The panel analogue, which is
simply the difference between the 2004 score and the 2011 score, is presented in
Appendix Figure A2.
7 These measures are frequently used in the literature. For a recent example see Wu et al. (2015). For a
discussion of these measures and their relationship with accounting measures of performance see Forth and
McNabb (2008). Early studies using WERS panel data found managers’ subjective assessment of poor
workplace performance was predictive of subsequent workplace closure in the 1980s (Machin, 1995) and 1990s
(Bryson, 2001).
13
We supplement our main analyses which focus on this measure of workplace
performance with analyses of worker absence rates, worker quit rates, rates of worker
injury and illness, and the climate of employment relations. In doing so we focus on
panel estimates which link changes in HRM to changes in outcomes of interest. These
are intended to shed light on potential mechanisms by which HRM may affect
workplace performance. Discussion of those measures is presented in the results
section later.
Human resource management: Following White and Bryson (2013) and Bloom et al.
(2017) we construct a single HRM index based on binary (0,1) indicators identifying
the presence or absence of specific HRM practices.8 The 48 items available are drawn
from eight HRM domains, as indicated in Appendix Table A2. These domains include
five that are commonly the focus in the “high performance work systems” literature,
namely teams, training, participation, selection, and incentives, together with target
setting and record keeping – emphasised in the work of Bloom et al. (2014; 2017) –
and total quality management (TQM) which is often identified as key to lean
production. The Kuder-Richardson coefficients of reliability are presented in the last
column of Appendix Table A2. They range from 0.47 for the TQM indicators to 0.85
for the eleven targets. The KR20 for all 48 items together is 0.88.
In our empirical analysis, we investigate the association between HRM intensity using
the overall score and, in alternative specifications, the role played by the eight HRM
domains. Because we wish to compare the quantitative size of the associations across
domains each is converted into a z-score with a mean of zero and standard deviation
8 This is standard in the literature. As Becker and Huselid (1998: 63) say: ‘The overwhelming preference in the
literature has been for a unitary index that contains a set (though not always the same set) of theoretically
appropriate HRM policies derived from prior work’.

14
of 1. The composite index sums these z-scores and coverts the sum into a z-score.
The weighted distributions for schools and non-schools are presented in Figure 1. The
score ranges between -3.46 and +2.10.
[INSERT FIGURE 1]
Controls: most of the estimates presented rely on the assumption that any differences
between schools and non-school workplaces that might be correlated with workplace
performance and HRM are accounted for by conditioning on observed features of the
workplace (the next section on estimation discusses this in greater detail). We
condition on number of employees in the workplace; whether the workplace is a stand-
alone workplace as opposed to belonging to a multi-establishment organisation; being
an older establishment aged 25 years or more; and region. The composition of the
workforce is captured with controls identifying the proportion of old (50+) and young
(16-21 years) workers; age diversity9; the proportion female and gender diversity; the
proportion from non-white ethnic minorities; the proportion part-time; the percentage
union membership; the percentage in managerial posts; the percentage in
professional posts; and the percentage in associate professional and technical posts.
Where there was missing information on workplace demographic traits mean values
were imputed and a marker incorporated identifying cases with imputed values.
Four additional control variables were incorporated in the models to capture
managerial style which may affect both workplace performance and HRM practices.
In their absence, our estimates might be vulnerable to omitted variables bias with HRM
9 Age diversity is calculated as one minus the sum of the squared age share terms where the age shares relate to
those aged 16-21, 22-49 and 50+. The index has a minimum value of zero if there is only one category
represented within the workplace and, as in our data, where we have three age categories, a maximum value of
0.67 if all categories are equally represented. Both the age share measures and age diversity measure are
included in the models presented in this chapter, following the practice adopted in the rest of the literature
reviewed above.

15
simply proxying underlying managerial style. These four dummy variables identify
female Human Resource Managers10; managerial disagreement or strong
disagreement with the statement “It is up to individual employees to balance their work
and family responsibilities”; managerial strong agreement with the statement “We do
not introduce any changes here without first discussing the implications with
employees”; and strong agreement with the statement “We would rather consult
directly with employees than with unions”.
Finally, given the importance of competition in affecting performance and, potentially,
in the propensity for employers to invest in HRM, we incorporated an additional
variable in sensitivity analyses with the panel which captured those workplaces who,
in response to the question “Looking at this card, can you tell me to what extent your
workplace has been adversely affected by the recent recession?” answered “quite a
lot” or “a great deal”.
3.2 Estimation
We adopt four estimation strategies to establish whether there is a robust relationship
between HRM and workplace performance in schools and other workplaces in Britain.
First we run pooled OLS estimates of the following form:
(1) pi = α + βhrmi + γschooli + δyeari + λpublici + φ(hrmi*schooli) + πXi + ɛi
where performance p of workplace i is a function of HRM, school status, belonging to
the public sector, a vector of controls X discussed above, and a year dummy, with
hrm*school capturing the differential returns to HRM in a school setting. The Greek
10 There is a large literature indicating that women manage differently to men (Rosener, 1990) and that the
presence of women in key managerial positions can affect firm performance (Christiansen, 2016).

16
letters are parameters to be estimated. All models are survey weighted so that results
can be extrapolated to the population of workplaces with 5+ employees in Britain.
In variants of this model we replace ZHRMSCORE – the z-score based on the z-
scored eight domains of HRM – with the z-scored domains themselves. In variant
models, we also distinguish between school type (primary, secondary, and
Vocational/Technical), public sector workplaces that are not schools, and non-school
private sector workplaces (the reference category). We also run separate estimates
for schools and non-school workplaces, thus allowing all coefficients in the model to
vary by school status.
Second, one might be concerned that some non-schools are unlike schools such that
they are unlikely to constitute reasonable counterfactuals for the school workplace
population. This concern can be addressed be reweighting the non-school population
such that it resembles schools on variables likely to affect workplace performance. To
address this concern, we rerun the OLS estimates with matching weights derived from
a propensity score estimator which seeks to balance school and non-school
workplaces on four covariates (number of employees, proportion female employees,
proportion professional employees, and age of workplace) which differ markedly
across schools and non-schools. The performance regressions are run on the sub-
sample of schools for which there is common support among non-schools. We take
the five nearest neighbours to schools based on their propensity to be schools, with a
caliper of 0.005 ensuring neighbours are closely matched. In doing so 31 schools are
off common support and they are bunched at the top end of the propensity distribution
(Appendix Figure A3). The matched samples are well-balanced on covariates as
indicated by standard statistics (Appendix Table A3).

17
Third, we use entropy balancing (Hainmueller and Zu, 2013) as an alternative method
to propensity score matching to balance schools and other workplaces on some key
covariates. The procedure reweights the non-schools so that the resulting distribution
of covariates satisfies a set of specified moment conditions. Unlike matching, in
entropy balancing all observations receive a weight so the full sample is available for
estimation and there is no need for the enforcement of common support. We balance
on means for the four covariates used for the propensity score matching.11 Prior to
balancing, schools were smaller, older, with more female employees and more
professional employees than non-school workplaces. But the two samples are
virtually perfectly balanced when weighted with the entropy balancing weights
(Appendix Table A4).
Fourth, we use the two-wave panel data to estimate first difference models to establish
the association between variance in HRM and variance in workplace performance
within workplaces over time. The advantage in doing so is that we net out time-
invariant unobservable features of workplaces that may be correlated with
performance and with school status. These models, which are run on schools and
non-schools separately12, take the following form:
(2) ∆pi = β∆hrmi + π∆Xi + +∆ɛi
where ∆ denotes change between 2004 and 2011. In variants of equation (2) we
incorporate the measure described earlier identifying the extent to which workplace
HR managers thought their workplace had been adversely affected by the recession.
The variable was set to zero (“not at all”) in 2004 prior to the recession. All panel
11 Results using entropy balancing weights are very similar when we balance on means, variance and skewness. 12 As noted earlier, our data contain workplaces that switch school status between 2004 and 2011 but the
numbers are small and the behaviours of these schools with respect to changes in HRM practices and
performance are unlikely to be particularly informative.

18
estimates are survey-weighted so that one can extrapolate from the results to the
population of workplaces that were operating in both 2004 and 2011.
We also run some OLS models to examine variance in HRM practices across different
types of school, relative to non-school public sector workplaces and private sector non-
schools. The dependent variables are ZHRMSCORE and the z-scored eight HRM
domains.
4. RESULTS
4.1: Do Schools Perform Differently to Other Workplaces?
Schools’ performance improved relative to other workplaces over the period 2004-
2011 as indicated by the positive interaction between school and the 2011 year
dummy in the pooled year regression (Table 1, column 2).13 However, there appears
to have been more variance in performance within the schools sector than across the
schools/non-schools sectors. In the pooled data primary schools performed
significantly better than private sector workplaces that were not schools, whereas
Technical and Vocational schools performed significantly more poorly (column 3). The
improvement in schools’ relative performance over the period is wholly accounted for
by the improvement in primary school performance: whereas their performance was
indistinguishable from private sector non-schools in 2004, they were performing
significantly better by 2011 (columns 4 and 5).14 By contrast Technical/Vocational
Schools were performing more poorly than private non-schools in both years.
13 The raw survey-weighted means for workplace performance in the non-schools sector were stable (5.15 in
2004 and 5.22 in 2011) but increased in the schools sector (from 4.76 in 2004 to 5.65 in 2011). 14 Much has been made of the Academisation of schools in England which is credited with improvements in
school value added (Eyles and Machin, 2015). However, this cannot account for relative improvements in
primary schools over the period 2004-2011 because only secondary schools were able to switch to Academy
status prior to the 2010 Academies Act, so the first primary school academies only came into being in 2010/11
(Eyles and Machin, 2015, footnote 3). In any case, as Eyles et al. (2016) show, the Academy system has not
improved primary school performance.

19
[INSERT TABLE 1]
4.2: Management Practices in Schools and Other Workplaces
Table 2 presents the mean scores for the management practices in each of the eight
domains described earlier, together with the overall management score. They are
presented as raw survey-weighted counts.
[INSERT TABLE 2]
The underlined figures indicate scores that are statistically significantly different to the
score for private workplaces that were not schools. The overall HRM index (row 9) is
higher for all types of schools relative to private sector non-schools, and is a little
higher than in the non-school public sector. However, private sector non-schools make
significantly higher usage of records and targets than schools, while the incidence of
incentives does not differ across organizational types.15 Schools tend to use more
HRM practices in the other domains (notably with respect to teams, training,
participation, selection and TQM).
[INSERT TABLE 3]
The association between organization type and the incidence of various HRM types
(expressed as z-scores) differs markedly once we condition on other factors such as
workplace size, workplace age, location, workforce composition, unionisation and
managerial style (Table 3). Private sector non-schools make significantly more use of
incentives, records and targets relative to schools, and relative to public sector non-
schools (rows 1-3).16 These are the HRM domains which are the focus of studies by
Bloom and co-authors (2014, 2015). Conversely, schools make significantly more use
15 Private sector non-schools make more use of performance pay, but this is counter-balanced by schools making
greater use of appraisal. 16 The exception is records kept by Vocational and Technical schools.

20
of participation (namely employee involvement initiatives and methods of
communication with staff) than private sector non-schools. There is no significant
difference between use of participation in the public non-schools sector and the private
non-schools sector (row 7). There are few significant differences in other HRM
domains, although primary schools make significantly more use of TQM than private
sector non-schools (row 6). The bottom row in Table 3 reports the regression for the
overall HRM z-score. The model accounts for around one-third of the variance in the
HRM score. Public sector non-schools have significantly lower scores compared with
‘like’ workplaces in the private sector, but there are no significant differences between
schools and private sector non-schools, suggesting the differences in HRM domains
mentioned above cancel one another out in the overall score.
4.3: Management Practices and Workplace Performance in Schools and
Other Workplaces
Table 4 introduces z-scored HRM measures into estimates of workplace performance
for the pooled cross-sectional data for 2004 and 2011. The HRM z-score is positively
and significantly associated with workplace performance, a 1 standard deviation
increase in HRM corresponding to a 0.2 point rise in the 10-point workplace
performance scale. Although the coefficient on the interaction between the HRM z-
score and school status is of a similar magnitude it is not statistically significant (Table
4, Model 1). The finding is consistent with the proposition in hypothesis 1, namely that
schools benefit from HRM intensity. However, they do so no more or no less than
other types of workplace.
Interacting the HRM z-score with school type both the school type variables and their
interactions with the HRM z-score are jointly statistically significant (Table 4, Model 2).

21
However, the only statistically significant interaction was the negative association
between HRM in public sector non-schools: returns to HRM did not differ between
different types of schools and private sector non-schools.
[INSERT TABLE 4]
Models 3 and 4 in Table 4 present effects of z-scored HRM domains for non-schools
and schools respectively. The domains are jointly statistically significant in both
models, but the effects of specific HRM domains differ markedly between schools and
non-schools, as anticipated in hypothesis 2. Schools’ performance improves
significantly with the number of participation practices and selection practices used,
the size of the effects being quite similar for both domains. None of the other domains
are significant for school performance. Among non-schools, only training and
incentives are associated with significant improvements in workplace performance,
with incentives on the margins of statistical significance. In addition to incentives,
Bloom and colleagues emphasise the role played by records and targets but these are
not significantly linked to performance in these analyses. The implication is that what
works for schools differs from what works for non-schools, in accordance with
hypothesis 2, and that, at least in the case of incentives, the differences are to be
expected and confirm previous literature (Bryson et al., 2017).
Models 5 and 6 in Table 4 present separate models for non-schools and schools again,
but replace the HRM domains with the linear HRM z-score and a quadratic term. We
had hypothesised that, in accordance with the existing literature, the association
between HRM intensity and schools’ workplace performance would be linear. This
linear association is apparent in non-schools since the quadratic term is not significant
(Model 5). However, the quadratic term is positive and statistically significant for

22
schools, indicating that the performance returns to HRM are increasing with the
intensive use of HRM.
Models 7 and 8 in Table 4 split the schools sector into private and state schools
respectively to see whether the returns to HRM differ for schools under different
governance regimes and with different resources and student intakes. The results for
the state schools sector reflect those for the all schools model with returns to HRM
rising exponentially, as indicated by the statistical significance of both the linear and
quadratic terms. In the case of private schools, on the other hand, only the quadratic
term is statistically significant. Although the number of private schools in the data set
is not large, the coefficients for the HRM terms suggest that returns to HRM intensity
differ between the private and public sectors.
4.4: Matching-adjusted Estimates of Links between HRM and Workplace
Performance
Table 5 reruns the pooled years models from Table 4 reweighted with the matching
weights as described in Section 3.2. The propensity score matching estimation is run
on a total of 784 workplaces consisting of 304 schools and 480 comparator workplaces
identified as their five nearest neighbours, having dropped the 31 schools off common
support. The HRM score is positive and statistically significant. In contrast to the OLS
estimates in Table 4, the interaction between school and HRM score is positive and
statistically significant (Model 2). However, although the interactions between school
type and HRM score in Model 3 are jointly statistically significant none of them reach
statistical significance. Weighting the regressions using entropy balancing weights
confirms the positive and significant association between HRM score and workplace
performance. In contrast to the PSM estimates performance of schools is significantly

23
higher than that among non-schools (Models 4 and 5), with primary schools performing
better than private sector non-schools (Model 6). However, there is no evidence of
increased returns to HRM among schools: the interaction term in Model 5 is not
significant and the interactions between school type and HRM are jointly and
individually non-significant. It seems reasonable to conclude from these matching-
weights estimates that HRM is positively associated with workplace performance, but
there is no overwhelming evidence to indicate higher returns to HRM in a school
setting.
[INSERT TABLE 5]
4.5: Panel Estimates of Links between HRM and Workplace Performance
To establish the association between changes in HRM and change in workplace
performance we turn to the panel of workplaces surveyed in both 2004 and 2011. We
distinguish between workplaces that were never workplaces over the period,
workplaces that were schools at some point, and those that we schools at both points
in time. (The sometimes/always sample includes the small number of schools who
switched status between 2004 and 2011, as described in Section 3.1). The models
condition on a wide range of workplace demographics and managerial style variables,
as noted in the footnote to Table 6, so that these estimates account for potential biases
associated with both time-invariant workplace unobserved traits and time-varying
workplace demography and managerial style.
[INSERT TABLE 6]
For all three samples increasing HRM is associated with improvements in workplace
performance (Table 6, columns 1, 3 and 5), once again confirming hypothesis one.
The coefficients are larger in the school samples. When we distinguish between HRM
domains (Models 2, 4 and 6) we find schools benefit from different sets of HRM

24
practices to those benefitting the non-schools sector, confirming hypothesis two.
Increasing use of incentives is positively and significantly associated with
improvements in non-schools’ performance but not that of schools. The other HRM
practice benefiting non-schools is increased use of training but this is also beneficial
to schools, at least when one includes “sometimes schools” alongside “always
schools”. Conversely, schools’ performance rises with increasing use of HRM to
select employees (Model 4), whereas this is not the case for non-schools. Confining
analyses to those workplaces that were schools in 2004 and 2011 reveals positive
returns to increasing use of participative forms of HRM, record-keeping and TQM,
none of which were significantly associated with performance in non-schools.
The negative shock that workplaces suffered due to the Great Recession and its
aftermath affected schools and non-schools. Among the panel workplaces surveyed
in 2011, 30 per cent of schools and 51 per cent of non-schools said they had been
adversely affected “a great deal” or “quite a lot” by the recession. Those that said so
were less likely to increase their HRM score over the period 2004 to 2011. However,
conditioning on being adversely affected made no difference to the positive
association between a growth in HRM and improved workplace performance found for
schools and non-schools.17
4.6: Panel Estimates of Links between HRM and Other Workplace
Outcomes
To gain some insight into how HRM may affect workplace performance we ran panel
first difference models on non-schools and schools separately for eight outcomes. We
17 Full results are available from the authors on request.
25
ran these first for ZHRM, and then for the z-scored HRM domains. The coefficients for
the z-scored HRM are presented in Table 7. The domain effects are not presented in
the table but are available on request.
[INSERT TABLE 7]
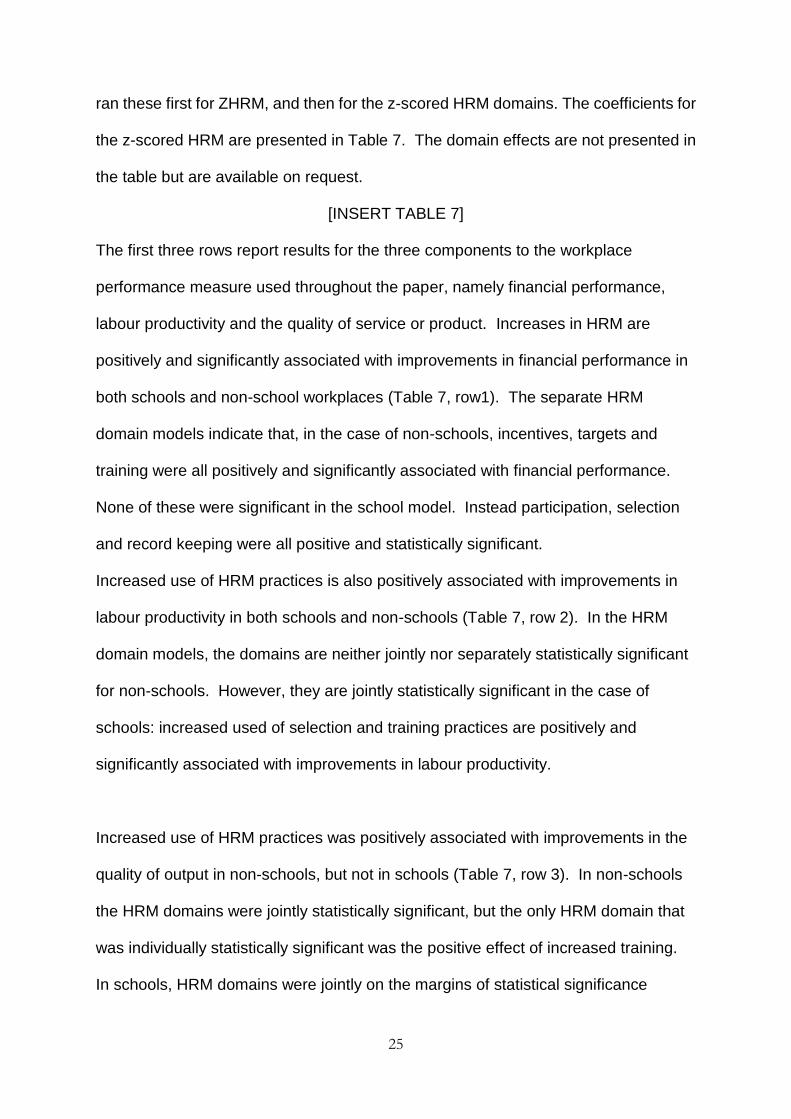
The first three rows report results for the three components to the workplace
performance measure used throughout the paper, namely financial performance,
labour productivity and the quality of service or product. Increases in HRM are
positively and significantly associated with improvements in financial performance in
both schools and non-school workplaces (Table 7, row1). The separate HRM
domain models indicate that, in the case of non-schools, incentives, targets and
training were all positively and significantly associated with financial performance.
None of these were significant in the school model. Instead participation, selection
and record keeping were all positive and statistically significant.
Increased use of HRM practices is also positively associated with improvements in
labour productivity in both schools and non-schools (Table 7, row 2). In the HRM
domain models, the domains are neither jointly nor separately statistically significant
for non-schools. However, they are jointly statistically significant in the case of
schools: increased used of selection and training practices are positively and
significantly associated with improvements in labour productivity.
Increased use of HRM practices was positively associated with improvements in the
quality of output in non-schools, but not in schools (Table 7, row 3). In non-schools
the HRM domains were jointly statistically significant, but the only HRM domain that
was individually statistically significant was the positive effect of increased training.
In schools, HRM domains were jointly on the margins of statistical significance
26
(p>f=0.108): increased use of selection practices and TQM were positively
associated with increased quality, whereas increased use of targets was negatively
associated with quality of output.
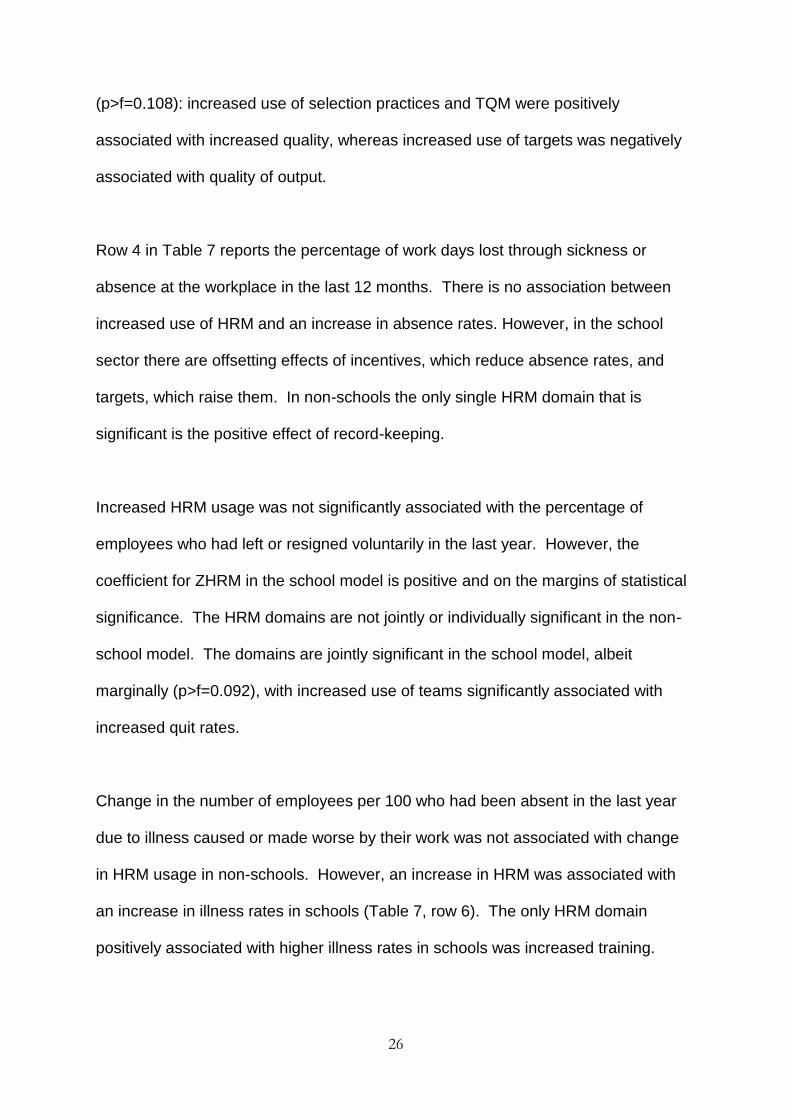
Row 4 in Table 7 reports the percentage of work days lost through sickness or
absence at the workplace in the last 12 months. There is no association between
increased use of HRM and an increase in absence rates. However, in the school
sector there are offsetting effects of incentives, which reduce absence rates, and
targets, which raise them. In non-schools the only single HRM domain that is
significant is the positive effect of record-keeping.
Increased HRM usage was not significantly associated with the percentage of
employees who had left or resigned voluntarily in the last year. However, the
coefficient for ZHRM in the school model is positive and on the margins of statistical
significance. The HRM domains are not jointly or individually significant in the non-
school model. The domains are jointly significant in the school model, albeit
marginally (p>f=0.092), with increased use of teams significantly associated with
increased quit rates.
Change in the number of employees per 100 who had been absent in the last year
due to illness caused or made worse by their work was not associated with change
in HRM usage in non-schools. However, an increase in HRM was associated with
an increase in illness rates in schools (Table 7, row 6). The only HRM domain
positively associated with higher illness rates in schools was increased training.

27
HRM domains were not significant in the case of non-schools, either jointly or
individually.
Changes in injury rates were not linked to changes in HRM in school or non-school
workplaces (Table 7, row 7). Nor were HRM domains, the exception of training
which was associated with fewer injuries in schools.
Change in the climate of employment relations at a workplace is not significantly
associated with changes in HRM in schools or non-schools, although the positive
association is on the margins of statistical significance (Table 7 row 8). The HRM
domains are also not jointly or separately significant in either sector.
Taken together, the results in Table 7 suggest HRM improved workplace
performance through improvements in financial performance and labour productivity,
but only improved the quality of service or output among non-schools. Increases in
the HRM z-score were not generally associated with other workplace outcomes.
However, greater HRM usage was associated with higher illness rates and, albeit
marginally, with higher quit rates in schools. It is conceivable that greater HRM use
in schools is linked to work intensification which, as in other studies can result in
worker absence (Böckerman et al., 2012). Lazear (2000) finds workers sort
following the introduction of incentive pay, with more able employees entering the
performance-paying firm, and less able employees leaving. Cullen et al. (2016) find
the introduction of a rigorous job evaluation system in Houston increased the relative
likelihood of exit for teachers in the bottom quintile of the teacher quality distribution.
Adnot et al. (2016) find District of Columbia Public Schools successfully replaced

28
poor performing with better performing teachers using a performance assessment
and incentive system. It is conceivable that the quit effect is picking up similar
behavioural responses with respect to HRM.
The way that HRM domains were associated with workplace outcomes also proved
informative. Only rarely did the same domain have similar significant effects in the
school and non-school sectors. As anticipated in the work of Bloom et al. (2014)
incentives and targets improved financial performance in the non-school sector.
Among schools, on the other hand, the domain that was most strongly linked to
improved performance was selection: increased use of the HRM practices linked to
selection of workers was positively and significantly associated with improvement in
schools’ financial performance, labour productivity and quality of output.18
5. CONCLUSIONS
We contribute to the literature on schools’ performance by comparing them with the
performance of other workplaces in Britain using an index combining their financial
performance, labour productivity and quality of their services provided. The
comparisons control for potential confounding factors using regression, matching
and panel estimation techniques. Using nationally-representative workplace data we
explore the choices schools and other workplaces make in terms of the managerial
practices they adopt and their style of management. We investigate how schools
differ from other workplaces in terms of the managerial practices they deploy and the
18 Jacob et al. (2016) show applicant performance during interview screening in Washington DC public schools
strongly predicts teacher effectiveness. However, in their case, these traits were not strongly predictive of being
hired, leading the authors to conclude that there is substantial scope for improving teacher quality through the
hiring process.

29
intensity of their Human Resource Management (HRM) systems. Then we establish
whether specific HRM practices and overall HRM intensity measures relate to school
performance and the performance of other workplaces.
We find schools are similar to other workplaces in terms of their overall HRM score
based on 48 measures of HR practices. However, they differ in the types of HRM
they deploy. In keeping with much of the public sector, they are less likely to use
incentives, records and targets than private sector non-schools. These are the
practices that Bloom et al. (2014) have tended to focus on in most of their work.
However, schools are more likely than observationally equivalent private sector non-
schools to encourage employee participation through consultative mechanisms and
employee involvement initiatives.
We find intensive use of HRM practices is correlated with substantial improvement in
workplace performance, both among schools and other workplaces. However, the
types of practices that improve school performance are different from those that
improve performance elsewhere in the economy. Non-schools experience
improvements in performance when they deploy more incentives, while schools tend
to benefit from selection practices. Both see improvements in performance from
increases in training. Furthermore, in contrast to the linear returns to HRM intensity
in most workplaces, improvements in schools’ performance are an increasing
function of HRM intensity.
Exploration of HRM associations with various workplace outcomes indicates that the
returns to increasing use of HRM are largely confined to improvements in workplace

30
financial performance and labour productivity, rather than other mechanisms. This is
the case for schools and other workplaces.
Although our results are fairly robust to a range of estimation techniques they may
nevertheless be subject to estimation biases which prevent us from making causal
inferences about the relationship between HRM and workplace performance. In our
first difference estimates we account for both fixed unobserved differences across
workplaces and time-varying workplace demographic and other changes that might
otherwise bias the estimated relationship between HRM and performance. But HRM
practices are not randomly assigned and we have no source of exogenous variance
in HRM deployment which might assist with causal inference. Nevertheless, there
appear to be some grounds for concluding that there are potential benefits for
schools and non-schools in investing in HRM practices, and for exploring the
possibility that the types of HRM schools may benefit from are different, at least in
some respects, from those that might be valuable elsewhere.

31
Table 1: OLS Estimates of Workplace Performance
Pooled Pooled Pooled 2004 2011
School 0.312
(1.64)
Public -0.105 -0.088 -0.134 -0.107 -0.173
(0.64) (0.54) (0.82) (0.49) (0.73)
Year=2011 0.063 0.058
(0.73) (0.68)
School -0.110
(0.46)
2011 0.030
(0.34)
School*2011 0.736
(2.89)**
Organisation
(ref.: Private,
not school)
Primary 0.434 -0.193 0.928
(2.20)* (0.64) (3.79)**
Secondary 0.509 0.415 0.577
(1.86) (0.98) (1.66)
Tech/Voc. -0.951 -1.087 -0.887
(4.27)** (3.33)** (2.08)*
Constant 4.908 4.928 4.931 4.750 5.361
(18.16)** (18.25)** (18.26)** (11.69)** (16.13)**
Controls? Yes Yes Yes Yes Yes
R2 0.06 0.06 0.06 0.09 0.07
N 4,260 4,260 4,260 1,920 2,340
Notes: (1) Controls: single-establishment organization; region (11 dummies); establishment aged over 25 years; % age
16-21; % age 50+; age diversity; % female; gender diversity; % non-white; % part-time; % union density; % manager;
% professionals; % associate professionals; management style (4 dummies for style female HR manager; prefer to
discuss change; prefer direct communication to union; WLB not up to individual). (2) t-statistics in parentheses.
Statistical significance: * p<0.05; ** p<0.01

32
Table 2: Mean Scores for Management Practices in Schools and Other Workplaces
Not a School Schools
Private Public All Primary Secondary Voc/Tech
Incentives (0,4) 1.9 1.8 1.9 1.9 1.9 2.2
Records (0,9) 6.7 5.6 6.2 6.2 5.7 7.9
Targets (0,11) 4.0 3.5 2.6 2.5 2.7 3.5
Teams (0,4) 1.8 2.5 2.6 2.6 2.8 2.3
Training (0,5) 2.2 3.3 3.3 3.2 3.5 4.0
TQM (0,3) 1.1 1.5 1.8 1.8 1.9 1.3
Participation (0,5) 2.0 2.8 3.1 3.0 3.3 2.9
Selection (0,7) 4.2 5.0 5.2 5.3 5.4 4.6
HRM (0,48) 24.0 26.1 26.7 26.4 27.2 29.8
Management “style”: Female HR Manager WLB not up to worker Prefer to discuss change Prefers direct communication over union
43.5 11.8 25.0 43.3
53.8 24.8 34.0 13.7
68.2 21.9 38.0 33.9
69.6 20.7 39.3 36.2
56.6 31.2 36.2 33.6
76.6 16.8 26.0 4.2

33
Table 3: Regression-Adjusted Incidence of z-score HRM Measures Relative to Non-School
Private Sector
Model Fit Not a School Schools
R2 Public Primary Secondary Voc/Tech
Incentives 0.24 -.37 (4.05)** -.40 (3.43)** -.57 (3.24)** -.46 (2.91)**
Records 0.09 -.60 (6.69)** -.28 (2.52)* -.60 (2.99)** .46 (3.04)**
Targets 0.20 -.45 (6.8)** -.60 (6.31)** -.66 (5.77)** -.40 (1.59)
Teams 0.10 .21 (1.76) .25 (1.70) .10 (0.54) -.31 (1.49)
Training 0.31 .10 (1.22) -.05 (0.50) .17 (1.18) .63 (4.36)**
TQM 0.23 -.03 (0.41) .26 (2.53)* .21 (1.36) -.22 (0.96)
Participation 0.26 .09 (1.18) .27 (2.86)** .39 (3.26)** .84 (6.67)**
Selection 0.15 .13 (1.73) .17 (1.77) .13 (0.94) -.36 (1.64)
HRM score 0.32 -.19 (2.40)* -.08 (0.79) -.17 (1.05) 0.04 (0.19)
Notes: (1) Each row denotes a separate survey-weighted OLS regression. (2) Reference category: private, not a school.
(3) Dependent variables are standardised scores for HRM domains using z-scores so that scores have a mean of zero and
standard deviation of one; (4) Controls are as per Table 1. (5) t-statistics in parentheses. Statistical significance: * p<0.05;
** p<0.01 (6) Full models are available from the authors on request.

34
Table 4: OLS Workplace Performance Models
Pooled Pooled Non-schools Schools Non-schools Schools Private
schools
State
schools
School 0.301
(1.60)
ZHRM 0.214 0.231 0.228 0.369 0.038 0.470
(4.44)** (4.73)** (3.70)** (2.29)* (0.20) (2.67)**
ZHRM squared 0.009 0.490 0.341 0.649
(0.27) (3.06)** (2.06)* (3.17)**
School*ZHRM 0.242
(1.23)
2011 0.014 0.011 -0.004 0.505 -0.013 0.492 0.625 0.581
(0.17) (0.13) (0.05) (2.18)* (0.14) (2.20)* (1.50) (2.53)*
Public -0.056 -0.086 0.172 -0.091 0.194
(0.34) (0.46) (0.44) (0.51) (0.53)
Public non-school -0.190
(1.10)
Primary 0.345
(1.78)
Secondary 0.438 -0.162 -0.221 -0.549 -0.289
(1.61) (0.47) (0.65) (1.21) (0.65)
Tech/Voc -1.054 -1.245 -1.051 -0.296 -1.432
(5.87)** (2.49)* (2.31)* (0.81) (2.09)*
Public non-
school*ZHRM
-0.347
(2.24)*
Primary*ZHRM 0.377
(1.60)
Secondary*ZHRM -0.068
(0.26)
Tech/Voc*ZHRM 0.615

35
(1.68)
Z-participation 0.018 0.310
(0.25) (2.35)*
Z-selection -0.006 0.275
(0.12) (2.00)*
Z-incentives 0.108 0.025
(1.95) (0.16)
Z-records 0.067 -0.145
(1.34) (0.93)
Z-targets -0.051 0.213
(0.86) (1.40)
Z-teams -0.022 0.055
(0.55) (0.42)
Z-training 0.161 0.055
(2.70)** (0.39)
Z-TQM 0.046 -0.114
(0.72) (0.87)
Constant 5.056 5.072 5.087 7.741 5.077 6.051 8.000 5.619
(18.79)** (18.80)** (18.30)** (2.94)** (18.18)** (2.53)* (2.20)* (1.79)
R2 0.08 0.08 0.08 0.32 0.08 0.32 0.86 0.37
N 4,260 4,260 3,925 335 3,925 335 66 269
Notes: (1) All models contain controls as per Table 1. (2) t-statistics in parentheses. Statistical significance: * p<0.05; ** p<0.01

36
Table 5: Workplace Performance Models Using Alternative Matching Weights
OLS with PSM weights OLS with ebalance weights
Model 1 Model 2 Model 3 Model 4 Model 5 Model 6
School 0.252 0.190 0.484 0.436
(1.67) (1.25) (3.33)** (3.04)**
ZHRM 0.287 0.153 0.216 0.281 0.182 0.250
(3.28)** (1.61) (2.14)* (3.20)** (1.89) (2.57)*
2011 0.100 0.092 0.097 0.246 0.232 0.242
(0.68) (0.62) (0.67) (1.74) (1.64) (1.74)
Public -0.130 -0.137 -0.181 -0.181
(0.64) (0.68) (0.94) (0.95)
School*ZHRM 0.354 0.254
(2.08)* (1.52)
Public non-school -0.002 -0.169
(0.01) (0.79)
Primary 0.275 0.464
(1.27) (2.37)*
Secondary 0.246 0.407
(0.95) (1.64)
Tech/Voc -0.558 -0.618
(1.01) (1.20)
Public non-
school*ZHRM
-0.221 -0.260
(1.03) (1.19)
Primary*ZHRM 0.423 0.306
(1.68) (1.29)
Secondary*ZHRM 0.276 0.235
(1.15) (0.98)
Tech/Voc*ZHRM 0.637 0.508
(1.10) (0.90)
Constant 4.546 4.487 4.589 5.715 5.642 5.959
(5.78)** (5.78)** (5.88)** (4.41)** (4.36)** (4.69)**
R2 0.14 0.14 0.15 0.14 0.15 0.16
N 784 784 784 4,260 4,260 4,260
Notes: (1) All models contain controls as per Table 1. (2) Details of PSM and Ebalance estimators are provided in
Section 3.2. (3) t-statistics in parentheses. PSM standard errors bootstrapped, 50 replications. * p<0.05; ** p<0.01

37
Table 6: First Difference Estimates of Change in Workplace Performance and Change in
HRM
Never School Sometimes or Always
School
Always School
Model 1 Model 2 Model 3 Model 4 Model 5 Model 6
ZHRM 0.605 1.639 1.318
(4.45)** (2.72)** (2.28)*
Z-participation 0.028 0.377 0.955
(0.22) (1.01) (2.39)*
Z-selection 0.121 1.969 0.874
(1.17) (2.68)** (1.47)
Z-incentives 0.267 0.214 0.328
(2.40)* (0.62) (1.24)
Z-records 0.110 0.574 1.219
(1.12) (1.24) (3.23)**
Z-targets 0.151 -0.504 -0.583
(1.27) (1.11) (1.87)
Z-teams -0.045 0.279 -0.544
(0.56) (1.04) (1.85)
Z-training 0.467 1.123 0.050
(3.50)** (2.46)* (0.09)
Z-TQM 0.010 0.950 1.016
(0.07) (1.96) (2.21)*
Constant -0.270 -0.248 0.614 0.687 0.197 -0.254
(1.92) (1.86) (1.60) (1.62) (0.62) (0.70)
R2 0.14 0.18 0.63 0.70 0.59 0.73
N 670 670 56 56 44 44
Notes: (1) First-difference models for panel workplaces. (2) All models contain following controls all expressed as
change between 2004 and 2011: % age 16-21; % age 50+; age diversity; % female; gender diversity; % non-white; %
part-time; % union density; % manager; % professionals; % associate professionals; female HR manager; prefer to
discuss change; prefer direct communication to union; WLB not up to individual. (3) t-statistics in parentheses.
Statistical significance: * p<0.05; ** p<0.01

38
Table 7: First Difference Estimates of Change in Other Workplace Outcomes and Change in
HRM
ZHRM coefficient R2 N
Financial Performance:
Non-schools
Schools
0.228 (3.40)**
0.489 (2.41)*
0.12
0.39
738
68
Labour Productivity:
Non-schools
Schools
0.203 (2.85)**
0.590 (2.36)*
0.08
0.57
710
59
Quality of service/product:
Non-schools
Schools
0.120 (2.00)*
0.074 (0.44)
0.06
0.39
798
76
Absence rate:
Non-schools
Schools
0.007 (0.71)
0.019 (1.15)
0.07
0.50
639
54
Quit rate:
Non-schools
Schools
-1.708 (1.42)
2.448 (1.94)
0.10
0.77
762
80
Illness rate:
Non-schools
Schools
-0.187 (0.57)
5.018 (2.08)*
0.02
0.21
902
87
Injury rate:
Non-schools
Schools
-0.393 (1.29)
-0.476 (1.33)
0.03
0.63
902
87
Employment relations climate:
Non-schools
Schools
0.081 (1.86)
0.038 (0.32)
0.09
0.21
895
82 Notes: (1) First-difference OLS models for panel workplaces. (2) Non-schools models are run on panel workplaces that were
never schools in 2004 and 2011. Schools models include workplaces that were schools in either 2004, 2011 or both. (3)
Dependent variables are as follows. Financial performance, labour productivity and quality of service/output: ordinal scales
where 1=below/a lot below average to 4=a lot better than average. The absence rate is the percentage of work days lost
through sickness or absence at the workplace over the previous 12 months. The quit rate is the percentage of employees who
left or resigned voluntarily in last year. The illness rate is the number of employees per 100 employees who have been absent
in the last 12 months due to an illness caused or made worse by their work. The injury rate is the number of employees per
100 who have sustained an injury at work in the last 12 months. The climate measure is managerial responses to the question
“how would you rate the relationship between management and employees generally at this workplace?” with responses
coded on an ordinal scale from 1=poor/very poor to 4=very good. (4) All models contain following controls all expressed as
change between 2004 and 2011: % age 16-21; % age 50+; age diversity; % female; gender diversity; % non-white; % part-
time; % union density; % manager; % professionals; % associate professionals; female HR manager; prefer to discuss
change; prefer direct communication to union; WLB not up to individual. (5) t-statistics in parentheses. Statistical
significance: * p<0.05; ** p<0.01

39
Figure 1: Distribution of ZHRMSCORE Across Schools and Other Workplaces
0.2
.4.6
-4 -2 0 2 -4 -2 0 2
0 1
HRM Z-score HRM Z-score
% w
ork
pla
ce
s
HRM zscore for summary zscoresGraphs by school

40
References
Adnot, M., Dee, T., Katz, V. and Wyckoff, J. (2016) “Teacher Turnover, Teacher Quality and
Student Achievement in DCPS”, NBER Working Paper No. 21922
Ahn, T. and Vigdor, J. (2014) "The Impact of No Child Left Behind's Accountability Sanctions
on School Performance: Regression Discontinuity Evidence from North Carolina",
NBER Working Paper No. 20511
Anderson, M. L., Gallagher, J. and Ritchie, E. R. (2017) “School Lunch Quality and Academic
Performance”, NBER Working Paper No. 23218
Appelbaum E., Bailey T., Berg P. and Kalleberg A.L. (2000) Manufacturing Advantage: Why
High-performance Work Systems Pay Off. Ithaca NY: Cornell University Press
Argon, T. and I. Limon (2016). "Strategic Human Resource Management and Organizational
Innovativeness in Private Schools." 2nd International Conference on Lifelong Learning
and Leadership for All (Iclel 2016): 649-655
Becker B. E. and Huselid, M.A. (1998) “High performance work systems and firm
performance: A synthesis of research and managerial implications”. In Ferris GR (ed.)
Research in Personnel and Human Resources Management, Vol. 16. Stamford, CT: JAI
Press, 53–101.
Besley, T. and Ghatak, M. (2005) "Competition and Incentives with Motivated Agents",
American Economic Review, 95(3): 616-636
Besley, T., Montalvo, J. G. and Reynal-Querol, M. (2011) "Do Educated Leaders Matter?",
The Economic Journal, F205-F227
Bhagat, S. and Bolton, B. (2008) “Corporate governance and firm performance”, Journal of
Corporate Finance, 13, 3: 257-273

41
Bloom, N., Lemos, R., Sadun, R. and Van Reenen, J. (2015) "Does Management Matter in
Schools", The Economic Journal, 125, 647-674
Bloom, N., Lemos, R., Sadun, R., Scur, D. and Van Reenen, J. (2014) “The new empirical
economics of management”, The Journal of the European Economic Association, 12, 4:
835–876
Böckerman, P., Bryson, A. and Ilmakunnas, P. (2012) 'Does High Involvement Management
Improve Worker Wellbeing?', Journal of Economic Behavior and Organization, 84: 660-
680
Bowen, D.E. and Ostroff, C. (2004) “Understanding HRM-performance linkages: The role of
the “strength” of the HRM system”, Academy of Management Review, 29(2): 203-21
Bryson, A. (2001) Employee voice, workplace closure and employment growth: A Panel
Analysis, PSI Discussion Paper No. 6
Bryson, A., Forth, J. and Stokes, L. (2017) ”How Much Performance Pay is there in the Public
Sector and What Are Its Effects?”, Human Resource Management Journal, Human
Resource Management Journal, 27, 4: 581-597
Bryson, A. and White, M. (2017) ”HRM and Small-Firm Employee Motivation: Before and
After the Recession”, IZA Discussion Paper No. 10737
Christiansen, L., Lin, H., Pereira, J., Topalova, P. and Turk, R. (2016) “Gender Diversity in
Senior Positions and Firm Performance: Evidence from Europe”, IMF Working Paper
No. 16/50
Cirin, R. (2014) “Do academies make use of their autonomy?”, Department for Education
Research Report RR366

42
Cullen, J. B., Koedel, C. and Parsons, E. (2016) “The Compositional Effect of Rigorous
Teacher Evaluation on Workforce Quality”, NBER Working Paper No. 22805
Delery, J. E., and Doty, D. H. (1996) “Modes of theorizing in strategic human resource
management: Tests of universalistic, contingent and configurational performance
predictions”, Academy of Management Journal, 39(4): 802-835
Department for Education (2013a) ‘2012 OECD PISA results’, Oral statement to Parliament,
Secretary of State for Education Michael Gove, 3 December 2013
Di Liberto, A., F. Schivardi and G. Sulis (2014) Managerial Practices and Students’
Performance. Bonn, IZA Discussion Paper No. 8475
Dolton, P. and Marcenaro-Gutierrez, O. (2011) ‘If You Pay Peanuts, Do You Get Monkeys?
A Cross-country Analysis of Teacher Pay and Pupil Performance’, Economic Policy
26(65): 5-55
Eyles, A. and Machin, S. (2015) "The Introduction of Academy Schools to England's
Education", CEP Discussion Paper No. 1368
Eyles, A., Machin, S. and Silva, O. (2015) "Academies 2: The New Batch", CEP Discussion
Paper No. 1370
Eyles, A., Machin, S. and McNally, S. (2016) “Unexpected School Reform: Academisation of
Primary Schools in England”, CEP mimeo
Epple, D., Romano, R. and Zimmer, R. (2015) "Charter Schools: A Survey of Research on
their Characteristics and Effectiveness", NBER Working Paper No. 21256, NBER,
Cambridge, Mass.

43
Fryer, R. G. (2014), “Injecting Charter School Best Practices Into Traditional Public Schools:
Evidence from Field Experiments,” The Quarterly Journal of Economics 129(3): 1355-
1407
Fryer, R. G. (2017) “Management and Student Achievement: Evidence from a Randomized
Field Experiment”, NBER Working Paper No. 23437
Gibbons, S and McNally, S. (2013) "The Effects of Resources across School Phases: A
Summary of Recent Evidence", CEP Discussion Paper No. 1226
Goodridge, P., Haskel, J. and Wallis, G. (2013) "Can intangible investment explain the UK
Productivity Puzzle?", National Institute Economic Review, 224: R48-R58
Hainmueller, J. and Xu, J. (2013) “ebalance: A Stata Package for Entropy Balancing”, Journal
of Statistical Software, 54, 7: 1-18
Ichniowski C. and Shaw, K. (2009) “Insider econometrics: empirical studies of how
management matters”, NBER Working Paper 15618. National Bureau of Economic
Research, Cambridge
Jacob, B., Rockoff, J. E., Taylor, E. S., Lindy, B. and Rosen, R. (2016) “Teacher Applicant
Hiring and Teacher Performance: Evidence from DC Public Schools”, NBER Working
Paper No. 22054
Jackson, C. K., Rucker, C. J. and Persico, C. (2016) “The Effects of School Spending on
Educational and Economic Outcomes: Evidence from School Finance Reforms”, The
Quarterly Journal of Economics, 131, 1: 157-218
Jepsen, C. (2015) “Class size: does it matter for student achievement?", IZA World of Labor,
190

44
Jerrim, J. (2016) “The 10 Key Findings from PISA 2015”,
https://educationdatalab.org.uk/2016/12/the-10-key-findings-from-pisa-2015/
Kaplan, S. N. (2012) "Executive Compensation and Corporate Governance in the US:
Perceptions, Facts and Challenges", NBER Working Paper No. 18395
Kane, T., McCaffrey, D., Miller, T. And Staiger, D. (2013) “Have we identified effective
teachers?”, MET Project Research Paper,
http://citeseerx.ist.psu.edu/viewdoc/summary?doi=10.1.1.638.2716
Kersley, B., Alpin, C., Forth, J., Bryson, A., Bewley, H., Dix, G. and Oxenbridge, S. (2006)
Inside the Workplace: Findings from the 2004 Workplace Employment Relations Survey,
Routledge, London
Lazear, E. (2000) "Performance Pay and Productivity", American Economic Review, 90, 1346-
1361
Lazear, E. P. and Gibbs, M. (2015) Personnel Economics in Practice, Wiley
Lazear, E. P., Shaw, K. L. and Stanton, C. T. (2015) "The Value of Bosses," Journal of Labor
Economics 33, 4: 823-861
Lemieux, T., MacLeod, W. B., Parent, D. (2009) "Performance Pay and Wage Inequality",
Quarterly Journal of Economics, 124 (1): 1–49
Machin, S. (1995) “Plant Closures and Unionisation in British Establishments”, British Journal
of Industrial Relations, 33:1, 55-68
Machin, S. J. and McNally, S. (2008) “The Literacy Hour”, Journal of Public Economics, 92,
5-6, 1441-1462
McNally, S. (2015) Schools: the evidence on academies, resources and pupil performance,
CEP Election Analysis Paper EA023, London School of Economics

45
McNamara, O., Howson, J., Gunter, H. and Fryers, A. (2010) No job for a woman? The impact
of gender in school leadership. London: NASUWT
Patty, J. W. (2014) "Leadership and the Bureaucracy", Presentation at the Leadership in
American Politics Conference, University of Virginia, 2-3 June 2014
Riley, R. and Robinson, C. (2011) Skills and Economic Performance: The Impact of Intangible
Assets on UK Productivity Growth, UK Commission for Employment and Skills,
Evidence Report 39.
Rosener, J. B. (1990) “Ways women lead”, Harvard Business Review, 68, 6: 119-125
Slater, H., Davies N. and Burgess, S. (2012) "Do Teachers Matter? Measuring the Variation in
Teacher Effectiveness in England", Oxford Bulletin of Economics and Statistics, 74(5)
629-45
Smith, N., Smith, V. and Verner, M. (2006) "Do women in top management affect firm
performance? A panel study of 2,500 Danish firms", International Journal of
Productivity and Performance Management, Vol. 55 Issue: 7, pp.569-593,
Stokes, L., Bryson, A. and Wilkinson, D. (2017) “Does Leadership Matter for School
Performance?”, UCL/NIESR mimeo
Sun, R. S. and G. G. Van Ryzin (2014). "Are Performance Management Practices Associated
With Better Outcomes? Empirical Evidence From New York Public Schools."
American Review of Public Administration 44(3): 324-338
Syverson, C. (2011) "What Determines Productivity?", Journal of Economic Literature, 49, 2:
326-365
Tavares, P. A. (2015). "The impact of school management practices on educational
performance: Evidence from public schools in Sao Paulo." Economics of Education
Review 48: 1-15

46
Van Wanrooy, B., Bewley, H., Bryson, A., Forth, J., Freeth, S., Stokes, L. and Wood, S. (2013)
Employment Relations in the Shadow of Recession: Findings from the 2011 Workplace
Employment Relations Study, Palgrave MacMillan
White, M. and Bryson, A. (2013) 'Positive Employee Attitudes: How Much Human Resource
Management Do You Need?', Human Relations, 66, 3: 385-406

47
Table A1: Schools and Other Workplaces in WERS 2004 and WERS 2011, Unweighted
2004 2011 All
Private, not school 1691 1794 3485
Public, not school 464 620 1084
Primary school 85 141 226
Secondary school 45 84 129
Technical/vocational school 10 41 51
All 2295 2680 4975

48
Appendix Table A2: Management Practices
HRM Domain: HRM measures for each domain: KR20
Incentives
(0,4)
Any performance pay; managers appraised; 100% non-managers appraised; non-manager
appraisal linked to pay
0.50
Records (0,9) Sales, costs, profits, labour costs, productivity, quality, turnover, absence, training 0.77
Targets (0,11) Volume, costs, profits, ULCs, productivity, quality, turnover absence, training, job sat, client
sat
0.85
Teams (0,4) 100% largest non-managerial occupation in teams; teams depend on each other to perform
work; team responsible for products and services; team jointly decides how to do the work
0.63
Training (0, 5) 80% largest non-managerial occupation had on-job training lasts 12 months; workplace has
strategic plan with employee focus; Investors in People Award; standard induction programme
for new staff in largest non-managerial occupation; number of different types of training
provided is above population median.
0.57
TQM (0, 3) Quality circles; benchmarking; formal strategic plan for improving quality. 0.47
Participation
(0,5)
Formal survey of employee views in last 2 years; management-employee consultation
committee; workforce meetings with time for questions; team briefings with time for questions;
employee involvement initiative introduced in last 2 years.
0.55
Selection (0,7) References used in recruitment; recruitment criteria include skills; recruitment criteria include
motivation; recruitment criteria include qualifications; recruitment criteria include experience;
recruitment includes personality or aptitude test; recruitment includes competence or
performance test.
0.51
Note: KR20 is the Kuder-Richardson coefficient of reliability used for dichotomous items.

49
Table A3: Quality of the Match, Propensity Score Matching
-----------------------------------------------------------------------------------
Sample | Ps R2 LR chi2 p>chi2 MeanBias MedBias B R %Var
-----------+-----------------------------------------------------------------------
Unmatched | 0.473 1111.06 0.000 96.9 95.3 230.8* 0.38* 67
Matched | 0.007 5.86 0.210 8.1 7.0 19.3 0.33* 100
-----------------------------------------------------------------------------------
* if B>25%, R outside [0.5; 2]

50
Appendix Table A4: Sample Balance Before and After Weighting with Entropy Weights
Before: without weighting
| School | Non-school
| mean variance skewness | mean variance skewness
-------------+---------------------------------+---------------------------------
N employees | 147.7 54804 3.854 | 458.4 1304529 5.455
Aged over 25 | .5246 .25 -.09864 | .2486 .1869 1.163
Prop. female | .7885 .02223 -.4446 | .4909 .08017 .005645
% prof. | 42.73 405.9 .1277 | 11.36 386 1.977
After: with entropy weights
| School | Non-school
| mean variance skewness | mean variance skewness
-------------+---------------------------------+---------------------------------
N employees | 147.7 54804 3.854 | 147.7 54801 3.863
Aged over 25 | .5246 .25 -.09864 | .5245 .2495 -.09805
Prop. female | .7885 .02223 -.4446 | .7884 .02222 -.442
% prof. | 42.73 405.9 .1277 | 42.72 405.8 .1288

51
Appendix Figure A1: Workplace Performance Distribution for Schools and Non-School
Workplaces
Appendix Figure A2: Change in Workplace Performance, 2004-2011
1552
148
558
842881 912
492
216144
0
20
040
060
080
010
00
Fre
qu
en
cy
0 2 4 6 8 10
All Workplaces
1 2
14
40
51
72 73
34
25 23
020
40
60
80
Fre
qu
en
cy
0 2 4 6 8 10
Schools
1450
134
518
791 809839
458
191121
0
20
040
060
080
0
Fre
qu
en
cy
0 2 4 6 8 10
Non-schools
Workplace Performance, Unweighted N
1 1 5 7
2636
89
126
143
126
78
46
2114
5 1 1
050
10
015
0
Fre
qu
en
cy
-10 -5 0 5 10Change in Additive Performance Scale 2004-11
All Panel
1 1
4 4
6
4
9
14
2
45
1 1
05
10
15
Fre
qu
en
cy
-10 -5 0 5Change in Additive Performance Scale 2004-11
Schools
1 1 4 6
2232
83
122134
112
76
42
16134 1 1
050
10
015
0
Fre
qu
en
cy
-10 -5 0 5 10Change in Additive Performance Scale 2004-11
Non-schools
Histograms perf change 2004-2011

52
Appendix Figure A3: Common Support for Schools in the Non-school Sample
0 .2 .4 .6 .8 1Propensity Score
Untreated Treated: On support
Treated: Off support
Common Support for Schools