Can Fin Homes Ltd. at a glance - Paul Asset Fin Homes Ltd. at a glance Information to investors as...
19
Can Fin Homes Ltd. at a glance Information to investors as of 31/12/13 26 years of vision, passion and progress and offering home loans since 1987…..and it is just a beginning
Transcript of Can Fin Homes Ltd. at a glance - Paul Asset Fin Homes Ltd. at a glance Information to investors as...

Can Fin Homes Ltd. at a glance
Information to investors as of 31/12/13
26 years of vision, passion and progress and offering home loans
since 1987…..and it is just a beginning

|
About us
1
Legacy
Focus
Reach
▪ 26 year old institution registered as a deposit taking HFC with NHB
▪ Promoted by Canara Bank in the year 1987 which owns 42.38%
shareholding of Can Fin homes
▪ Listed in 1991, with uninterrupted dividend payment since inception
▪ Very clear focus to promote ownership and increase housing stock,
across India, with a motto of friendship finance
▪ Predominantly lend to individuals (93% of loan book)
▪ Key enabler for over 175,000 families to own homes
▪Headquartered in Bangalore
▪ Pan-India presence with 81 branches* in over 15 states
▪ Added 40 branches in the last two years
(31/12/13)
Financials ▪ Loan book of Rs.5,355 Cr, CAGR of 24% in the last three years
▪ Asset quality – GNPA :Rs.16.93 Cr (0.3%)
▪RoA – 1.7%, RoE – 16%
▪ AA+ rating from 3 rating Agencies (Deposits/Term Loans/NCDs)

|
Board of Directors
2
Occupation Name of the Director Designation
Shri. Subramanian
Ramachandran Iyer
(Shri.S.R.Iyer)
Chairman Former Managing Director, State
Bank of India
Shri.C. Ilango Managing Director General Manager
Canara Bank
(deputed to Can Fin as MD)
Shri.K.R.Vijayendra Director Former General Manager,
Union Bank of India
Shri.P.B.Santhana Krishnan Director Practising Chartered Accountant
Shri S. A. Kadur Director General Manager
Canara Bank
Shri T. V. Rao Director Director – (E.C.) EXIM Bank

|
Management Team
3
Managing Director Mr.C.Ilango
Asst. Gen. Managers (8) Chief Managers (10)
Mr.K.S.Sathyaprakash, R.O. Mr.V.Durga Rao, R.O.
Mr.Rm.Veerappan, R.O. Mr.A.Madhukar
Mrs.M.Shamila, R.O. Mr.N Babu
Mr.Atanu Bagchi, R.O. Mr.G.K.Nagaraja Rao
Mr.P.V.S.Raju Mr.Prashanth Shenoy
Mr.Sunil Mittal Mr.R.Murugan
Mr.Ajay Kumar Shettar Mr.M.Sundar Raman
Mr.B.M.Sudhakar Mr.Jagadeesha Acharya
Mr.H.R.Narendra
Mr.Prakash Shanbogue
Senior Consultant/ Vigilance Officer Mr.Jayananda Rao

|
Sanctions
4
Sanction growth – FY07 to FY13 (annual) – 7 yrs & FY14 (9 months)
Rs. crores CAGR % upto FY13

|
Disbursements
5
Disbursements growth – FY07 to FY13 (Annual) -7 yrs & FY14 (9 months)
Rs. crores CAGR % upto FY13

|
Loan book
6
Loan book growth – FY07 to FY13 (Annual) – 7 yrs & FY14 (9 months)
Rs. crores CAGR % upto FY13
+35%

|
Loan mix – As on 31/12/13
7
• 92% of loans are retail Individual Housing Loans
• Average loan ticket size is Rs.16 lakhs
• Majority of individual loans are towards the salaried class (90%+)
• Average age of Individual borrower – 35 years
• Share of Non-Housing Loans – 7.63%
• 4 southern states constitute about 70% of the loan book

|
Historical Business Data (Annual)
8
(Rs. Crores)
Particulars Mar 07 Mar 08 Mar 09
Mar 10
Mar 11
Mar 12
Mar 13 Dec13
Sanctions 417 264 356 653 546 1105 2093 2151
Disbursements 453 247 301 547 473 859 1814 1864
Loan Book 1,913 1,882 1,875 2,098 2,202 2,679 4,016 5,355
Gross NPA (%) 1.6 1.5 1.4 1.1 1.1 0.7 0.4 0.3
Net NPA 0.4 0.3 0.1 0.0 0.0 0.0 0.0 0.0
Net Profit 30 28 32 39 42 44 54 56
Branches 43 39 40 40 41 52 69 81
Employees
(Nos.)
233 210 202 205 224 252 319 382

|
Key Data on Profits/Ratios
9
(Rs. Crores)
Income Statement Mar-07 Mar-08 Mar-09 Mar-10 MAR-11 Mar-12 Mar-13
Net interest income 53 46 51 63 72 84 96
Other income 5 4 5 8 5 7 14
Total opex 12 12 12 17 17 23 36
Provisions 6 1 1 -1 1 7 -1
Tax 10 9 12 16 17 17 21
Net Profit 30 28 32 39 42 44 54
Balance Sheet Mar-07 Mar-08 Mar-09 Mar-10 Mar-11 Mar-12 Mar-13
Networth 198 220 246 275 311 348 392
Borrowings 1,752 1,695 1,650 1,865 1,904 2,300 3,538
Loan book 1,913 1,882 1,875 2,098 2,202 2,679 4,016
Total assets 1,994 1,973 1,951 2,192 2,275 2,716 4,049
Key Ratios (%) Mar-07 Mar-08 Mar-09 Mar-10 Mar-11 Mar-12 Mar-13
NIM 2.8 2.4 2.7 3.1 3.3 3.5 2.9
CAR 13.1 20.7 16.1 17.1 19.1 17.4 14.7
Return on Assets (%) 1.6 1.4 1.7 1.9 1.9 1.8 1.6
Return on Equity (%) 15 13 13 15 15 13 14

|
Data for 9 Quarters
10
(Rs. Crores)
Income
Statement
Dec-11
3QFY12
Mar-12
4QFY12
Jun-12
1QFY13
Sep-12
2QFY13
Dec-12
3QFY13
Mar-13
4QFY13
Jun-13
1QFY14
Sep-13
2QFY14
Dec-13
3QFY14
Net interest
income
22.56 20.10 20.85 22.08 25.21 27.55 32.96 32.78 34.64
Other income 1.90 3.27 2.59 3.49 3.71 4.20 4.25 5.39 5.66
Total opex 5.61 7.22 7.58 8.31 9.07 11.01 10.60 10.92 10.41
Provisions 0.54 -2.15 0.85 -1.10 1.46 -2.60 2.50 1.50 1.00
Tax 7.50 4.00 3.50 3.90 5.10 8.40 7.60 7.00 8.54
Net Profit 10.80 14.30 11.50 14.46 13.29 14.94 16.51 18.74 20.35
Balance Sheet Dec-11 Mar-12 Jun-12 Sep-12 Dec-12 Mar-13 Jun-13 Sep-13 Dec-13
Net-worth 340 348 359 374 386 392 409 427 448
Borrowings 2,079 2,300 2,521 2,768 3,144 3,539 3,901 4,315 4,817
Loan book 2,449 2,673 2,907 3,224 3,592 4.016 4,400 4,864 5,355
Total assets 2,419 2,716 2,880 3,142 3,503 4,049 4,310 4,970 5,471
Key Ratios Dec-11 Mar-12 Jun-12 Sep-12 Dec-12 Mar-13 Jun-13 Sep-13 Dec-13
NIM (%) 3.73 3.51 2.98 2.93 2.93 2.93 3.13 2.98 2.85
CAR (%) 19.14 17.44 16.37 15.33 15.21 14.72 15.33* 15.85* 14.98*
Gross NPA 25.04 19.01 26.62 23.90 30.65 15.66 16.94 16.44 16.93
Net NPA 1.93 0.00 6.42 1.90 8.65 0.00 1.28 0.78 0.02
Note: * Provisional

|
Asset quality
11
GNPA and NNPA – FY07 to FY13 (Annual) – 7 yrs & FY14 (9 months)

|
Net Profit
12
3028
32
3942
44
5456
0
10
20
30
40
50
60
FY07 FY08 FY09 FY10 FY11 FY12 FY13 FY14(9m)
Net Profit growth – FY07 to FY13 (Annual) – 7 yrs & FY14 (9 months)
Rs. Crores CAGR Per cent

|
Funding mix & Ratings
13
Per cent
Strong credit rating :
MAA+ by ICRA for
deposit program
ICRA AA+ for Term Loans
Care AA+ & India AA+ for
NCDs
Can Fin is one among the
four HFCs selected by
NHB in its first phase of
securitisation programme
Rs. 3,539 Crores as of March 2013
Mar-07 Mar-08 Mar-09 Mar-10 Mar-11 Mar-12 Mar-13
NHB 31% 35% 36% 28% 29% 26% 51%
Bank loans 58% 56% 54% 61% 63% 68% 44%
Deposits 11% 9% 10% 11% 8% 6% 5%

|
Capital Adequacy
14
* provisional
Comfortable capital adequacy – when compared to NHB requirement of 12%
|
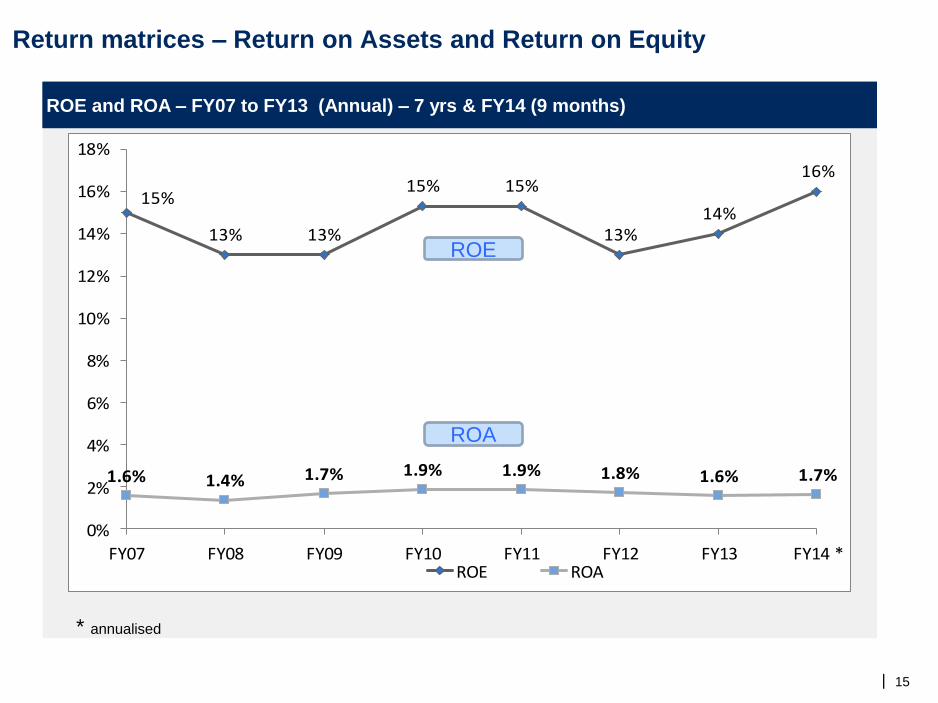
Return matrices – Return on Assets and Return on Equity
15
* annualised
ROE and ROA – FY07 to FY13 (Annual) – 7 yrs & FY14 (9 months)
15%
13% 13%
15% 15%
13%14%
16%
1.6% 1.4% 1.7% 1.9% 1.9% 1.8% 1.6% 1.7%
0%
2%
4%
6%
8%
10%
12%
14%
16%
18%
FY07 FY08 FY09 FY10 FY11 FY12 FY13 FY14 *ROE ROA
ROE
ROA

|
Stock price, book value and shareholding pattern
16
Shareholding pattern as on December 31, 2013 Share price* vs. Book value per share (Rs.)
CanaraBank,
Promoter
42.4%
FII, 0.7%
NRIs, 0.5%
Other Corporate
bodies,
26.4%
Individuals,HUF & others,
30%92107
128 134
152
170
191
219
6168
52
80
107 112
136
174
Mar'07 Mar'08 Mar'09 Mar'10 Mar'11 Mar'12 Mar'13 Dec'13
BVPS Share Price
* Closing price as on the last trading day of the respective financial year
Source: BSE

|
Branch network – 81 branches* across 15+ states
17
Karnataka – Hubli, Davanagere,
Mysore, Bangalore, Mangalore,
Kanakapura, Mandya.
Kerala– Calicut, Kochi,
Thiruvananthapuram, Thrissur
Tamilnadu & Puduchery– Hosur, Chennai,
Tambaram, Madurai, Trichy, Coimbatore,
Thiruvallur, Erode, Vellore, Dindigul
Andhra Pradesh – Hyderabad, Vizag,
Vijayawada, Vizag-Steel Plant
Maharashtra– Navi Mumbai,
Mumbai, Pune
Gujarat– Ahmedabad,
Vadodara
Bihar- Patna
Odisha– Bhubaneshwar
MP & Chattisgarh – Bhopal,
Raipur, Indore
Rajasthan - Jaipur
Punjab & Haryana-
Chandigarh
Delhi & NCR- New Delhi, Gurgaon**, Noida**
Rohtak, Sonepat
UP – Lucknow
* As on 31/12/13
** Gurgaon and Noida comes within Haryana and UP respectively, but included in the NCR

|
Thank You
18
For investor clarifications contact:
Mrs. Veena G Kamath
Tel: 080 - 26564259
E-mail: [email protected]