Can breaking your wrist break your driving habit? · No information 58 people had no information 58...
24
Can breaking your wrist break your driving habit? Dr Charles Musselwhite Associate Professor Centre for Innovative Ageing Swansea University [email protected] www.drcharliemuss.com Encouraging Life-Long Mobility: Tuesday 7 th July 2015 16.00-17.30
Transcript of Can breaking your wrist break your driving habit? · No information 58 people had no information 58...

Can breaking your wrist break
your driving habit? Dr Charles Musselwhite
Associate Professor
Centre for Innovative Ageing
Swansea University
www.drcharliemuss.com
Encouraging Life-Long Mobility: Tuesday 7th July 2015 16.00-17.30

• Melissa, Calcraft, Clinical Specialist Physiotherapist, Southmead Hospital, Southmead Road , Bristol, BS10 5NB [email protected]
• Matthew Roberts, Research Fellow, College of Human and Health Sciences, Swansea Univerisyt, Singleton Park, Swansea, SA2 8PP [email protected]
• Rebecca Fox, Trauma Research Co-ordinator, Department of Orthopaedic Surgery, Frenchay Hospital, Frenchay Park Road, Bristol, BS16 1LE, UK [email protected]
• Annette Swinkels, Research Fellow, Faculty of Health & Life Sciences, University of the West of England, Stapleton, Bristol, BS16 1DD [email protected]
• Pat Turton, Senior Lecturer, Faculty of Health & Life Sciences, University of the West of England, Stapleton, Bristol, BS16 1DD [email protected]
• Sue Young, Participant Partner, University of the West of England, Stapleton, Bristol, BS16 1DD [email protected]
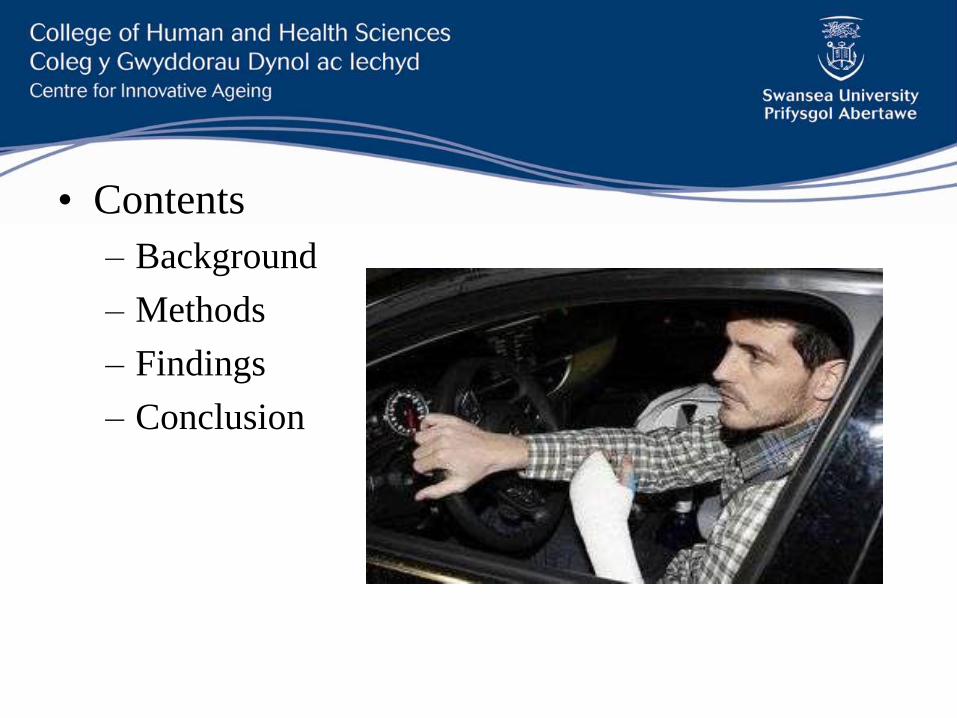
• Contents
– Background
– Methods
– Findings
– Conclusion

Background:
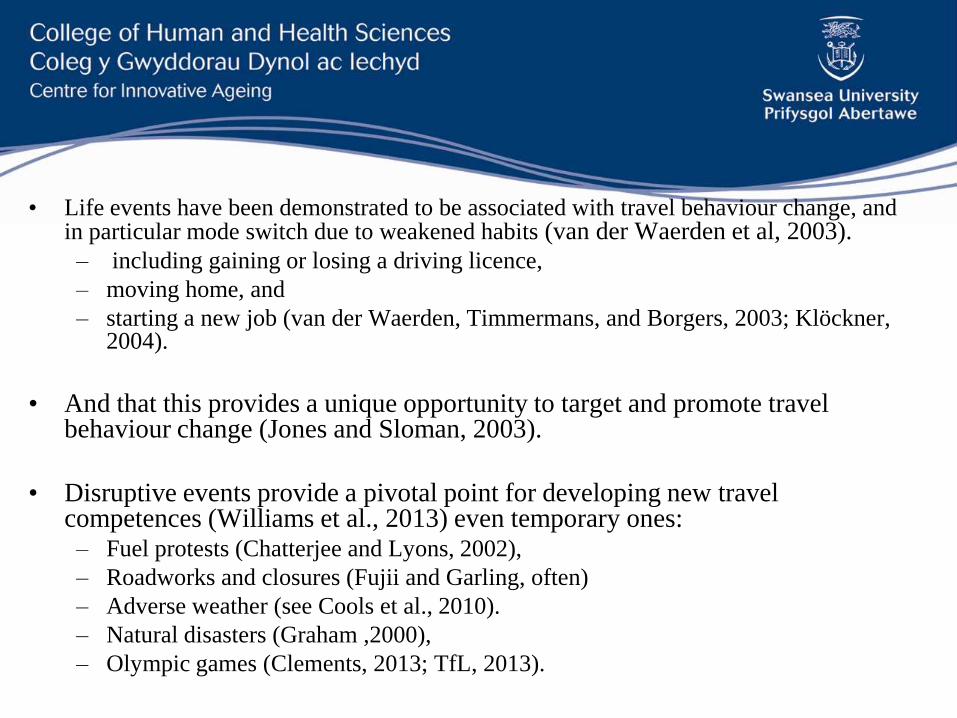
• Life events have been demonstrated to be associated with travel behaviour change, and in particular mode switch due to weakened habits (van der Waerden et al, 2003).
– including gaining or losing a driving licence,
– moving home, and
– starting a new job (van der Waerden, Timmermans, and Borgers, 2003; Klöckner, 2004).
• And that this provides a unique opportunity to target and promote travel behaviour change (Jones and Sloman, 2003).
• Disruptive events provide a pivotal point for developing new travel competences (Williams et al., 2013) even temporary ones: – Fuel protests (Chatterjee and Lyons, 2002),
– Roadworks and closures (Fujii and Garling, often)
– Adverse weather (see Cools et al., 2010).
– Natural disasters (Graham ,2000),
– Olympic games (Clements, 2013; TfL, 2013).
Premise:
Having the wrist or hand in plaster has the
potential to disrupt habitual travel
behaviour and is especially likely to create
a short-term cessation in driver behaviour.

• Previous studies suggest prevalence of driving
in a cast is mixed:
Edwards et al
(2009)
UK n=144 Postal survey 9%
Kennedy et al
(2006)
Ireland n=118 Survey 15%
Kalamaris et al
(2006)
Australia n=168 Survey 50%
(2/3 of men, 1/3
of women)
• Motivation for driving/not driving unknown.
• Effect of information provision unknown
• But health practitioners are reluctant to give advice to patients, largely due to the ambiguity in guidelines about returning to driving e.g. in – UK (Nunez and Giddins, 2004; Von Arx et al, 2004; Edwards et
al, 2009);
– USA (Chen and Jupiter, 2007; Chong, 2010);
– Australia (Kalamaras et al, 2006);
– Netherlands (Haverkamp et al, 2005); and
– Ireland (Kennedy et al, 2006).

Method

• Questionnaire sent to those having their (distal radius) cast removed by plaster technician to ask about prior travel behaviour, telephone follow up (response rate = 62%)
• n=111 (female 87; male 24)
• Av age = 57.08 years and met the criteria for normal distribution around a mode of 62 years.
• Females were slightly older than males, (no sig, diff)
• Participants had their casts on for between one and twelve weeks (median= 6 weeks, mean =5.5 weeks).
• On average, the participants drove 82.62 miles in a typical week, (males and younger drivers drove more mile)

Findings

Drove in a cast Did not drive in a cast
n 21 (18%) 90 (82%)
Mean age 53.38 years 57.94 years
Ordinary mileage 78.41 miles 104.05 miles
Male/female 9 (37.5%) /12 (13.8%) 15 (63.5%) /75 (86.2%)
Length of time in plaster 5.38 weeks 5.53 weeks
• For those that drove
– 15 drove less than normal (with 11 of these driving far less frequently).
– 5 people continued to drive the same amount
– 1 person drove more frequently.
• On the whole, people who drove with a cast stated that they thought it was safe to do so, and used compensatory behaviours to help them drive with an arm in a cast...
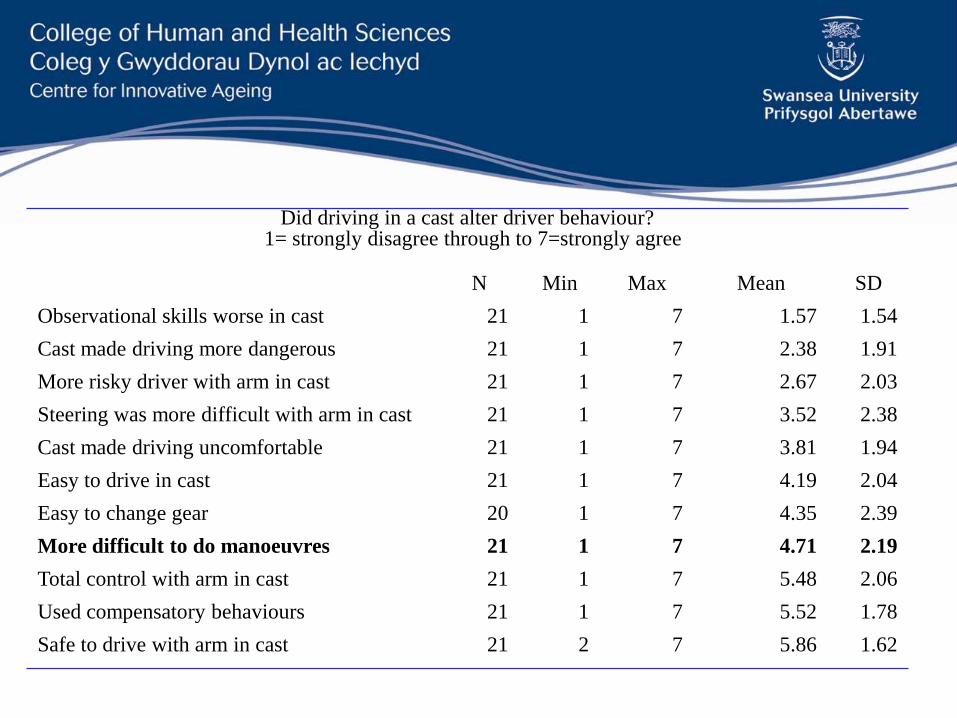
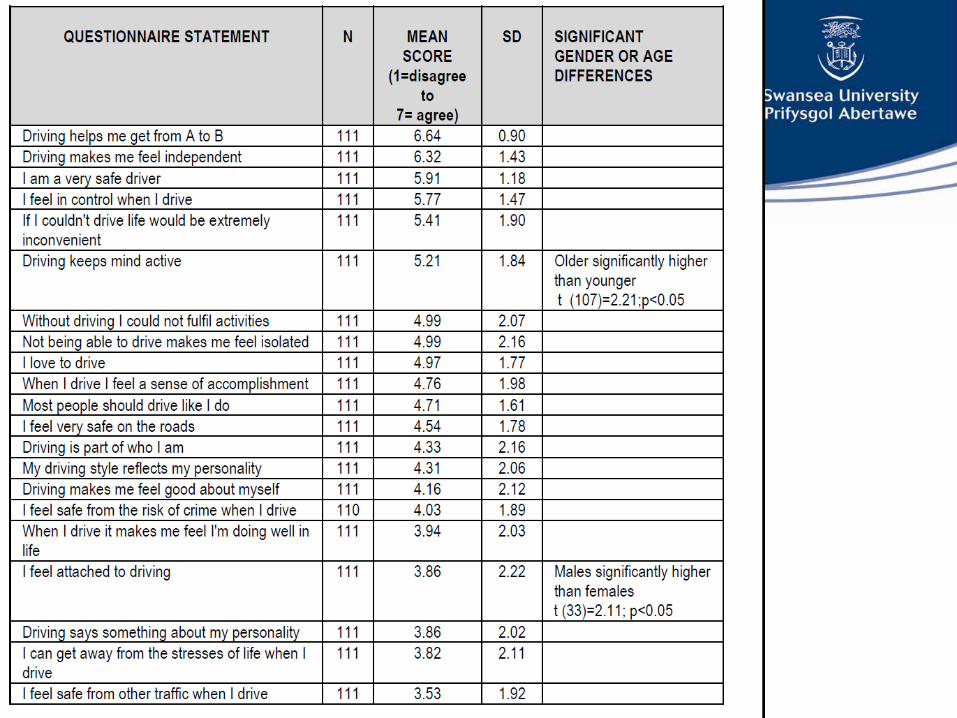
Did driving in a cast alter driver behaviour? 1= strongly disagree through to 7=strongly agree
N Min Max Mean SD
Observational skills worse in cast 21 1 7 1.57 1.54
Cast made driving more dangerous 21 1 7 2.38 1.91
More risky driver with arm in cast 21 1 7 2.67 2.03
Steering was more difficult with arm in cast 21 1 7 3.52 2.38
Cast made driving uncomfortable 21 1 7 3.81 1.94
Easy to drive in cast 21 1 7 4.19 2.04
Easy to change gear 20 1 7 4.35 2.39
More difficult to do manoeuvres 21 1 7 4.71 2.19
Total control with arm in cast 21 1 7 5.48 2.06
Used compensatory behaviours 21 1 7 5.52 1.78
Safe to drive with arm in cast 21 2 7 5.86 1.62

Mean (SD) Drove while in
cast
N Mean Std.
Deviation
Significant difference found
Effect on total miles 1.73 (1.56) No 90 1.73 1.57 t(109)=0.05; p=0.96; d=0.01
ns Yes 21 1.71 1.52
Cycled 2.79 (1.96) No 90 3.04 1.99 t(41.9)=3.61; p=0.001;
d=0.78* Yes 21 1.71 1.38
Lifts with
friends/family
4.51 (1.79) No 90 4.72 1.66 t(109)=2.61; p=0.01; d=0.58*
Yes 21 3.62 2.09
Walked 5.29 (1.77) No 90 5.51 1.57 t(24.8)=2.27; p=0.032; d=0.61
ns Yes 21 4.33 2.24
Bus 5.78 (1.6) No 90 5.90 1.48 t(109)=1.59; p=.114; d=0.35
ns Yes 21 5.29 2.00
Effect on total
journeys
taken
5.86 (1.74) No 90 6.18 1.37 t(23.1)=3.12; p=0.005;
d=0.86* Yes 21 4.48 2.42
Train 5.95 (1.5) No 90 6.10 1.32 t(24.1)=1.65; p=.112; d=0.45
ns Yes 21 5.33 2.03
[
Self-reported changes in use of modes when arm was in plaster (1=much less/fewer
through to 7=much more; significant differences in bold)
Miles: reduced. Cycling reduced (esp for drivers), lifts up for non-drivers, down for
drivers, walking increases, using the bus increases, total journeys increases (esp for non
drivers).

• Motivations?
• Are they risky people? (Musselwhite, 2006)
– No
• Are they more passionate about their car?
(Ellaway et al., 2003)
– No

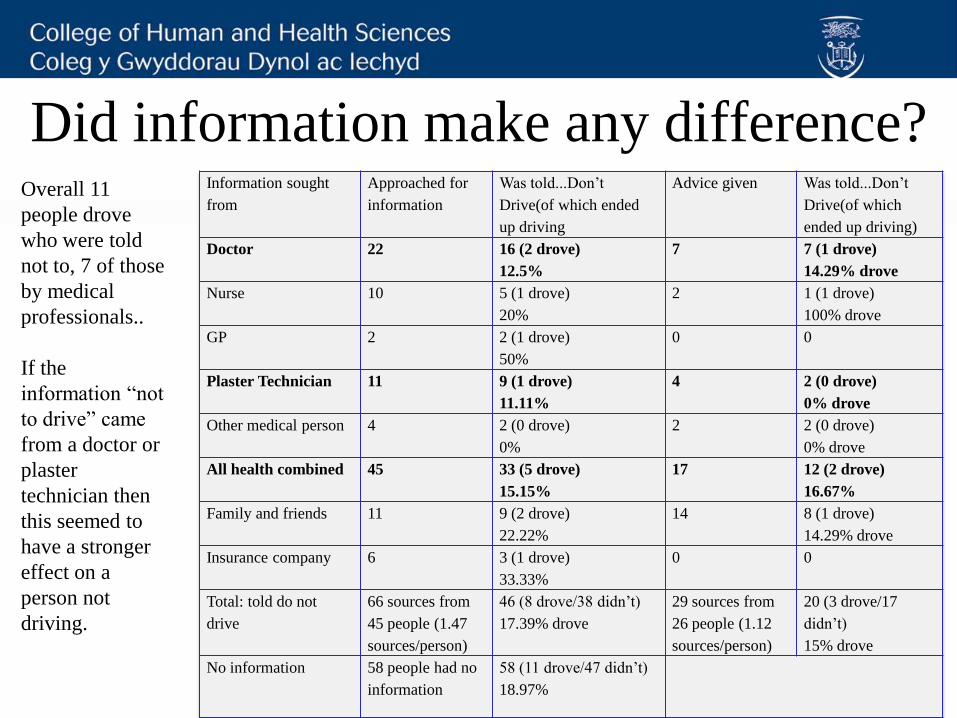
Did information make any difference? Information sought
from
Approached for
information
Was told...Don’t
Drive(of which ended
up driving
Advice given Was told...Don’t
Drive(of which
ended up driving)
Doctor 22 16 (2 drove)
12.5%
7 7 (1 drove)
14.29% drove
Nurse 10 5 (1 drove)
20%
2 1 (1 drove)
100% drove
GP 2 2 (1 drove)
50%
0 0
Plaster Technician 11 9 (1 drove)
11.11%
4 2 (0 drove)
0% drove
Other medical person 4 2 (0 drove)
0%
2 2 (0 drove)
0% drove
All health combined 45 33 (5 drove)
15.15%
17 12 (2 drove)
16.67%
Family and friends 11 9 (2 drove)
22.22%
14 8 (1 drove)
14.29% drove
Insurance company 6 3 (1 drove)
33.33%
0 0
Total: told do not
drive
66 sources from
45 people (1.47
sources/person)
46 (8 drove/38 didn’t)
17.39% drove
29 sources from
26 people (1.12
sources/person)
20 (3 drove/17
didn’t)
15% drove
No information 58 people had no
information
58 (11 drove/47 didn’t)
18.97%
Overall 11
people drove
who were told
not to, 7 of those
by medical
professionals..
If the
information “not
to drive” came
from a doctor or
plaster
technician then
this seemed to
have a stronger
effect on a
person not
driving.
• But...
sadly...


Conclusion
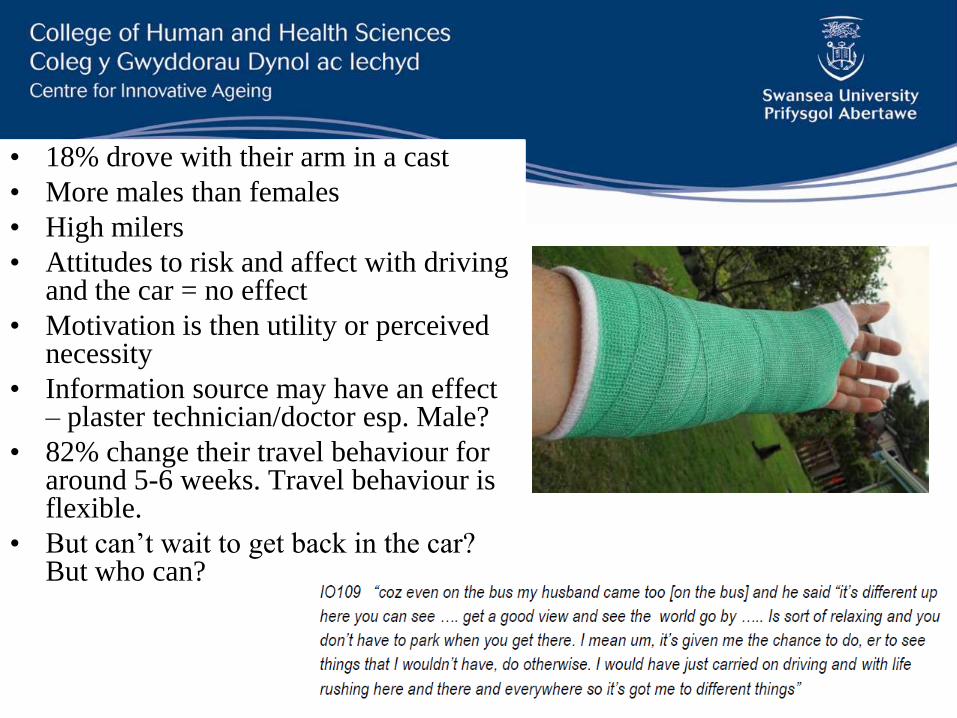
• 18% drove with their arm in a cast
• More males than females
• High milers
• Attitudes to risk and affect with driving and the car = no effect
• Motivation is then utility or perceived necessity
• Information source may have an effect – plaster technician/doctor esp. Male?
• 82% change their travel behaviour for around 5-6 weeks. Travel behaviour is flexible.
• But can’t wait to get back in the car? But who can?
References
• Calcraft, M. J., Fox, R., Musselwhite, C., Swinkels, A., Young, S and Turton, P. (2014). An investigation of factors influencing the resumption of driving by patients with one forearm immobilised in a below-elbow cast. A report for the British Association of Hand Therapists. University of the West of England and North Bristol NHS Trust. Available via http://www.drcharliemuss.com/giving-up-driving-in-later-life.html
• Ellaway A, Macintyre S, Hiscock R, Kearns A (2003). In the driving seat: psychosocial benefits from private motor vehicle transport compared to public transport. Transport Res F-Psy; 6.217-231
• Gregory JJ, Stephens AN, Steele NA, Groeger JA (2009). Effects of upper-limb immobilisation on driving safety, Injury; 40(3), 253-6
• Kalamaras, MA, Rando A, Pitchford DGK, (2006). Driving plastered: who does it, is it safe and what to tell patients ANZ Journal of Surgery; 76.439-441
• Kennedy, MT, Roche S, Lenehan B, Curtin W (2006). Driving Plastered: driving habits of Orthopaedic outpatients and the medico-legal implications Eur J Orthop Surg Traumatol; 16.228-230
• Musselwhite, CBA (2006). Attitudes towards vehicle driving behaviour: Categorising and contextualising risk Accident Anal Prev; 38 324-334