CAMS GA Emissions
26
Copernicus Atmosphere Monitoring Service CAMS General Assembly, Athens, 14- 16 June 2016 Claire GRANIER Laboratoire d'Aerologie, Toulouse, France Anthropogenic emissions
-
Upload
copernicus-ecmwf -
Category
Environment
-
view
58 -
download
0
Transcript of CAMS GA Emissions

Copernicus Atmosphere Monitoring Service
CAMS General Assembly, Athens, 14-16 June 2016
Claire GRANIERLaboratoire d'Aerologie, Toulouse, France
Anthropogenic emissions
2
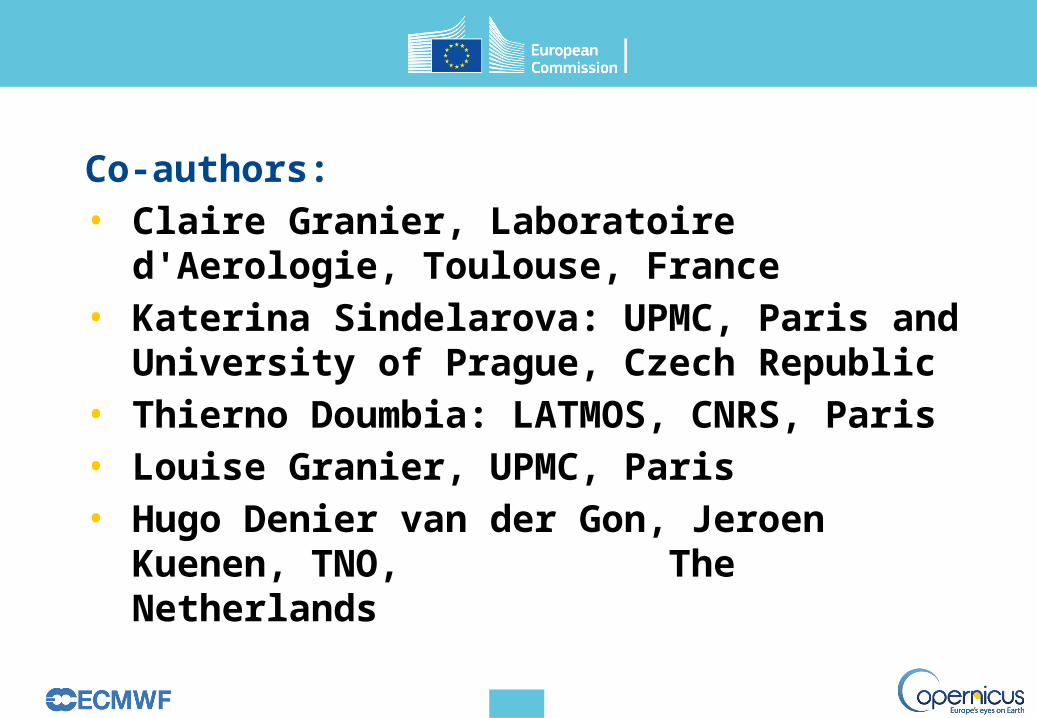
Co-authors:• Claire Granier, Laboratoire d'Aerologie, Toulouse, France• Katerina Sindelarova: UPMC, Paris and University of
Prague, Czech Republic• Thierno Doumbia: LATMOS, CNRS, Paris• Louise Granier, UPMC, Paris• Hugo Denier van der Gon, Jeroen Kuenen, TNO,
The Netherlands

3
What needs to be provided for the CAMS simulations and analyses:
- Anthropogenic emissions at the global scale- Anthropogenic emissions in Europe- Biogenic VOCs emissions

4
Anthropogenic emissions at the global scale
Currently used in CAMS = MACCity (inventory developed as part of the MACC and CityZen EU projects) (details in Granier et al., 2011)
Advantages: 1960-2016 (extended using RCP 8.5 scenario) consistent among all species VOCs speciation available Very simple seasonal variation
Main issues: Emissions after 2000 based on the RCP 8.5 scenario only MACCity does not take into account recent work in different world regions 0.5x0.5 degree resolution, 0.1x0.1 degree would be much better

5
Preparation of the new global inventory used in CAMS (resolution of 0.1x0.1 degree globally)Will be based on recent developments- EDGAR 4.2 and EDGAR 4.3- HTAPv2- ECLIPSEv5- Regional inventories (TNO-MACC, EPA, Env. Canada and Asian
emissions)+ use of the work currently under way for developing the new inventory for the IPCC runs. Currently called CEDS
Evaluation of all these inventories to define the methodology to build the new dataset
Major shortcoming: just preparatory work – building the new dataset exceeds what can be done under short term continuity contracts

6
Comparison of inventories: CO
Large differences among the datasets – Major issues found in the CEDS dataset work with the CEDS group to improve emissions in some regions

7
Very large differences in spatial distributions More work needed to define the best spatial resolution, for example using global/regional models.

8
Global scale: how to make up-to-date emissions for CAMS?
- Extrapolate from the past 2-3 years
- Use inverse modeling results from eithersurface or satellite observations
Several questions on the use of inverse techniques: Results are strongly model-dependent Uncertainties on other sources (biomass burning and/or biogenic) could lead to errors in the optimization of anthropogenic emissions The emissions of one species (either CO, or NO2, or VOCs) are
optimized in each system. What about the other co-emitted species? Use of optimized emissions for of only one species could lead to inconsistencies

9
Evaluation of inverse modeling results
The IGAC (International Global Atmospheric Chemistry Project) will launch on September 30th an assessment of inverse modeling techniques and results (during the IGAC 2016 conference)
Co-chairs of the assessment: Greg Frost (USA), Claire Granier (France) + 1-2 more co-chairs to be added
Outcome: a detailed report with review of previous work,Recommendations for use, recommendations for future work+ 2-3 review papers
Involvement of several CAMS partners + users expected
10
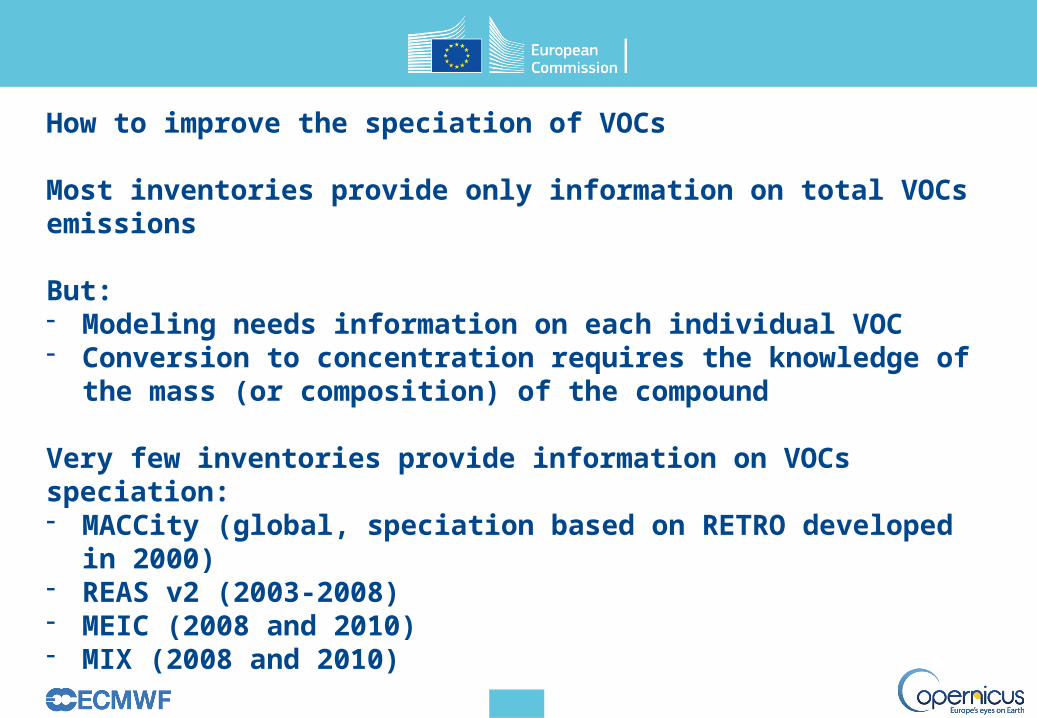
How to improve the speciation of VOCs
Most inventories provide only information on total VOCs emissions
But:- Modeling needs information on each individual VOC- Conversion to concentration requires the knowledge of the mass
(or composition) of the compound
Very few inventories provide information on VOCs speciation:- MACCity (global, speciation based on RETRO developed in 2000)- REAS v2 (2003-2008)- MEIC (2008 and 2010)- MIX (2008 and 2010)
11
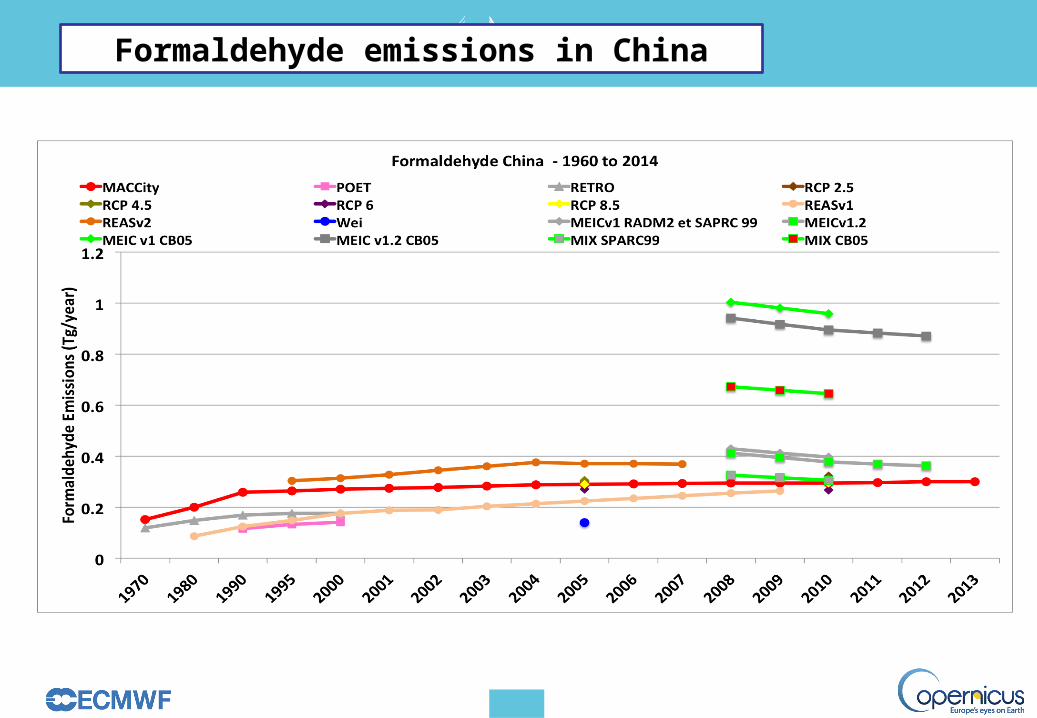
Formaldehyde emissions in China

12
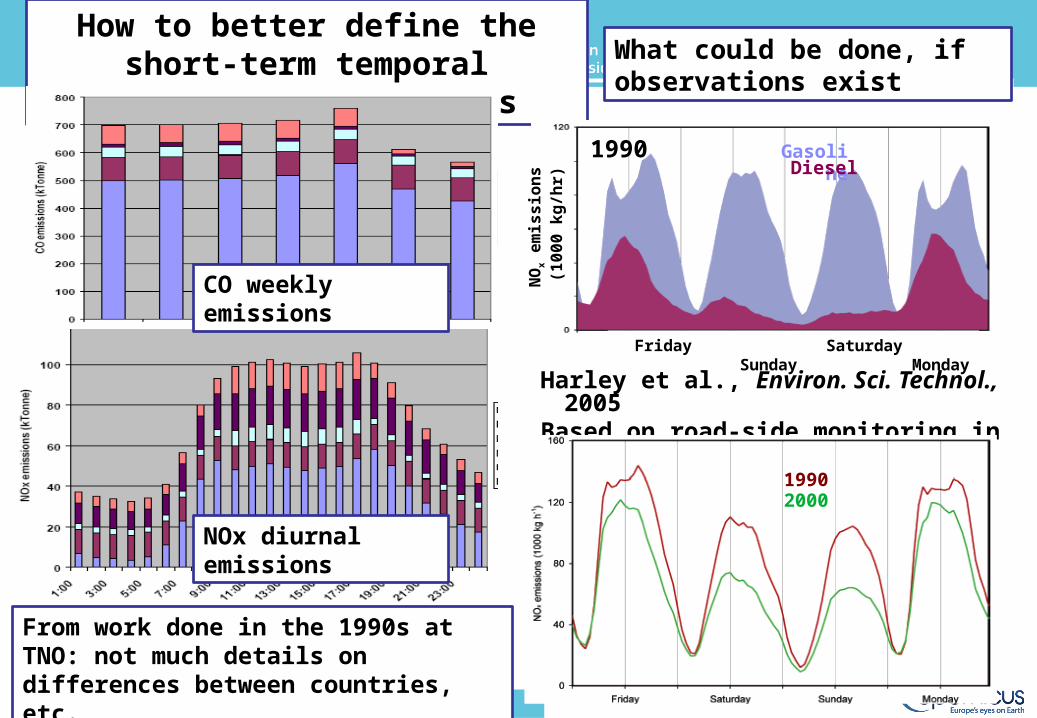
How to implement such temporal profiles?
detailed data only easily and freely available for UK
Are there any recent data available?
How to better define the short-term temporal variation of emissions
NOx diurnal emissions
From work done in the 1990s at TNO: not much details on differences between countries, etc.
CO weekly emissions
13
How to implement such temporal profiles?
detailed data only easily and freely available for UK
Are there any recent data available?
How to better define the short-term temporal variation of emissions
NOx diurnal emissions
From work done in the 1990s at TNO: not much details on differences between countries, etc.
CO weekly emissions
What could be done, if observations exist
Friday Saturday Sunday Monday
NO
x em
issi
ons (
1000
kg
/hr)
GasolineDiesel
1990
Harley et al., Environ. Sci. Technol., 2005Based on road-side monitoring in California
19902000
14
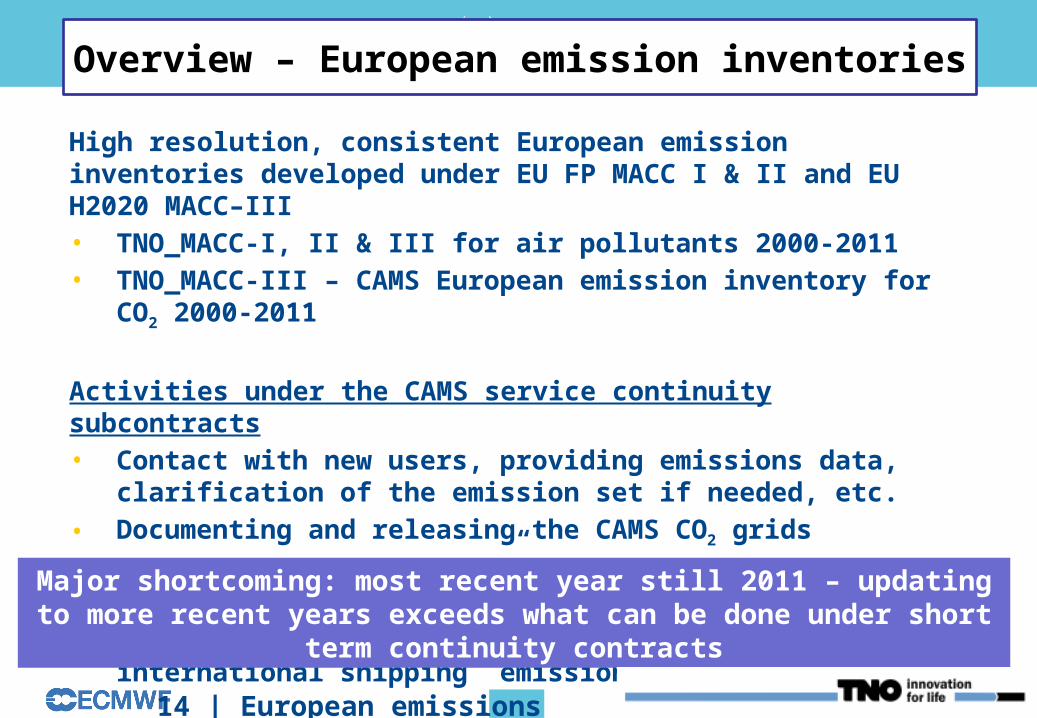
Overview – European emission inventories
High resolution, consistent European emission inventories developed under EU FP MACC I & II and EU H2020 MACC–III• TNO_MACC-I, II & III for air pollutants 2000-2011• TNO_MACC-III – CAMS European emission inventory for CO2 2000-2011
Activities under the CAMS service continuity subcontracts• Contact with new users, providing emissions data, clarification of the
emission set if needed, etc.• Documenting and releasing the CAMS CO2 grids• Influence of “dieselgate”on the TNO-MACC emission totals? • Investigation for a better distribution for international shipping emissions
14 | European emissions 12 June 2016
Major shortcoming: most recent year still 2011 – updating to more recent years exceeds what can be done under short term continuity contracts

TNO_MACC-III AIR POLLUTANTS 2000-2011The most used emission inventory for air quality modelling in Europe by
MACC and CAMS air quality forecasts and re-ananlysisThe AQMEII project ( JRC – US EPA AQ model Intercomparison Initiative)Many individual research teams and policy support studies
12 June 201615 | European emissions
Consistent emission trends 2000-2011 Individual countries in the EU-15+NOR+CHE; EU-NMS (13); Non-EU
Example EU15:

For all details, see Kuenen et al., ACP, 2014http://www.atmos-chem-phys.net/14/10963/2014/acp-14-10963-2014.pdf
Example gridded ~ 7 x 7 km TNO-MACC_III emissions data NOx emissions in 2009 for all sectors

TNO-CAMS CO2 INVENTORY (2000-2011) ~7 X7 KM DETAILED BY SECTORS
Here: CO2 2009 all sectors
increasing interest and need for high resolution CO2 data TNO-CAMS provides split between fossil and biofuel CO2

A QUESTION FROM USERS: HOW MUCH WILL THE TNO-MACC DATA FOR NOX CHANGE DUE TO “DIESELGATE”The problem: EU Emission Standards much lower than real world emissions
In the EU about 40% of the NOx emission is from road transport This 40% is about half due to passenger cars and light duty vehicles and the other half due to heavy duty vehicles (HDV)
We analyzed the emissions from PC and LDV byMaking a bottom-up inventory and applying consistent emission factors (EFs) following real world EFs, type approval EFs and comparing with country reported data as used in TNO-MACC_III. Quantify the differences and the impact on NO2 concentrations
12 June 201618 | European emissions
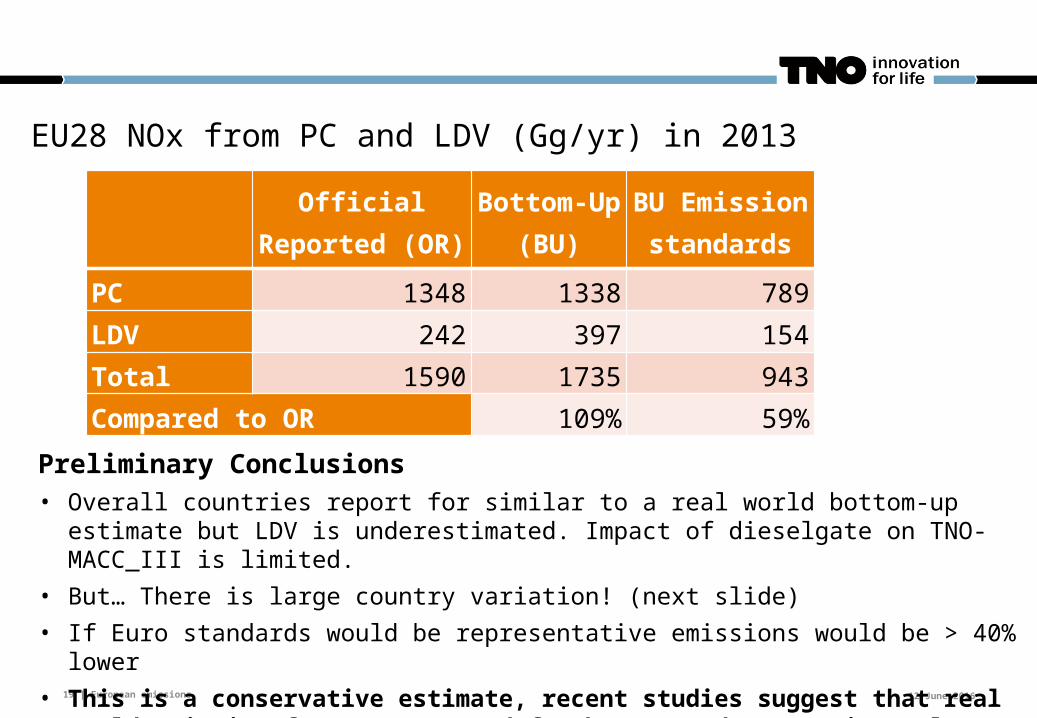
Official Reported (OR)
Bottom-Up (BU)
BU Emission standards
PC 1348 1338 789LDV 242 397 154Total 1590 1735 943Compared to OR 109% 59%
12 June 201619 | European emissions
EU28 NOx from PC and LDV (Gg/yr) in 2013
Preliminary Conclusions• Overall countries report for similar to a real world bottom-up estimate but LDV is
underestimated. Impact of dieselgate on TNO-MACC_III is limited.• But… There is large country variation! (next slide)• If Euro standards would be representative emissions would be > 40% lower• This is a conservative estimate, recent studies suggest that real world emission
factors may need further upward correction. Also HDV not included

PRELIMINARY RESULT OF USING THE EMISSION SCENARIOS IN THE LOTOS-EUROS AQ MODEL
Change in NO2 concentration Bottom-Up minus Official Reported (Blue: OR emission is higher).
Difference between countries varying from ± 10% in NO2
12 June 201620 | European emissions
Reduction in NO2 concentration if the emissions standard would be “real world”
Up to 15% lower NO2 compared to official reported emissions (important for exceedances and exposure)

MEGAN-MACC emission dataset
time resolutionmonthly means
spatial coverage globalspatial resolution 0.5° x 0.5°
isoprenea-pineneb-pinene
other monoterpenessesquiterpenes
COhydrogen cyanide
ethanepropane
butane and higher alkanesethene
propene butene and higher alkenes
methanolethanol
formaldehydeacetaldehyde
other aldehydesacetone
other ketonesformic acidacetic acid
toluene
List of modeled species(Sindelarova et al., 2014, ACP)
• dataset of biogenic VOC emissions• modeled by the MEGANv2.1 (Model of
Emissions of Gases and Aerosols from Nature, Guenther et al. 2012)
• driving meteorology from MERRA reanalysis (NASA Goddard Space Flight Center)
• actual MODIS Leaf Area Index data after 2000, climatological values prior 2000
• landcover distribution defined by 16 plant funtional types from CLM4 (Community Land Model)
Isoprene annual mean / mg.m-2.day-1

mon
thly
glo
bal t
otal
sla
titud
ean
nual
tota
lsm
onth
ly z
onal
mea
ns
mg.m-2.day-1
Tg.year-1
Tg.month-1
• temporal coverage of the MEGAN-MACC dataset developed under the MACC project was 31 years (1980-2010)
Isoprene emissions

mon
thly
glo
bal t
otal
sla
titud
ean
nual
tota
lsm
onth
ly z
onal
mea
ns
mg.m-2.day-1
Tg.year-1
Tg.month-1
Isoprene emissions
• the dataset was extended with 5 more years up to 2015 applying the same methodology
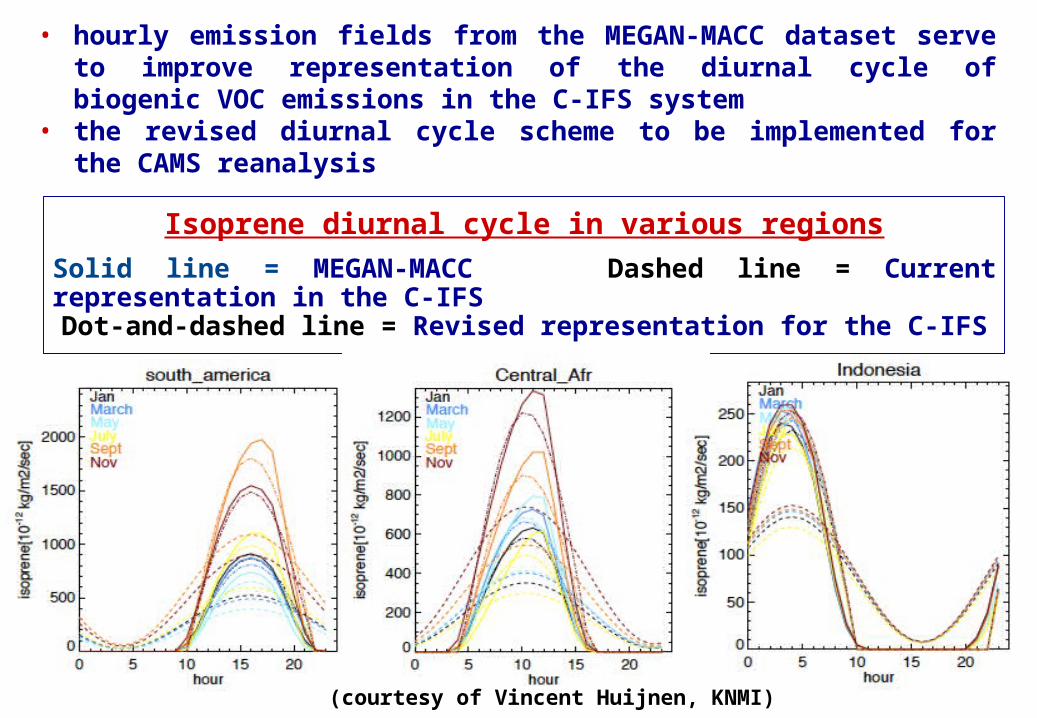
• hourly emission fields from the MEGAN-MACC dataset serve to improve representation of the diurnal cycle of biogenic VOC emissions in the C-IFS system
• the revised diurnal cycle scheme to be implemented for the CAMS reanalysis
Isoprene diurnal cycle in various regionsSolid line = MEGAN-MACC Dashed line = Current representation in the C-IFS
Dot-and-dashed line = Revised representation for the C-IFS
(courtesy of Vincent Huijnen, KNMI)

25
Where can you get access to most of these datasets + tools to analyze the emissionsECCAD = Emissions of Atmospheric Compounds and Compilation of Ancillary data http://pole-ether.fr/eccadCurrently: 2350 users from 848 institutes
Interested in ECCAD?Ask me
during the breaks
Example of usage of ECCAD: MEGAN-MACC downloaded 750 times

26
Thank you for your attention