CAMPBELL - Academy Park High School
62
CAMPBELL BIOLOGY Reece • Urry • Cain • Wasserman • Minorsky • Jackson © 2014 Pearson Education, Inc. TENTH EDITION 26 Phylogeny and the Tree of Life Lecture Presentation by Nicole Tunbridge and Kathleen Fitzpatrick
Transcript of CAMPBELL - Academy Park High School

CAMPBELL
BIOLOGY Reece • Urry • Cain • Wasserman • Minorsky • Jackson
© 2014 Pearson Education, Inc.
TENTH
EDITION
26 Phylogeny and
the Tree of Life
Lecture Presentation by
Nicole Tunbridge and
Kathleen Fitzpatrick

© 2014 Pearson Education, Inc.
Investigating the Tree of Life
Legless lizards have evolved independently in
several different groups

© 2014 Pearson Education, Inc.
Phylogeny is the evolutionary history of a species
or group of related species
For example, a phylogeny shows that legless
lizards and snakes evolved from different lineages
of legged lizards
The discipline of systematics classifies organisms
and determines their evolutionary relationships

© 2014 Pearson Education, Inc.
Figure 26.2
ANCESTRAL
LIZARD
(with limbs)
Geckos
No limbs
Snakes
Iguanas
Monitor lizard
Eastern glass lizard
No limbs

© 2014 Pearson Education, Inc.
Concept 26.1: Phylogenies show evolutionary relationships
Taxonomy is the scientific discipline concerned
with classifying and naming organisms

© 2014 Pearson Education, Inc.
Binomial Nomenclature
In the 18th century, Carolus Linnaeus published a
system of taxonomy based on resemblances
Two key features of his system remain useful
today: two-part names for species and hierarchical
classification
© 2014 Pearson Education, Inc.
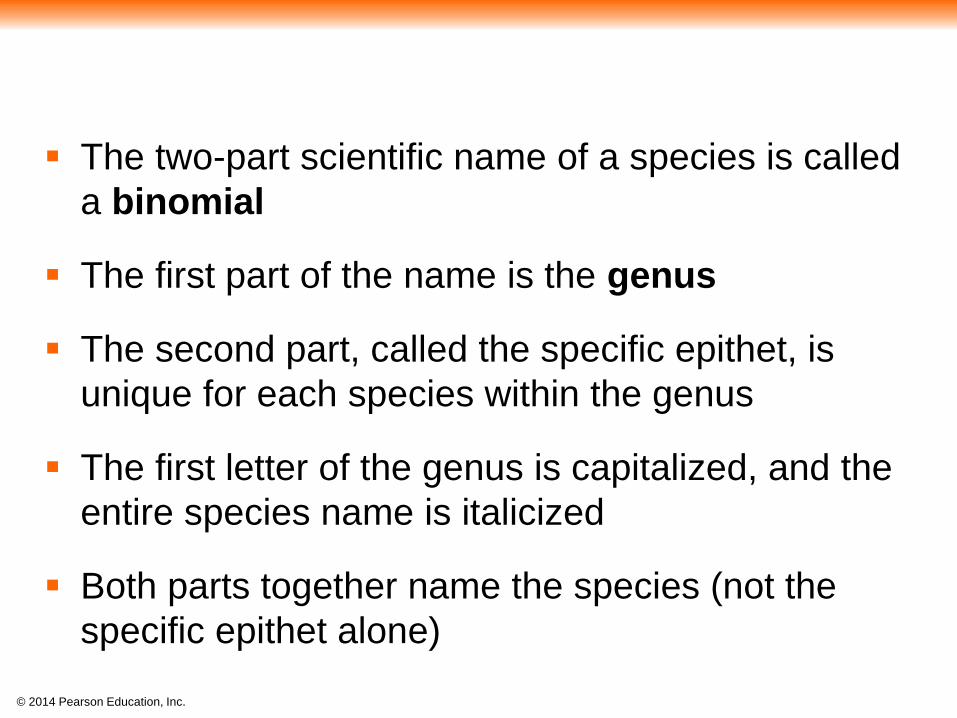
The two-part scientific name of a species is called
a binomial
The first part of the name is the genus
The second part, called the specific epithet, is
unique for each species within the genus
The first letter of the genus is capitalized, and the
entire species name is italicized
Both parts together name the species (not the
specific epithet alone)

© 2014 Pearson Education, Inc.
Hierarchical Classification
Linnaeus introduced a system for grouping species in
increasingly inclusive categories
The taxonomic groups from broad to narrow are
domain, kingdom, phylum, class, order, family,
genus, and species
A taxonomic unit at any level of hierarchy is called a
taxon
The broader taxa are not comparable between
lineages
For example, an order of snails has less genetic
diversity than an order of mammals

© 2014 Pearson Education, Inc.
Figure 26.3
Cell division error Species:
Panthera pardus
Genus:
Panthera
Family:
Felidae
Order:
Carnivora
Class:
Mammalia
Phylum:
Chordata
Domain:
Archaea
Kingdom:
Animalia
Domain:
Eukarya
Domain:
Bacteria

© 2014 Pearson Education, Inc.
Animation: Classification Schemes

© 2014 Pearson Education, Inc.
Linking Classification and Phylogeny
The evolutionary history of a group of organisms
can be represented in a branching phylogenetic
tree

© 2014 Pearson Education, Inc.
Figure 26.4
Order Family Genus Species
Panthera
pardus
(leopard)
Taxidea
taxus
(American
badger)
Lutra lutra
(European
otter)
Canis
latrans
(coyote)
Canis
lupus
(gray wolf)
Pan
thera
T
axid
ea
Lu
tra
Felid
ae
Mu
ste
lidae
Carn
ivo
ra
Can
is
Can
ida
e
2
1

© 2014 Pearson Education, Inc.
Linnaean classification and phylogeny can differ
from each other
Systematists have proposed a classification
system that would recognize only groups that
include a common ancestor and all its
descendants

© 2014 Pearson Education, Inc.
A phylogenetic tree represents a hypothesis about
evolutionary relationships
Each branch point represents the divergence of
two species
Tree branches can be rotated around a branch
point without changing the evolutionary
relationships
Sister taxa are groups that share an immediate
common ancestor

© 2014 Pearson Education, Inc.
A rooted tree includes a branch to represent the
last common ancestor of all taxa in the tree
A basal taxon diverges early in the history of a
group and originates near the common ancestor of
the group
A polytomy is a branch from which more than two
groups emerge

© 2014 Pearson Education, Inc.
Figure 26.5
1
2
3
4
5
Branch point:
where lineages diverge
ANCESTRAL
LINEAGE
This branch point
represents the
common ancestor of
taxa A–G.
This branch point forms
a polytomy: an
unresolved pattern of
divergence.
Taxon A
Taxon B
Taxon C
Taxon D
Taxon E
Taxon F
Taxon G
Sister
taxa
Basal
taxon

© 2014 Pearson Education, Inc.
What We Can and Cannot Learn from Phylogenetic Trees
Phylogenetic trees show patterns of descent, not
phenotypic similarity
Phylogenetic trees do not indicate when species
evolved or how much change occurred in a
lineage
It should not be assumed that a taxon evolved
from the taxon next to it

© 2014 Pearson Education, Inc.
Applying Phylogenies
Phylogeny provides important information about
similar characteristics in closely related species
A phylogeny was used to identify the species of
whale from which “whale meat” originated

© 2014 Pearson Education, Inc.
Figure 26.6
Results Minke (Southern Hemisphere)
Unknowns #1a, 2, 3, 4, 5, 6, 7, 8
Minke (North Atlantic)
Humpback
Blue
Unknown #9
Unknown #1b
Unknowns #10, 11, 12, 13
Fin

© 2014 Pearson Education, Inc.
Concept 26.2: Phylogenies are inferred from morphological and molecular data
To infer phylogenies, systematists gather
information about morphologies, genes, and
biochemistry of living organisms

© 2014 Pearson Education, Inc.
Morphological and Molecular Homologies
Phenotypic and genetic similarities due to shared
ancestry are called homologies
Organisms with similar morphologies or DNA
sequences are likely to be more closely related
than organisms with different structures or
sequences

© 2014 Pearson Education, Inc.
Sorting Homology from Analogy
When constructing a phylogeny, systematists
need to distinguish whether a similarity is the
result of homology or analogy
Homology is similarity due to shared ancestry
Analogy is similarity due to convergent evolution
© 2014 Pearson Education, Inc.
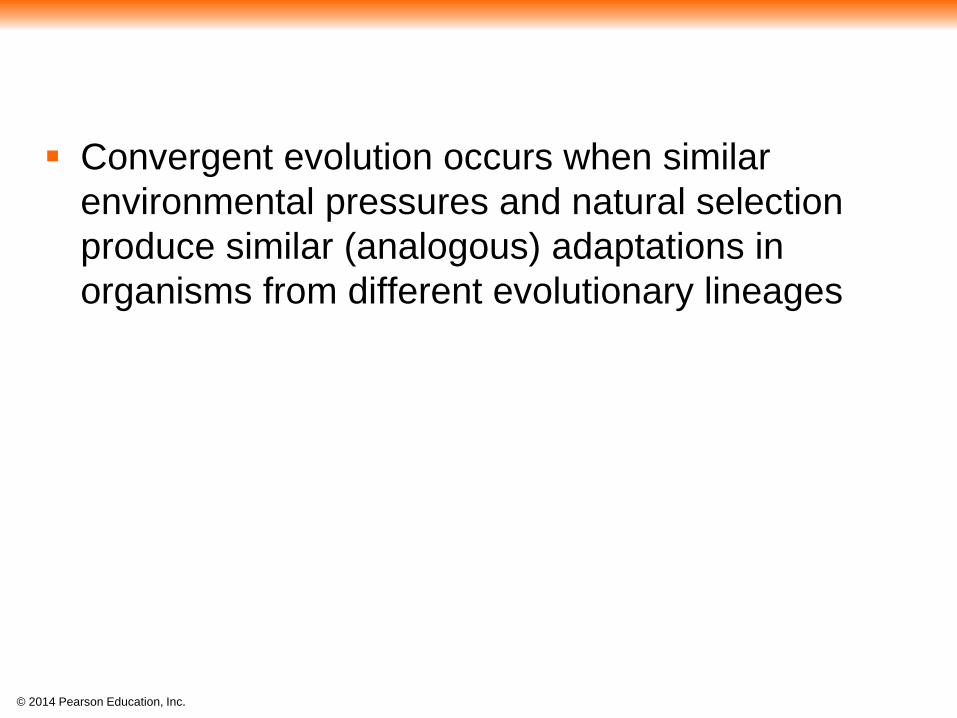
Convergent evolution occurs when similar
environmental pressures and natural selection
produce similar (analogous) adaptations in
organisms from different evolutionary lineages

© 2014 Pearson Education, Inc.
Figure 26.7
Australian marsupial “mole”
North American eutherian mole

© 2014 Pearson Education, Inc.
Bat and bird wings are homologous as forelimbs, but analogous as functional wings
Analogous structures or molecular sequences that evolved independently are also called homoplasies
Homology can be distinguished from analogy by comparing fossil evidence and the degree of complexity
The more elements that are similar in two complex structures, the more likely it is that they are homologous

© 2014 Pearson Education, Inc.
Evaluating Molecular Homologies
Systematists use computer programs and
mathematical tools when analyzing comparable
DNA segments from different organisms

© 2014 Pearson Education, Inc.
Figure 26.8-3
Cell division error
1
2 C C A T G T A C A G T A C C G
T A C C G C A C C A T
1
2
C A C C A T
C A C C A T G T A C C G
G T A C C G
T G A Insertion
Deletion
1 C A C C A T G T A C C G
2 C A C C A T G T A C C G

© 2014 Pearson Education, Inc.
Figure 26.8-4
Cell division error
1 C C A T
C C A T 2 G T A C A
C A
G T A C C G
T A C C G
1
2 C C A T G T A C A G T A C C G
T A C C G C A C C A T
1
2
C A C C A T
C A C C A T G T A C C G
G T A C C G
T G A Insertion
Deletion
1 C A C C A T G T A C C G
2 C A C C A T G T A C C G

© 2014 Pearson Education, Inc.
It is also important to distinguish homology from
analogy in molecular similarities
Mathematical tools help to identify molecular
homoplasies, or coincidences

© 2014 Pearson Education, Inc.
Figure 26.9
A C G G A T A G T C C A C T A G G C A C T A
C A T C C G A C A G G T C T T T G A C T A G

© 2014 Pearson Education, Inc.
Concept 26.3: Shared characters are used to construct phylogenetic trees
Once homologous characters have been
identified, they can be used to infer a phylogeny

© 2014 Pearson Education, Inc.
Cladistics
Cladistics groups organisms by common descent
A clade is a group of species that includes an
ancestral species and all its descendants
Clades can be nested in larger clades, but not all
groupings of organisms qualify as clades

© 2014 Pearson Education, Inc.
A valid clade is monophyletic, signifying that it
consists of the ancestor species and all its
descendants

© 2014 Pearson Education, Inc.
Figure 26.10
(a) Monophyletic group (clade) (b) Paraphyletic group (c) Polyphyletic group
1
2
3
A
B
C
D
E
F
G
A
B
C
D
E
F
G
A
B
C
D
E
F
G
Group I
Group II
Group III

© 2014 Pearson Education, Inc.
Figure 26.10a
(a) Monophyletic group (clade)
1
A
B
C
D
E
F
G
Group I

© 2014 Pearson Education, Inc.
Figure 26.10b
(b) Paraphyletic group
2
A
B
C
D
E
F
G
Group II
© 2014 Pearson Education, Inc.
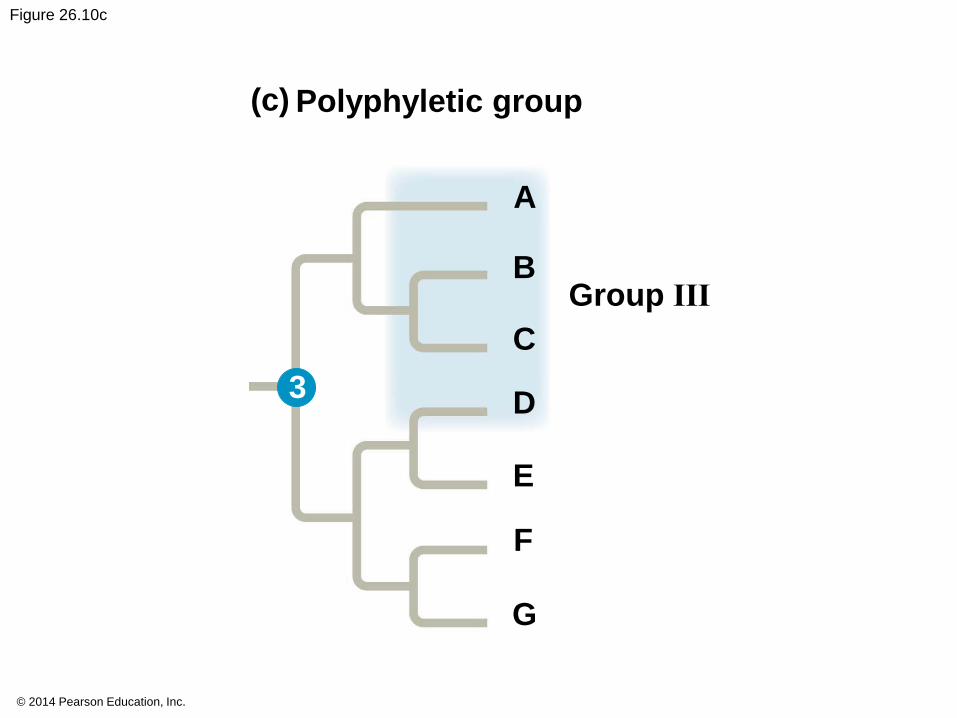
Figure 26.10c
(c) Polyphyletic group
3
A
B
C
D
E
F
G
Group III

© 2014 Pearson Education, Inc.
A paraphyletic grouping consists of an ancestral
species and some, but not all, of the descendants
A polyphyletic grouping includes distantly related
species but does not include their most recent
common ancestor

© 2014 Pearson Education, Inc.
Polyphyletic groups are distinguished from
paraphyletic groups by the fact that they do not
include the most recent common ancestor
Biologists avoid defining polyphyletic groups and
instead reclassify organisms if evidence suggests
they are polyphyletic

© 2014 Pearson Education, Inc.
Figure 26.11
Common ancestor of even-toed ungulates
Paraphyletic group
Polyphyletic group
Other even-toed ungulates
Hippopotamuses
Cetaceans
Seals
Bears
Other carnivores

© 2014 Pearson Education, Inc.
Shared Ancestral and Shared Derived Characters
In comparison with its ancestor, an organism has
both shared and different characteristics
A shared ancestral character is a character that
originated in an ancestor of the taxon
A shared derived character is an evolutionary
novelty unique to a particular clade
A character can be both ancestral and derived,
depending on the context

© 2014 Pearson Education, Inc.
Inferring Phylogenies Using Derived Characters
When inferring evolutionary relationships, it is
useful to know in which clade a shared derived
character first appeared

© 2014 Pearson Education, Inc.
Figure 26.12
Lancelet
(outgroup)
Lamprey
Bass
Frog
Turtle
Leopard
Hair
Amnion
(b) Phylogenetic tree
Four walking legs
Hinged jaws
Vertebral
column
Leo
pa
rd
Tu
rtle
Fro
g
Ba
ss
La
mp
rey
La
nc
ele
t
(ou
tgro
up
)
TAXA
Vertebral
column
(backbone)
Hinged jaws
Four walking
legs
Amnion
Hair
CH
AR
AC
TE
RS
(a) Character table
0 0 0 0 0
0 0 0 0
0 0 0
0 0
0 1 1 1 1 1
1 1 1 1
1 1 1
1 1
1

© 2014 Pearson Education, Inc.
Figure 26.12a
Character table (a)
Hair
Amnion
Four walking
legs
Hinged jaws
Vertebral
column
(backbone)
0 0 0 0 0
1 1 1 1 1
1 1 1 1
1 1 1
1 1
1
0 0 0 0
0 0 0
0 0
0
CH
AR
AC
TE
RS
Lan
cele
t
(ou
tgro
up
)
La
mp
rey
Ba
ss
Fro
g
Tu
rtle
Leo
pa
rd
TAXA

© 2014 Pearson Education, Inc.
Figure 26.12b
Lancelet
(outgroup)
Lamprey
Bass
Frog
Turtle
Leopard
Hair
Amnion
(b) Phylogenetic tree
Four walking legs
Hinged jaws
Vertebral
column

© 2014 Pearson Education, Inc.
An outgroup is a species or group of species that
is closely related to the ingroup, the various
species being studied
The outgroup is a group that has diverged before
the ingroup
Systematists compare each ingroup species with
the outgroup to differentiate between shared
derived and shared ancestral characteristics

© 2014 Pearson Education, Inc.
Characters shared by the outgroup and ingroup
are ancestral characters that predate the
divergence of both groups from a common
ancestor

© 2014 Pearson Education, Inc.
Phylogenetic Trees with Proportional Branch Lengths
In some trees, the length of a branch can reflect
the number of genetic changes that have taken
place in a particular DNA sequence in that lineage

© 2014 Pearson Education, Inc.
Figure 26.13
Drosophila
Lancelet
Zebrafish
Frog
Chicken
Human
Mouse

© 2014 Pearson Education, Inc.
In other trees, branch length can represent
chronological time, and branching points can be
determined from the fossil record

© 2014 Pearson Education, Inc.
Figure 26.14
Drosophila
Lancelet
Zebrafish
Frog
Chicken
Human
Mouse
PALEOZOIC MESOZOIC
542 251 65.5 Present
Millions of years ago
CENO- ZOIC

© 2014 Pearson Education, Inc.
Maximum Parsimony and Maximum Likelihood
Systematists can never be sure of finding the best
tree in a large data set
They narrow possibilities by applying the principles
of maximum parsimony and maximum likelihood

© 2014 Pearson Education, Inc.
Maximum parsimony assumes that the tree that
requires the fewest evolutionary events
(appearances of shared derived characters) is the
most likely
The principle of maximum likelihood states that,
given certain rules about how DNA changes over
time, a tree can be found that reflects the most
likely sequence of evolutionary events
Computer programs are used to search for trees
that are parsimonious and likely

© 2014 Pearson Education, Inc.
Figure 26.15
Technique
Species I Species II Species III
Three phylogenetic hypotheses: I
II
III
III
II
I III
II
I
I
III
II
3/A
2/T
3/A 4/C
I
III
II
I
III
II
I
III
II
Results
1/C
1/C
1/C I
III
II
I
III
II
1/C
1/C
I
III
II
4/C
3/A
2/T
3/A 2/T
2/T
3/A
4/C
4/C 2/T
4/C
I
III
II
6 events 7 events 7 events
Species I
Species II
Species III
Ancestral sequence
C
C
A
A G
G
T
T
T
T
T T
C A
C
A
1 2 4 3
Site
1
2
4
3
I
III
II

© 2014 Pearson Education, Inc.
Figure 26.15a
Technique
Species I Species II Species III
Three phylogenetic hypotheses: I
II
III
I
II
III
I
II
III 1

© 2014 Pearson Education, Inc.
Figure 26.15b
Technique
Species I
1 2 2 3 4
Species II
Species III
Ancestral
sequence
C
C
A
A
T
T
G
G
A
T
A
T
C
T
C
T
Site

© 2014 Pearson Education, Inc.
Figure 26.15c
I 3
1/C
4
Technique
II
III
I
II
III
1/C
1/C 1/C
1/C
I
II
III
I 3/A
II
III
2/T
4/C
3/A 4/C
I
II
III
2/T
3/A
4/C
4/C 2/T
4/C
3/A
2/T
2/T 3/A
I
II
III

© 2014 Pearson Education, Inc.
Figure 26.15d
I
II
III
I
II
III
I
II
III Results
6 events 7 events 7 events

© 2014 Pearson Education, Inc.
Phylogenetic Trees as Hypotheses
The best hypotheses for phylogenetic trees fit the
most data: morphological, molecular, and fossil
Phylogenetic bracketing allows us to predict
features of an ancestor from features of its
descendants
For example, phylogenetic bracketing allows us to
infer characteristics of dinosaurs

© 2014 Pearson Education, Inc.
Figure 26.16
Lizards
and snakes
Crocodilians
Ornithischian
dinosaurs
Saurischian
dinosaurs
Birds
Common ancestor of crocodilians, dinosaurs, and birds

© 2014 Pearson Education, Inc.
Birds and crocodiles share several features: four-
chambered hearts, song, nest building, and
brooding
These characteristics likely evolved in a common
ancestor and were shared by all of its
descendants, including dinosaurs
The fossil record supports nest building and
brooding in dinosaurs

© 2014 Pearson Education, Inc.
Figure 26.17
Front limb
Hind limb
Eggs
Fossil remains of Oviraptor and eggs
(a) Artist’s reconstruction of the dinosaur’s posture based on the fossil findings
(b)