Camp Parkway Commerce Center - The Chamber Parkway... · Camp Parkway Commerce Center and the costs...
29
Camp Parkway Commerce Center Fiscal Impact Analysis Southampton County, Virginia Prepared by Ted Figura Consulting for Hampton Roads Development, LLC Newport News, Virginia July 2, 2015 Revised October 22, 2015 and January 6, 2016 For Public and Private Sector Clients
Transcript of Camp Parkway Commerce Center - The Chamber Parkway... · Camp Parkway Commerce Center and the costs...

Camp Parkway Commerce Center
Fiscal Impact Analysis
Southampton County, Virginia
Prepared by
Ted Figura Consulting
for
Hampton Roads Development, LLC
Newport News, Virginia
July 2, 2015 Revised October 22, 2015 and January 6, 2016
For Public and Private
Sector Clients

- 1 -
Table of Contents Page Executive Summary…………………………………………………………………….. 3 Background……………………………………………………………………………... 5 Methodology……………………………………………………………………………. 7 Fiscal Impact………………………………………………..…………………………... 9 Potential Fire Protection Cost Impact…………………………………………………... 13 Combined Southampton County and City of Franklin Fiscal Impact………………….. 14 Appendix – Methodology Approach………………………………….……………………………….... A-1 Parameters and Assumptions……………………………………………….. A-3 Revenue Calculations………………………………………………………. A-3 Cost Calculations…………………………………………………………… A-11 Tables Table 1: Camp Parkway Commerce Center: Projected Building Construction Schedule. 6 Table 2: Camp Parkway Commerce Center: Projected Revenues………….………… 10 Table 3: Camp Parkway Commerce Center: Projected Costs…………………………... 11 Table 4: Camp Parkway Commerce Center: Projected Cash Flow………….…………. 12 Table 5: Camp Parkway Commerce Center: Fiscal Impact Measures…………………. 12 Table 6: Camp Parkway Commerce Center: Net Present Value of Projected Cash
Flow, All Funds………………………………………………………….. 13 Table 7: Camp Parkway Commerce Center: Net Present Value of Fiscal Impact
Measures, All Funds……………………………………………………… 13 Table 8: Camp Parkway Commerce Center: Combined Fiscal Impact on City and
County……………………………………………………………… Table A-1: Camp Parkway Commerce Center: Projected Building Construction
Schedule…………………………………………………………………...
14
Table A-2: Estimated Real Estate Assessments Based on County/City of Franklin Comparables……………………………………………………………… A-7
Table A-3: Projected Water Use at Buildout: Camp Parkway Commerce Center, by User Type…………………………………………………………………. A-10
Table A-4: Southampton County Non-School Expenditures: Expenditures per Service Unit Other than Businesses…………………………………………..……. A-13
A-4

- 2 -
General Limitation of Liability
Every reasonable effort has been made to ensure the accuracy of the information contained herein. This information is provided without warranty of any kind, either expressed or implied, including, but not limited to the implied warranties of merchantability and fitness of a particular purpose. The information contained in this package has been assembled from multiple sources and is subject to change without notice. The information contained herein is not to be construed or used as a “legal description.” In no event will Ted Figura Consulting, or its associated officers or employees, be liable for any damages, including loss of data, loss of profits, business interruption, loss of business information or other pecuniary loss that might arise from the use of information and tables contained herein. This information is proprietary. All rights are reserved. This material may not be reproduced, in whole or in part, in any form or by any means without the written permission of Ted Figura Consulting, with the exception of reproduction that is necessary to and intrinsic to the purpose for which it is provided.

- 3 -
Camp Parkway Commerce Center: Fiscal Impact Analysis
Executive Summary The fiscal impact that the proposed Camp Parkway Commerce Center will have on Southampton County has been determined to be highly positive. As the table shown below indicates, revenues to be generated by this development are substantial while the costs that the County will incur are expected to be minimal by comparison. The revenue shown subtracts tax revenue from the project that would be provided to the City of Franklin under the revenue sharing agreement for the district within which Camp Parkway Commerce Center will be located.
Camp Parkway Commerce Center Summary of Revenues and Costs
Annual in FY 2046
Thirty Year Total
Revenues General Fund $1,972,525 $30,854,725 Enterprise Fund $ 194,075 $ 3,406,800 Off-site Improvements $ 700,000
Total Revenues $2,166,600 $34,961,525 Costs General Fund $ 0 $ 0 Enterprise Fund $ 26,675 $ 577,550
Total Costs $ 26,675 $ 577,550 Cash Flow General Fund $1,972,525 $30,854,725 Enterprise Fund $ 167,400 $ 2,829,250 Off-site Improvements $ 700,000
Total Cash Flow $2,139,925 $34,383,975 Benefit to Cost Ratio 60.5-to-1
Hampton Roads Development, LLC is seeking a rezoning of approximately 439 acres, located in Southampton County at the intersection of Camp Parkway (U.S. 58 Business) and Delaware Road (the “Site”), from R1 (low density residential) to M1 (industrial) zoning. The purpose of the rezoning is to permit the development by the applicant of the Camp Parkway Commerce Center (the “Center”). The Center will be developed as a business campus environment consisting of approximately 13 class A industrial buildings totaling more than 3.2 million square feet. The Center will contain walking trails and bench areas, as well as manmade lakes that will provide stormwater capture and visual amenity.
- 4 -
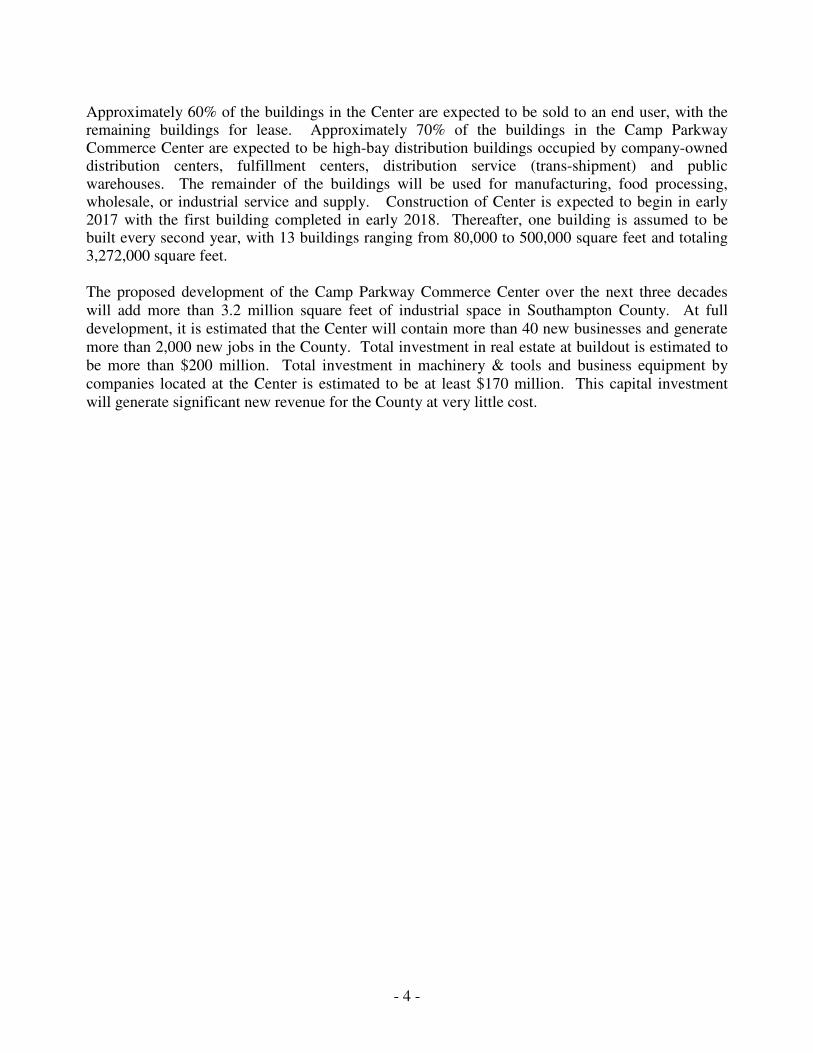
Approximately 60% of the buildings in the Center are expected to be sold to an end user, with the remaining buildings for lease. Approximately 70% of the buildings in the Camp Parkway Commerce Center are expected to be high-bay distribution buildings occupied by company-owned distribution centers, fulfillment centers, distribution service (trans-shipment) and public warehouses. The remainder of the buildings will be used for manufacturing, food processing, wholesale, or industrial service and supply. Construction of Center is expected to begin in early 2017 with the first building completed in early 2018. Thereafter, one building is assumed to be built every second year, with 13 buildings ranging from 80,000 to 500,000 square feet and totaling 3,272,000 square feet. The proposed development of the Camp Parkway Commerce Center over the next three decades will add more than 3.2 million square feet of industrial space in Southampton County. At full development, it is estimated that the Center will contain more than 40 new businesses and generate more than 2,000 new jobs in the County. Total investment in real estate at buildout is estimated to be more than $200 million. Total investment in machinery & tools and business equipment by companies located at the Center is estimated to be at least $170 million. This capital investment will generate significant new revenue for the County at very little cost.

- 5 -
Background Hampton Roads Development, LLC (the “applicant”) is seeking a rezoning of approximately 439 acres, located in Southampton County at the intersection of Camp Parkway (U.S. 58 Business) and Delaware Road (the “Site”), from R1 (low density residential) to M1 (industrial) zoning. The purpose of the rezoning is to permit the development by the applicant of the Camp Parkway Commerce Center (the “Center”). The Center will be developed as a business campus environment consisting of approximately 13 class A industrial buildings totaling more than 3.2 million square feet. The Center will contain walking trails and bench areas, as well as manmade lakes that will provide stormwater capture and visual amenity. Approximately 60% of the buildings in the Center are expected to be sold to an end user, with the remaining buildings for lease. Approximately 70% of the buildings in the Camp Parkway Commerce Center are expected to be high-bay distribution buildings with the remainder used for manufacturing, food processing, wholesale, or industrial service and supply. As the future tenure and use of these buildings is unknown, reasonable assumptions were made regarding the sequencing of owner occupied and tenanted buildings and of distribution/warehouse use and manufacturing/food processing/industrial service and supply use for the purposes of the fiscal impact analysis. Reasonable assumptions were also made with respect to company-owned distribution centers, fulfillment centers, distribution service (trans-shipment) and public warehouse uses which could occupy the distribution buildings. Construction of the Center is expected to begin in early 2017 with the first building completed in early 2018. Thereafter, one building is assumed to be built every second year, with 13 buildings ranging from 80,000 to 500,000 square feet and totaling 3,272,000 square feet. Each building is assumed to take 12 months to complete. Table 1, on the following page, provides a projected building development schedule for the Center, which takes place over a 26 year period. Infrastructure is expected to be developed in four phases. Table 1 also shows the beginning of each phase the Camp Parkway Commerce Center’s development. Because of the long timeframe for the development of the project and the time elapsing between each phase of the project’s development, each phase was assumed to be separately permitted with respect to site plan, soil disturbance and stormwater permitting. The last building is expected to be occupied in 2042 but tenancy will not be stabilized until FY 2044. The analysis is continued through FY 2046 in order to create a convenient 30 year analysis period. It should be noted that the size and sequencing of buildings and of uses within those buildings that are presented in Table 1 are for the purposes of conducting the fiscal impact analysis. The applicant makes no representations that this sequence and these uses will actually occur, although it is the intention of the applicant that these parameters will generally be achieved. However, actual building sequencing and occupancy will be market driven and subject to prevailing economic conditions.

- 6 -
Table 1 Camp Parkway Commerce Center
Projected Building Construction Schedule
CalendarYear
Square Feet Constructed
Building Type Assumption Tenure Phase
2017 100,000
60% Public Warehouse/40%
Wholesale & Industrial Supply Leased 1
2019 80,000 Trans-shipment Owned 1 2021 80,000 Food Processing Leased 1 2023 100,000 Distribution Owned 1 2025 250,000 Food Processing Owned 2 2027 230,000 Distribution Owned 2 2029 500,000 Distribution Owned 3
2031 300,000 Public
Warehouse Leased 3
2033 500,000 Fulfillment
Center Owned 3
2035 500,000
80% Distribution/20%
Wholesale & Industrial Supply Leased 3
2037 166,000 Manufacturing Owned 4 2039 166,000 Food Processing Owned 4
2041 300,000
40% Distribution/60%
Manufacturing Leased 4
Total 3,270,000
The Site is located in a revenue sharing district with the City of Franklin (the “City”). Based upon an agreement by the County and the City to extend the City water system into the County, the City is entitled to 30% of all tax revenue received by the County within the revenue sharing district. Thus, the revenue impact on the County is confined to 70% of any tax revenue received by the County from the Center. For illustrative purposes, revenues expected to be received by both the County and the City are shown in portions of this analysis.

- 7 -
Methodology This study examines the revenues to be received by the County generated by the development of the Camp Parkway Commerce Center and the costs to the County attributable to this development over a thirty-year period. Only revenues directly attributable to the project and only variable costs are counted in the fiscal impact study. This means that, rather than attributing all per capita or per household non-tax revenue and total County per capita, per household or per employee revenues and expenditures to the Center, only those incremental revenues and costs that the County will actually receive or incur due to the development of the Center are counted as having a fiscal impact. Fixed costs that do not rise as development occurs are not counted as having a fiscal impact. Also, this means that potential indirect revenues from spending by employees or businesses at the Center are not counted nor are potential indirect revenues from construction. Revenues include one-time direct revenues and annual direct revenues from the project. One-time revenues include, building permit fees and other development fees, as well as sewer and water connection and facility fees. They also include the value of off-site improvements that will be made by the developer—a traffic light at the intersection of Camp Highway and Delaware Road and streetscaping along Delaware Road. Other on-site improvements, such as stormwater improvements, the three sewer pump stations, utility extensions and road construction, will benefit only the Center and, so, are not counted as “revenue” to the County, even though they will be donated to the County. Annual direct revenues include: real estate property taxes, machinery and tool taxes, business personal property taxes, truck motor vehicle license fees, business license fees, merchants capital taxes (for on-line fulfillment centers), the local portion of the sales tax (for business-to-business sales by industrial supply houses), electric utility taxes, the portion of the state communications sales tax remitted to the County, and water and sewer user charges. Costs examined include potential sheriff and fire protection capital and operating costs and the cost of maintaining the project’s utility systems. Variable costs associated with real estate and tangible property assessment, and tax billing for the project were deemed to be inconsequential. All fiscal impacts are presented in constant 2015 dollars. Inflation is applied neither to revenues nor to costs throughout the analysis period. The constant dollar approach also means that no assumptions are made about the rate of real estate assessment increases in the County. No assumptions are made about future increases in tax revenues from sales, merchants capital or business license taxes based upon retail price increases. Neither are assumptions made about future increases in the unit costs or revenues of government. The practical implication of this approach is that any systemic future imbalances between rising (or falling) revenues and rising costs will be adjusted through changes in the County’s tax rate, either upward or downward.

- 8 -
However, because of the extremely long analysis period for the project (30 years), a present valuing of the net revenue stream from the Center was deemed appropriate. The net present value takes into account the time-value of money—the fact that money received in the present is seen as having more value than money to be received in the future. The net present value of a revenue stream is calculated by discounting net revenues each year using a compounded discount rate. For municipalities, a best approximation of the time-value of money (and the discount rate) is the locality’s long-term borrowing rate. A reasonable long-term borrowing rate is 2% above the rate of inflation. Because inflation has already been stripped from the fiscal impact calculations, a 2% discount rate was used to calculate the net present value of the project’s fiscal impact on the County. Revenue surplus or deficit (net revenue) is calculated by subtracting total costs to the County attributable to the project from total revenues to the County derived from the Center over the analysis period. This was calculated for each year through the stabilization year--Fiscal Year 2044—and beyond to the end of the analysis period. The stabilization year is the year in which all costs and revenues are realized. Because revenues and costs are reported in constant dollars, there generally is no significant change in the projected cash flow after the stabilization year. For convenience, the analysis period was extended two years beyond the stabilization year for a total of 30 years. However, due to changing vacancies from year to year, there is some fluctuation in revenues after the stabilization year. Therefore, revenues and costs have been reported for the last year of the analysis period—FY 2046. Three measures of fiscal impact are used. One is the annual cash flow through the stabilization year. Cash flow is derived from the revenue surplus/deficit (revenues minus costs). The second fiscal impact measure is the cumulative cash flow over the thirty year period. This is equivalent to total revenues less total costs over the analysis period. Finally, the benefit-to-cost ratio is the ratio of total project revenues to the County and total project costs to the County. A benefit-to-cost ratio greater than 1.0-to-1 signals a net fiscal benefit. The magnitude of the benefit-to-cost ratio signals the strength of the fiscal impact on the County. For instance, a benefit-to-cost ratio of 1.5.0-to-1 indicates that for every additional dollar of spending the project costs the County, the County is expected to receive $1.50 in additional revenue. Typically, the benefit-to-cost ratio for a non-residential development will be very high. The Site is currently in agricultural use and, although it is zoned to permit low-density residential development, it is not economically feasible to develop this property for this use. Therefore, the fiscal impact for a by-right alternative to the proposed development was not calculated. A more detailed explanation of the methodology used, including the calculation of the various revenue streams from the project, is contained in the attached Appendix.

- 9 -
Fiscal Impact Revenues The proposed development of the Camp Parkway Commerce Center over the next three decades will add more than 3.2 million square feet of industrial space in Southampton County. At full development, it is estimated that the Center will contain more than 40 new businesses and generate more than 2,000 new jobs in the County. Total investment in real estate at buildout is estimated to be more than $200 million. Total investment in machinery & tools and business equipment by companies located at the Center is estimated to be at least $170 million. This capital investment will generate significant new revenue for the County at very little cost. As noted above, revenue from the Center derived from tax sources will be shared with the City of Franklin with the County retaining 70% of all tax revenue collected. All fees will be retained by the County (100%). Revenue to be received by the County (and the City) from property taxes and other sources is displayed in Table 2 on the following page. Revenues are shown for the last year of the analysis period (FY 2046) and for the entire thirty year analysis period. Annual revenues and one-time revenues (which, however, will be occurring throughout the Center’ twenty-six year development period) are shown separately. Revenues to the County’s general fund and its enterprise fund are also shown separately. As Table 2 on the following page shows, revenues to the County (and the City) from development of the Camp Parkway Commerce Center are very substantial, especially for its general fund. Annual revenues to the County exceed $2.1 million, with more than 90% of this entering the County’s general fund. Over the thirty year analysis period, revenues to the County approach $35 million. Costs Expected increased costs to the County’s general fund associated with the Camp Parkway Commerce Center are minimal. The County’s Sheriff’s Office indicated that police protection could be provided to the Center with no foreseeable increase in costs. The County’s Community Development Department indicated that its current staff could handle permitting and inspections for the project. Most of the direct costs to the County associated with the Center will be incurred by the County’s enterprise fund. These costs are associated with water and sewer line maintenance, water and sewer treatment, and water and sewer billing. Actually, water and sewer line maintenance costs are overestimated because no factor was applied to reduce the cost of maintaining new infrastructure.

- 10 -
Table 2 Camp Parkway Commerce Center
Projected Revenues
Revenue Type
Annual Revenues FY 2046,
County
Annual Revenues
FY 2046, City Thirty-Year
Total, County Thirty-Year Total, City
Real Estate Property Tax1 $1,142,550 $489,675 $15,805,775 $6,773,900
Business Personal Property Tax $ 167,800 $ 71,925 $ 5,095,525 $2,183,800
Machinery & Tools Tax $ 357,050 $153,025 $ 5,077,025 $2,175,875 Personal Property Tax and
License Fees (Trucks) $ 62,200 $ 26,575 $ 1,141,950 $ 489,400
Business License Fee $ 5,950 $ 2,550 $ 101,700 $ 43,575
Merchants Capital Tax $ 207,125 $ 88,775 $ 2,402,150 $1,029,500 Communication Sales Tax and other fees $ 2,375 $ 1,000 $ 35,850 $ 15,350
Electric Utility Tax $ 27,475 $ 11,775 $ 501,750 $ 215,050 Building Permits and Building
Plan Review Fees $ 669,400 VSMP and Erosion and Sediment
Control Fees $ 12,050
Site Plan Fees $ 3,850
CO $ 4,300
Subtotal General Fund Revenues $1,972,525 $845,300 $30,851,325 $12,926,450
Subtotal One-time Revenues $ 689,600 $ 206,900
Utility Enterprise Fund
Sewer Fees $ 113,175 $ 1,659,300
Water Fees $ 80,900 $ 1,186,325
Fire Service Line Fee $ 178,500 Sewer Connection and Facility Fees $ 231,800 Water Connection and Facility Fees $ 150,875
Subtotal Enterprise Fund Revenues $ 194,075 $ 3,406,800 Subtotal One-time Enterprise Fund Revenues $ 561,175
Value of Off-Site Improvements $ 700,000
Total Revenues $2,166,600 $845,300 $34,958,125 $13,133,350
Total One-time Revenues $1,743.875 $ 206,900
1Less taxes currently being paid on land and improvements All revenues rounded to the nearest $25
- 11 -
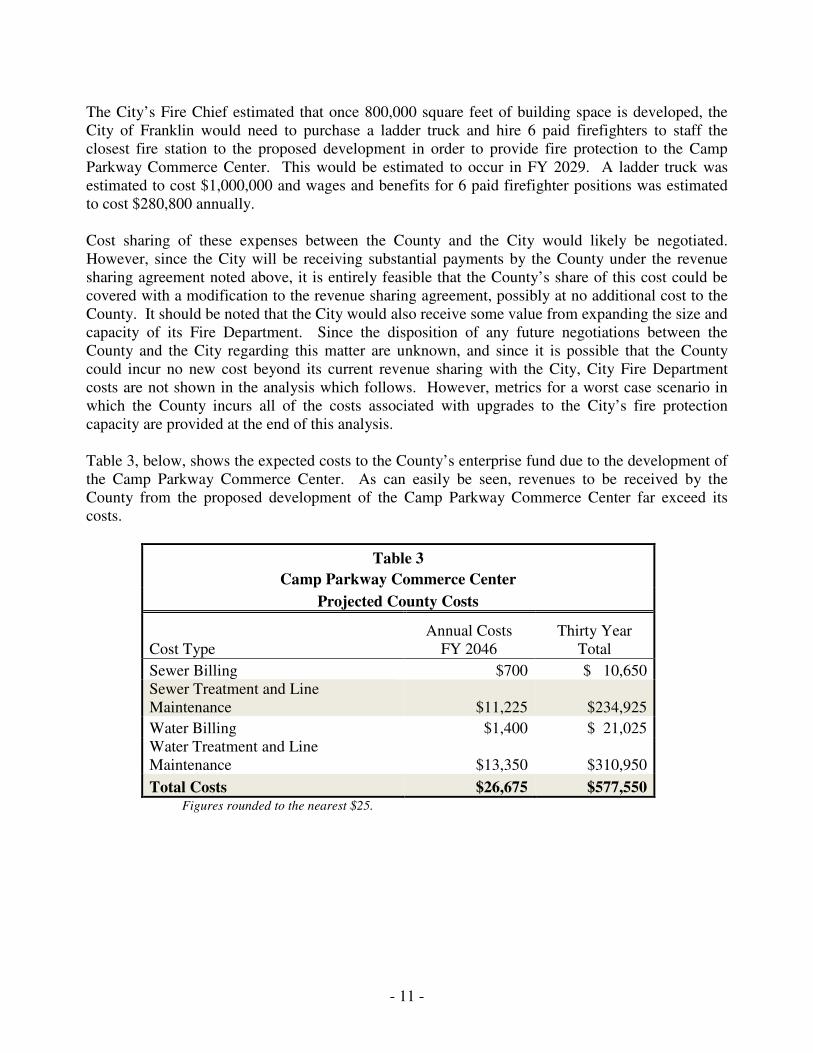
The City’s Fire Chief estimated that once 800,000 square feet of building space is developed, the City of Franklin would need to purchase a ladder truck and hire 6 paid firefighters to staff the closest fire station to the proposed development in order to provide fire protection to the Camp Parkway Commerce Center. This would be estimated to occur in FY 2029. A ladder truck was estimated to cost $1,000,000 and wages and benefits for 6 paid firefighter positions was estimated to cost $280,800 annually. Cost sharing of these expenses between the County and the City would likely be negotiated. However, since the City will be receiving substantial payments by the County under the revenue sharing agreement noted above, it is entirely feasible that the County’s share of this cost could be covered with a modification to the revenue sharing agreement, possibly at no additional cost to the County. It should be noted that the City would also receive some value from expanding the size and capacity of its Fire Department. Since the disposition of any future negotiations between the County and the City regarding this matter are unknown, and since it is possible that the County could incur no new cost beyond its current revenue sharing with the City, City Fire Department costs are not shown in the analysis which follows. However, metrics for a worst case scenario in which the County incurs all of the costs associated with upgrades to the City’s fire protection capacity are provided at the end of this analysis. Table 3, below, shows the expected costs to the County’s enterprise fund due to the development of the Camp Parkway Commerce Center. As can easily be seen, revenues to be received by the County from the proposed development of the Camp Parkway Commerce Center far exceed its costs.
Table 3
Camp Parkway Commerce Center
Projected County Costs
Cost Type Annual Costs
FY 2046 Thirty Year
Total
Sewer Billing $700 $ 10,650 Sewer Treatment and Line Maintenance $11,225 $234,925
Water Billing $1,400 $ 21,025 Water Treatment and Line Maintenance $13,350 $310,950
Total Costs $26,675 $577,550
Figures rounded to the nearest $25.

- 12 -
Table 4 below, shows projected County cash flows for selected years during the fiscal impact analysis period, generally at five year intervals. Cash flows build steadily throughout the thirty year analysis period.
Table 4 Camp Parkway Commerce Center
Projected County Cash Flow
FY 2017 FY 2022 FY 2027 FY 2032 FY 2037 FY 2042 FY 2046
General Fund
Total Revenues1 $23,525 $104,300 $609,200 $892,675 $1,786,300 $2,092,000 $1,972,550
Total Costs $ 0 $ 0 $ 0 $ 0 $ 0 $ 0 $ 0
Total Cash Flow $23,525 $104,300 $609,200 $892,675 $1,786,300 $2,092,000 $1,972,550
All Funds
Total Revenues1 $61,825 $129,425 $712,350 $991,700 $1,939,150 $2,274,400 $2,166,600
Total Costs $ 0 $ 12,075 $ 15,075 $ 23,200 $ 23,875 $ 26,525 $ 26,650
Total Cash Flow $61,600 $117,350 $697,275 $968,500 $1,915,275 $2,247,875 $2,139,950
1Does not include value of off-site improvements
Figures rounded to the nearest $25
Table 5, below, displays the highly positive fiscal impact measures for the County of the proposed development. *Includes $700,000 value of off-site improvements.
Table 5 Camp Parkway Commerce Center
County Fiscal Impact Measures
Total Revenues* $34,961,525 Total Cost $577,550
Cumulative Cash Flow $34,383,975 Benefit-to-Cost Ratio 60.5-to-1

- 13 -
Table 6, below, shows the County’s net present valued cash flow for the Camp Parkway Commerce Center. This shows that, even when cash flow is discounted to present value, the net revenue streams (revenue minus cost) remain substantial. Cash flow is shown here only for all funds combined.
Table 6 Camp Parkway Commerce Center
Net Present Value of Projected Cash Flow, All Funds
FY 2017 FY 2022 FY 2027 FY 2032 FY 2037 FY 2042 FY 2046
Total Revenues1 $61,825 $117,225 $584,375 $736,850 $1,305,000 $1,386,325 $1,220,075
Total Costs $ 0 $ 10,925 $ 12,375 $ 17,250 $ 16,075 $ 16,150 $ 15,000
Total Cash Flow $61,825 $106,300 $572,000 $719,600 $1,288,925 $1,370,175 $1,205,075
1Does not include value of off-site improvements
Figures rounded to the nearest $25
Table 7 shows the net present value total revenue, total costs, cumulative cash flow and benefit-to-cost ratio for the County during the thirty year analysis period. Again, all measures remain highly positive. Potential Fire Protection Cost Impact As stated above, the City of Franklin would incur about $6 million in fire protection costs during the analysis period due to the development of Camp Parkway Commerce Center. About $1 million of this cost would be capital cost. If the very worst case scenario is considered under which the County and the City negotiate cost-sharing such that the County bears all of the cost of the additional fire protection that the City would provide to Camp Parkway Commerce Center and the City retains its 30% of the tax revenue from the project pursuant to the current Revenue Sharing Agreement, the cumulative net revenue to the County (total revenue minus total cost) over the 30 year analysis period would be reduced from about $34.4 million to about $28.3 million, which is still a very substantial positive fiscal impact. At the end of the analysis period in FY 2046, the annual cash flow to be received by the County is still greater than $1.8 million. In that scenario, the benefit-to-cost ratio would be 5.27-to-1, which is still very highly positive.
Table 7 Camp Parkway Commerce Center
Net Present Value of Fiscal Impact Measures All County Funds
Total Revenues $23,481,325 Total Cost $ 414,675
Cumulative Cash Flow $23,066,650 Benefit-to-Cost Ratio 56.65-to-1

- 14 -
14486828v3
Combined Southampton County and City of Franklin Fiscal Impact The development of Camp Parkway Commerce Center would have fiscal impacts for both Southampton County and the City of Franklin. As stated above, the City of Franklin would receive 30% of all tax revenues generated by the development and would bear the fire protection costs for the project. Table 8, below, summarizes the combined fiscal impact of the proposed development on the City of Franklin and Southampton County.
Table 8 Camp Parkway Commerce Center
Fiscal Impact Measures City of Franklin and Southampton County- Combined
Total Revenues $47,884,575 Total Cost
$ 6,631,550
Cumulative Cash Flow $41,253,025
Benefit-to-Cost Ratio 7.22-to-1

Camp Parkway Commerce Center
Appendix
Methodology

Approach Fiscal impact is defined as the difference between all revenues to the Southampton County (the “County”) generated by the project and all costs to the County attributable to the project. Only revenues directly attributable to the project and only variable costs are counted in the fiscal impact study. This means that, rather than applying all per capita or per household non-tax revenue and total County per capita, per household or per employee revenues and expenditures to the Camp Parkway Commerce Center (the “project”), only those incremental revenues and costs that the County will actually receive or incur due to the development of the project are counted as having a fiscal impact. Fixed costs that do not rise as development occurs are not counted as having a fiscal impact. Revenues include one-time direct revenues and annual direct revenues from the project. One-time revenues include, building permit fees and other development fees, as well as sewer and water connection and facility fees. They also include the value of off-site improvements that will be made by the developer—a traffic light at the intersection of Camp Parkway and Delaware Road and streetscaping along Delaware Road. Other on-site improvements, such as stormwater improvements, the three sewer pump stations, utility extensions and road construction, will benefit only the Camp Parkway Commerce Center and, so, are not counted as “revenue” to the County, even though they will be donated to the County. Annual direct revenues include: real estate property taxes, machinery and tool taxes, business personal property taxes, truck motor vehicle license fees, business license fees, merchants capital taxes (for on-line fulfillment centers), the local portion of the sales tax (for business-to-business sales by industrial supply houses), electric utility taxes, the portion of the state communications sales tax remitted to the County, and water and sewer user charges. Costs examined include potential sheriff and fire protection capital and operating costs and the cost of maintaining the project’s utility systems. Variable costs associated with real estate and tangible property assessment, and tax billing for the project were deemed to be inconsequential. All fiscal impacts are presented in constant 2015 dollars. Inflation is applied neither to revenues nor to costs throughout the analysis period. The constant dollar approach also means that no assumptions are made about the rate of real estate assessment increases in the County. No assumptions are made about future increases in tax revenues from sales, merchants capital or business license taxes based upon retail price increases. Neither are assumptions made about future increases in the unit costs or revenues of government. The practical implication of this approach is that any systemic future imbalances between rising (or falling) revenues and rising costs will be adjusted through changes in the County’s tax rate, either upward or downward.
A-1
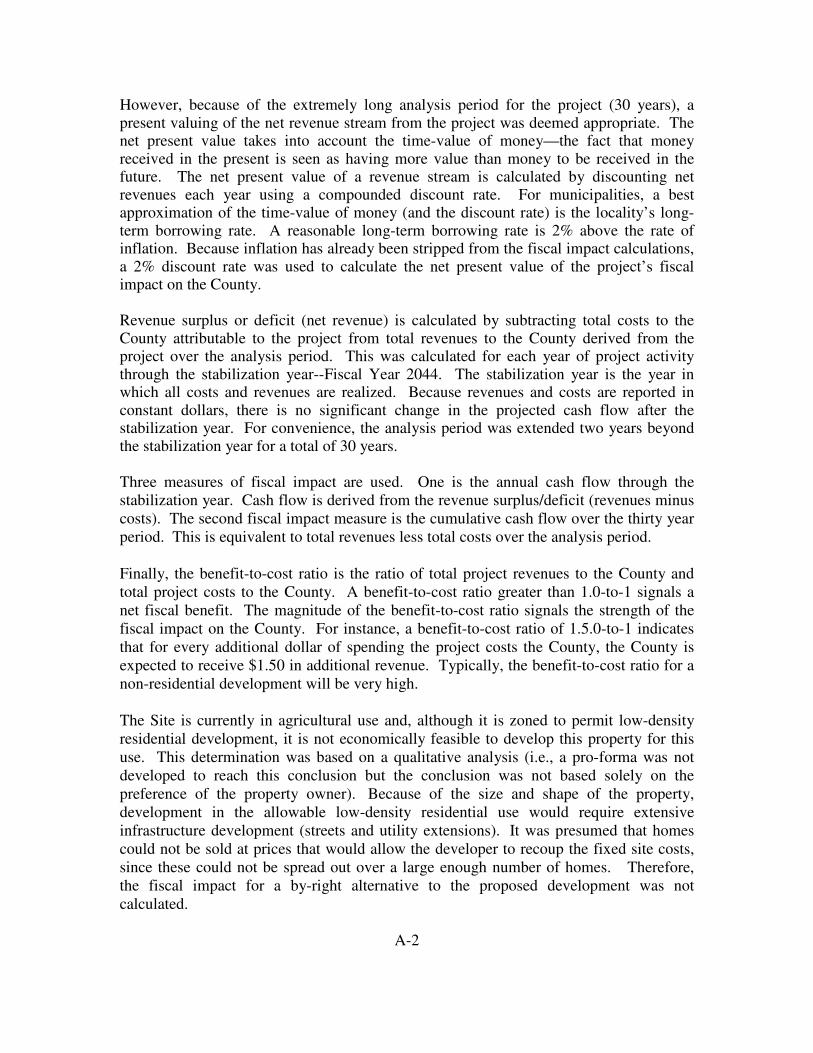
However, because of the extremely long analysis period for the project (30 years), a present valuing of the net revenue stream from the project was deemed appropriate. The net present value takes into account the time-value of money—the fact that money received in the present is seen as having more value than money to be received in the future. The net present value of a revenue stream is calculated by discounting net revenues each year using a compounded discount rate. For municipalities, a best approximation of the time-value of money (and the discount rate) is the locality’s long-term borrowing rate. A reasonable long-term borrowing rate is 2% above the rate of inflation. Because inflation has already been stripped from the fiscal impact calculations, a 2% discount rate was used to calculate the net present value of the project’s fiscal impact on the County. Revenue surplus or deficit (net revenue) is calculated by subtracting total costs to the County attributable to the project from total revenues to the County derived from the project over the analysis period. This was calculated for each year of project activity through the stabilization year--Fiscal Year 2044. The stabilization year is the year in which all costs and revenues are realized. Because revenues and costs are reported in constant dollars, there is no significant change in the projected cash flow after the stabilization year. For convenience, the analysis period was extended two years beyond the stabilization year for a total of 30 years. Three measures of fiscal impact are used. One is the annual cash flow through the stabilization year. Cash flow is derived from the revenue surplus/deficit (revenues minus costs). The second fiscal impact measure is the cumulative cash flow over the thirty year period. This is equivalent to total revenues less total costs over the analysis period. Finally, the benefit-to-cost ratio is the ratio of total project revenues to the County and total project costs to the County. A benefit-to-cost ratio greater than 1.0-to-1 signals a net fiscal benefit. The magnitude of the benefit-to-cost ratio signals the strength of the fiscal impact on the County. For instance, a benefit-to-cost ratio of 1.5.0-to-1 indicates that for every additional dollar of spending the project costs the County, the County is expected to receive $1.50 in additional revenue. Typically, the benefit-to-cost ratio for a non-residential development will be very high. The Site is currently in agricultural use and, although it is zoned to permit low-density residential development, it is not economically feasible to develop this property for this use. This determination was based on a qualitative analysis (i.e., a pro-forma was not developed to reach this conclusion but the conclusion was not based solely on the preference of the property owner). Because of the size and shape of the property, development in the allowable low-density residential use would require extensive infrastructure development (streets and utility extensions). It was presumed that homes could not be sold at prices that would allow the developer to recoup the fixed site costs, since these could not be spread out over a large enough number of homes. Therefore, the fiscal impact for a by-right alternative to the proposed development was not calculated.
A-2
Background Construction of the Camp Parkway Commerce Center is expected to begin in early 2017 with the first building completed in early 2018. Thereafter, one building is assumed to be built every second year, with 13 buildings ranging from 80,000 to 500,000 square feet and totaling 3,272,000 square feet. Each building is assumed to take 12 months to complete. Table 1, on the following page, provides a projected building development schedule for the Camp Parkway Commerce Center. Infrastructure is expected to be developed in four phases. Table 1 also shows the beginning of each phase the Camp Parkway Commerce Center’s development. Because of the long timeframe for the development of the project and the time elapsing between each phase of the project’s development, each phase was assumed to be separately permitted with respect to site plan, soil disturbance and stormwater permitting. The last building is expected to be occupied in 2042 but tenancy will not be stabilized until FY 2044. Approximately 60% of the buildings in the Camp Parkway Commerce Center are expected to be sold to an end user, with the remaining buildings for lease. Approximately 70% of the buildings in the Camp Parkway Commerce Center are expected to be high-bay distribution buildings with the remainder used for manufacturing, food processing. wholesale, or industrial supply. As used in the Fiscal Impact Analysis, the term “industrial supply” was meant to suggest the probability that many of the wholesale companies that could locate at the Commerce Center would be companies supplying the manufacturing and/or construction industries. Examples of such companies are: Fastenal, MSC Industrial, Grainger and Ferguson. Regarding the metrics employed to estimate revenues, industrial supply was not distinguished from wholesale (the same metrics applied to wholesale and industrial supply). As the future tenure and use of these buildings is unknown, reasonable assumptions were made regarding the sequencing of owner occupied and tenanted buildings and of distribution/warehouse use and manufacturing/food processing/industrial service and supply use for the purposes of the fiscal impact analysis. Reasonable assumptions were also made with respect to company-owned distribution centers, fulfillment centers, distribution service (trans-shipment) and public warehouse uses which could occupy the distribution buildings. Revenue Calculations Revenues estimated for Camp Parkway Commerce Center fall into two categories: one-time direct revenues and direct annual revenues. The methodology does not use multipliers to calculate revenues that could be generated through the project’s secondary impacts, including spending by businesses located at the Camp Parkway Commerce Center or their employees. Such multipliers and indirect revenue estimates are considered to be unreliable, particularly when applied to small economic units, such as localities.
A-3
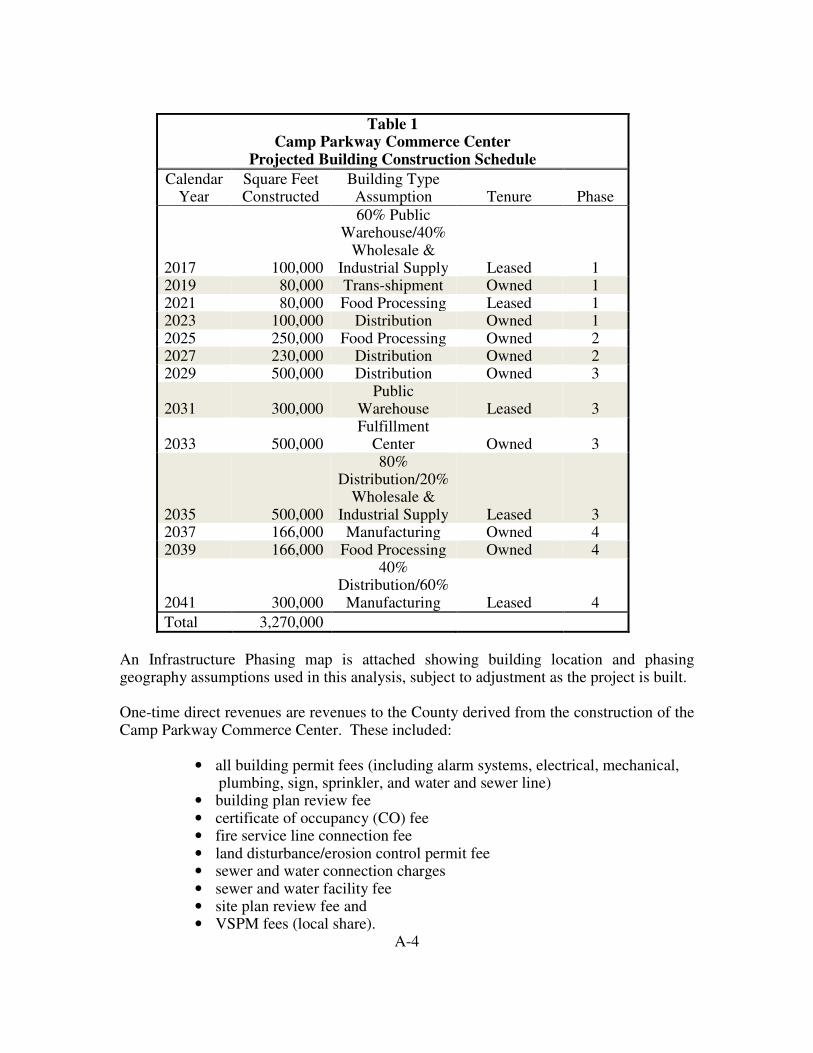
Table 1 Camp Parkway Commerce Center
Projected Building Construction Schedule
CalendarYear
Square Feet Constructed
Building Type Assumption Tenure Phase
2017 100,000
60% Public Warehouse/40%
Wholesale & Industrial Supply Leased 1
2019 80,000 Trans-shipment Owned 1 2021 80,000 Food Processing Leased 1 2023 100,000 Distribution Owned 1 2025 250,000 Food Processing Owned 2 2027 230,000 Distribution Owned 2 2029 500,000 Distribution Owned 3
2031 300,000 Public
Warehouse Leased 3
2033 500,000 Fulfillment
Center Owned 3
2035 500,000
80% Distribution/20%
Wholesale & Industrial Supply Leased 3
2037 166,000 Manufacturing Owned 4 2039 166,000 Food Processing Owned 4
2041 300,000
40% Distribution/60%
Manufacturing Leased 4
Total 3,270,000
An Infrastructure Phasing map is attached showing building location and phasing geography assumptions used in this analysis, subject to adjustment as the project is built. One-time direct revenues are revenues to the County derived from the construction of the Camp Parkway Commerce Center. These included:
• all building permit fees (including alarm systems, electrical, mechanical, plumbing, sign, sprinkler, and water and sewer line)
• building plan review fee • certificate of occupancy (CO) fee • fire service line connection fee • land disturbance/erosion control permit fee • sewer and water connection charges • sewer and water facility fee • site plan review fee and • VSPM fees (local share).
A-4

For calculating plumbing permit fees, one set of men’s and women’s bathrooms per 100,000 square feet, or fraction thereof, of building space was assumed. For calculating electrical permit fees, the following parameters were used: 725 amps per 100,000 square feet of warehouse use, including trans-shipment, wholesale and industry supply house uses; 1625 amps per 100,000 square feet of automated distribution or fulfillment center use; 2,400 amps per 100,000 square feet of manufacturing use; and 3,600 amps per 100,000 square feet of food processing use. These industry estimates were provided by Clancy and Theys Construction Company. Maximum unit size was assumed to be 1,000 amps. Automatic fire protection system (sprinkler) permits assumed a sprinkler system cost of $2.00 per square foot. All buildings were assumed to be sprinklered. The development’s entrance sign is assumed to be between 51 and 100 square feet and each building and each business (if in a multitenant building) was assumed to have one sign of 50 square feet or less. The minimum building permit fee was assumed for each fire alarm, security alarm and site illumination permit. Each building was assumed to have each of the aforementioned permits. The erosion control permit was calculated on disturbed acreage only. This was estimated to be 285 acres. Water and sewer fees were calculated assuming sixteen (16) 1 inch water meters and five (5) 1 ½” water meters (for a total of 21 meters), with each manufacturing/food processing building having a 1 ½ inch meter, with the leased manufacturing/food processing building also having one 1 inch water meter. Each owned distribution building was assumed to have one 1” water meter and each leased distribution building was assumed to have one 1” water meter per 100,000 square feet, rounded to the nearest 100,000 square feet. An 8” fire service line was assumed to serve each building, with an additional fire service line extension for each development phase. The timing of the payment of most water and sewer fees, as well as development fees, is tied to building construction (which follows the phasing plan). Fees are assumed to be paid as buildings are developed, not pre-paid as phases are begun. Exceptions to this are water line and sewer line permit fees and the local portion of the VSMP fee (including the renewal fee), which are paid at the start of each phase. Additionally, the site plan review fee and land disturbance fee are also assumed to be paid as phases are begun. The value of off-site improvements that would benefit properties other than the Camp Parkway Commerce Center was calculated using the developer’s engineer’s cost estimates. The cost of installing a traffic light at the intersection of Camp Parkway and Delaware Road was estimated to be $250,000. The cost of the heavy berming and landscaping to be installed by the developer along Delaware Road was estimated to be $450,000. Initial berm and landscaping improvements were assumed to be made as infrastructure is put in place in FY 2017, with this work completed when infrastructure for Phase 2 is constructed in FY 2023. The traffic light is estimated to be installed once 1.7 million square feet of space at the Camp Parkway Commerce Center is developed, which is projected to occur in FY 2034. “Developed” means that the building is completed, which was assumed to occur one year following the year in which building construction was begun.
A-5

The cost of extending the water line along Camp Parkway to Delaware Road and along Delaware Road to the first entrance to the Camp Parkway Commerce Center was calculated at $50 per linear foot, the cost of placing the water line within the roadway. The length of the water line extension was estimated to be 2,770 feet. A sewer line extension will not be needed for this project. Both extensions would reduce the County’s cost of future water and sewer extensions should the County wish to continue these utilities along Camp Parkway or along Delaware Road. Direct annual revenues consist of those revenues paid directly to the Southampton County by Camp Parkway Commerce Center property owner and businesses located there. These include real estate property taxes, business personal property taxes, personal property taxes and motor vehicles license fees on trucks, business license fees, merchants capital taxes (for fulfillment centers and industrial supply houses), electric utility taxes, the local portion of the communications sales tax remanded by the Commonwealth to Southampton County, water consumption fee and sewer collection fee.
The County’s real estate assessment of improvements at the Camp Parkway Commerce Center were estimated by examining comparable properties located in Southampton County and the City of Franklin and also by applying multiple regression analysis to a sample of comparable buildings. First, per square foot and per acre assessments were calculated for buildings and improvements and for commercialized land, respectively, for comparable properties located in Southampton County and the City of Franklin. Comparable properties selected were: the Southampton Terminal property and the Feridies Building, both in Courtland, and the Valley Protein property in Southampton County; and the former Money Mailer building in Pretlow Industrial Park in the City of Franklin. Warehouse properties at 25000 Shady Brook Trail and the Boykins Warehouse were not used as comparables for improvements as those buildings are substantially smaller and/or in poor condition. The former Money Mailer building is comparable in size to the smaller buildings planned for the Camp Parkway Commerce Center, while the other buildings are smaller. The Valley Protein Building and the Feridies Building were used as a comparables for manufacturing and food processing (with the per-square foot assessment of elements of the Valley Protein Building unique to food processing calculated separately). Both the Valley Protein and Money Mailer buildings are vacant, however. The improvement assessment for a vacant building was presumed to have been adjusted downward by 20% and the assessment per square foot for these buildings was adjusted accordingly. Examining land assessments per acre, the per acre assessment for the commercialized acreage at the Valley Protein site was significantly lower than other assessments ($10,000 per acre) and was excluded as an outlier. Land with the warehouse properties at 25000 Shady Brook Trail was included, as the assessment per acre was in line with other per acre assessments. The Feridies property land assessment was averaged with other assessments to estimate land assessment for manufacturing. This analysis produced a real estate assessment estimates shown in the Table 2, on the following page.
A-6

Table 2
Estimated Real Estate Assessments Based on County/
City of Franklin Comparables
Use Type Assessment per
Square Foot Assessment per
Acre
Distribution/ Warehousing $49.38 $26,800 Manufacturing $50.86 $30,100 Food Processing $53.42 $30,100 Storage Tanks $24.10 N/A
Per-square foot assessments were then adjusted to account for age and size. Per-square foot assessment data for recent warehouse, distribution, fulfillment center and manufacturing/food processing announcements made in the southeastern portion of Virginia, as well as the assessments of the Southampton County and City of Franklin properties, were subjected to a multiple regression analysis to determine whether the results could be used as an adjustment factor. Comparable out-of-locality projects included in this analysis were: Amazon fulfillment centers in Dinwiddie and Chesterfield Counties, the Cost-Plus/World Market distribution center in Isle of Wight County, the Lumber Liquidators distribution center in James City County, the Navy Exchange wholesale distribution center in Suffolk, the QVC fulfillment center in Suffolk, the SafeCo Products Company public warehouse in Isle of Wight County, the Target distribution center in Suffolk, and the Wal-Mart distribution center in James City County for warehouse/distribution buildings. Separately, the regression analysis for manufacturing/food processing buildings included the following out-of-locality projects: Sabra Dipping in Chesterfield County and Rolls Royce in Prince George County. For warehouse/distribution properties, the regression analysis showed that both age and size were inversely related to assessment per square foot. In other words, both older and larger warehouse/distribution properties were assessed at lower per square foot rates. For manufacturing/food processing properties, however, the age of the property did not display a statistically significant correlation with per square foot assessment and size was positively correlated with per square foot assessment, so that larger manufacturing buildings were assessed at a higher per square foot rate. This could be associated with larger facilities housing more capital intensive processes and, thus, requiring higher building costs. Though, due to the smaller sample size, the results for manufacturing buildings were less statistically significant, the correlation was strong enough to be used. Since intercept values were not out of range with average assessments for existing buildings in the County and City of Franklin, slope values were used to adjust the average comparables for age and size of building.
A-7

For warehouse/distribution buildings, a new, 76,450 square foot building was projected to be assessed at $63.77 per square foot, with the per square foot assessment reduced by $0.00473 for every 1,000 square feet above 76,000, resulting in a range $61.76 to $63.75 per square foot for warehouse/distribution buildings projected to be built at the Camp Parkway Commerce Center. A new 42,000 square foot manufacturing or food processing facility was projected to be assessed at $50.86 or $53.42 per square foot, respectively, with $0.161 added for every 1,000 square feet above that size. This results in a range of $59.54 to $86.91 per square foot for manufacturing/food processing buildings projected to be built at the Camp Parkway Commerce Center. New buildings were assumed to be substantially completed by November 1 of the calendar year in which construction occurs and assessed for the next fiscal year. The assessed value of undeveloped land at the Camp Parkway Commerce Center was assumed to remain stable during the analysis period. The assessed value of the undeveloped site was reduced proportionally as acreage was projected to be developed. Real estate taxes received currently on the site were deducted from real estate tax revenue to be received by the County from the development, as these taxes do not constitute a net increase in revenues to the County derived from the development. The annual business personal property tax to be received by the County from Camp Parkway Commerce Center businesses was estimated as a percentage of construction cost. The Construction Cost Calculator provided by BuildingJournal.com was used to estimate construction costs per square foot for each building type and size. Equipment cost in leased warehouse space and trans-shipment centers was estimated to be 10% of building construction cost. For automated distribution centers, equipment cost was estimated to be 25% of building construction cost. Based on estimated equipment costs for recent Amazon.com fulfillment centers in Virginia, equipment cost for fulfillment centers was estimated to be 50% of construction cost. Business property was assumed to be assessed in the year following construction completion, with the first taxes paid in the last half of that fiscal year. No equipment replenishing was assumed unless a whole building vacancy occurred, in which case it was assumed that the new occupant purchased new business equipment. Manufacturers and food processors are more equipment intensive than distribution or fulfillment centers based on trends toward more highly automated manufacturing processes. The cost of machinery and tools was estimated to average 125% of building construction cost for food processors and 175% of building costs for other manufacturers. Machinery and tools assessment timing was calculated as business equipment was calculated. Company-owned distribution centers, trans-shipment centers, industrial supply houses and wholesalers were assumed to own trucks subject to the personal property tax. Each truck was estimated to have a blue book value of $80,000 and one truck was assumed for every 50,000 square feet of building space or part thereof.
A-8
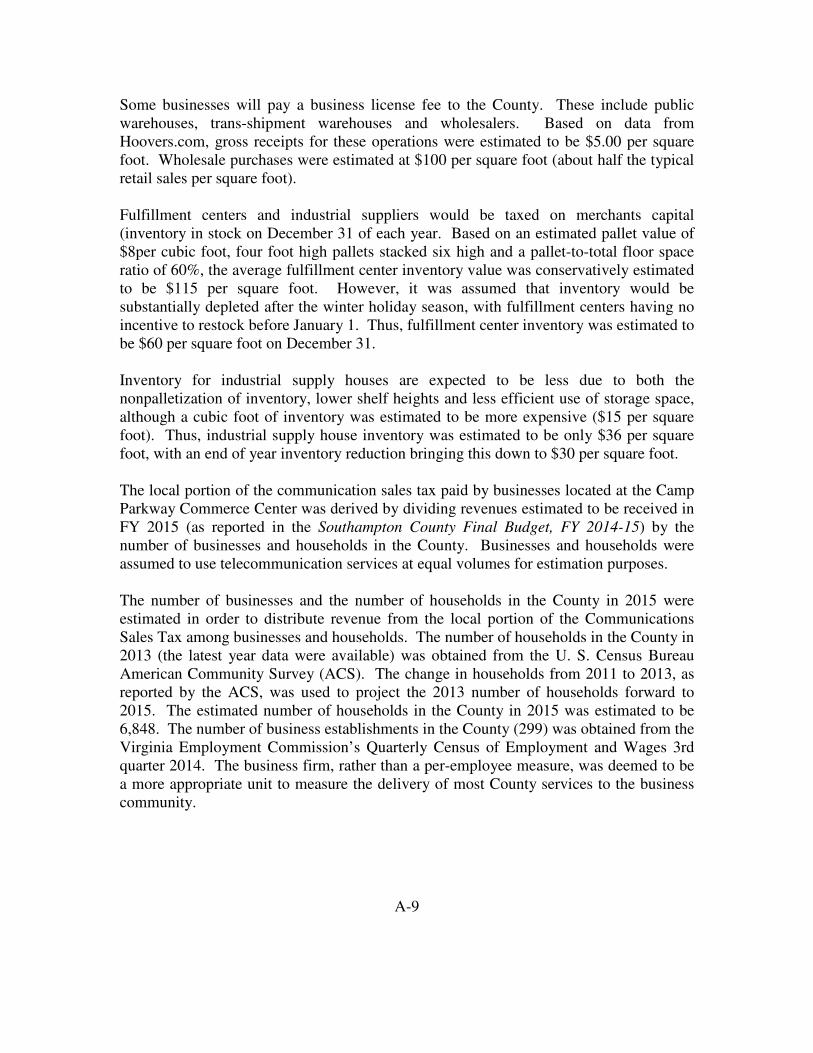
Some businesses will pay a business license fee to the County. These include public warehouses, trans-shipment warehouses and wholesalers. Based on data from Hoovers.com, gross receipts for these operations were estimated to be $5.00 per square foot. Wholesale purchases were estimated at $100 per square foot (about half the typical retail sales per square foot). Fulfillment centers and industrial suppliers would be taxed on merchants capital (inventory in stock on December 31 of each year. Based on an estimated pallet value of $8per cubic foot, four foot high pallets stacked six high and a pallet-to-total floor space ratio of 60%, the average fulfillment center inventory value was conservatively estimated to be $115 per square foot. However, it was assumed that inventory would be substantially depleted after the winter holiday season, with fulfillment centers having no incentive to restock before January 1. Thus, fulfillment center inventory was estimated to be $60 per square foot on December 31. Inventory for industrial supply houses are expected to be less due to both the nonpalletization of inventory, lower shelf heights and less efficient use of storage space, although a cubic foot of inventory was estimated to be more expensive ($15 per square foot). Thus, industrial supply house inventory was estimated to be only $36 per square foot, with an end of year inventory reduction bringing this down to $30 per square foot. The local portion of the communication sales tax paid by businesses located at the Camp Parkway Commerce Center was derived by dividing revenues estimated to be received in FY 2015 (as reported in the Southampton County Final Budget, FY 2014-15) by the number of businesses and households in the County. Businesses and households were assumed to use telecommunication services at equal volumes for estimation purposes. The number of businesses and the number of households in the County in 2015 were estimated in order to distribute revenue from the local portion of the Communications Sales Tax among businesses and households. The number of households in the County in 2013 (the latest year data were available) was obtained from the U. S. Census Bureau American Community Survey (ACS). The change in households from 2011 to 2013, as reported by the ACS, was used to project the 2013 number of households forward to 2015. The estimated number of households in the County in 2015 was estimated to be 6,848. The number of business establishments in the County (299) was obtained from the Virginia Employment Commission’s Quarterly Census of Employment and Wages 3rd quarter 2014. The business firm, rather than a per-employee measure, was deemed to be a more appropriate unit to measure the delivery of most County services to the business community.
A-9

The formula used to calculate the distribution of communication sales tax revenue between businesses and households is shown below.
CSTB= CST/(HH+B) Where CSTB = Communication Sales Tax Received per Business
CST = Total Communication Sales Tax Received HH = the Number of Households
B = the Number of Businesses The average communication sales tax revenue received by the County per business was calculated to be $78.78 annually. Water and sewer use charges were calculated based on an assumed 30 gallons per day per employee usage. Since water usage will be limited to drinking water and water for sanitation, per employee usage was estimated by taking 50% of the lowest gallon per person standard for residential water use. The number of employees per square foot was calculated by use type based on recent regional economic development announcements in Southeastern Virginia with the same methodology used to estimate the total number of employees working at the Center upon buildout.
Manufacturing and food processing, however, in addition to domestic water uses, may use process and/or cooling water. The amount of water use can vary greatly among companies in this group. Water recycling and conservation measures can also affect the amount of water usage. It was assumed that the County would negotiate with a new manufacturer or food processor that may have water needs in excess of the County’s current capacity and, therefore, only domestic water use was calculated with regard to projecting revenue and no potential costs associated with expanding water capacity were assumed. Table 3, below, shows the estimated water usage per 1,000 square feet for each projected use at the Camp Parkway Commerce Center.
Table 3
Projected Water Usage at Buildout, Camp Parkway Commerce Center
By User Type
User Type Water Use per 1,000 Sq. Ft. per Month
Total Projected Sq. Ft.
Total Water Use per Month
Warehouse 85 360,000 30,600 Trans-shipment 110 80,000 8,800 Distribution 215 1,350,000 290,250 Wholesale/Industrial Supply 465 140,000 65,100 Fulfillment 260 500,000 130,000 Manufacturing 540 346,000 186,840 Food Processing 1,125 496,000 558,000
Total 1,269,590
A-10

Electric utility taxes were calculated based on estimated monthly kWh usage for each use type. When typical usage was reported as a cost per square foot, Dominion Virginia Power’s large user rate of $.186 per kWh was used to compute the kWh per square foot usage. The source for average electricity usage for warehouses was Georgia Power using data from E Source. This was consistent with the kWh usage for warehouses of 100,000 square feet or more reported by the Northwest Energy Efficient Alliance in its Commercial Building Stock Assessment, 2012-2014.
A long-term vacancy rate of 10% was assumed for leased buildings. A ramp-up vacancy rate of 50% was used during the first calendar year of building occupancy, which means that the fiscal year following construction uses a blended ramp-up and long-term vacancy rate. Additionally, buildings that were owned were assumed to become vacant for one year every fifteen years unless occupied by a manufacturer or food processor, in which case the building was assumed to be vacant every twenty years. The leased food processing building was assumed to be occupied by a single user and vacant every fifteen years. All assumptions made concerning building occupancy are for illustrative purposes only and to allow for projections to be made. Tax rates and fees found on the current The Southampton County website and/or reported in the Southampton County Final Budget FY 2014-15 were used and assumed to be accurate. Cost Calculations General government operating costs were deemed to be insignificant relative to the Camp Parkway Commerce Center. Costs for services provided only to households were excluded from the fiscal impact calculations, as these will not change with the development of the Camp Parkway Commerce Center. Employees at the Camp Parkway Commerce Center were deemed not to cause any calculable increase in the County’s costs. Employees currently residing in the County are already being served by the County government. Employees who will reside outside the County are being served by their localities of residence and will not cause County costs to increase. Employees who may move to the County in order to obtain employment at the Camp Parkway Commerce Center will generate new costs for the County but will also generate new revenues, which also have not been counted in this fiscal impact analysis. It is presumed that revenues associated with new employee/residents will substantially compensate for the County’s increased costs, and may provide surplus revenue, depending on their income levels and home ownership patterns. In any case, it is nearly impossible to estimate the percentage of Camp Parkway Commerce Center employees who will be new residents to the County.
A-11

Potential costs to the County are those for services provided to businesses. However, fixed costs (such as the administrative costs of government) and fixed cost components of services provided to businesses (such as directors’ salaries), as well as debt service, are excluded from the fiscal impact analysis because these costs will not increase due to the addition of businesses to the County. Variable costs associated with such government operations as tax assessment and billing were deemed to be negligible, as were costs associated with businesses’ minimal participation in the judicial system. Other potential costs that could result from the development of the Camp Parkway Commerce Center were identified as fire protection, police protection, development services, and utilities maintenance and billing. The City of Franklin Fire Chief (the City of Franklin Fire Department serves the site of the Camp Parkway Commerce Center), the County Sheriff and the County Community Development Director were consulted with respect to the first three potential costs. The Sheriff and Community Development Director reported that the Camp Parkway Commerce Center could be served with existing resources, with the Sheriff reserving the right to reevaluate this determination as development progresses. Thus, no additional police protection or development services costs were assumed to be incurred by the County due to the development of the Camp Parkway Commerce Center. The Fire Chief estimated that once 800,000 square feet of building space is developed, a the City of Franklin would need to purchase a ladder truck and hire 6 paid firefighters to staff the closest fire station to the proposed development in order to provide fire protection to the Camp Parkway Commerce Center. For purposes of this analysis this was estimated to occur in FY 2029. A ladder truck was estimated to cost $1,000,000 and wages and benefits for 6 paid firefighter positions was estimated to cost $280,800 annually. Cost sharing of these expenses between the County and the City would likely would be negotiated. The worst case scenario is that the County would bear this entire cost. However, since the City of Franklin would gain some benefit from these additions, it is not clear what the cost sharing distribution would be. To account for this uncertainty, the report provides several scenarios, including a worst-case analysis. If the Camp Parkway Commerce Center’s internal road system is accepted by the County, it will be maintained with VDOT provided funds. Otherwise, street maintenance will become the responsibility of the developer. Likewise, the development’s internal stormwater system will be maintained by the developer or by an owners’ association, if one is established. The cost of sanitary sewer maintenance included variable costs associated with sewer line maintenance and sewer treatment. Senior administrative salaries for the public utilities were estimated to be $120,000, divided equally between water and sewer. This cost was subtracted from budgeted salaries and proportionally from fringe benefit costs. Remaining personnel costs were then proportioned between maintenance and billing using identifiable variable costs associated with each function to determine the
A-12

14486841v3
distribution. These variable costs are: Miss Utility, lab testing services, repair and maintenance, maintenance service contracts, laboratory supplies, repair and maintenance supplies, vehicle supplies, chemicals, chlorine & sulfur dioxide, and other operating supplies for sewer maintenance and treatment; and billing/mailing services, water cutoff costs, postal services and office supplies for billing. The methodology for calculating water line maintenance and treatment costs and water billing costs was similar to that used to calculate sewer system costs. Water system costs, however, did not include chlorine & sulfur dioxide and water cutoff costs. Variable costs for the County’s sewer and water systems were then divided by the linear feet of sewer and water lines and the number of sewer and water customers, as appropriate, to calculate the estimated per linear foot and per customer costs. Sewer and water line length was used as a proxy for sewer and water volumes for the purposes of calculating treatment costs. Table 4, on the following page, shows the resulting per linear foot and per customer cost estimates.
Table A-4
Southampton County Non-School Expenditures: Expenditures per Service Unit
other than Businesses, FY 2014-15
Item Expenditure
Expenditure per Service
Unit Notes Public Utilities Sewer Billing $ 24,600 $16.39 Per sewer customer
Public Utilities Water Billing $ 32,350 $32.36 Per water customer Public Utilities Sewer Line Maintenance $665,600 $1.66 Per linear foot Public Utilities Water Line Maintenance $372,975 $ 1.41 Per linear foot
Rounded to the nearest $25
Source: The Southampton County Final Budget, FY 2014-15 and Southampton County Public Works
A-13