Cameroon using a Boolean method FOTSING METEGAM …
17
GIS-based assessment of photovoltaic (PV) and concentrated solar power (CSP) generation potential in Cameroon using a Boolean method FOTSING METEGAM ISABELLE FLORA 1 , NJOMO DONATIEN 2 , RENÉ TCHINDA 3 , OUMAROU HAMANDJODA 4 12 Environmental Energy Technologies Laboratory (EETL) / University of Yaounde 1 / PO Box 7268 Yaounde / Cameroon 13 Laboratory of Industrial Systems and Environment of the University of Dschang, PO BOX 96, Dschang, Cameroon 4 Energetic Laboratory, National Higher Polytechnic School, P0 BOX 8390 Yaounde, Cameroon Email address of the corresponding author: [email protected] Abstract: The negative environmental effects of traditional methods of electricity generation have created the need to plan and strategically develop renewable and sustainable energy production systems. This document presents the analysis of the suitability of solar park sites using a Boolean decision-making approach based on geographic information system (GIS) modeling. This analysis is based on different climatic, geographic, economic, and environmental criteria such as wind resource, slope, accessibility by roads, and proximity to the power grid. The land suitable for the installation of SPV solar parks is approximately 10.17% corresponding to an area of 47,331.18 km². However, when we include the condition that an SPV solar park must have at least 0.4km² of surface area, we go from 10.17% to 9.74% (i.e 47331.18 km² to 45329.96km²), a reduction in the area of approximately 2001.22 km². From this point, we note that SPV solar power plants can be installed in all regions of Cameroon. In addition, the regions of the Far North, the North, the Centre, the West, and the Coast abound with as many sites as possible for the establishment of SPV farms connected to the electricity grid. In addition, the land suitable for the installation of CPS solar parks is approximately 0.56% corresponding to an area of 2606.24 km². However, when we include the condition that a CPS solar park must have at least 2.2km² of surface, we go from (47,331.18 km² to 45,329.96km²), a reduction in the area of around 2,001.22 km². We note that only the northern regions (Far North, North, Adamawa) and a small area of the North-West and West regions are suitable for the installation of CPS plants in Cameroon. We recall that we have only evaluated the CSP and SPV solar power plants connected to the electricity grid and the various criteria and socio- economic constraints are valid for this scenario. We will soon be looking at the identification of suitable solar sites connected or not to the electricity grid with a multi-criteria analysis method. Keywords: photovoltaic (SPV), concentrated solar power (CSP), boolean, GIS, socio-economic parameter. 1- Introduction More than one billion people still live without access to electricity today. More than half of the people living without access to electricity are located in sub-Saharan Africa . There is an apparent shortage of energy information in Africa, particularly for renewable energy, due to lack of studies and research on the integration of renewable energy technologies [1].Although renewable energies represent a significant part of the sources of electric power production in Cameroon (hydro-electricity), unconventional sources such as solar or wind energy did not represent a large part of their electric energy systems. The first step in promoting the use of these sources in the region is to identify the potential of each energy source, a task that can be completed using spatial tools such as geographic information systems (GIS) [2]. There are many renewable energy supply strategies available for development and expansion, but for many countries the idea of possibly switching to fully renewable energy supply using domestic resources currently seems unworkable [3]. Furthermore, it is well established that solar energy is a reliable alternative to reduce greenhouse gas emissions and mitigate the effects of climate change [4]Burning fossil fuels produces about three-quarters of the world's energy supply. However, the combustion of these fuels produces a considerable amount of pollutants, which will eventually harm the environment [5] Achieving the goal of temperature control requires a transition from the overall low-carbon energy structure [6]. Nowadays, renewable energies are preferable to fossil fuels, because they are free, widely available, and produce minimal pollution. In addition, they are not accessible in all geographic positions. It is clear that renewable energy systems can be used to their full potential if used in the right place [7] As the global growth of renewable energy projects accelerates, site identification will become a priority, and a key element is to minimize the impact of development on the environment [8]. Renewable energy sources are currently considered as alternatives to fossil fuels, because they are perpetual, respectful of the environment and emit only negligible quantities of greenhouse gases into the atmosphere while producing energy. A disadvantage of renewable energy sources is that they are not available in all geographic areas. Their use is mainly advantageous in remote places, often of great IJISET - International Journal of Innovative Science, Engineering & Technology, Vol. 7 Issue 10, October 2020 ISSN (Online) 2348 – 7968 | Impact Factor (2020) – 6.72 www.ijiset.com 242
Transcript of Cameroon using a Boolean method FOTSING METEGAM …

GIS-based assessment of photovoltaic (PV) and concentrated solar power (CSP) generation potential inCameroon using a Boolean method
FOTSING METEGAM ISABELLE FLORA1, NJOMO DONATIEN2, RENÉ TCHINDA3, OUMAROUHAMANDJODA4
12 Environmental Energy Technologies Laboratory (EETL) / University of Yaounde 1 / PO Box 7268 Yaounde /Cameroon13 Laboratory of Industrial Systems and Environment of the University of Dschang, PO BOX 96, Dschang, Cameroon4 Energetic Laboratory, National Higher Polytechnic School, P0 BOX 8390 Yaounde, Cameroon Email address of the corresponding author: [email protected]
Abstract:
The negative environmental effects of traditional methods of electricity generation have created the need toplan and strategically develop renewable and sustainable energy production systems. This document presents theanalysis of the suitability of solar park sites using a Boolean decision-making approach based on geographicinformation system (GIS) modeling. This analysis is based on different climatic, geographic, economic, andenvironmental criteria such as wind resource, slope, accessibility by roads, and proximity to the power grid. The landsuitable for the installation of SPV solar parks is approximately 10.17% corresponding to an area of 47,331.18 km².However, when we include the condition that an SPV solar park must have at least 0.4km² of surface area, we go from10.17% to 9.74% (i.e 47331.18 km² to 45329.96km²), a reduction in the area of approximately 2001.22 km². From thispoint, we note that SPV solar power plants can be installed in all regions of Cameroon. In addition, the regions of theFar North, the North, the Centre, the West, and the Coast abound with as many sites as possible for the establishment ofSPV farms connected to the electricity grid. In addition, the land suitable for the installation of CPS solar parks isapproximately 0.56% corresponding to an area of 2606.24 km². However, when we include the condition that a CPSsolar park must have at least 2.2km² of surface, we go from (47,331.18 km² to 45,329.96km²), a reduction in the area of around 2,001.22 km². We note that only the northern regions (Far North, North, Adamawa) and a small area of theNorth-West and West regions are suitable for the installation of CPS plants in Cameroon. We recall that we have onlyevaluated the CSP and SPV solar power plants connected to the electricity grid and the various criteria and socio-economic constraints are valid for this scenario. We will soon be looking at the identification of suitable solar sitesconnected or not to the electricity grid with a multi-criteria analysis method.Keywords: photovoltaic (SPV), concentrated solar power (CSP), boolean, GIS, socio-economic parameter.
1- Introduction
More than one billion people still live without access to electricity today. More than half of the people livingwithout access to electricity are located in sub-Saharan Africa. There is an apparent shortage of energy information inAfrica, particularly for renewable energy, due to lack of studies and research on the integration of renewable energytechnologies [1].Although renewable energies represent a significant part of the sources of electric power production inCameroon (hydro-electricity), unconventional sources such as solar or wind energy did not represent a large part oftheir electric energy systems. The first step in promoting the use of these sources in the region is to identify the potentialof each energy source, a task that can be completed using spatial tools such as geographic information systems (GIS)[2]. There are many renewable energy supply strategies available for development and expansion, but for manycountries the idea of possibly switching to fully renewable energy supply using domestic resources currently seemsunworkable [3]. Furthermore, it is well established that solar energy is a reliable alternative to reduce greenhouse gasemissions and mitigate the effects of climate change [4]Burning fossil fuels produces about three-quarters of the world'senergy supply. However, the combustion of these fuels produces a considerable amount of pollutants, which willeventually harm the environment [5] Achieving the goal of temperature control requires a transition from the overalllow-carbon energy structure [6]. Nowadays, renewable energies are preferable to fossil fuels, because they are free,widely available, and produce minimal pollution. In addition, they are not accessible in all geographic positions. It isclear that renewable energy systems can be used to their full potential if used in the right place [7] As the globalgrowth of renewable energy projects accelerates, site identification will become a priority, and a key element is tominimize the impact of development on the environment [8]. Renewable energy sources are currently considered asalternatives to fossil fuels, because they are perpetual, respectful of the environment and emit only negligible quantitiesof greenhouse gases into the atmosphere while producing energy. A disadvantage of renewable energy sources is thatthey are not available in all geographic areas. Their use is mainly advantageous in remote places, often of great
IJISET - International Journal of Innovative Science, Engineering & Technology, Vol. 7 Issue 10, October 2020ISSN (Online) 2348 – 7968 | Impact Factor (2020) – 6.72
www.ijiset.com
242
ecological value. Thus, the identification of preferable locations for renewable energy systems is a decisional problemthat requires an assessment of the resource potential as well as economic and environmental constraints [9].
There is a huge shortage of solar resource assessments in Cameroon. As a result, the geographic adequacy of solarenergy installations has hardly been studied in this region of the world. This is why the current study is tackling such aresearch gap by asking the following question: "What are the most suitable locations in Cameroon to build large-scalesolar energy installations?". Answering to this research question will potentially help introduce solar energy as arenewable resource for extending electrification to millions of people who still do not have access to electricity.
Electrical installations are one of the most significant challenges faced by public service utilities and developers when itcomes to the introduction and development of large-scale renewable energy production. This study aims to helpdecision-makers assess the areas suitable for large-scale solar energy installations by adapting a GIS-Bolean approach.The study contributes to existing knowledge in this area by introducing:- the first study on the adequacy of large-scale solar energy based on the integrated GIS-Bolean approach in Cameroon,- solar energy suitability maps (CSP and SPV) specific for a Cameroon-like technology, with a high resolution of 1 km* 1km, which represents the highest resolution for all large-scale solar energy suitability maps available in Cameroon.- separate decision and criteria groups based on an in-depth knowledge of the local context in Cameroon.- an easily approach applicable to other technologies using renewable energies once the corresponding criteria(representing the respective technology) has been carefully identified.
The objective of this study is therefore to find suitable areas for the establishment of SPV and CSP solar parksusing Boolean method and socio-economic, technical and environmental criteria.Object 1
2. Literature review
Several studies have been done to identify suitable sites for the installation of renewable energy solar powerplants in different countries.[7] Use the Boolean method of GIS software to identify ideal locations for building wind power plants in the MiddleEast. They conclude that the results of their study could be useful in creating prospects for sustainable energydevelopment for natural resource-based systems and in facilitating national policies on energy transport and theenvironment. [1] Examine the spatial adequacy of large-scale solar installations in Tanzania using geographic information system(GIS) analysis combined with multi-criteria decision-making (MCDM) technique. The study identifies six exclusioncriteria to shade inappropriate areas. A final technology specific suitability map classifies all of the non-excluded areasinto the most suitable, suitable, moderately suitable and least suitable areas. The study also suggests four specificlocations recommended for concentrated solar energy (CSP) installations and four locations for photovoltaic (PV)installations.[10] Assess the usable potential of wind and solar energy for Afghanistan using a multi-criteria GIS decision analysis.Based on the zones, they estimated the wind and solar potential taking into account the technologies and conditions ofthe site. The total calculated annual production potential would be 342,521 GWh of wind energy, 140,982 GWh of solarphotovoltaic energy and about 6,000 GWh of CSP (concentrated solar energy) representing 160 times the power supplyin Afghanistan.[11] Present estimates of geographic and technical potential for solar electricity production in rural areas of West Africa(ECOWAS region). The study is carried out by applying the methods of geographic information systems (GIS) andmulti-criteria decision-making (MCDM). They are studying both the possibilities offered by large-scale solar systemsconnected to the grid (photovoltaic and concentrated solar technologies) and by off-grid solar systems (photovoltaic).The locations are assessed according to their suitability for deploying solar systems according to topographical, legaland social constraints, as well as factors likely to facilitate or prevent the development of solar production. Theyconclude that the results can be used to identify areas of potential interest for the deployment of solar production and tosupport integration between grid extension and off-grid electrification policies. [12] Use a bottom-up approach taking into account the availability of solar energy and land resource constraints toassess the technical potential of CSP in Botswana. The potential of the CSP is estimated using land exclusion criteriabased on a detailed geographic information system (GIS), and data on land use allowing to determine land suitability inthe ten districts of the country. On the basis of the national solar map, information on direct normal irradiance (DNI)derived from satellites and data observed on DNI combined with human-induced biogeophysical and land useconstraints, it is shown that Botswana has approximately 220,016 km2 of land to support CSP plants. They conclude
IJISET - International Journal of Innovative Science, Engineering & Technology, Vol. 7 Issue 10, October 2020ISSN (Online) 2348 – 7968 | Impact Factor (2020) – 6.72
www.ijiset.com
243

that an estimated nominal capacity of 3,389.54 TWh-1 or 363.86 GW could be adapted to the available area. Theyconclude that Botswana has a relatively large potential for CSP, capable of far exceeding current peak energy demand.[4] Use the multi-criteria evaluation method to identify suitable sites for hosting photovoltaic projects in southernMorocco. Geographic information systems and analytical hierarchy process methods were combined to represent ahigh-resolution map comparing the potential of the study area to host large-scale photovoltaic projects. HOMERsoftware was then used to model and simulate a PV system connected to the 10 MW network. The results of this studyconfirm that 24.08% of the study area offers suitable sites for hosting photovoltaic farms. The HOMER simulationclearly showed that the grid-connected photovoltaic system is beneficial in the long term, although its initial capital isgreater than that of the grid supply. In addition, the cost of electricity generated by photovoltaic panels is affordable.
[13] Use geographic information systems and the analytical hierarchy process (AHP) to identify the location of solarfarms in the Mediterranean. The methodology identifies the areas available for the location of solar farms, based onexclusion criteria defined in the legislation in force. The methodology developed uses different types of criteria, such astechno-economic and socio-environmental criteria, it takes into account the distinct opinions of different stakeholdersand allows the evaluation of different scenarios. They are doing a case study of the Rethymno region. The results interms of maximum potential power that can be produced from areas of maximum priority are estimated at 530 MWp forphotovoltaic systems and 30 MW for concentrated solar energy systems.[14] Use site suitability analysis to identify UK solar park locations to help achieve climate change goals. A set ofmaps, each representing a given relevance criterion, is created using geographic information system (GIS) software.These are combined to give a Boolean map of the areas suitable for the installation of a large-scale solar farm. Severalscenarios are studied by varying the criteria, which include geographic factors (land use), solar energy resources and theconstraints of the electricity distribution network. Some are dictated by the physical and technical requirements of large-scale solar construction and others by government or the policy of the distribution system operator. They note that anysuitability card that does not respect planning authorizations and network constraints would overexploit up to 97% ofthe potential area of a solar farm. This study made it possible to find enough room suitable for future energy scenarios(the main lines of the British national network for the future energy landscape).[2] Examine a long list of GIS publications in order to select a methodology to identify areas suitable for thedevelopment of unconventional renewable energy projects (solar and wind) in the Republic of Ecuador (REP). The REPdevelopment potentials have been identified and classified into spatial layers according to their technology and location.These results show that solar photovoltaib is the most widely used technology in the country and has particularlysignificant potential in two regions: the Andes and the Insular region, in particular in the provinces of Loja, Pichinchaand the Galapagos Islands.[6] Build a GIS-based model with 600 land conversion factors incorporated to accurately estimate the potential forlarge-scale photovoltaic energy production in China. The results show a potential installed capacity of 1.41 × 10⁵ GW,which corresponds to an annual energy production of 1.38874 × 10¹⁴ kWh, or 21.4 times the national electricityconsumption in China in 2016. If this potential was fully exploited to replace the current energy based on fossil fuels in2030, it would result in a reduction of the carbon intensity of China from 63% to 68% compared to 2005, which isenough to respect China's commitment to reduce CO2 emissions. At the provincial level, while the production potentialof the northwest and inner Mongolia represents 86% of the total, the eight economically developed coastal provinces ofChina represent only 1%. To realize a maximum large-scale photovoltaic scenario in China in 2030, the capacity ofinterregional transport networks from the North West region and inner Mongolia to regions with insufficient potentialshould reach around 300 GW. Our study could provide policymakers with accurate information on China's large-scalephotovoltaic energy map and on optimizing carbon reduction strategies and interregional energy transportation toachieve sustainable development.
[7] Are trying to find the ideal locations for the construction of hybrid solar-wind power plants in the Middle Eastusing the Boolean model of GIS software. The Boolean method is somehow a stricter method compared to the otherpositioning methods. Consequently, the selected sites will certainly have a higher energy potential using the Booleanmethod. Data obtained by RETScreen4 software from 400 plants in the Middle East was used to collect monthlyweather information. The results of this document could be useful for creating sustainable energy developmentperspectives for natural resource-based systems and for facilitating national energy transport and sustainableenvironmental policies.[15] Use a GIS method combined with a multicriteria assessment to combine existing information on solar radiationwith other geographic factors (slope, land use, urban area and population distribution, as well as proximity to electricalnetwork) in order to generate a suitability map for photovoltaic (PV) power plants in the EU with high spatial
IJISET - International Journal of Innovative Science, Engineering & Technology, Vol. 7 Issue 10, October 2020ISSN (Online) 2348 – 7968 | Impact Factor (2020) – 6.72
www.ijiset.com
244
resolution. They do a matching exercise which shows that the resulting suitability map is a good predictor of suitablelocations for the deployment of photovoltaic plants. They classify the regions according to their overa ll suitability forsolar energy systems and solar investments allocated by the EU cohesion policy. Thanks to this study, they identify thepotential mismatches between the allocation of funds and the current regional adequacy for solar energy. Theyrecommend that future fund allocations take into account the criteria of adequacy of solar energy to optimize the resultsof public policies.
[8] Assess an area in the south of England (17,094 km2) in three stages to determine if it allows the development ofwind and solar farms, using geographic information systems. A multi-criteria decision-making framework incorporatingan analytical hierarchy process involving expert stakeholders was applied, which constitutes an innovative approach forthis type of study. A binary constraint layer has been created, identifying totally inappropriate locations. A factor layerhas been developed to indicate relevance to a range of variables. Layers of aptitude for the development of wind andsolar parks were then created to cover the region. The environmental constraints used in the model represented morethan 60% of the study area for wind and solar developments. Wind power adequacy was generally poor, with only 0.5km² representing the "most suitable" category. The solar capacity was higher overall; and a larger area (294 km2) in the“most suitable” category, which suggests that the region is better suited to the development of solar farms. Stakeholderfeedback resulted in a higher weighting of economic considerations for the solar model, which caused the most suitableareas to coincide with the locations of the national grid connections. A sensitivity analysis showed that the model wasgenerally reliable. This method can be used to assist in the proper selection of sites for shore-based renewable energyprojects in large geographic areas, helping to minimize their impact on the environment.[16] Describe the development of a management and planning system on a GIS (Geographic Information System)platform for decision-makers, whether administrators, planners or consultants in renewable energy (solar systems) ,biomass and wind turbines) in rural Brazil. The GIS tool covers an area of 183,500 km2 and is contains three blocksnamely the management of installed renewable systems, the inclusion (planning) of new systems and the updating ofdatabases. They are developing a PV system as a management and planning support tool to include large-scale solarphotovoltaic energy in rural areas, led by the Ministry of Mines and Energy of Brazil.[17] Develop a two-step framework for the analysis of land suitability for solar farm operation using GIS and the fuzzyanalytical hierarchy process (FAHP) in Iran. In the first step, the map of inappropriate regions is extracted according tothe defined constraints. In the next step, in order to identify the suitability of different regions, 11 criteria defined,including solar radiation, average annual temperatures, distance from power lines, distance from main roads, distancefrom residential area, elevation, slope, land use, mean annual cloudy days, mean annual humidity and mean annualdusty days are identified. The data obtained indicates that 14.7% (237,920 km2), 17.2% (278,270 km2), 19.2% (311,767km2), 11.3% (183,057 km2), 1.8% (30,549 km2) and 35.8% (580,264 km2) of Iran's land area is positioned asexcellent, good, fair, low, bad, and inappropriate areas, respectively.
[9] Present a methodology for the on-site selection of hybrid wind-solar-wind-photovoltaic energy systems in Turkey.First, the objectives of environmental acceptability and economic feasibility are identified by a full review of theTurkish literature, laws and legislation in force and interviews with the Director General of the Turkish Administrationfor Investigation and Electric Resource Development. Secondly, locations that are viable in terms of environmentalacceptability and economic feasibility are determined by a fuzzy decision-making procedure that uses an orderlyweighted average algorithm to aggregate multiple objectives. Then, priority sites are identified separately for wind andsolar energy systems using a geographic information system (GIS). Finally, the associated maps are superimposed toobtain the most realistic locations for hybrid solar-PV wind systems.
2.Theoretical background 2.1. Photovoltaic technology overview Solar
The photovoltaic effect was discovered in 1839 by the French physicist Becquerel. A solar panel works by thephotovoltaic effect, which is to say by the creation of an electromotive force linked to the absorption of light energy in asolid. The photovoltaic cell is the basic building block of photovoltaic solar panels. The development of solarphotovoltaic technology has been progressing very rapidly in recent years due to technological improvements, lowermaterial costs, and government support for the production of electricity from renewable energy. Photovoltaictechnology plays an important role in the use of solar energy for power generation worldwide. The efficiency of solarcells is one of the important parameters for the establishment of this technology on the market.
IJISET - International Journal of Innovative Science, Engineering & Technology, Vol. 7 Issue 10, October 2020ISSN (Online) 2348 – 7968 | Impact Factor (2020) – 6.72
www.ijiset.com
245

Solar photovoltaic (PV) technology is based on PV cells allowing the direct conversion of solar radiation intoelectricity. Nowadays, photovoltaics can be considered as a mature technology, from a technical and economic point ofview. The photovoltaic market experiences an annual growth of 35% to 40%, making it one of the most expandingrenewable energy technologies. The efficiency of PV technology has improved considerably in recent years. Thenominal efficiency of a monocrystalline silicon solar cell was around 15% in the 1950s and is currently increasing to28%. The performance ratio of modern PV systems exceeds 80% (with maximum values around 90%) but lower values between 70% and 85% for monocrystalline and polycrystalline systems are also reported. Photovoltaic technologies areimplemented in systems connected and not connected to the network. Systems connected to the network can be widelydistributed. Large-scale photovoltaic systems have a capacity ranging from 10 MW to more than 100 MW and generallyrequire an area greater than 0.4 km². One of the advantages of these systems is the economy of scale. Distributedsystems connected to the network make it possible to develop the potential of solar energy in built-up areas (i.e. systemsmounted on the roof). Off-grid systems can supply energy to a single consumer or to several consumers via a midinetwork (without connection to the main lines of the electricity network). Off-grid systems provide opportunities forsupplying electricity to remote areas while avoiding costly investments in distribution and transmission systems.
2.2. Concentrated solar power technology overviewConcentrated solar energy (CSP) technology use mirrors which transform solar energy into heat which is then
converted into electricity using steam turbines, gas turbines or Stirling engines. The CSP market is currentlydeveloping, mainly in Europe (with Spain) and in the United States. Types of CSP installations include parabolictroughs, power towers, parabolic type systems, and Fresnel eggplant technology. These technologies differ ininvestment costs, land requirements and efficiency gains. Parabolic gutter systems dominate the CSP market. In 2010,parabolic trough technology represented 100% of the CSP plants in operation and under construction and 75% of theplanned CSP plants. The “solar-electricity” yields of CSP technologies are linked to the evolution of CSP technologiesand Field conditions. In particular, the efficiency of CSP plants strongly depends on the level of solar irradiance. One ofthe advantages of CSP technology is the presence of a thermal intermediary, which offers possibilities for thermalstorage and hybridization with fossil fuels. Among the disadvantages are the high demands in land and water (except incase of dry cooling).
2.3. Definitions of solar power potentialsThe solar production potential can be classified into 4 categories: geographic, technical, economic and
environmental. The geographic potential of solar production in a selected area can be defined as the amount of totalannual solar radiation available in that area, taking into account existing geographic constraints (for example, landcovered by forests or bodies of water). The technical potential of solar production in a given area can be defined as theamount of geographic potential in that area that can be converted into electricity, taking into account the technologiesavailable in solar energy. Economic potential represents the technical potential that could be realized in practice at acost compatible with conventional sources of electricity. And the environmental potential helps protect our environmentby respecting environmental criteria.
3. Description of study area, data and methodology3.1. Study area 3.1.1. Presentation of Cameroon
Located between the equator and the tropics, Cameroon, situated at 6° north latitude and at a longitude of 12°E, has got the form of a triangle with an area of 475 650 km² (Land: 98.8%; Water: 1.2%) Surrounded by Lake Chad,the Atlantic Ocean, and the Congo Basin, it borders on Chad, the Central African Republic, Congo, Gabon, EquatorialGuinea and Nigeria. The relief of Cameroon is very diverse: We have in the western part of the country, wooded hills aswell as a long chain of mountains dominated on all the Atlantic coast by Mount Cameroon (4095 m). In the center,altitude pastures in the Adamaoua massifs 2,500m high. In the North, the savannah is dominant as well as somemountain ranges (the Mandara Mountains) on the border with Nigeria. In the South, tropical forests and swamps. Thecountry is subdivided into 10 administrative regions: the Far North (Maroua); the North (Garoua); Adamaoua(N'gaoundéré); the East (Bertoua); the Center (Yaoundé); North West (Bamenda); the South West (Buea); the West(Bafoussam); the Littoral (Douala); and the South (Ebolowa). Linguistically, the population is bilingual (English andFrench are the official languages), mostly French-speaking (80%) and an English-speaking minority (20%). It isestimated at just over 15 million souls. it is also unevenly distributed with an estimated density of about 10 inhabitantsper km2 in the south-east and greater than 100, with peaks at 200 in the western area. 56% of the population is under 20
IJISET - International Journal of Innovative Science, Engineering & Technology, Vol. 7 Issue 10, October 2020 ISSN (Online) 2348 – 7968 | Impact Factor (2020) – 6.72
www.ijiset.com
246
and around 50% of the total population live in urban areas, with around 50% in the cities of Douala (economic capital)and Yaoundé (administrative and political capital).
3.1.2. Context of electric power in Cameroon
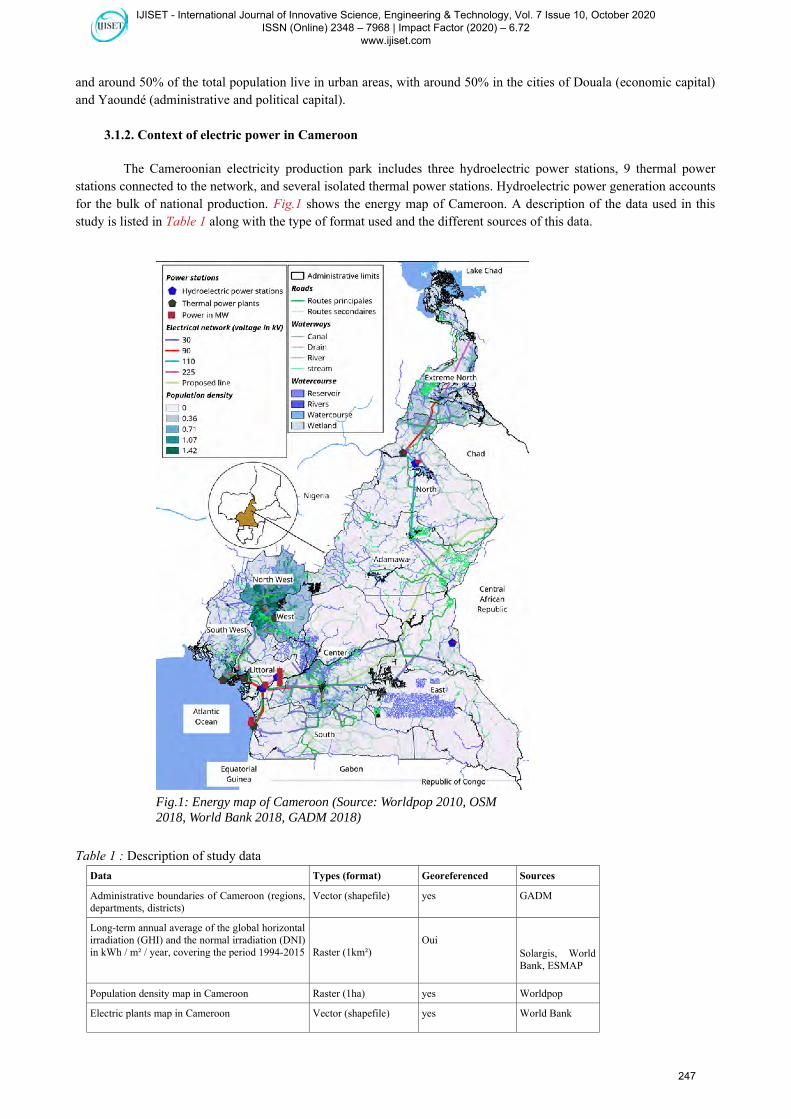
The Cameroonian electricity production park includes three hydroelectric power stations, 9 thermal powerstations connected to the network, and several isolated thermal power stations. Hydroelectric power generation accountsfor the bulk of national production. Fig.1 shows the energy map of Cameroon. A description of the data used in thisstudy is listed in Table 1 along with the type of format used and the different sources of this data.
Table 1 : Description of study data
Data Types (format) Georeferenced Sources
Administrative boundaries of Cameroon (regions,departments, districts)
Vector (shapefile) yes GADM
Long-term annual average of the global horizontalirradiation (GHI) and the normal irradiation (DNI)in kWh / m² / year, covering the period 1994-2015 Raster (1km²)
OuiSolargis, WorldBank, ESMAP
Population density map in Cameroon Raster (1ha) yes Worldpop
Electric plants map in Cameroon Vector (shapefile) yes World Bank
Fig.1: Energy map of Cameroon (Source: Worldpop 2010, OSM 2018, World Bank 2018, GADM 2018)
IJISET - International Journal of Innovative Science, Engineering & Technology, Vol. 7 Issue 10, October 2020 ISSN (Online) 2348 – 7968 | Impact Factor (2020) – 6.72
www.ijiset.com
247

Hydrological map of Cameroon (water course,navigable water course, rivers, fleuves, wetlands,reservoirs…).
Vectoriel (shapefile)
yes OSM
Lands occupation map in Cameroon Vector (shapefile) yesOSM
Road network (inter-states, primary, secondary…roads) in Cameroon
Vector (shapefile)yes OSM
Electric network map in Cameroon Vector (shapefile)yes World Bank
Evaluation map in Cameroon Vector (shapefile)ou raster yes
USGS/NASASRTM data.
Monthly average temperature map over 12months from 1970 to 2000 in Cameroon
Raster (1km²) Yes Worldclimversion 2.0
3.2. Data description of solar farm3.2.1. Solar resources
Solar radiation is the main resource for solar energy technologies. According to NASA’s SurfaceMeteorology and Solar Energy Department, DNI is the primary resource for CSP technologies. GHI meanwhileincludes both DNI and DIF (Horizontal Diffuse Irradiation), i.e. solar radiation which does not follow a direct path ofthe sun, but which has been dispersed by particles and molecules in the atmosphere and which therefore comes from alldirections. Sites with high potential for solar resources will have a significant impact on the economic feasibility oflarge-scale solar energy installations. It is therefore essential to take into account the locations with high DNI for CSPinstallations and the locations with high GHI for PV installations Information on solar resources in Cameroon is basedon data provided by the World Bank Group's Energy Sector Management Assistance Program (ESMAP). Solarirradiation data has a spatial resolution of 5 km*5 km. While CSP plants can operate at an annual level of 1,800kWh/m2 for DNI and large-scale photovoltaic plants can operate at an annual level of 1,700 kWh/m2, the site of theplant becomes much more technically and economically favorable with increasing radiation levels. Table 2 shows thedifferent thresholds for the DNI and the GHI.
3.2.2. Distance from electrical networkLong transmission lines between solar parks and the grid are associated with wiring costs and loss of
electricity. The solar parks must be located near the electrical network. One of the biggest problems in reducing the costof building solar parks is reducing the cost of building energy transmission infrastructure. When choosing the location,it is necessary to take into account the availability and access to the existing electrical network. For the current analysis,the maps of the national power grid and the power plant are extracted from the Eneo electrical data register. ENEO is anational electricity company responsible for managing electrical energy in Cameroon. In this study, a distance of 10kmaround the electrical network was taken as an area suitable for the establishment of solar parks. However, a safetydistance of 250m is observed between the solar park and the power lines. The data relating to the electrical networkcomes from the World Bank 2018.
3.2.3. Distance from residencesResidential areas in general and areas located less than 2km from residential areas are not suitable for setting
up a solar park. Due to the various adverse environmental impacts on populated centers and growing residential areas,distance from residential areas is considered to be one of the important criteria in the selection of PV and CSP solarpark sites. In addition, regions more than 45km ( A. Aly et al.,2017) [1] away from populated centers are consideredinappropriate areas for establishing solar farms. However, these buffer distances are different in different studies andtheir selection must be justified on a case-by-case basis by the national planning authority. It is important that thelocations of the solar parks are at a reasonable distance from the settlement areas in order to minimize transmissionlosses. Residential area data is obtained from Open Street Map (OSM, 2018). The safety distance is 2km aroundresidential areas.
3.2.4. Distance from roadsTo minimize the costs of building and maintaining solar parks, it is necessary that the distance between the
location of the proposed solar park and the road network be as small as possible. In most solar park location
IJISET - International Journal of Innovative Science, Engineering & Technology, Vol. 7 Issue 10, October 2020 ISSN (Online) 2348 – 7968 | Impact Factor (2020) – 6.72
www.ijiset.com
248
assessments, the furthest areas from the roads are considered less suitable than those closer. However, there is nogenerally valid definition of a maximum distance between solar parks and the road network. The specific nature oftransporting equipment for the installation and subsequent maintenance of solar panels is reflected in the need to securethe road network at the location of the solar park, by making the most of the existing road network. In order to reducetransport costs, it is preferable that the distance from the road be as small as possible. We took a distance of 10kmaround the roads as a suitable area for the installation of wind power plants. However, a safety distance of 500m isobserved between the solar park and the road network. Road data is from Open Street Map 2018.
3.2.5. Population densitySince electrical energy is not stored and generates enormous losses during its transport, it would be desirable to
locate solar sites not very far from densely populated areas. However, the dangers caused by solar parks require theirconstruction far from densely populated areas. In this study, we have taken as suitable sites areas with less than 500inhabitants per km² or less than 5 inhabitants per hectare.
3.2.6. SlopeAccessibility for installation and maintenance in solar parks is hampered by the steep slope of a plot. In the
literature, the maximum authorized slope threshold ranges from 1% to 10% for the CSP and from 10% to 20% for theSPV. Due to the additional costs of construction and maintenance, the topography with steep slopes is generallyconsidered unsuitable for the development of wind farms. In the physical sense, solar parks must be located in suitablelocations. Areas with steep slopes are generally considered less suitable due to the additional construction andmaintenance costs. In this study, slopes of 2% and 10% were respectively taken as the maximum threshold for the CSPand the SPV. The elevation map from which the slope is drawn is from USGS / NASA SRTM data.
3.2.7. Distance from protected areasIn order to avoid or reduce the negative impact on the environment, it is desirable to place solar parks outside
protected areas. In this study, the protected areas are parks, forests, nature reserves, etc. A distance of 100m was alsotaken as a safety zone around lakes, rivers and wetlands for the SPV and CSP parks. However, CSP parks need to be ata maximum distance of 10km from watercourses because, we need water to maintain the CSP panels. Land cover dataare from OSM 2018.
3.2.8. AltitudeIn the physical sense, solar parks must be placed in suitable locations. Areas with high altitudes are generallyconsidered to be less suitable due to the additional construction and maintenance costs. In this study, an altitude ofmaximum 4km was taken as the threshold. The elevation map is from USGS / NASA SRTM data.
3.2.9. Plant requiredWe remind here that we are installing solar power plants and not solar panels for the power supply of a house
or other. These solar power plants will be connected to the national electricity grid in order to increase production. Theareas required for the installation of an SPV and CSP solar park are areas of minimum 0.4km² and 2.2km² respectively.
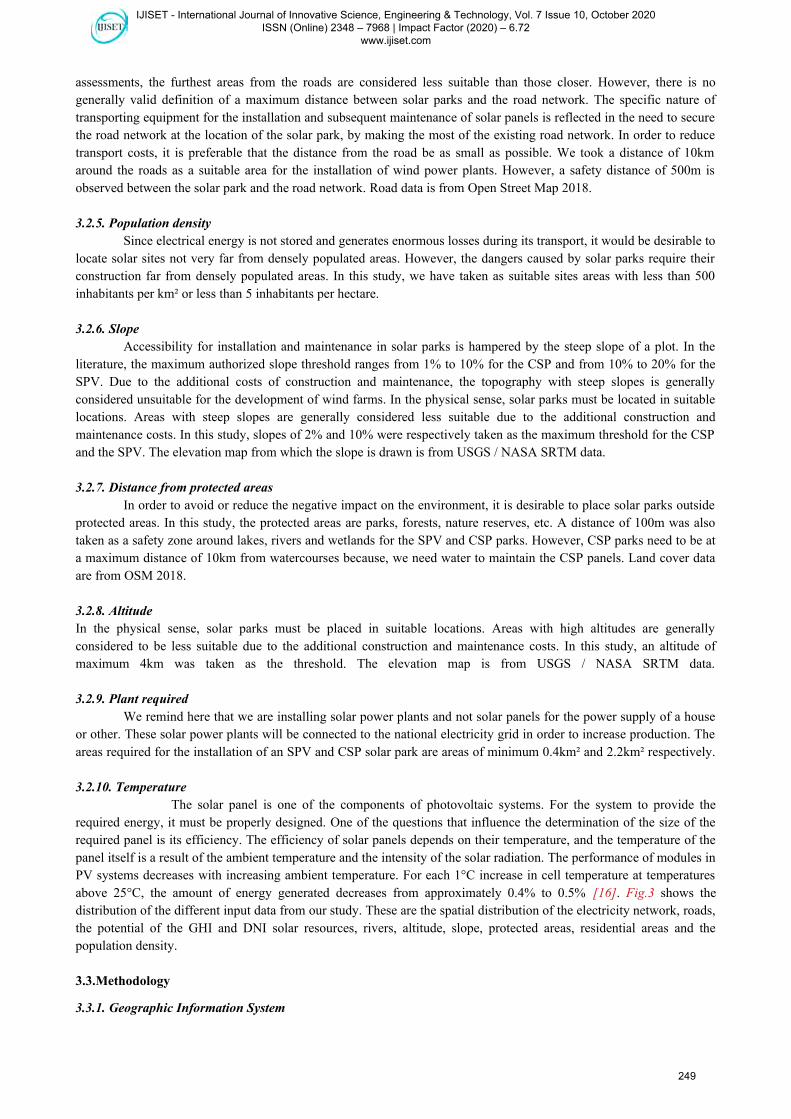
3.2.10. TemperatureThe solar panel is one of the components of photovoltaic systems. For the system to provide the
required energy, it must be properly designed. One of the questions that influence the determination of the size of therequired panel is its efficiency. The efficiency of solar panels depends on their temperature, and the temperature of thepanel itself is a result of the ambient temperature and the intensity of the solar radiation. The performance of modules inPV systems decreases with increasing ambient temperature. For each 1°C increase in cell temperature at temperaturesabove 25°C, the amount of energy generated decreases from approximately 0.4% to 0.5% [16]. Fig.3 shows thedistribution of the different input data from our study. These are the spatial distribution of the electricity network, roads,the potential of the GHI and DNI solar resources, rivers, altitude, slope, protected areas, residential areas and thepopulation density.
3.3.Methodology
3.3.1. Geographic Information System
IJISET - International Journal of Innovative Science, Engineering & Technology, Vol. 7 Issue 10, October 2020 ISSN (Online) 2348 – 7968 | Impact Factor (2020) – 6.72
www.ijiset.com
249
GIS (Geographic Information System) have been used as a research and application tool since the 1970s. Itrelates to a number of academic fields, including wind technology. GIS are designed to store, retrieve, manipulate,analyze and map geographic data [18]. Raster and vector are the two types of coverage representation with which GISwork. The raster is represented by a rectangular grid called pixels which contains specific information based on aspecific geographic location. The vectors manage a geometric figure (points, lines and polygons) defining the limitsassociated with a reference system. The storage of this information is presented in a geodatabase which provides order,structure and normalization of the data. All geographic information has been treated as a raster in this research, due tothe continuous analysis of spatial variables such as wind speed, terrain altitude and vegetation cover, among others. GISis a powerful tool for collecting and organizing spatial data, with many successful examples of potential sites forrenewable energy production appearing [18] ,[19]. The raster processes are faster in evaluating problems, includingmathematical combinations such as Boolean methods. The Boolean method in a GIS environment is based on criteriarepresented by a layer of geo-referenced cartographic information; therefore, each point of the territory received a valueconcerning the activity of the object of the decision which is 0 for not appropriating and 1 for appropriating. The freesoftware GRASS GIS.7 and QGIS 2.18 were used to pixelate and normalize the data layers in this research. With thisstarting point and the generated entries, the statistical calculations were also made in GRASS and the layout of thefigures in QGIS.
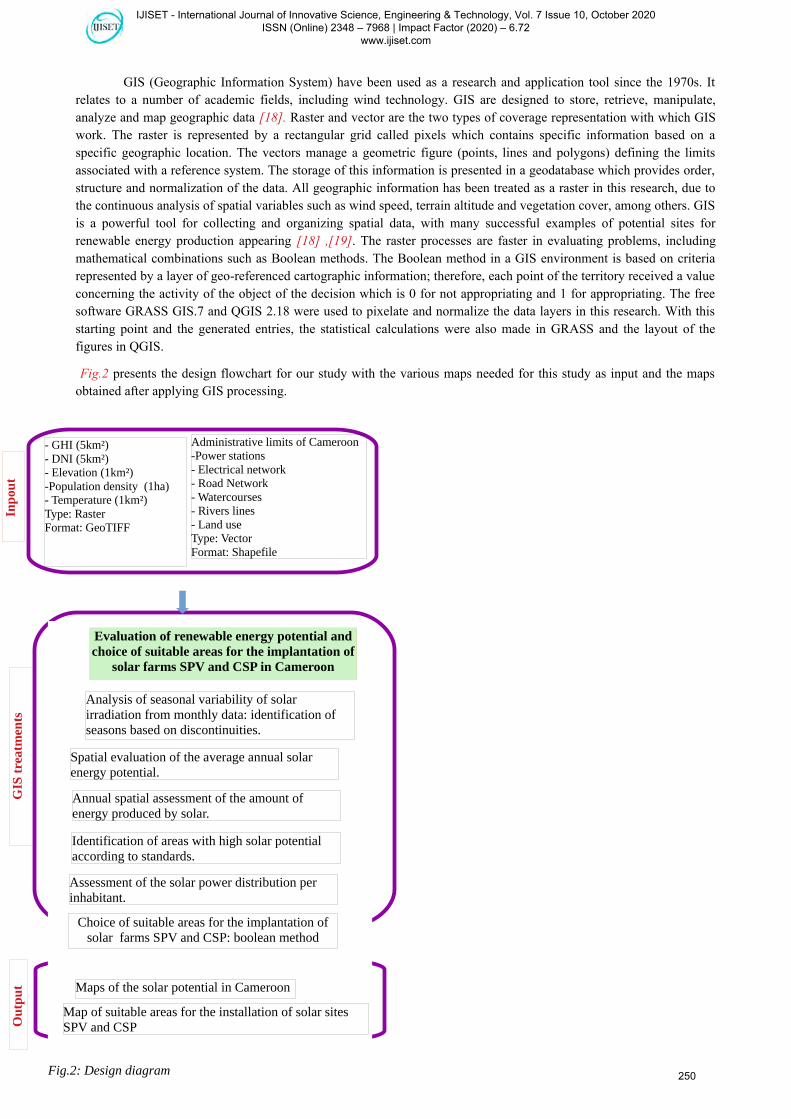
Fig.2 presents the design flowchart for our study with the various maps needed for this study as input and the mapsobtained after applying GIS processing.
Inp
out
- GHI (5km²)- DNI (5km²)- Elevation (1km²)-Population density (1ha)- Temperature (1km²)Type: RasterFormat: GeoTIFF
Administrative limits of Cameroon-Power stations- Electrical network- Road Network- Watercourses- Rivers lines- Land useType: VectorFormat: Shapefile
Fig.2: Design diagram
Maps of the solar potential in Cameroon
Evaluation of renewable energy potential and choice of suitable areas for the implantation of
solar farms SPV and CSP in Cameroon
Out
pu
t
Spatial evaluation of the average annual solar energy potential.
Analysis of seasonal variability of solar irradiation from monthly data: identification of seasons based on discontinuities.
Annual spatial assessment of the amount of energy produced by solar.
Assessment of the solar power distribution per inhabitant.
Choice of suitable areas for the implantation of solar farms SPV and CSP: boolean method
Identification of areas with high solar potential according to standards.
Map of suitable areas for the installation of solar sites SPV and CSP
GIS
tre
atm
ents
IJISET - International Journal of Innovative Science, Engineering & Technology, Vol. 7 Issue 10, October 2020 ISSN (Online) 2348 – 7968 | Impact Factor (2020) – 6.72
www.ijiset.com
250

3.3.2. Boolean logic The Boolean logic model is the easiest way to combine layers in a GIS. The combination of layers in this
method is based on the zero-one law, and the final result of the model is a map divided into two classes that is totallyappropriate (class 1) and totally inappropriate (class 0). This model has low flexibility and great rigor. Once the layershave been formed on the basis of the Boolean model, the layers obtained are combined using the AND operator bymultiplying layers in raster layers. The AND operator, based on an intersection logic working in raster layers, is asfollows: if the two input values are true, the output takes a value of 1 and if an input value is false and that the other istrue, the relevant cell includes 0 in the output [20] .
Fig.3: Evaluation Data
a) Transmission network Map b) Roads Map d) Residential areas Mapc) Protected areas Map
e) Streams Map f) Wet area Map g) Slope Map h) Elevation Map
IJISET - International Journal of Innovative Science, Engineering & Technology, Vol. 7 Issue 10, October 2020 ISSN (Online) 2348 – 7968 | Impact Factor (2020) – 6.72
www.ijiset.com
251

Fig.4: GIS based model solar SPV and CSP farm site selection
Fig.4 shows in a more detailed way the differents steps, and the related treatments to obtain appropriate sitesfor the implantation of SVP and CP solar using the SIG. Table 2 displays necessary criteria for the present study and thesites appropriate for SVP and CSP.
Table 2 :Restriction criteria from chosen solar farm (SPV and CSP) site selection studies.
Economic Planning Ecological Physical
Plantrequiredarea
Ressourcespotential
Temperature
Buffer distance/ proximityfromelectricitygrid
Proximity /buffer to roads &highways
Protectarea(forests & parks…)
Populationdensity,Minimize density
Bufferdistance/proximityfromresidential
Buffer distancefromstreams
Bufferdistancefromrivers
Slope Altitude
SPV >=0,4km² [10]
Annual globalhorizontal irradiation(GHI) ≥ 1300 kWh/m2
[10]
>=20°[17]
>250 m and <=30 km[2]
>500 mand≤10 km[2]
Not withinprotectarea [2]
<=500 inhabitants/km²(5 inhabitants/ha)[11]
>2 km and<45 km [1]
>=100 m[10]
>=100 m [10]
<10 %(5,71°)[11]
<=4km[2]
CSP ≥ 2,2 km²[10]
Annual direct normalirradiation (DNI) ≥1 500 kWh/m² [2]
>=20°[17]
>250 m and≤30 km [2]
>500 mand≤10 km[2]
Not withinprotectarea [2]
<=500 inhabitants/km²((5 inhabitants/ha)[11]
>2 km and<45 km [1]
>=100 mand≤10 km[10]
>=100 m and≤10 km[10]
<2 %(1,15°)[11]
<=3km[2]
IJISET - International Journal of Innovative Science, Engineering & Technology, Vol. 7 Issue 10, October 2020 ISSN (Online) 2348 – 7968 | Impact Factor (2020) – 6.72
www.ijiset.com
252
4- Results and discussions
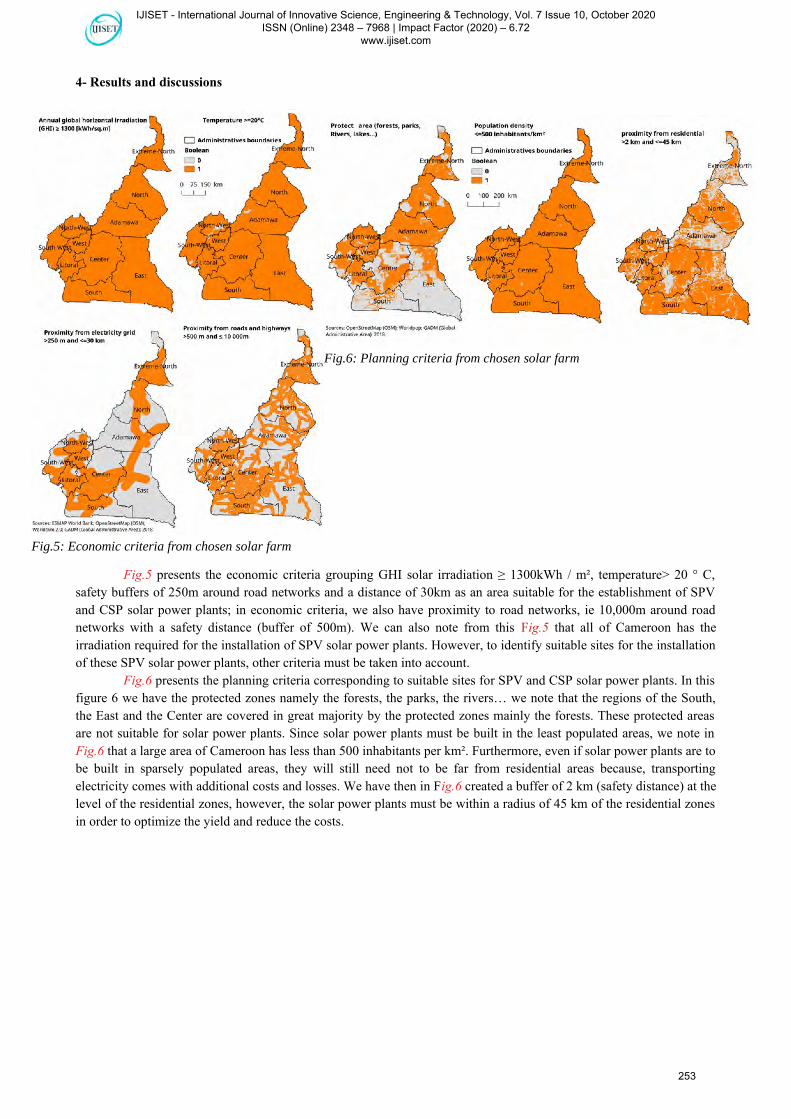
Fig.5 presents the economic criteria grouping GHI solar irradiation ≥ 1300kWh / m², temperature> 20 ° C,safety buffers of 250m around road networks and a distance of 30km as an area suitable for the establishment of SPVand CSP solar power plants; in economic criteria, we also have proximity to road networks, ie 10,000m around roadnetworks with a safety distance (buffer of 500m). We can also note from this Fig.5 that all of Cameroon has theirradiation required for the installation of SPV solar power plants. However, to identify suitable sites for the installationof these SPV solar power plants, other criteria must be taken into account.
Fig.6 presents the planning criteria corresponding to suitable sites for SPV and CSP solar power plants. In thisfigure 6 we have the protected zones namely the forests, the parks, the rivers… we note that the regions of the South,the East and the Center are covered in great majority by the protected zones mainly the forests. These protected areasare not suitable for solar power plants. Since solar power plants must be built in the least populated areas, we note inFig.6 that a large area of Cameroon has less than 500 inhabitants per km². Furthermore, even if solar power plants are tobe built in sparsely populated areas, they will still need not to be far from residential areas because, transportingelectricity comes with additional costs and losses. We have then in Fig.6 created a buffer of 2 km (safety distance) at thelevel of the residential zones, however, the solar power plants must be within a radius of 45 km of the residential zonesin order to optimize the yield and reduce the costs.
Fig.5: Economic criteria from chosen solar farm
Fig.6: Planning criteria from chosen solar farm
IJISET - International Journal of Innovative Science, Engineering & Technology, Vol. 7 Issue 10, October 2020 ISSN (Online) 2348 – 7968 | Impact Factor (2020) – 6.72
www.ijiset.com
253

Fig.7 shows the physical and ecological criteria for the construction of SPV solar power plants. For rivers andstreams, we have created a safety distance of 100m (buffer 100m) around them. Slopes <10% and altitudes <4000 m arealso shown in this Fig.7. We can note that Cameroon has an altitude <4000m which suits perfectly for the constructionof SPV solar power plants. Fig.8 presents the economic criteria (DNI solar irradiation), ecological and physical criteriafor CSP solar power plants. We note that only the great North (Far North, North and Adamawa) and a small part of theNorth West are suitable for the establishment of CSP solar power plants. Furthermore, a safety distance of 100m mustbe observed for rivers and streams. However, CSP solar power plants need water for the maintenance of cylindrical-parabolic concentrators. They will therefore have to be at a maximum distance of 10km from streams and rivers.Speaking of physical parameters, we took a slope <2% and an elevation <3000m. We note in Fig.8 that Cameroon hasan altitude of 3000m throughout its territory which is perfectly suitable for the construction of solar power plants.However, several techno-economic and environmental parameters are taken into account when choosing suitable sites.
Fig.7: Ecological and physical criteria from chosen solar farm SPV
Fig.8: Economic, Ecological and physical criteria from chosen solar farm CSP
IJISET - International Journal of Innovative Science, Engineering & Technology, Vol. 7 Issue 10, October 2020 ISSN (Online) 2348 – 7968 | Impact Factor (2020) – 6.72
www.ijiset.com
254

Fig.9 presents the final map after combining the various economic, planning, physical and ecological maps forthe sites suitable for the installation of SPV solar power plants.
The suitable land for the installation of SPV solar parks is approximately 10.17% corresponding to an area of47,331.18km² Fig.9. However, when we include the condition that an SPV solar park must have at least 0.4km² ofsurface [10], we go from 10.17% to 9.74% (47,331.18 km² to 45,329.96km²), corresponding to a reduction in area ofapproximately 2001,22 km² from Fig.9A to Fig.9B. From Fig.9, we see that SPV solar power plants can be installed inall regions of Cameroon. In addition, the regions of the Far North, the North, the Center, the West and the coast haveplenty of sites suitable for the establishment of SPV farms connected to the electricity grid. A study will be made soonby including sites not connected to the electricity network with a multi-criteria analysis methodology.
Fig.9: Suitability maps for Solar farm SPV (A) and Solar farm SPV ≥ 0.4km² (B)
A B
IJISET - International Journal of Innovative Science, Engineering & Technology, Vol. 7 Issue 10, October 2020 ISSN (Online) 2348 – 7968 | Impact Factor (2020) – 6.72
www.ijiset.com
255

Fig.10 presents the final map after the combination of the different economic, planning, physical andecological maps for the sites suitable for the establishment of CPS solar power plants.
The land suitable for the installation of CPS solar parks is approximately 0.56% corresponding to an area of2606.24 km² Fig.10A. However, when we include the condition that a CPS solar park must have at least 2.2km² ofsurface [10], we go from 47,331.18 km² to 45,329.96 km². Consider a reduction in area of around 2,001.22 km² fromFig.10A to Fig.10B. From Fig.10, we find that only the regions of the far North (Far North, North, Adamawa) and asmall area of the North-West and West regions are suitable for the installation of CPS power plants in Cameroon. Werecall that we have only evaluated the solar power plants connected to the electricity grid and the various criteria andsocio-economic constraints are valid for this scenario. We will soon be looking at the identification of suitable solarsites connected or not to the electricity grid with a multi-criteria analysis method.
The problem of locating suitable sites for the installation of SPV and CSP solar power plants is its complexapproach, because different and often contradictory criterion have to be taken into account in order to find the mostsuitable location zones. For example, an environmental criterion relating to the location of solar energy installations,such as the distance from areas of environmental interest, the purpose of which must be maximized, may in some casescontradict the criterion of distance from the road network, which is a techno-economic factor intended to be minimized.Therefore, the main objective of site selection studies suitable for the establishment of SPV and CSP solar sites is tofind the most suitable locations to minimize impacts on the natural and human environment and maximize economicand technical potential.
This study addressed the problem of the location of solar energy installations, using GIS and the Booleanmethod. Therefore, a dynamic methodology has been developed to find sustainable settlements that can accommodateSPV and CSP farms. The adopted methodology was applied in the case study of the regional unit of Cameroon andallowed:- the identification of legally available localization areas, after revision of the corresponding legislation- the evaluation of the available sites of establishment, on the basis of technical-economic and socio-environmentalcriteria.
Fig.10: Suitability maps for Solar farm CSP and Solar farm CSP ≥ 2.2km²
A B
IJISET - International Journal of Innovative Science, Engineering & Technology, Vol. 7 Issue 10, October 2020 ISSN (Online) 2348 – 7968 | Impact Factor (2020) – 6.72
www.ijiset.com
256

- the classification of each evaluation criterion in a two-category priority scale, after a rigorous bibliographic analysis,to determine the relative importance of the criteria, by implementing the Boolean method.- the identification of sustainable implantation areas, after the production of priority maps with a Boolean method of theselected criteria
The results of the methodology adopted, for Cameroon, in terms of coverage of the most priority sustainableimplantation areas are 9.74% for SPV photovoltaic parks and 0.56% for CSP parks. Therefore, the main advantages ofthe adopted methodology are as follows: it takes into account the three specters of sustainable development to ensureboth the preservation of the environment and the landscape, and the feasibility of the investment, it takes into accountthe complexity of the choice of site. Therefore, economic evaluation criteria can be used to determine the economicpotential and investors in the renewable energy field can participate in the survey, and thus contribute to their relativeimportance. Finally, the methodology developed is based on the quality and quantity of the data available for collection.In this study, a special effort was made to collect the necessary data from official authorities and scientific studies.However, despite the limitations due to the quality and unavailability of certain data, the methodology developed isdynamic and allows continuous updating of the data collected, which can lead to the use of additional evaluationcriteria.
Fig.9A and Fig.9B respectively show the overall suitability of SPV power stations and SPVs with an areagreater than 0.4km² in all regions of Cameroon, while Fig.10A and Fig.10B respectively show the suitability for CSPpower stations and CSPs of area greater than 2.2km². For CSP, it is clear that the Far North and North regions are themost favorable. In addition, all regions favorable for CSP installations are also favorable for SPV installations.
Acknowledgments
This work would not have been possible without the scholarship offered by ARES for a training period of six months inGeographic Information System (GIS) at the Environment Management and Land Development Institute ( IGEAT) atthe Université Libre de Bruxelles (ULB) in Belgium. We thank for this purpose our training coordinator MaëlleVERCAUTEREN as well as our supervisor HUART Michel.
Bibliography
[1] A. Aly, S. S. Jensen, and A. B. Pedersen, “Solar power potential of Tanzania: Identifying CSP and PV hot spots through a GIS multicriteriadecision making analysis,” Renew. Energy, vol. 113, pp. 159–175, 2017.
[2] J. Cevallos-Sierra and J. Ramos-Martin, “Spatial assessment of the potential of renewable energy: The case of Ecuador,” Renewable andSustainable Energy Reviews. 2018.
[3] C. Barrington-Leigh and M. Ouliaris, “The renewable energy landscape in Canada: A spatial analysis,” Renewable and Sustainable EnergyReviews. 2017.
[4] O. N. Mensour, B. El Ghazzani, B. Hlimi, and A. Ihlal, “A geographical information system-based multi-criteria method for the evaluationof solar farms locations : A case study in Souss-Massa area , southern Morocco,” Energy, vol. 182, pp. 900–919, 2019.
[5] S. Abdul-wahab, Y. Charabi, A. M. Al-mahruqi, and I. Osman, “Selection of the best solar photovoltaic ( PV ) for Oman,” Sol. Energy, vol.188, no. March, pp. 1156–1168, 2019.
[6] Q. Yang et al., “A GIS-based high spatial resolution assessment of large-scale PV generation potential in China,” Appl. Energy, vol. 247,no. March, pp. 254–269, 2019.
[7] M. Jahangiri, R. Ghaderi, A. Haghani, and O. Nematollahi, “Finding the best locations for establishment of solar-wind power stations inMiddle-East using GIS: A review,” Renewable and Sustainable Energy Reviews. 2016.
[8] J. J. W. Watson and M. D. Hudson, “Regional Scale wind farm and solar farm suitability assessment using GIS-assisted multi-criteriaevaluation,” Landsc. Urban Plan., vol. 138, pp. 20–31, 2015.
[9] N. Y. Aydin, E. Kentel, and H. Sebnem Duzgun, “GIS-based site selection methodology for hybrid renewable energy systems: A case studyfrom western Turkey,” Energy Conversion and Management. 2013.
[10] M. A. Anwarzai and K. Nagasaka, “Utility-scale implementable potential of wind and solar energies for Afghanistan using GIS multi-criteria decision analysis,” Renew. Sustain. Energy Rev., vol. 71, no. December 2016, pp. 150–160, 2017.
[11] A. Yushchenko, A. de Bono, B. Chatenoux, M. K. Patel, and N. Ray, “GIS-based assessment of photovoltaic (PV) and concentrated solarpower (CSP) generation potential in West Africa,” Renewable and Sustainable Energy Reviews. 2018.
[12] K. Tlhalerwa and M. Mulalu, “Assessment of the concentrated solar power potential in Botswana,” Renew. Sustain. Energy Rev., vol. 109,no. April, pp. 294–306, 2019.
IJISET - International Journal of Innovative Science, Engineering & Technology, Vol. 7 Issue 10, October 2020 ISSN (Online) 2348 – 7968 | Impact Factor (2020) – 6.72
www.ijiset.com
257

[13] M. Giamalaki and T. Tsoutsos, “Sustainable siting of solar power installations in Mediterranean using a GIS/AHP approach,” Renew.Energy, 2019.
[14] D. Palmer, R. Gottschalg, and T. Betts, “The future scope of large-scale solar in the UK : Site suitability and target analysis,” Renew.Energy, vol. 133, pp. 1136–1146, 2019.
[15] C. Perpiña, F. Batista, and C. Lavalle, “An assessment of the regional potential for solar power generation in EU-28,” vol. 88, no. 2016, pp.86–99, 2020.
[16] C. Tiba, A. L. B. Candeias, N. Fraidenraich, E. M. d. S. Barbosa, P. B. de Carvalho Neto, and J. B. de Melo Filho, “A GIS-based decisionsupport tool for renewable energy management and planning in semi-arid rural environments of northeast of Brazil,” Renew. Energy, 2010.
[17] P. Fahp and A. C. Study, “Land Suitability Analysis for Solar Farms Exploitation Using GIS and Fuzzy Analytic Hierarchy,” pp. 1–24,2016.
[18] R. L. Church, “Geographical information systems and location science,” vol. 29, pp. 541–562, 2002.
[19] D. Mentis, S. Hermann, M. Howells, M. Welsch, and S. H. Siyal, “Assessing the technical wind energy potential in africa a GIS-basedapproach,” Renew. Energy, vol. 83, pp. 110–125, 2015.
[20] L. Falconer, D. Hunter, T. C. Telfer, and L. G. Ross, “Land Use Policy Visual , seascape and landscape analysis to support coastalaquaculture site selection,” Land use policy, vol. 34, pp. 1–10, 2013.
IJISET - International Journal of Innovative Science, Engineering & Technology, Vol. 7 Issue 10, October 2020 ISSN (Online) 2348 – 7968 | Impact Factor (2020) – 6.72
www.ijiset.com
258