Camera-Aided Traffic Data Collection Method for ...
20
Philippine Transportation Journal Vol. 2, No. 2 November 2019 65 Camera-Aided Traffic Data Collection Method for Paratransit Services in the Philippines Dominique Charmaine D. ARANAS a , Jose Regin F. REGIDOR b a,b Institute of Civil Engineering, University of the Philippines - Diliman, Quezon City, Philippines 1101 a E-mail: [email protected] b E-mail: [email protected] Abstract: Paratransit is an essential form of public transport in the country, with many cities and municipalities relying on it for mobility and economic activity. The informal nature of the service makes traffic data collection challenging, hence limited data is available. The manual method of traffic data collection is widely used due to its effectiveness and low implementation cost. However, without a mechanism to review and validate recorded data, it’s susceptible to data reliability issues from human error. Its manpower-intensive nature also makes it inefficient in collecting data on low-capacity vehicles. The study outlines a proposed method that makes use of dual dash cameras to simultaneously collect travel time, delay, and boarding/alighting information through video recordings – minimizing on-site manpower requirements and providing verifiable survey documentation. Data collected using the proposed method were compared with a control (manual) set and were confirmed to perform equally well as the manual method. Keywords: traffic data collection, passenger count, travel time, camera-aided, paratransit 1. INTRODUCTION Paratransit services are demand-oriented public transport modes that are prevalent in developing countries (Neumann, 2014 as cited by Phun and Yai, 2016). These services usually do not have defined routes and schedules (Phun and Yai, 2016). Because they typically make use of low-capacity vehicles (Godard, 2013), they can provide access to hard- to-reach areas, i.e. those with poor road quality or narrow corridors, and thus offer attractive personalized and customizable transport options (Phun et. al., 2019) to the general public. Paratransit is an indispensable form of public transport in developing Asian cities (Phun and Yai, 2016). In the Philippines, where most public transport investment and infrastructure are concentrated in the Greater Manila Area and urban hotspots, most cities and municipalities rely heavily on paratransit to move people and drive economic growth. These local paratransit modes include, but are not limited to, the iconic jeepneys [jitneys]; filcab [mini-jitneys or multicabs]; FX or UV express [modified Asian utility vehicles and vans]; and tricycles [motorcycles with sidecars] (Wicaksono et. al., 2015). While the benefits and importance of paratransit are evident, it has also been criticized as one of the sources of road safety problems, traffic congestion, and environmental pollution (Cervero, 2000). Such is the case in many areas of the country, where the informal (and sometimes even illegal) operating structure of the service has resulted to the proliferation of units and contributed to the disarray of the public transport system. With the recent initiatives of the government to improve local transportation planning processes in the country, local government units (LGUs) now wield the power to address their respective transport problems. The recently updated Omnibus Franchising Guidelines (OFG)
Transcript of Camera-Aided Traffic Data Collection Method for ...

Philippine Transportation Journal Vol. 2, No. 2
November 2019 65
Camera-Aided Traffic Data Collection Method for Paratransit Services in
the Philippines
Dominique Charmaine D. ARANASa , Jose Regin F. REGIDOR
b
a,b
Institute of Civil Engineering, University of the Philippines - Diliman, Quezon City,
Philippines 1101 a E-mail: [email protected]
b E-mail: [email protected]
Abstract: Paratransit is an essential form of public transport in the country, with many cities
and municipalities relying on it for mobility and economic activity. The informal nature of the
service makes traffic data collection challenging, hence limited data is available. The manual
method of traffic data collection is widely used due to its effectiveness and low
implementation cost. However, without a mechanism to review and validate recorded data,
it’s susceptible to data reliability issues from human error. Its manpower-intensive nature also
makes it inefficient in collecting data on low-capacity vehicles. The study outlines a proposed
method that makes use of dual dash cameras to simultaneously collect travel time, delay, and
boarding/alighting information through video recordings – minimizing on-site manpower
requirements and providing verifiable survey documentation. Data collected using the
proposed method were compared with a control (manual) set and were confirmed to perform
equally well as the manual method.
Keywords: traffic data collection, passenger count, travel time, camera-aided, paratransit
1. INTRODUCTION
Paratransit services are demand-oriented public transport modes that are prevalent in
developing countries (Neumann, 2014 as cited by Phun and Yai, 2016). These services
usually do not have defined routes and schedules (Phun and Yai, 2016). Because they
typically make use of low-capacity vehicles (Godard, 2013), they can provide access to hard-
to-reach areas, i.e. those with poor road quality or narrow corridors, and thus offer attractive
personalized and customizable transport options (Phun et. al., 2019) to the general public.
Paratransit is an indispensable form of public transport in developing Asian cities (Phun
and Yai, 2016). In the Philippines, where most public transport investment and infrastructure
are concentrated in the Greater Manila Area and urban hotspots, most cities and municipalities
rely heavily on paratransit to move people and drive economic growth. These local paratransit
modes include, but are not limited to, the iconic jeepneys [jitneys]; filcab [mini-jitneys or
multicabs]; FX or UV express [modified Asian utility vehicles and vans]; and tricycles
[motorcycles with sidecars] (Wicaksono et. al., 2015). While the benefits and importance of
paratransit are evident, it has also been criticized as one of the sources of road safety
problems, traffic congestion, and environmental pollution (Cervero, 2000). Such is the case in
many areas of the country, where the informal (and sometimes even illegal) operating
structure of the service has resulted to the proliferation of units and contributed to the disarray
of the public transport system.
With the recent initiatives of the government to improve local transportation planning
processes in the country, local government units (LGUs) now wield the power to address their
respective transport problems. The recently updated Omnibus Franchising Guidelines (OFG)

Philippine Transportation Journal Vol. 2, No. 2
November 2019 66
require LGUs to prepare their own local public transport route plans (LPTRP) that reflect
appropriate solutions to specific public transport service requirements (DOTr, 2017). This
poses a challenge to the local government to gain a deeper understanding of the root causes of
problems and come up with evidence-based solutions. To achieve this, updated and accurate
data must be used. Depending on the type of problem being addressed, different kinds of data
are typically collected. This study covers the collection of two types of data: travel time and
delay, and passenger load (boarding and alighting).
Travel time is the total elapsed time of travel, including stops and delay, necessary for a
vehicle to travel from one point to another over a specified route under existing traffic
conditions. Travel speed, which is one of the primary measures of assessment of the
efficiency or level of service (L.O.S) of a network or corridor, can be derived from this
information. In public transportation planning, travel time surveys are conducted to determine
the turnaround time (TAT) of vehicles, as well as collect information on the time, duration,
location, and causes of delay (DOTr, 2017).
Boarding and alighting surveys, on the other hand, are conducted to determine the load
profile of a particular mode or route. Passenger load profiles reveal the location of common
stops and also provide information on the volume of commuters that access a certain mode in
a specific location. This information, paired with origin-destination data, is important in
helping planners identify major activity areas along a route, which can be used in efficiently
planning locations of transit stops or transfer points.
Despite the growing popularity of more advanced and sophisticated methods, traffic
data collection for public transport in the country has remained reliant on manual methods due
to limitations in capabilities or resources to afford and sustain the use of such technologies.
While real-time crowd-sourced traffic information is readily accessible from free mobile
navigation applications like Waze and Google Maps, these services only provide information
for trips made using private vehicles and do not account for the various delays that are unique
to public transport vehicles.
Compared to the required capital expenditures and maintenance costs of automated data
collection techniques, manual methods are generally inexpensive to conduct. However, they
require plenty of manpower and resources to collect information on-site. Manual methods also
rely heavily on the skill, attentiveness, and efficiency of the surveyors assigned to the task
(Faghri, 2014). These are prone to human error and are limited by what is reasonably possible
for a person to perceive, assess, and record inside a moving vehicle. Any irregularities in the
data will only be detected during the data processing phase, long after the survey is concluded.
Should any discrepancies arise, surveyors may be called back to explain the possible sources
of the errors; however, this approach is also subject to the surveyors’ ability to recall the road
conditions during the time of the survey.
Aside from these, any unexpected changes in site conditions are difficult to mitigate,
especially when the “unusual” conditions occur or are detected after the deployment of
manpower on site (Belliss, 2004). In cases when too many irregularities are found, the run is
rejected and the survey will have to be repeated, resulting in additional expenses.
The manual method of data collection is particularly tricky for paratransit, which makes
use of low-capacity vehicles. The UV Express Service vehicles, for instance, have seating
capacities ranging from 10-21 passengers. The deployment of surveyors to collect data on
these modes drastically reduce the observable data from 14% up to 30%1 for each trip. Due to
the small size of the vehicle, driver behaviour and observed vehicle speeds are also likely to
be influenced by the presence and proximity of the surveyors.
1 Assumption: At least three surveyors necessary to collect data. Two (2) surveyors for travel time & delay, and
one (1) to collect boarding and alighting data (per mode).

Philippine Transportation Journal Vol. 2, No. 2
November 2019 67
To overcome these limitations, the study proposes an improved method of data
collection with the aid of dash cameras to simultaneously collect travel time, delay, and travel
demand (boarding and alighting) data.
Dashboard cameras, or simply dash cams, are onboard cameras placed on vehicle
dashboards or windshields to collect video footage of the conditions in front of the vehicle.
Other versions also include rear cameras to capture views from behind the vehicle, and
inward-facing cameras to get videos of conditions inside the vehicle. Dash cams are installed
mainly for safety – to provide video evidence in cases of road accidents or other crimes. These
devices have gained popularity in recent years and have become affordable and easily
accessible in gadget shops located in malls and through online shopping.
The proposed method makes use of rearview mirror dash cameras to simultaneously
record video footage outside the vehicle (road conditions, causes of delay) using the front
camera, and inside the vehicle (loading and alighting) using the in-vehicle camera or a
repurposed rear camera. For the study, the tests runs are conducted on UV Express Service
vehicles. This paper covers the proposed methodology, and data validation tests conducted for
the said method.
1.1. Objectives
The study aims to provide a proof of concept for an accessible and sustainable alternative
method of collecting passenger count, travel time, and travel delay information for paratransit
services in the Philippines by demonstrating the use of the method on UV Express Services.
Specifically, the proposed method aims to address the drawbacks of the manual method by:
a. Reducing overall manpower deployment requirements;
b. Maximizing observable (passenger) data per trip;
c. Protecting data integrity by producing verifiable survey documentation; and
d. Introducing potential for automation.
2. RELATED LITERATURE
2.1. Travel Time and Delay Studies
Travel time and delay studies reveal information on the performance of a corridor (Sigua,
2008). Other common uses include evaluation of congestion, traffic management, problem
location identification, model calibration, and evaluation of performance before and after an
improvement (Mathew, 2014; Vergel, 2016).
Three common techniques are used in collecting travel time information:
Test vehicle techniques involve driving an “active” test vehicle on a corridor or route
to collect data. The amount of time it takes for the test vehicle to pass fixed stations is
recorded, and speeds are calculated by dividing the station-to-station distances over the travel
time. Time spent in delays (stopped time) is also recorded in order to compute for running
time vs travel time.
This technique can be performed using different levels of instrumentation. Manual
methods involve using clipboards, stopwatches, and surveyors to manually take note of the
information. More advanced methods involve the use of distance measuring instruments
(DMI) or global positioning systems (GPS) devices to automatically collect information.
(Turner, 1998).
The test vehicle technique typically results in detailed data and require relatively low

Philippine Transportation Journal Vol. 2, No. 2
November 2019 68
initials costs (Matthew, 2014); however, a major disadvantage of the technique is its
susceptibility to human error. This is compounded by the absence of a means to review data
once the test runs are done.
License plate matching techniques involve the recording of license plates and arrival
times of vehicles at designated stations. This can be done manually or with the aid of tape
recorders, video cameras, portable computers, or automatic license plate character recognition
systems (Turner, 1998). This technique is advantageous for gathering information on vehicles
with fixed routes such as public transportation, but is not efficient for other kinds of vehicles
as the method is geographically limited by the location of the checkpoints. Covering large
areas or longer routes require the addition of checkpoints and the employment of additional
manpower. The accuracy of the recording of license plate data is also prone to error,
especially in corridors with high vehicle speeds.
Intelligent Transport System (ITS) probe vehicle techniques make use of “passive”
vehicles equipped with instruments such as global positioning systems, radio navigation
systems, etc. to collect travel information. Unlike in the active vehicle technique, passive
probe vehicles can be personal, public transit, or commercial vehicles that are already in the
traffic stream i.e. vehicles that are not deployed for the express purpose of collecting data
(Turner, 1998). These passive probe vehicles are equipped with several kinds of receivers to
collect travel information and communicate this information real-time to a traffic management
center where this information is stored and processed. Examples of these ITS-based probe
vehicles techniques are advanced traveller information systems (ATIS), such as Waze and
Google Maps Navigation.
The biggest advantage of such systems is the continuous and automated collection of
massive amounts of data that are already saved in digital format (i.e. eliminates the need for
encoding and minimizes human error). The method also collects traffic information in its most
natural (undisrupted) state, as no additional vehicles or monitoring infrastructure are
introduced to the system (Mathew, 2014). While the cost of data collection per vehicle is low,
initial implementation costs of ITS-based probe vehicles are very high. The method requires a
large number of probe vehicles to be minimally equipped with GPS devices, smartphones, and
mobile data to collect and transmit information. Additionally, setting up such a system
requires highly specialized personnel to develop, implement, operate, and maintain software
and hardware. The technique is best for large-scale and long-term data collection efforts.
The U.S. Department of Transportation summarizes the advantages and disadvantages
of the three levels of instrumentation techniques in the table below.
Table 1. Comparison of test vehicle travel time data collection techniques
Instrumentation
Level
Costs Skill Level Level of
Data
Detail
Data
Accuracy
Automation
Potential Capital Data
Collection
Data
Reduction
Data
Collection
Data
Reduction
Manual - Pen & Paper Low Moderate High Low Moderate Low Low Low
Tape Recorder Low Low High Low Moderate Low Low Low
Portable Computer Moderate Low Moderate Moderate Moderate Low Moderate Moderate
Distance Measuring
Instrument (DMI) High Low Low Moderate Low High Moderate High
Global Positioning
System (GPS) High Low Moderate Moderate High High High High
Note: Rating scale is relative among the instrumentation levels shown: [high, moderate, low]
Philippine Transportation Journal Vol. 2, No. 2
November 2019 69
2.2. Boarding and Alighting Studies
Passenger load and ridership data are fundamental measures of efficiency of a public transport
system. High levels of ridership can be an indicator of the success of a system in catering to
passengers’ transport needs. These measures have a wide array of uses including revenue
calculations and projections, route planning and scheduling, and operations planning, among
other things (TCRP 29 Synthesis, 1998).
Ridership data can be collected manually or by indirect means such as accessing
transaction and ticket records from operators and dispatch personnel. Information on
passenger load (boarding and alighting data) can also be collected in this manner for modes
that have fixed stops or terminals.
For modes without fixed stops, automatic passenger counting (APC) systems can be
installed. However, due to the high costs of these equipment, only large-scale and high-
ridership systems can benefit from installing such counters. Paratransit operators are typically
not interested in collecting these information.
Boarding and alighting studies are typically done by planners and operators to identify
major transfer points along a corridor. They can also be done for the same modes during
different times of the day to determine differences in passenger load variation throughout the
day. These studies are performed manually by assigning surveyors to take trips using the
mode surveyed. The surveyors are seated in strategic areas with a clear view ingress and
egress points; they then note the time, location, and number of boarding or alighting
passengers from the start to the end of the trip. While this method is an effective way of
collecting information, it is still prone to human error and limited to what the surveyor can
reasonably observe and note inside a moving vehicle.
2.3. Evaluation of Travel Time Data Collection Methods
Li et. al. (2013) used a series of statistical analyses to evaluate three different travel time data
collection techniques: GPS, DMI, and manual methods. Results showed that the GPS method
was more consistent in terms of accuracy versus the other two methods. The manual method
was found to perform equally well when it comes to measuring travel times, but not delay
times. However, for short travel distances and for trips without delay, all three methods were
concluded to produce the same results at a 95% confidence interval.
A similar study by Faghri, et. al. (2014) evaluated the accuracy and automation of travel
time and delay data collection methods using manual and GPS-based methods. Travel time
data was collected simultaneously using only one vehicle. Results were subjected to
parametric and non-parametric tests to assess the results. Since there is no means of knowing
the actual “true” travel time and delay for a certain corridor, an evaluation on which method is
the “most correct” cannot be made. Hence, the researchers resorted to comparing the three
methods to see if they are equal or different. Analysis of means and variances, Wilcoxon
signed-rank test, and correlation analysis showed that all methods performed equally well for
the travel time and delay measurements.
The statistical approach used by the studies were used as a guide to determine the
appropriate methods to test the validity of the results of the proposed method.

Philippine Transportation Journal Vol. 2, No. 2
November 2019 70
3. METHODOLOGY
3.1. Device Selection
The following minimum specifications were used as criteria for selecting the device:
a. Video resolution (Simultaneous real-time dual high-definition recording)
i. Front camera (road): at least 1080P, 30 frames per second (fps)
ii. Rear camera (in-vehicle): at least 720P, 30 frames per second (fps)
b. Camera lens
i. Front camera (road): wide-angle, at least 160°
ii. Rear camera (in-vehicle): wide-angle, at least 110°
c. Night mode or low-light mode
d. Color LCD Display at least 2”
e. Audio recording
f. USB charging (compatible with car cigarette lighter receptacle/socket)
Additional factors considered were ease of installation and operation of the device, and
minimal obstruction to the driver’s view. In line with the study’s objective of developing an
accessible and sustainable method of data collection, the device must also be affordable and
locally available.
Upon careful assessment of the different available brands on the market, the Blade
Rearview Mirror HD Dash Camera was selected for meeting the required specifications at
minimum cost.
Figure 1. Rearview mirror dual dash camera
3.2. Data collection
3.2.1. Device Set-up and Pilot Run
Prior to data collection, the devices were set up to ensure consistent data across all units. The
date for each unit was set, and time was synchronized. The dash cameras used were capable of
recording video footage with resolution up to 1296P (2304×1296 pixels); however, the lower
resolution of 1080P (1920×1080 pixels) was used to maximize the camera memory, which is
only expandable up to 32 gigabytes (G).
Philippine Transportation Journal Vol. 2, No. 2
November 2019 71
The dash camera software writes video files to the memory card in fixed intervals. For
this study, a three-minute interval was selected to ensure that the file sizes of the videos were
manageable. Splicing the recording into three-minute videos also make it easier to review the
video files during data processing.
A pilot run was conducted to:
a. Assess the video quality taken by the device under normal light (day time) and low
light conditions (night time);
b. Assess rear video quality and visibility of entrance and exit points;
c. Check the maximum number of hours of footage a 32-gigabyte memory card would
be able to store using the video quality settings.
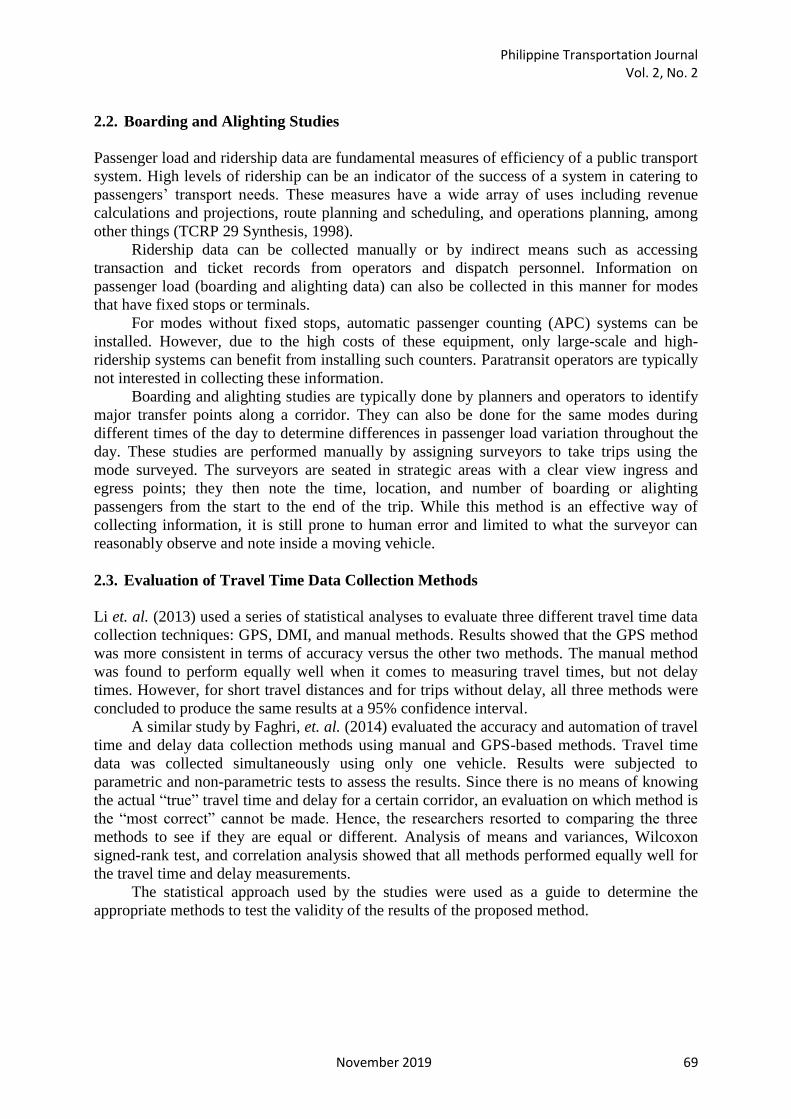
The device was installed by strapping it to the vehicle’s rearview mirror. The rear
camera was secured on top of the rearview mirror in order to get a clear view of the
passengers and the vehicle’s doors. Installation effort was minimal and required no special
technical knowledge to execute. The following images show the device set-up.
Figure 2. Device set-up
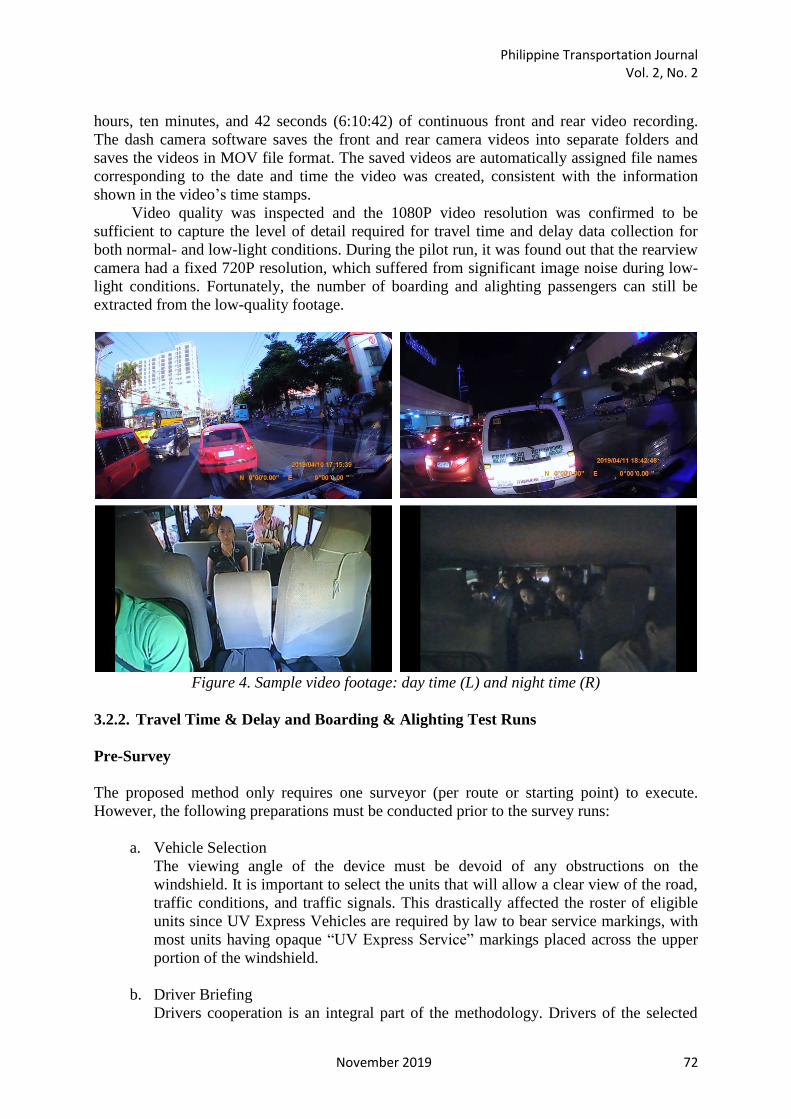
Figure 3. Dash camera LCD (L); Sample video footage (R)
The pilot run was conducted from afternoon to evening (16:00H to 23:00HH) in order to
capture sample footage of video quality during day time and night time.
Upon review of the files, it was found out that the 32G memory card is able to store six
Philippine Transportation Journal Vol. 2, No. 2
November 2019 72
hours, ten minutes, and 42 seconds (6:10:42) of continuous front and rear video recording.
The dash camera software saves the front and rear camera videos into separate folders and
saves the videos in MOV file format. The saved videos are automatically assigned file names
corresponding to the date and time the video was created, consistent with the information
shown in the video’s time stamps.
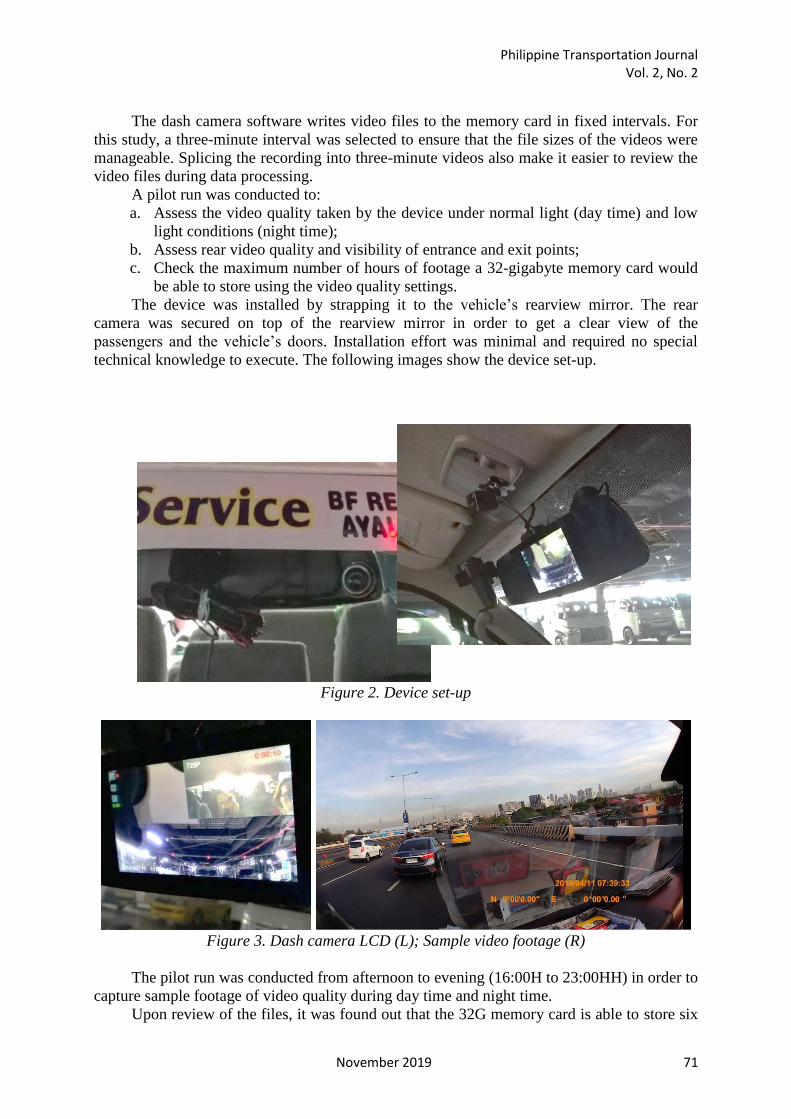
Video quality was inspected and the 1080P video resolution was confirmed to be
sufficient to capture the level of detail required for travel time and delay data collection for
both normal- and low-light conditions. During the pilot run, it was found out that the rearview
camera had a fixed 720P resolution, which suffered from significant image noise during low-
light conditions. Fortunately, the number of boarding and alighting passengers can still be
extracted from the low-quality footage.
Figure 4. Sample video footage: day time (L) and night time (R)
3.2.2. Travel Time & Delay and Boarding & Alighting Test Runs
Pre-Survey
The proposed method only requires one surveyor (per route or starting point) to execute.
However, the following preparations must be conducted prior to the survey runs:
a. Vehicle Selection
The viewing angle of the device must be devoid of any obstructions on the
windshield. It is important to select the units that will allow a clear view of the road,
traffic conditions, and traffic signals. This drastically affected the roster of eligible
units since UV Express Vehicles are required by law to bear service markings, with
most units having opaque “UV Express Service” markings placed across the upper
portion of the windshield.
b. Driver Briefing
Drivers cooperation is an integral part of the methodology. Drivers of the selected

Philippine Transportation Journal Vol. 2, No. 2
November 2019 73
units must be properly informed of the objective of the study, and the kind of data
that will be collected. The driver’s knowledge of the device will also help ensure that
data will not be accidentally lost or overwritten. To safeguard the devices, it is
important to establish rapport with the drivers and to collect basic information such
as proof of identification, contact details, and name of the operator. Coordination
with the operators or driver associations is also recommended.
c. Device installation
Dash camera units must be installed in the vehicles at least one day before the
scheduled day of data collection. This is to ensure proper installation of the devices;
loosely-fastened units may fall off during the time of data collection and result in
loss of data.
Once pre-survey preparations are taken care of, the devices will be able to collect video
footage of the trips taken by the selected units. Depending on the study requirements, the
duration of data collection, and the capacity of the device memory, additional memory cards
may have to be used.
Actual Survey
For this study, the vehicles with installed dash cameras were deployed to collect data on a 3.9-
kilometer route along Marcos Highway, from the Light Rail Transit Line 2 (LRT-2) going to
SM Masinag.
Marcos Highway is a ten-lane secondary national road and is a component of Radial
Road 6 (R-6). The section under study covers the length of Marcos Highway located in the
cities of Marikina and Antipolo which caters to 5 lanes of traffic per direction, separated by
medians approximately 5 meters in width. Survey stations were selected based on prominence
and visibility (day time and night time), and distances between stations were kept as uniform
as possible. Station details are provided in the table below, while a map of the study area and
location of the stations is shown in Figure 5.
Table 2. Survey stations
Station
No Landmark Location
Distance Cumulative
Distance
(m) (m)
1 LRT 2 - Santolan Station Midblock - -
2 Shell MH Highway-Del Pilar Midblock 350 350
3 Amang Rodriguez Avenue Intersection 450 800
4 F. Mariano Avenue Intersection 550 1,350
5 Felix Avenue Intersection 500 1,850
6 Town and Country Subd. Midblock 500 2,350
7 Isuzu Rizal Midblock 450 2,800
8 Filinvest Homes East Subd. Midblock 550 3,350
9 SM Masinag Midblock 550 3,900

Philippine Transportation Journal Vol. 2, No. 2
November 2019 74
Figure 5. Map of the study area
Three sets of evening data were collected from three different vehicles.
Table 3. Test Run Details
Run Time Duration
Start Finish (hh:mm:ss)
1 19:42:35 19:53:31 00:10:56
2 18:24:08 18:41:54 00:17:46
3 20:19:33 20:29:38 00:10:05
3.3. Data Processing
Travel Time and Delay
Encoders were tasked to view the front camera videos and take note of the passing time for
each control point, as well as record stopped time (duration of delay), and the causes and
location of these delays. Encoders were given freedom to speed up, slow down, pause, and
review the videos as needed to efficiently and accurately record information. Timestamps in
the videos allowed the encoders to record time data accurate up to 1 second. Information were
recorded directly as digital files using Microsoft Office Excel. It was noted that encoding
using this method took twice the amount of time as the duration of the video.
To serve as a control group, another set of encoders were tasked to record travel time
and delay manually on a piece of paper as they would on-board the vehicle. The control group
noted data using real-time video speeds only and were not permitted to pause the video, to
simulate on-board manual data collection methods. The manual recording took the same
amount of time as the video duration, while encoding the data took about a fourth of the time
as the duration of the video, on average.

Philippine Transportation Journal Vol. 2, No. 2
November 2019 75
Boarding and Alighting Data
Rear camera videos were used to record information on the passenger load for the trip. Similar
to the previous task, encoders watched the rear camera video footage and observed the
number of boarding and alighting passengers per stop. Using the information from the travel
time and delay data, the specific time of loading or unloading can be easily identified; this
reduces the number of videos that need to be viewed by the encoders as they only need to
check the files containing the time intervals that were noted to have loading and unloading
activities.
Since on-board conditions for passenger loading data collection cannot be simulated
from the video files, no control group was created for this task.
3.4. Data Privacy
The proposed method involves the collection of what is considered as personal information2
under Philippine laws. As such, measures to protect individuals’ right to privacy must be
taken.
During data collection, information in the form of posters and notices shall be posted in
the terminal buildings and general waiting areas. The notice shall minimally contain
information on: the kind of information that will be collected (in this case, video footage),
purpose of data collection, and manner of processing. Additional details that cannot be
reasonably placed in the notice shall be provided through a link or quick response (QR) code.
Passengers who wish to be excluded in the activity shall be allowed to opt out and select
another vehicle to board.
3.5. Data Management
Due to the sensitive nature of the raw footage that will be collected, special care must be
exercised when handling these information.
Storage
Videos saved in the camera memory cards shall be retrieved immediately after each run and
saved either to a laptop or an external memory drive. To avoid loss of data, back-up files shall
be saved in a secure system as soon as practically possible. A viable option of backing up files
without compromising accessibility is by uploading it to a secure cloud storage.
Access and Security
Due to the confidential nature of the footage, access to such storage shall be limited and
monitored. Access to the raw files shall be on a per-need basis and must be duly authorized by
the collecting body (i.e. researcher, or organization). Access may also be granted, upon
request, to individuals whose personal information are contained in the footage. No copies of
the data shall be made without explicit authorization and documentation.
Collecting body shall set up appropriate measures to safeguard the storage of the
documents from unauthorized access. Under Philippine laws, organizations collecting and
handling such information are required to create Data Privacy Teams that oversee compliance
2 Personal information is defined as any information from which the identity of an individual is apparent or can
be reasonably and directly ascertained

Philippine Transportation Journal Vol. 2, No. 2
November 2019 76
with the Data Privacy Act and to ensure security.
Retention and Disposal
Raw files and video footage shall be stored for at least 5 years, or when the data is deemed
obsolete (i.e. superseded by the availability of new data). All copies must be destroyed, and
the process of disposal must be properly carried out and documented.
4. RESULTS
4.1. Travel Time and Delay
Table 4 summarizes the travel speed and running speeds derived from the data collected.
Table 4. Calculated speeds per segment
Sta.
No
Cum.
Dist.
Control Group Test Group
Run 1 Run 2 Run 3 Run 1 Run 2 Run 3
T. S. R. S. T. S. R. S. T. S. R. S. T. S. R. S. T. S. R. S. T. S. R. S.
(m) (kph) (kph) (kph) (kph) (kph) (kph) (kph) (kph) (kph) (kph) (kph) (kph)
1 - - - - - - - - - - - - -
2 350 6.12 6.21 40.65 40.65 40.65 40.65 6.30 6.40 42.00 42.00 39.37 39.37
3 800 9.64 9.94 20.77 24.55 26.13 26.13 9.20 9.47 20.77 23.82 27.00 27.00
4 1,350 7.80 8.35 30.46 30.46 26.40 26.40 8.05 8.80 30.94 30.94 26.40 26.40
5 1,850 11.46 12.41 15.25 17.82 13.04 13.53 11.46 12.77 15.00 17.48 12.77 13.24
6 2,350 21.18 25.35 23.08 29.03 17.65 22.78 20.93 25.35 23.38 30.00 18.00 23.08
7 2,800 43.78 43.78 67.50 67.50 43.78 43.78 42.63 42.63 70.43 70.43 43.78 43.78
8 3,350 24.75 31.94 38.08 50.77 27.89 34.14 24.15 30.94 36.67 47.14 27.12 34.74
9 3,900 23.86 27.12 9.43 12.69 22.25 29.55 24.44 28.29 9.43 13.94 22.76 31.94
Average 18.57 20.64 30.65 34.18 27.22 29.62 18.40 20.58 31.08 34.47 27.15 29.94
Note: T.S. – Travel Speed; R.S. – Running Speed
It can be observed from the table that differences in the data between the two groups
range from 0 to 3.63, while the differences in the average speeds per run range from 0.06 to
0.43.
It can be further noted that within the groups, travel speeds and running speeds only
differ by a small margin. This signifies that the experienced stop delays for the route were
minimal. The differences in travel speed and running speed are shown in the following speed
maps. Computed speeds using the values from the Test (encoder) group were used in
generating the maps.
Differences in the computed values using the data from the two encoder groups are also
shown in the Speed – Distance and Travel time – Distance diagrams that follow.

Philippine Transportation Journal Vol. 2, No. 2
November 2019 77
Figure 6. Speed map (Run 1)
Figure 7. Speed – distance diagram (Run 1)
Figure 8. Travel time – distance diagram (Run 1)

Philippine Transportation Journal Vol. 2, No. 2
November 2019 78
Figure 9. Speed map (Run 2)
Figure 10. Speed – distance diagram (Run 2)
Figure 11. Travel time – distance diagram (Run 2)

Philippine Transportation Journal Vol. 2, No. 2
November 2019 79
Figure 12. Speed map (Run 3)
Figure 13. Speed – distance diagram (Run 3)
Figure 14. Travel time – distance diagram (Run 3)

Philippine Transportation Journal Vol. 2, No. 2
November 2019 80
4.2. Boarding and Alighting Data
The passenger load profiles for the three runs are shown in the figure below.
Figure 15. Passenger Load Profile
Since the captured runs were homebound trips, no loading activities were noted. The locations
of unloading points are highlighted in the map below. The location of the major transfer
points can be easily identified from the two representations shown.
Figure 16. Number of unloading passengers per location
4.3. Analysis
A series of statistical tests were performed to test the validity of the results generated using
the test (proposed) method. Since the accuracy of the determination of travel time data is
highly dependent on the method and instrumentation used, a benchmark on the “most correct”
or “most accurate” travel time data is highly impractical to generate. In the absence of an
absolute “truth” to refer to, a comparison on the correctness and accuracy of the test
(proposed) method and the control (manual) method cannot be made.

Philippine Transportation Journal Vol. 2, No. 2
November 2019 81
Hence, the validity of the test method will be confirmed by assessing if there exists a
significant difference between the test method and the manual method, i.e. if the two methods
are the same (H0), or different (Ha).
Test for normality
Before any tests can be conducted, the distribution of the data must first be confirmed. Given
the small sample size of the data, the Shapiro-Wilk Test will be used to test the normality of
the distribution. The null hypothesis for this test is that the data is normally distributed. The
null hypothesis is rejected if the computed value (W) is less than the p-values at the chosen
level of alpha. Table 5 summarizes the obtained values for the sets of speed data that were
calculated.
Table 5. Summary of computed values for the S-W Test
Variable
Control Group Test Group
Run 1 Run 2 Run 3 Run 1 Run 2 Run 3
T. S. R. S. T. S. R. S. T. S. R. S. T. S. R. S. T. S. R. S. T. S. R. S.
Mean 18.57 20.64 30.65 34.18 27.22 29.62 18.40 20.58 31.08 34.47 27.15 29.94
Standard
Deviation 12.59 13.46 18.34 18.09 10.52 9.79 12.24 13.09 19.24 18.39 10.26 9.67
W 0.876 0.907 0.922 0.944 0.933 0.972 0.876 0.903 0.913 0.925 0.941 0.983
Threshold
α = 0.05 0.818 0.818 0.818 0.818 0.818 0.818 0.818 0.818 0.818 0.818 0.818 0.818
Notes: T.S. – Travel Speed; R.S. – Running Speed
n – sample size; W – Shapiro-Wilk Statistic
All the calculated values for W are greater than the threshold p-values at 95%
significance (alpha level of 0.05) for all runs, hence, the null hypothesis is accepted. The data
is said to be normal.
Repeated Measures t-test (Paired t-test)
Since we are only interested in determining if there exists a significant difference between the
two groups, a two-tailed paired t-test will be conducted. A paired t-test compares the means of
two sets of data. The differences are hypothesized to be zero i.e. there is no difference
between the means of the two groups. This null hypothesis is rejected if the corresponding p-
values for the computed t-values are greater than the critical p-values at the chosen level of
alpha.
The results from the control group are compared with the test group. Results of the
paired t-test are summarized in the following table:
Table 6. Summary of computed values for the t-test
Variable Run 1 Run 2 Run 3
T. S. R. S. T. S. R. S. T. S. R. S.
Mean (of differences)
-0.18 -0.06 0.43 0.29 -0.07 0.32
t-value -0.9199 -0.2040 0.9447 0.4157 -0.2992 0.8673
p-value 0.3882 0.8441 0.3763 0.6901 0.7734 0.4145
Threshold
p-value
α = 0.05
2.365 2.365 2.365 2.365 2.365 2.365
Notes: T.S. – Travel Speed;

Philippine Transportation Journal Vol. 2, No. 2
November 2019 82
R.S. – Running Speed
The computed p-values for all runs are less than the critical p-values, thus, the null
hypothesis is accepted, and we can conclude that there is no difference between the results
obtained from both methods.
Wilcoxon Signed-Rank Test
An additional test is conducted to assess the validity of the obtained results. The Wilcoxon
signed-rank test is a non-parametric alternative to the paired t-test. This check is conducted as
the Shapiro-Wilk test for normality, despite being the most powerful test for normality, is still
noted to have low power for small sample sizes (Razali & Wah, 2011).
The null hypothesis of the Wilcoxon Signed-Rank test assumes that the differences in
the population median is zero (i.e. two groups are the same). The null hypothesis is rejected if
the computed values for T is less than the critical value at the chosen alpha level. Table 7
summarizes the values computed for this test.
Table 7. Summary of computed values for the Wilcoxon Signed-Rank Test
Variable Run 1 Run 2 Run 3
T. S. R. S. T. S. R. S. T. S. R. S.
n 7 7 6 8 6 6
W+ 19 15 15 24 11 6
W- 9 13 6 12 10 15
T
(min {W+, W-}) 9 13 6 12 10 6
Tcritical
α = 0.05 2 2 0 3 0 0
Notes: T.S. – Travel Speed;
R.S. – Running Speed
The computed T-values for all runs are greater than the critical T-values at the 95%
confidence level. The null hypothesis is accepted and reinforces the results of the t-test that
there is no significant difference between results obtained from the control (manual) and test
(proposed) methods.
5. CONCLUSIONS AND RECOMMENDATIONS
Results of the limited tests conducted establish the validity of the proposed data collection
method. Both statistical tests confirm that the proposed method performs equally well as the
traditional manual method for collecting travel time and delay data.
The camera-aided method presents a simple, efficient, and affordable means of
collecting travel time and delay and passenger load data in low-capacity public transportation
vehicles without compromising occupancy and boarding/alighting data. The method also
reduces the data collection process to office work, cutting manpower requirements, and
minimizing exposure to work hazards on-field. Aside from this, it also enables researchers to
review and double-check collected information by accessing the stored files, reducing human
errors and providing a means to rectify any errors that may arise during the data processing
stage.
Data storage limitations pose to be one of the main drawbacks of the method. This can
be avoided by selecting a higher-capacity camera, or by modifying the equipment to store

Philippine Transportation Journal Vol. 2, No. 2
November 2019 83
additional information to an external high-capacity storage device such as an external memory
drive. Another workaround would be to instruct the drivers to replace the memory cards in the
device; however, in order for this approach to work, the drivers might have to be minimally
compensated for their involvement in the data collection efforts.
The method was developed to collect data on paratransit services by demonstrating its
feasibility on UV Express Transit Services. The concept can be readily applied to collect
information on public transportation modes that are compatible with the device. The method
could be used to collect travel time, delay, and passenger load information for the assessment
of the new jeepney units rolled out for the jeepney modernization program.
Further tests using GPS-equipped dual dash cameras are recommended. Although these
additional features would translate to additional costs, it would also increase efficiency by
automating the travel time data collection, leaving the dash cam footage for use in
identification of causes of delay, and as back-up data for areas where the GPS receivers might
perform poorly (e.g. under flyovers and dense trees, and between high-rise buildings).
The automation potential of the method would also be an interesting thing to explore.
Vision-based object detection and object-counting technologies currently used in traffic
volume counts could improve the efficiency of data encoding particularly for boarding and
alighting counts, and eliminate the need for manual encoding. Data privacy issues could also
be addressed with the use of identity masking or data hiding schemes in these vision-based
technologies.
Below is an updated table of comparison of test vehicle techniques, including the
proposed camera-aided method.
Table 8. Comparison of Camera-Aided Method with other
Test Vehicle Travel Time Data Collection Techniques [Table 1]
Instrumentation
Level
Costs Skill Level Level of
Data
Detail
Data
Accuracy
Automation
Potential Capital Data
Collection
Data
Reduction
Data
Collection
Data
Reduction
Manual - Pen & Paper Low Moderate High Low Moderate Low Low Low
Tape Recorder Low Low High Low Moderate Low Low Low
Camera-Aided Moderate Low High Moderate Moderate High Moderate High
Portable Computer Moderate Low Moderate Moderate Moderate Low Moderate Moderate
Distance Measuring
Instrument (DMI) High Low Low Moderate Low High Moderate High
Global Positioning
System (GPS) High Low Moderate Moderate High High High High
ACKNOWLEDGEMENTS
This work is supported by the Department of Science and Technology’s Engineering Research
and Development for Technology (DOST ERDT) program.
REFERENCES
Belliss, G. (2004). Detailed Speed and Travel Time Surveys using Low Cost GPS
Equipment. IPENZ Transportation Group Technical Conference 2004. St James Theatre,
Wellington, NZ.
Cervero, R., Golub, A. (2007). Informal Transport: A Global Perspective. Transport

Philippine Transportation Journal Vol. 2, No. 2
November 2019 84
Policy. 14. pp 445-457
Department of Transportation (2017, October). Route Planning. Local Public Transport
Route Plan Manual, 29-30
Faghri, A. et. al. (2014). Evaluation of the Accuracy and Automation of Travel Time and
Delay Data Collection Methods. Journal of Transportation Technologies. 2014, 4, 72-
83
Hess, B. F. et. al. (2012). Evaluation of Fine-Granular GPS Tracking on Smartphones.
Proceedings of the first ACM SIGSPATIAL International Workshop on Mobile
Geographic Information Systems. Redondo Beach, CA.
Godard, X. (2013). Comparisons of urban transport sustainability: Lessons from West and
North Africa. Research in Transportation Economics. 40. pp 96-103
Li, M. et. al. (2013). Evaluation of Travel Time Data Collection Techniques: A Statistical
Analysis. International Journal of Traffic and Transportation Engineering. 2013, 2(6):
149-158
Mathew, T. V. (2014). Travel Time Data Collection [Lecture Notes]. Transportation
Systems Engineering. Indian Institute of Technology Bombay, Mumbai, India.
Phun, V. K., Kato, H., Chalermpong, S. (2019). Paratransit as a connective mode for mass
transit systems in Asian developing cities: Case of Bangkok in the era of ride-hailing
services. Transport Policy 75. pp 27-35
Phun, V. K., Yai, T. (2016). State of the Art Paratransit Literatures in Asian Developing
Countries. Asian Transport Studies. Vol. 4, Issue I, pp 55-77
Razali, N. M., Wah, Y. B. (2011). Power Comparisons of Shapiro-Wilk, Kolmogorov-
Smirnov, Lilliefors and Anderson-Darling Tests. Journal for Statistical Modelling and
Analytics, Vol. 2 No. 1, 21-33
Turner, S. M. (1998). Overview of Techniques. Travel Time and Data Collection
Handbook. Texas: Federal Highway Administration, U.S. Department of Transportation.
Various (2013) Boarding and Alighting Surveys. Data Collection and Analysis for Public
Transport. WRI India Sustainable Cities.
Various (1998). TCRP Synthesis 29: Passenger Counting Technologies and Procedures.
Transport Cooperative Research Program, Transportation Research Board, Federal
Transit Administration
Vergel, K. N. (2016). Travel Time and Delay [PowerPoint Lecture]. Transportation and
Traffic Surveys Course Notes. University of the Philippines – Diliman, Quezon City,
Philippines. CE 246.
Wicaksono et al, (2015). Road-based Urban Public Transport and Paratransit in Six Asian
Countries: Legal Conditions and Intermodal Issues. Journal of Eastern Asia Society for
transportation Studies, Vol. 11, pp 227-242