CAMBRIDGE OFFICE & LAB MARKET REPORT - LPC …€¦ · CAMBRIDGE OFFICE & LAB MARKET REPORT SECOND...
16
CAMBRIDGE OFFICE & LAB MARKET REPORT SECOND QUARTER 2017
-
Upload
truongkhanh -
Category
Documents
-
view
212 -
download
0
Transcript of CAMBRIDGE OFFICE & LAB MARKET REPORT - LPC …€¦ · CAMBRIDGE OFFICE & LAB MARKET REPORT SECOND...

CAMBRIDGE OFFICE & LAB MARKET REPORT
SECOND QUARTER 2017

As Greater Boston’s global gateway market, Cambridge is a hub for intellectual capital, innovative minds and technological advancements. The Cambridge market has experienced plunging off ice & lab vacancy rates and rapidly growing rents which make the market one of the world’s premier locations. In fact, vacancy rates are becoming diff icult to track because available space is quickly absorbed and rarely hits the market before being committed by a new tenant.
Demand is largely coming from the expansion of existing tenants, the inward migration from out-of-market users and the explosive growth of the life science industry. The life science sector now constitutes roughly 70% of total demand and has become the most formidable market force, par ticularly within the lab sector. Looking forward, Cambridge’s future remains extremely bright with the high concentration of intellectual and investment capital keeping the market fueled and extreme land constraints placing an upper bound on future development.
MAY MASSACHUSETTS UNEMPLOYMENT
# 4.2%JUNE NATIONAL UNEMPLOYMENT
$4.0%ANNUAL
WAGE GROWTH
# 2.9%HIGHEST GDP
PER CAPITA NATIONALLY
4th
WHITE HOT MARKET TO OPEN SUMMER

MARKET TRENDS
$24.00
$30.00
$36.00
$42.00
$48.00
$54.00
$60.00
$66.00
$72.00
Average Asking Rate
20172016201520142013201220112010200920082007200620050%
3%
6%
9%
12%
15%
18%
21%
24%
Direct Vacancy (%)
$15.00
$20.00
$25.00
$30.00
$35.00
$40.00
$45.00
$50.00
$55.00
Average Asking Rate
20172016201520142013201220112010200920082007200620050%
2%
4%
6%
8%
10%
12%
14%
16%
Direct Vacancy (%)
OFFICE CLASS A - ASKING RATE VS. DIRECT VACANCY
OFFICE CLASS B - ASKING RATE VS. DIRECT VACANCY
BOSTON 10TH LARGEST METROFaster population growth than New York & San Francisco
VACANCY INCHES UP TO 1.6%Strong demand across all submarkets & sectors
ASKING RATES RISE AGAINDemand continued out-pacing supply, modern space rules
LIFE SCIENCE SECTION SURGESNow represents over 70% of R&D demand
CREATIVE OFFICEOpen layouts, contemporary and collaborative environments
WHERE IS THE RELIEF?Small and medium size users face historic competition
INVESTMENT SALES ARE HOTNew landlords are paying record pricing
Average Asking Rate Direct Vacancy
Average Asking Rate Direct Vacancy

DIRECT VACANCY RATE BY SUBMARKET
0.0% 0.5% 1.0% 1.5% 2.0% 2.5% 3.0%
West - Lab
East - Lab
East - Office
Mid - Office
Mid - Lab
West - Office
None
None

VACANCY
1.6%
CAMBRIDGE STATS AT A GLANCE
SUBLEASE
4.3%
▼ ABSORPTION
26,500 sf
▼ASKING RATE
$65.35/sf▼$44.88/SF
WEST CAMBRIDGE
$59.69/SF
MID CAMBRIDGE
$75.73/SF
EAST CAMBRIDGE
Office
$55.24/SF NNN
Lab
Office
$76.08/SF NNN
Lab
Office
$75.77/SF NNN
Lab
AVAILABILITY
8.8%
CONSTRUCTION
980,000 sf
▼
▼
▼

CLASS A & B OFFICE

#1.6% DIRECT VACANCY
#4.3% SUBLEASE AVAILABILITY
#8.8% TOTAL AVAILABILITY
#26,500 SF 12-MONTH ABSORPTION
#$65.35/SF AVERAGE ASKING RATE
• With rents in the mid to high $60’s on average and vacancy below 2.0% the Cambridge office market has become prohibitively difficult to enter and maintain a presence. The Kendall Square and Massachusetts Avenue corridor have become saturated with big life science and pharma tenants. On the flip side, many small start-ups and incubators are struggling to maintain Cambridge locations and are frequently pursuing periphery urban technology hubs like Somerville, Watertown and Brighton as lower cost alternatives.
• The East Cambridge office market recorded a quiet first quarter with several tenants renewing including CSP Associates at 55 Cambridge Parkway for 8,000 SF. There were few significant expansions observed beyond HubSpot who committed to additional square footage at One Canal. The overall lack of availability across East Cambridge has tempered absorption figures over the past 18-24 months however the market remains extremely strong.
• In the heart of Central Square at 625 Massachusetts Avenue, Harvard University signed a long term extension for 35,600 square feet. Across the street at 485 Massachusetts Avenue, Digital Ocean committed to 7,000 square feet. Within this stretch of Massachusetts Avenue between MIT and Harvard Square, the tenant base has become increasingly institutional quality which has pushed start-ups and the like west & north.
• Over the past 36 months, the West Cambridge submarket has dramatically transformed following the addition of new residential, retail and lifestyle amenities along Cambridgepark Drive. Following an extensive marketing and competitive bidding process Morgan Stanley has emerged as the street’s largest landlord following the acquisition of 100, 125 & 150 Cambridgepark Drive in two separate transactions. With an average purchase price of $444 PSF the new benchmark has been set for the West Cambridge neighborhood.

ADDRESS SUBMARKET TENANT SF
625 Massachusetts Avenue Mid Cambridge Harvard University 35,600
One Canal Park East Cambridge Hub Spot 25,300
125 CambridgePark Drive West Cambridge TriNetX 19,800
150 CambridgePark Drive West Cambridge NuoDB 10,800
55 Cambridge Parkway East Cambridge CSP Associates 8,000
485 Massachusetts Avenue Mid Cambridge Digital Ocean 7,000
NOTABLE QUARTERLY LEASES
CLASS A & B OFFICE
$26.00
$31.00
$36.00
$41.00
$46.00
$51.00
$56.00
$61.00
$66.00
$71.00
$76.00
201720162015201420132012201120102009200820070.0%
2.0%
4.0%
6.0%
8.0%
10.0%
12.0%
14.0%
16.0%
18.0%
20.0%
20172016201520142013201220112010200920082007
AVERAGE DIRECT VACANCY BY SUBMARKET
AVERAGE ASKING RATE BY SUBMARKET
West Mid East

1000 Massachusetts Avenue$69,500,000 ($644/RSF)Buyer: International RE
100 Cambridgepark Drive$60,200,000 ($445/RSF)
Buyer: Longfellow & Morgan Stanley
RECENT OFFICE INVESTMENT
SALES100 Cambridgepark Drive
1000 Massachusetts Ave
955 Massachusetts Avenue$66,000,000 ($734/RSF)
Buyer: DivcoWest
125/150 Cambridgepark Drive$210,000,000 ($443/RSF)
Buyer: Longfellow & Morgan Stanley
125/150 Cambridgepark Drive
955 Massachusetts Ave

CLASS A & B LAB

#0.7% DIRECT VACANCY
$2.3% SUBLEASE AVAILABILITY
$4.8% TOTAL AVAILABILITY
$ (65,000) SF 12-MONTH ABSORPTION
#$74.90/SF AVERAGE ASKING RATE
• The Cambridge lab market has become some of the world’s most sought real estate from both tenants and landlords alike. With a barely measurable vacancy rate below 1.0%, market rents and investment sale pricing are pushing historically high. The life science sector now constitutes roughly 70% of total demand with major pharma users driving demand through rapid expansion. Most significantly over the past six months, Johnson & Johnson, AbbVie, Shire, Lilly & Novartis have all either committed to large expansions or been actively engaged in lease negotiations.
• Following Novartis’ 302,600 square foot renewal at 100 & 200 Technology Square last quarter, Ironwood Pharmaceuticals renewed its lease at 301 Binney Street securing its 223,000 square foot operation for the long term. It is also widely rumored that Shire Pharmaceuticals, as part of their efforts to consolidate exclusively to Cambridge and Lexington, will take approximately 230,000 square feet at 125 Binney Street.
• Also in East Cambridge, Blueprint Medicines has leased 100,000 square feet at 45 Sidney Street while co-working lab environment, Lab Central, secured 42,000 square feet at 700 Main Street. The shared working space has become increasingly popular with asking rates soaring and start ups finding it difficult to secure space within Kendall Square.
• Looking forward expect the market to continue performing at an efficient clip, however with several new lab developments scheduled to open over the next 3-5 years, rent growth will be less explosive because the increased supply will offset demand. Development projects to recently break ground include: Alexandria’s new 170,000 SF life science building at 399 Binney Street, the Davis Companies’ 220,000 square foot redevelopment of 35 Cambridgepark Drive and Northpoint’s 250 North Street which is currently slated as a 430,000 square foot versatile office & lab building.

ADDRESS SUBMARKET TENANT SF
100 & 200 Technology East Cambridge Novartis 302,600
301 Binney Street East Cambridge Ironwood Pharmaceuticals 223,000
45 Sidney Street East Cambridge Blueprint Medicines 100,000
26 Landsdowne Street East Cambridge Takeda Pharmaceuticals 100,000
700 Main Street East Cambridge Lab Central 42,000
200 CambridgePark Drive West Cambridge Celgene 39,100
NOTABLE QUARTERLY LEASES
CLASS A & B LAB
0.0%
2.0%
4.0%
6.0%
8.0%
10.0%
12.0%
14.0%
16.0%
18.0%
20.0%
2017201620152014201320122011201020092008
AVERAGE DIRECT VACANCY BY SUBMARKET
AVERAGE ASKING RATE BY SUBMARKET
West Mid East
$26.00
$31.00
$36.00
$41.00
$46.00
$51.00
$56.00
$61.00
$66.00
$71.00
$76.00
2017201620152014201320122011201020092008
One Kendall Square$750,000,000 ($1,125/RSF)
Buyer: Alexandria RE
245 First Street$311,250,000 ($1,020/RSF)
Buyer: Clarion Partners
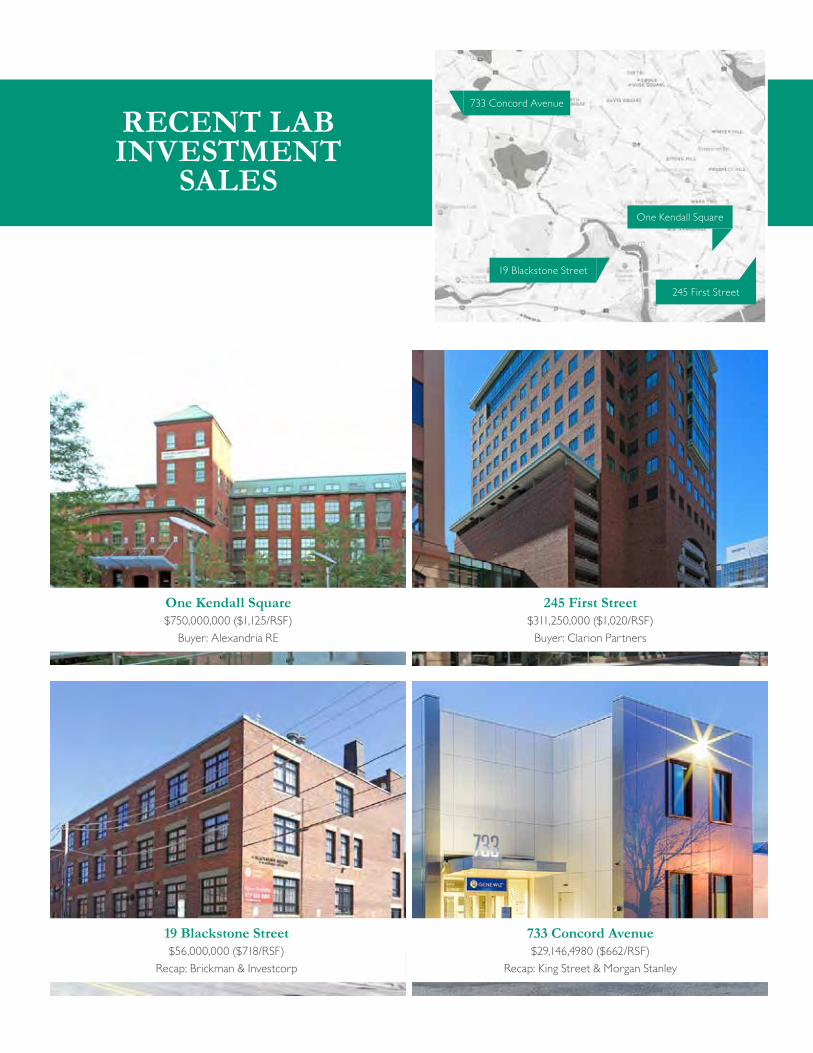
RECENT LAB INVESTMENT
SALESOne Kendall Square
245 First Street
19 Blackstone Street$56,000,000 ($718/RSF)
Recap: Brickman & Investcorp
733 Concord Avenue$29,146,4980 ($662/RSF)
Recap: King Street & Morgan Stanley
19 Blackstone Street
733 Concord Avenue

C O N F I D E N T I A L O F F E R I N G M E M O R A N D U M / / S E C T I O N iii
O P P O R T U N I T Y. . . .
OFFICE & LAB REPORT STATS

Office Total Inventory (SF)
Direct Vacancy
Sublease Availability
Total Availability
QuarterlyAbsorption (SF)
12 MonthAbsorption (SF)
Average Asking Rate
TOTAL A & B
Cambridge 10,809,900 1.6% 4.3% 8.8% (8,750) 26,450 $65.35
East Cambridge 5,668,350 1.1% 3.1% 7.5% 16,850 26,100 $75.73
Mid Cambridge 3,135,700 1.3% 1.8% 5.2% 600 24,250 $59.69
West Cambridge 2,005,800 3.0% 11.4% 17.9% (26,200) (23,850) $44.88
CLASS A
Cambridge 6,977,450 2.0% 5.7% 10.7% (30,250) (39,200) $70.99
East Cambridge 4,649,500 1.3% 3.8% 7.1% 8,600 23,950 $77.03
Mid Cambridge 1,224,500 2.5% 2.0% 9.6% (13,700) (30,500) $68.25
West Cambridge 1,103,450 4.1% 18.2% 27.4% (25,150) (32,650) $48.56
CLASS B
Cambridge 3,832,400 0.8% 1.6% 5.1% 21,500 65,650 $55.10
East Cambridge 1,018,850 0.5% 0.0% 9.3% 8,200 2,100 $69.81
Mid Cambridge 1,911,200 0.6% 1.7% 2.4% 14,350 54,750 $54.20
West Cambridge 902,350 1.7% 3.1% 6.3% (1,050) 8,750 $40.38
Lab Total Inventory (SF)
Direct Vacancy
Sublease Availability
Total Availability
QuarterlyAbsorption (SF)
12 MonthAbsorption (SF)
Average Asking Rate
TOTAL A & B
Cambridge 14,109,500 0.7% 2.3% 4.8% (21,500) (65,600) $74.90
East Cambridge 9,107,700 0.0% 1.4% 2.5% 2,900 4,150 $75.77
Mid Cambridge 4,336,800 2.3% 4.5% 9.3% (24,350) (69,700) $76.08
West Cambridge 665,000 0.0% 0.0% 6.2% - - $55.24
CLASS A
Cambridge 11,621,400 0.0% 2.7% 4.5% 2,900 4,150 $76.32
East Cambridge 8,452,750 0.0% 1.5% 2.7% 2,900 4,150 $75.81
Mid Cambridge 3,039,550 0.0% 6.0% 9.6% - - $78.25
West Cambridge 129,100 0.0% 0.0% 0.0% - - $64.00
CLASS B
Cambridge 2,488,100 4.0% 0.5% 6.2% (24,400) (69,700) $68.27
East Cambridge 654,950 0.0% 0.0% 0.0% - - $75.25
Mid Cambridge 1,297,250 7.7% 0.9% 8.6% (24,400) (69,700) $71.00
West Cambridge 535,900 0.0% 0.0% 7.7% - - $53.13

Lincoln Property Company | 53 State Street, 8th Floor, Boston, MA | 617.951.4100 | LPCBoston.com
ETHAN ROBERT
Director of Research
O: 617.951.4160
Lincoln Property Company’s Boston Office Report is produced by the Boston Office’s research team in collaboration with our Urban Brokerage Group. If you have any questions regarding market conditions and the information found in this report, please contact Ethan Robert.

![Cambridge Auto ID Lab 04 2012 - GS1 · Cambridge Auto ID Lab Overview Professor Duncan McFarlane [Research Director] ... Bespak, Exxon Mobil, Sony, Mazak . Recent Industrial Collaborators](https://static.fdocuments.us/doc/165x107/5f0c7ac67e708231d4359c3c/cambridge-auto-id-lab-04-2012-gs1-cambridge-auto-id-lab-overview-professor-duncan.jpg)