
Cambridge International Examinations Cambridge ... UCLES 2017 0610/61/O/N/17 (iii) State the purpose...
12
This document consists of 9 printed pages and 3 blank pages. DC (NF/SG) 133515/4 © UCLES 2017 [Turn over Cambridge International Examinations Cambridge International General Certificate of Secondary Education *4672819309* BIOLOGY 0610/61 Paper 6 Alternative to Practical October/November 2017 1 hour Candidates answer on the Question Paper. No Additional Materials are required. READ THESE INSTRUCTIONS FIRST Write your Centre number, candidate number and name on all the work you hand in. Write in dark blue or black pen. You may use an HB pencil for any diagrams or graphs. Do not use staples, paper clips, glue or correction fluid. DO NOT WRITE IN ANY BARCODES. Answer all questions. Electronic calculators may be used. You may lose marks if you do not show your working or if you do not use appropriate units. At the end of the examination, fasten all your work securely together. The number of marks is given in brackets [ ] at the end of each question or part question. This syllabus is approved for use in England, Wales and Northern Ireland as a Cambridge International Level 1/Level 2 Certificate.
Transcript of Cambridge International Examinations Cambridge ... UCLES 2017 0610/61/O/N/17 (iii) State the purpose...

This document consists of 9 printed pages and 3 blank pages.
DC (NF/SG) 133515/4© UCLES 2017 [Turn over
Cambridge International ExaminationsCambridge International General Certificate of Secondary Education
*4672819309*
BIOLOGY 0610/61Paper 6 Alternative to Practical October/November 2017 1 hourCandidates answer on the Question Paper.No Additional Materials are required.
READ THESE INSTRUCTIONS FIRST
Write your Centre number, candidate number and name on all the work you hand in.Write in dark blue or black pen.You may use an HB pencil for any diagrams or graphs.Do not use staples, paper clips, glue or correction fluid.DO NOT WRITE IN ANY BARCODES.
Answer all questions.
Electronic calculators may be used.You may lose marks if you do not show your working or if you do not use appropriate units.
At the end of the examination, fasten all your work securely together.The number of marks is given in brackets [ ] at the end of each question or part question.
This syllabus is approved for use in England, Wales and Northern Ireland as a Cambridge International Level 1/Level 2 Certificate.

2
0610/61/O/N/17© UCLES 2017
1 Fruits such as apples and bananas contain chemicals called polyphenols. An enzyme, polyphenol oxidase, is also present. It catalyses a reaction which converts the polyphenols into brown‑coloured compounds.
This reaction happens when the cells are damaged and exposed to oxygen in the air.
polyphenols + oxygen polyphenol oxidase
brown‑coloured compounds
Some students investigated the effect of pH on the enzyme polyphenol oxidase in apples.
The students were provided with one apple, distilled water and four solutions labelled B, C, D and E. Each solution had a different pH.
Step 1 Five Petri dishes were labelled A, B, C, D and E.
Step 2 20 cm3 of distilled water was added to Petri dish A.
Step 3 20 cm3 of solution B was poured into the Petri dish labelled B.
Step 4 Step 3 was repeated using solutions C, D and E and the Petri dishes labelled C, D and E.
Step 5 Universal Indicator paper and a pH colour chart were used to find the pH of each of the solutions in the five Petri dishes.
Step 6 Six slices were cut from an apple and put on to separate white tiles. The apple slices were cut to approximately the same size.
Step 7 Each apple slice was chopped into small pieces and then crushed with a spatula.
Step 8 One of the crushed apple slices was put into each of the solutions in Petri dishes A, B, C, D and E. A lid was put on to each of the Petri dishes and they were left for two minutes.
Step 9 The crushed apple from the remaining slice was left uncovered, on the white tile and was labelled control.
Step 10 The lid of Petri dish A was removed and the liquid was poured away, leaving only the crushed apple in the Petri dish. The Petri dish lid was not replaced.
Step 11 Step 10 was repeated for Petri dishes B, C, D and E.
Step 12 The students looked at the colour of the crushed apple slice in each Petri dish at 0 minutes, 10 minutes and 20 minutes.
The students used the key shown in Table 1.1 to identify the colour intensity value for each crushed apple slice.
Table 1.1
colour of the crushed apple slice
no brown colour light brown dark brown
colour intensity value 1 2 3

3
0610/61/O/N/17© UCLES 2017 [Turn over
Fig.1.1showsthestudents’results.
A B C
C
C
D
D
D
E
E
E
B
B
A
A
control
control
control
0 min
10 min
20 min
pH 7 pH 2 pH 3 pH 8 pH 9
crushedapple
Fig. 1.1
(a) (i) Prepare a table to record the results.
Your table should include:• the colour intensity value for the crushed apple slices• the pH of each solution.
[5]
(ii) List the pH values from the most effective to the least effective in preventing the browning of the apple.
...................................................................................................................................... [1]

4
0610/61/O/N/17© UCLES 2017
(iii) State the purpose of the control set up in step 9.
...........................................................................................................................................
...........................................................................................................................................
...................................................................................................................................... [1]
Table 1.2 shows the pH of some household products.
Table 1.2
household product
olive oil lemon juice
milk water salt water baking soda
pH no value 2.0 6.6 7.0 7.6 9.0
(iv) Suggest which of the household products in Table 1.2 should be used to prevent cut apples from going brown. Explain your choice.
household product .............................................................................................................
explanation ........................................................................................................................
...........................................................................................................................................[2]
(b) (i) State one variable that was kept constant in the investigation described.
Describe how this variable was kept constant.
variable ..............................................................................................................................
how it was kept constant ...................................................................................................
...........................................................................................................................................[2]
(ii) Explain why the lids were not put back on to the Petri dishes after the solutions were poured away in steps 10 and 11.
...........................................................................................................................................
...........................................................................................................................................
...................................................................................................................................... [1]
(iii) State the main hazard in steps 6 and 7 and describe how to reduce the risk of this hazard.
...........................................................................................................................................
...........................................................................................................................................
...................................................................................................................................... [1]

5
0610/61/O/N/17© UCLES 2017 [Turn over
(c) Explain why the method used to find the colour intensity value for the crushed apple slices in step 12 is a source of error.
...................................................................................................................................................
...................................................................................................................................................
.............................................................................................................................................. [1]
(d) Identify one source of error in steps 6, 7 or 8 and suggest an improvement for this error.
source of error ..........................................................................................................................
...................................................................................................................................................
improvement .............................................................................................................................
...................................................................................................................................................
...................................................................................................................................................[2]
(e) The enzyme polyphenol oxidase and the substrate polyphenol can be extracted from crushed apples. The substrate turns brown when the enzyme is present.
Some students were provided with extracts of the enzyme and the substrate.
Describe a method the students could use to find the optimum temperature of the enzyme.
...................................................................................................................................................
...................................................................................................................................................
...................................................................................................................................................
...................................................................................................................................................
...................................................................................................................................................
...................................................................................................................................................
...................................................................................................................................................
...................................................................................................................................................
...................................................................................................................................................
...................................................................................................................................................
...................................................................................................................................................
...................................................................................................................................................
.............................................................................................................................................. [6]
6
0610/61/O/N/17© UCLES 2017
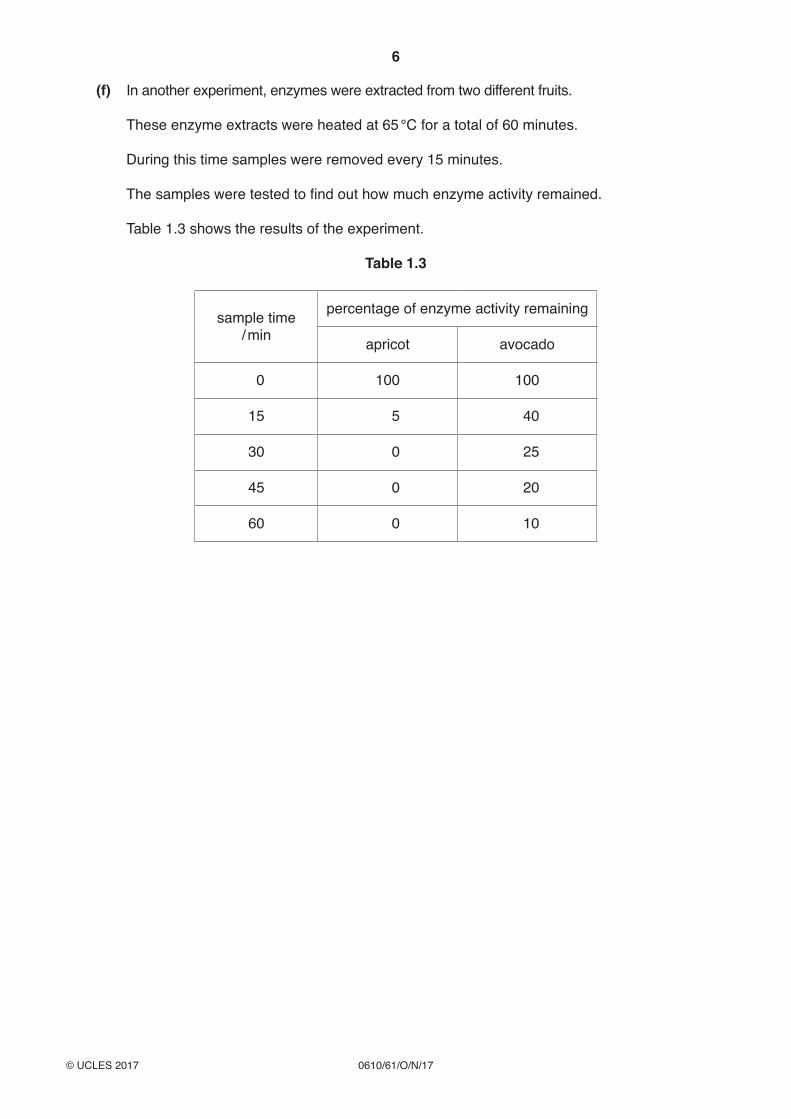
(f) In another experiment, enzymes were extracted from two different fruits.
These enzyme extracts were heated at 65 °C for a total of 60 minutes.
During this time samples were removed every 15 minutes.
The samples were tested to find out how much enzyme activity remained.
Table 1.3 shows the results of the experiment.
Table 1.3
sample time / min
percentage of enzyme activity remaining
apricot avocado
0 100 100
15 5 40
30 0 25
45 0 20
60 0 10

7
0610/61/O/N/17© UCLES 2017 [Turn over
(i) Plot a line graph on the grid of enzyme activity against sample time.
You should plot the data for the apricot and for the avocado.
[5]
(ii) State a conclusion for these results.
...........................................................................................................................................
...........................................................................................................................................
.......................................................................................................................................[1]
[Total: 28]

8
0610/61/O/N/17© UCLES 2017
2 Fig. 2.1 is a photomicrograph of some blood cells.
phagocytes
nuclei
lymphocyte
red blood cells
magnification ×1500
Fig. 2.1
(a) (i) State two visible differences between the red blood cells and the white blood cells (phagocytes and lymphocytes) in Fig. 2.1.
1 .......................................................................................................................................
...........................................................................................................................................
2 .......................................................................................................................................
...........................................................................................................................................[2]
(ii) Make a large drawing of the two cells labelled phagocytes in Fig. 2.1.
[4]

9
0610/61/O/N/17© UCLES 2017
(b) (i) Measure the diameters of the three marked blood cells, along both the lines drawn on each of the cells, in Fig. 2.1. Record these measurements in Table 2.1.
Add the missing units to Table 2.1.
Calculate the average diameter for each type of blood cell and write your results in Table 2.1.
Table 2.1
type of blood celldiameter 1
/ ...............
diameter 2
/ ...............
average diameter
/ ...............
red blood cell
lymphocyte
phagocyte
[3]
(ii) Calculate the actual average diameter of the red blood cell using your answer in 2(b)(i) and the following equation.
magnification = average diameter of the red blood cell in Fig. 2.1actual average diameter of the red blood cell
Give your answer in micrometres (μm) to the nearest whole number. 1 mm = 1000 μm
Show your working.
...........................................................μm[3]
[Total: 12]

10
0610/61/O/N/17© UCLES 2017
BLANK PAGE

11
0610/61/O/N/17© UCLES 2017
BLANK PAGE

12
0610/61/O/N/17© UCLES 2017
BLANK PAGE
Permission to reproduce items where third‑party owned material protected by copyright is included has been sought and cleared where possible. Every reasonable effort has been made by the publisher (UCLES) to trace copyright holders, but if any items requiring clearance have unwittingly been included, the publisher will be pleased to make amends at the earliest possible opportunity.
To avoid the issue of disclosure of answer‑related information to candidates, all copyright acknowledgements are reproduced online in the Cambridge International Examinations Copyright Acknowledgements Booklet. This is produced for each series of examinations and is freely available to download at www.cie.org.uk after the live examination series.
Cambridge International Examinations is part of the Cambridge Assessment Group. Cambridge Assessment is the brand name of University of Cambridge Local Examinations Syndicate (UCLES), which is itself a department of the University of Cambridge.


![Cambridge International Examinations Cambridge ... (0610)/0610_w18_qp_32.pdf · process description [5] [Total: 5] 4 UCLES 2018 0610/32/O/N/18 2 Some students investigated the conditions](https://static.fdocuments.us/doc/165x107/5e736c44eafeb602306a1b01/cambridge-international-examinations-cambridge-06100610w18qp32pdf-process.jpg)


![Cambridge Assessment International Education Cambridge ... (0610)/0610_s19_qp_32.… · • phloem • xylem. [3] 7 UCLES ... Modern technology has increased food production. The](https://static.fdocuments.us/doc/165x107/5e9d2fe73ca6265cef2f810f/cambridge-assessment-international-education-cambridge-06100610s19qp32.jpg)

