Caltrans Smart Mobility Preliminary Investigation 3-21-13
55
Preliminary Investigation Caltrans Division of Research and Innovation Produced by CTC & Associates LLC Sustainability Tools and Practices: An Examination of Selected State Departments of Transportation, California Metropolitan Planning Organizations and National Tools Requested by Christine Ratekin, Senior Transportation Planner, Caltrans Division of Transportation Planning March 22, 2013 The Caltrans Division of Research and Innovation (DRI) receives and evaluates numerous research problem statements for funding every year. DRI conducts Preliminary Investigations on these problem statements to better scope and prioritize the proposed research in light of existing credible work on the topics nationally and internationally. Online and print sources for Preliminary Investigations include the National Cooperative Highway Research Program (NCHRP) and other Transportation Research Board (TRB) programs, the American Association of State Highway and Transportation Officials (AASHTO), the research and practices of other transportation agencies, and related academic and industry research. The views and conclusions in cited works, while generally peer reviewed or published by authoritative sources, may not be accepted without qualification by all experts in the field. Executive Summary Background Caltrans’ groundbreaking report, Smart Mobility 2010: A Call to Action for the New Decade, laid out a vision for developing a new approach to transportation that is multimodal, sustainable and integrated with land use. As part of its continuing preparation for implementing the Smart Mobility Framework, Caltrans is interested in identifying the sustainability tools, research, guidance and best practices that have been developed or initiated since the January 2010 publication of Smart Mobility 2010. To aid in this effort, two previous Preliminary Investigations examined federal, state and regional activities to assess the current state of the practice of sustainability-oriented planning and performance measurement. • An April 2012 Preliminary Investigation “Smart Mobility: A Survey of Current Practice and Related Research ” reviewed sustainability tools and practices in development or in use by transportation agencies across the country. • A follow-up investigation sought in-depth information about sustainability tools and practices from 30 transportation agencies throughout California and the nation. A November 2012 report presented the responses of six transportation agencies to a 10-question survey about sustainability practices. The limited survey response presented in the November 2012 report prompted the current review of sustainability tools and practices in use by selected state departments of transportation (DOTs) and metropolitan planning organizations in California. For the current report, we sought to identify how well the agencies’ sustainability tools are performing and garner any lessons learned from initial implementation. We also examined two sustainability tools developed by national transportation organizations.
Transcript of Caltrans Smart Mobility Preliminary Investigation 3-21-13

Preliminary Investigation Caltrans Division of Research and Innovation Produced by CTC & Associates LLC
Sustainability Tools and Practices: An Examination of Selected State Departments of Transportation, California Metropolitan
Planning Organizations and National Tools
Requested by Christine Ratekin, Senior Transportation Planner, Caltrans Division of Transportation Planning
March 22, 2013
The Caltrans Division of Research and Innovation (DRI) receives and evaluates numerous research problem statements for funding every year. DRI conducts Preliminary Investigations on these problem statements to better scope and prioritize the proposed research in light of existing credible work on the topics nationally and internationally. Online and print sources for Preliminary Investigations include the National Cooperative Highway Research Program (NCHRP) and other Transportation Research Board (TRB) programs, the American Association of State Highway and Transportation Officials (AASHTO), the research and practices of other transportation agencies, and related academic and industry research. The views and conclusions in cited works, while generally peer reviewed or published by authoritative sources, may not be accepted without qualification by all experts in the field.
Executive Summary
Background Caltrans’ groundbreaking report, Smart Mobility 2010: A Call to Action for the New Decade, laid out a vision for developing a new approach to transportation that is multimodal, sustainable and integrated with land use. As part of its continuing preparation for implementing the Smart Mobility Framework, Caltrans is interested in identifying the sustainability tools, research, guidance and best practices that have been developed or initiated since the January 2010 publication of Smart Mobility 2010. To aid in this effort, two previous Preliminary Investigations examined federal, state and regional activities to assess the current state of the practice of sustainability-oriented planning and performance measurement.
• An April 2012 Preliminary Investigation “Smart Mobility: A Survey of Current Practice and Related Research” reviewed sustainability tools and practices in development or in use by transportation agencies across the country.
• A follow-up investigation sought in-depth information about sustainability tools and practices from 30 transportation agencies throughout California and the nation. A November 2012 report presented the responses of six transportation agencies to a 10-question survey about sustainability practices.
The limited survey response presented in the November 2012 report prompted the current review of sustainability tools and practices in use by selected state departments of transportation (DOTs) and metropolitan planning organizations in California. For the current report, we sought to identify how well the agencies’ sustainability tools are performing and garner any lessons learned from initial implementation. We also examined two sustainability tools developed by national transportation organizations.
Kim
Typewritten Text
Kim
Typewritten Text
Kim
Typewritten Text

2
Summary of Findings We identified a select group of state and regional transportation agencies that are known to integrate sustainability in their transportation planning or investment practices. The agencies participating in this investigation include:
State Transportation Agencies Illinois DOT North Carolina DOT Rhode Island Statewide Planning Program Texas DOT California Regional Transportation Agencies Metropolitan Transportation Commission Sacramento Area Council of Governments San Francisco County Transportation Authority Santa Cruz County Regional Transportation Commission
Two other agencies contacted in connection with this investigation—Washington State DOT and Southern California Association of Governments—elected not to participate. We used interviews to gather much of the information presented in this report. Results of these discussions are presented in six topic areas:
• Background.
• Sustainability tool description.
• Implementation process.
• Use of the sustainability tool.
• Lessons learned.
• Related documents. The table below summarizes the sustainability tools and practices highlighted in this Preliminary Investigation. A more detailed summary that describes the application and implementation of the tools and practices, and the performance measures and scoring processes used, appears on page 8 of this report.
Sustainability Tools and Practices
Agency Tool or Practice Name and Description
Illinois DOT
Illinois Livable and Sustainable Transportation (I-LAST)
A point system for evaluating the sustainable measures included in a project, I-LAST provides a comprehensive list of practices that have the potential to bring sustainable results to highway projects of all sizes and all phases of project development (planning, final design and construction).

3
Sustainability Tools and Practices
Agency Tool or Practice Name and Description
North Carolina DOT
Accountability framework
The department’s framework applies a set of seven principles and related objectives; each objective is associated with a series of performance measures. The framework identifies the actions that should be taken, with performance measures tracking performance, and strategies identifying how to alter the results on the identified metrics.
Rhode Island Statewide Planning Program
Transportation Improvement Program (TIP) scoring tool
This tool includes six categories, with each criteria category worth 20 points for a total of 120 points. Each category includes five to nine subcriteria that may be applied to individual scoring sheets used in connection with one of the 14 TIP programs.
Texas DOT
Sustainability Enhancement Tool
This user-friendly, Excel-based tool provides a platform for evaluating sustainable transportation performance measures and combining them into a final sustainability index. The tool allows for self-assessment of projects and is not used for project selection.
The tool is not currently in use by Texas DOT.
Metropolitan Transportation Commission
Performance targets and targets scoring
Two models aid in assessing sustainability: an activity-based regional travel demand model, and UrbanSim, a simulation system for supporting planning and analysis of urban development. The models help to measure the performance of different scenarios using a set of 10 performance targets.
Sacramento Area Council of Governments
Performance measures
Performance measures in four categories are used to describe differences between regional transportation investment packages. Thirty indicators and 60+ related measures are associated with land use, transportation, environmental and environmental justice objectives.
San Francisco County Transportation Authority
Scoring process
The scoring process applies at the planning and funding levels to prioritize projects based in part on performance metrics that measure success in addressing the four goals for the county’s transportation system. Results from the agency’s innovative travel demand model are used to evaluate enhancement and expansion projects for inclusion in its long-range plan.

4
Sustainability Tools and Practices
Agency Tool or Practice Name and Description
Santa Cruz County Regional Transportation Commission
Sustainable Transportation Analysis and Rating System (STARS-Plan)
The STARS approach is largely based on performance measures, with credit categories that include goals. Each goal has one or more objectives, and one or more performance measures are recommended for each objective. A backcasting process uses performance measures to identify desired outcomes and then sets associated targets.
Federal Highway Administration
Infrastructure Voluntary Evaluation Sustainability Tool (INVEST)
This Web-based collection of voluntary best practices and criteria is designed to help transportation agencies integrate sustainable practices into their projects, plans and programs. The tool includes 60 criteria organized into three modules: system planning, project development, and operations and maintenance.
State Smart Transportation Initiative
Land Use and Transportation Scenario Analysis and Microsimulation (LUTSAM)
An improvement on current four-step and advanced travel demand models, LUTSAM can be used to design new residential and commercial developments using standard GIS software and connecting the development to the existing road network to assess its impact on travel patterns.
While the agencies participating in this investigation indicated that it is premature to gauge the effectiveness of sustainability tools or practices now in use, all offered advice to other agencies considering development of similar tools or measures. The most frequently cited recommendation for other agencies wishing to establish a sustainability tool or practice is to “keep it simple.” Santa Cruz County Regional Transportation Commission further notes the importance of striking a balance between keeping the methodology simple enough to incorporate within a reasonable time frame but detailed enough to make a difference in project selection. Below we summarize some of the other advice and observations shared by the agencies interviewed for this project.
Advantages of Tools and Models • Illinois DOT. Early disagreements about some of the items included in the I-LAST tool paved
the way for agreement on the use of new practices.
• Metropolitan Transportation Commission.
o Recognize high-performing projects with the use of performance-based targets rather than more anecdotal influences.

5
o Consider developing more robust models that simulate travel behavior and can challenge assumptions.
• Rhode Island Statewide Planning Program. Scoring has been useful as a component of the overall evaluation of projects.
• San Francisco County Transportation Authority.
o A tool to quantify the assessment can be extremely helpful, providing an intuitive way for planners and others to contemplate what goes into the plan.
o Be prepared to devote the time and energy needed to develop an effective tool.
o The agency’s travel demand model provides the metrics that underlie the scoring process for many of the projects included in the regional transportation plan.
Evolution of the Tool or Practice
• Metropolitan Transportation Commission.
o Begin with a good framework to build on and think long-term. Rather than developing a tool quickly, build on data accumulated over many years.
o Be willing to invest time and resources and navigate a steep learning curve to build and implement a model or tool that will address individual travel behaviors and patterns.
• North Carolina DOT.
o Take advantage of opportunities to shift policy direction and integrate sustainability with other department initiatives.
o Embed the framework in department practices and documents.
• Sacramento Area Council of Governments. Creating a new performance measure requires a commitment of time and resources to support continued use of the measure.
• San Francisco County Transportation Authority.
o Incorporating sustainability into transportation planning is more of an art than a science; tweak the process until the results seem intuitive.
o The team cautions against taking tools or practices developed by another agency and attempting to apply them elsewhere. Each agency’s context informs how a tool develops.
o Do not lose sight of the values component, which can be more significant than a technical monetization.
• Santa Cruz County Regional Transportation Commission. Incorporating sustainability into transportation decision-making is a process to move toward. First attempts may fail to consider all relevant issues. Focus on accomplishing the things that agency resources will allow.
Public Outreach and Branding
• North Carolina DOT. Be sensitive to perceptions. Use of the term “sustainability” can be problematic with some constituencies.
6
• San Francisco County Transportation Authority.
o Incorporate a strong public outreach effort. This practice strengthened the agency’s effort, serving as one of the most effective ways to shape the plan.
o Ensure that at least some analysis has been completed before beginning a robust outreach campaign to identify the values being measured and how they should be weighted.
• Texas DOT.
o Effective marketing of a research effort like the one that developed the Sustainability Enhancement Tool is essential.
o Branding the effort is important, taking care to accurately describe the project. In Texas some were concerned that the tool under development would be used for project selection. The department was careful to describe the tool as a self-assessment technique.
Gaps in Findings While initial successes can be documented, all agencies participating in this investigation indicated that an overall assessment of the effectiveness of their tools and practices is premature. In terms of continued integration of sustainability in transportation investment decision-making, many participating agencies indicated that data availability was a limiting factor in the types of performance measures that can be developed. The agencies with well-developed travel demand models appeared to have more quantitative data available to advance the development and use of performance measures in their sustainability practices. While this report presents the experiences of eight transportation agencies in integrating sustainability into the transportation planning process, and describes a national sustainability tool freely available to any user, this sample is still relatively small. Further insights could be gathered from other transportation agencies with experience integrating sustainability at the program or project level. Next Steps Caltrans might consider the following in a continuing evaluation of best practices for the application of sustainability-oriented transportation planning and performance measurement:
• Consider the following approaches to integrating sustainability into the decision-making processes for transportation investments and identify the approach or approaches that might be the most appropriate for the Caltrans environment:
o Framework. Accountability framework (North Carolina DOT).
o Performance measures or targets. North Carolina DOT, Rhode Island Statewide Planning Program, Texas DOT, Metropolitan Transportation Commission, Sacramento Area Council of Governments, San Francisco Transportation Authority, and Santa Cruz County Regional Transportation Commission.
o Scoring process. Illinois DOT (I-LAST); Rhode Island Statewide Planning Program (TIP scoring tool); Metropolitan Transportation Commission (performance targets and targets scoring); San Francisco Transportation Authority (scoring process); and FHWA (INVEST).
o Tool. Texas DOT (Sustainability Enhancement Tool) and Santa Cruz County Regional Transportation Commission (Sustainable Transportation Analysis and Rating System [STARS-Plan]).

7
• Identify the elements of other agencies’ practices that could be transferable to a tool or practice developed by Caltrans.
• Look for patterns in the performance measures and targets associated with the participating agencies’ goals and objectives to identify a starting point for a set of measures or targets that might be used by Caltrans.
o Identify the model output and other internal data available to Caltrans that could be used to support the development of performance measures.
• Check back with the agencies participating in this investigation to identify any modifications made to the tools and practices that arise out of further experience with integrating sustainability into transportation planning.

8
Summary Descriptions of Sustainability Tools and Practices* Note: The summary table below does not include an analysis of LUTSAM given its limited applicability to the broader view of sustainability-
oriented planning and performance measurement that is the focus of this investigation.
Agency / Tool or Practice Scope of the Application Implementation Date / Types
of Uses Performance Measures / Scores Weighting of Measures
Illinois DOT
I-LAST
Use of the tool is now limited to District 1 in Region 1. The tool has not yet been adopted by Illinois DOT’s Central Office, though this remains a possibility.
2011 (phased implementation in process)
Not a method to aid in project selection. Instead, the tool offers a series of ideas and alternatives rather than performance measures that require metrics to assess projects.
153 possible sustainable or livable practices in 17 sections and eight general categories, with 233 total points available.
Each practice is assigned a maximum number of points (1, 2 or 3). 1 point indicates a required design element; 2 points indicates design beyond requirements; and 3 points is associated with unique, innovative or special actions.
North Carolina DOT
Accountability framework
The framework supports the department’s broadened mission that now emphasizes a “triple bottom line” of economic development, public health and well-being, and environmental sensitivity.
2012
Not used as an optimization tool to prioritize projects; employed at a higher level to integrate sustainability throughout the transportation program.
114 metrics
The framework identifies what actions should be taken; performance measures track performance and strategies identify how to alter the results on the identified metrics.
Not clear to the department which metrics are more important in assessing sustainability.
Rhode Island Statewide Planning Program
Scoring process
Only relevant project evaluation criteria are included in customized scoring sheets prepared for each of the TIP programs.
2004
Project scoring quantifies the expected benefits of projects, but is only one aspect of the project evaluation process.
Six criteria categories with 40 subcriteria, or measures; 20 points possible in each category.
Each measure is scored on a scale of -5 to 5; category totals cannot be more than 20 points or less than -20 points.

9
Summary Descriptions of Sustainability Tools and Practices (continued)
Agency / Tool or Practice Scope of the Application Implementation Date / Types
of Uses Performance Measures / Scores Weighting of Measures
Texas DOT
Sustainability Enhancement Tool
The tool was designed to be a la carte; for example, the user can include or exclude rural or urban items as appropriate.
Not currently in use
Tool developed for planning-level corridor analyses. To date, the only use has been a pilot project on a section of US 281 in San Antonio, TX.
12 performance measures assess objectives arising from five strategic plan goals.
Each measure is assigned a weight that reflects its contributions to the overall goal area.
A scaling process to express measures on a common basis uses 1 for the “best” case, and 0 for the “worst” case.
Metropolitan Transportation Commission
Performance targets and targets scoring
Target assessments allow the agency to compare projects, identifying outliers that perform very well or very poorly.
2010 (specific targets)
The preferred scenario alternative is the one that best achieves the targets and is financially feasible.
10 goals have related performance targets; an additional set of five measures is used for an equity analysis.
A five-point scale from 1 to -1 generates scores for all targets, which are combined into a “targets net score.”
While there are more measures for livability, all measures have the same weight.
Sacramento Area Council of Governments
Performance measures
Performance measures in four categories are used to compare land use scenarios and identify a preferred package of projects.
2002
Applies sustainability principles at a high level in the regional transportation plan and monitors performance measures at the system level. Future plans may apply sustainability principles at the project level.
30 indicators with 60+ related measures are organized in four categories.
Categories used to organize the indicators and measures include land use, transportation, environmental and environmental justice; no weighting is indicated.

10
Summary Descriptions of Sustainability Tools and Practices (continued)
Agency / Tool or Practice Scope of the Application Implementation Date / Types
of Uses Performance Measures / Scores Weighting of Measures
San Francisco County Transportation Authority Scoring process
The scoring process applies at the planning and funding levels, and ranks and sorts projects into tiers; the scoring does not assess project implementation.
2012
Prioritizes projects in four tiers (high, middle-high, middle-low and low) based in part on performance metrics that measure success in addressing the four goals for the county’s transportation system.
A “benefit score” is the product of three subscores: market, problem and effect. Project costs are considered in the second step in the scoring process.
The three subscores plus the annualized cost of each project are weighted equally.
Santa Cruz County Regional Transportation Commission Sustainable Transportation Analysis and Rating System (STARS-Plan)
The tool is used at the beginning of the planning process and integrated throughout the planning process. The agency used the tool to set up the policy element (goals, performance measures and targets) for its regional transportation plan and prioritize projects that advance the agency’s targets.
In process The agency continues its development of the STARS-Plan sustainability tool with the plan’s development team; the tool will be used for a corridor investment study later this year.
Three goals are associated with 10 performance targets.
The agency has not yet formally incorporated sustainability into the programming of funding for projects but has used sustainability considerations informally.
No formal weighting, but the performance measures identified as most critical for the agency include: • Reducing vehicle miles
traveled. • Improving access through
coordinated land use and transportation for all users.
• Reducing the number of collisions and fatalities.
• Maintaining the transportation system.

11
Summary Descriptions of Sustainability Tools and Practices (continued)
Agency / Tool or Practice Scope of the Application Implementation Date / Types
of Uses Performance Measures / Scores Weighting of Measures
Federal Highway Administration Infrastructure Voluntary Evaluation Sustainability Tool (INVEST)
INVEST can be used to evaluate performance after projects are completed or constructed. The tool can also be used to consider ideas during project planning and development.
2012
The tool provides agencies with an opportunity to quantify sustainability and put it on an equal footing with other performance measures in the decision-making process but does not attempt to mandate values or choices.
60 criteria are organized into three modules: system planning, project development, and operations and maintenance.
Separate scorecards are available for each module.
Each INVEST criterion describes a particular sustainability best practice and assigns it a point value (or “weight”) according to its relative impact on transportation sustainability.

12
Examination of Sustainability Practices in Selected State DOTs We contacted four state DOTs to inquire about the methods, practices and tools employed to incorporate sustainability into transportation planning and decision-making as they relate to short- and long-term transportation investments. The practices or tools in development or in use by these states were summarized in the April 2012 Preliminary Investigation Smart Mobility: A Survey of Current Practice and Related Research. In this report, we sought to obtain further detail and identify the current status of the sustainability tools and practices presented in the April 2012 report. We summarize below discussions with the following state transportation agencies:
• Illinois DOT (Livable and Sustainable Transportation (I-LAST) rating system).
• North Carolina DOT (Accountability Framework).
• Rhode Island Statewide Planning Program (Transportation Improvement Program scoring tool).
• Texas DOT (Sustainability Enhancement Tool). Results of the discussions are organized in the following categories:
• Background.
• Sustainability tool description.
• Implementation process.
• Use of the sustainability tool.
• Lessons learned.
• Related documents.
• Contacts.
Illinois DOT: Livable and Sustainable Transportation (I-LAST)
Background Illinois DOT staff came together with representatives from the American Council of Engineering Companies–Illinois and the Illinois Road and Transportation Builders Association to form the Joint Sustainability Group that developed the Illinois Livable and Sustainable Transportation (I-LAST) tool. Other participating agencies include Chicago Gateway Green, Illinois Asphalt Paving Association, American Concrete Paving Association, Illinois Landscape Contractors Association and Midwest Ecological Landscaping Association. The I-LAST rating system and guide were created by volunteers and were not funded by a particular agency or grant.
Sustainability Tool Description The purpose of the I-LAST rating system is threefold:
• Provide a comprehensive list of practices that have the potential to bring sustainable results to highway projects of all sizes and all phases of project development (planning, final design and construction).
• Establish a simple and efficient method of evaluating transportation projects with respect to livability, sustainability and effect on the natural environment.

13
• Record and recognize the use of sustainable practices in the transportation industry.
The tool includes over 153 possible sustainable or livable practices in 17 sections and eight general categories, with 233 total points available. The eight categories include planning, design, environmental, water quality, transportation, lighting, materials and innovation. Each category has several subcategories that include sustainable action items. Each item is assigned a maximum number of points (1, 2 or 3), with 1 point indicating a required design element, 2 points indicating design beyond requirements, and 3 points signifying unique, innovative or special actions. Some items are weighted more heavily than others based on their complexity. Standard practices are given a weighting of 1. Using the percentage of applicable items, there are two steps to scoring a project:
• Identify which items are applicable at the start of a project.
• Evaluate those items for which the goal was accomplished at the end of a project. The tool serves two functions: as a project-oriented guide for design and as a rating system for scoring. The tool also serves as a catalog of sustainable planning practices and innovative ideas for improving project delivery. No certification is required, and there is no recordkeeping or calculation required. The Project Manager can score a project in about an hour.
Implementation Process Work on the project began in 2008. Using New York State DOT’s GreenLITES (Green Leadership In Transportation Environmental Sustainability) transportation environmental sustainability rating program as a model, the I-LAST team continued work on developing the checklist in 2008 and 2009. In 2010 and 2011, the team prepared reports and allowed time for industry partners to review the tool. Version 1.0 was released in January 2010. Actual use began in 2011, with a January 2011 memo notifying staff that all projects associated with the June 2011 letting would be scored. Contractors initially expressed interest in having the tool be incentive-based, but the development team rejected the use of additional funds to encourage sustainable practices. Version 2.0 of the I-LAST rating system is expected to be available soon on the Illinois DOT website. Use of the tool is now limited to District 1 in Region 1 (counties of Cook, DuPage, Kane, Lake, McHenry and Will). The tool has not yet been adopted by Illinois DOT’s Central Office, though this remains a possibility. I-LAST has been implemented in phases that match project phases: Phase 1 (preliminary engineering and NEPA environmental documentation) and Phase 2 (final design and preparation of contract documents) have been implemented; Phase 3 (construction) implementation is just beginning to assess activities in the field. Nothing has been done involving maintenance to date.
Use of the Sustainability Tool The I-LAST tool takes a bottom-up approach that focuses on design team decisions rather than attempting higher-level policy changes. The project team felt that a tool could be implemented and produce tangible results more quickly than a change in policy.
I-LAST uses a point system for evaluating the sustainable measures included in a project. Due to the varying nature of highway projects and the range of items in I-LAST, there will often be a large number

14
of points that are not applicable to an individual project. Therefore, comparing the absolute score of different projects would not be indicative of the level of sustainability for those projects. Instead, Project Managers are advised to examine the scope of work rather than the total points achieved. Population density also contributes to how applicable I-LAST will be to project analysis, and the opportunity to use I-LAST is likely not as great in downstate Illinois. I-LAST is not a method to aid in project selection. Instead, the tool offers a series of ideas and alternatives rather than performance measures that require metrics to assess projects. The tool is used at the beginning of a project to identify the sustainable practices applicable to the project. When construction is complete, the team identifies which of the practices were actually included in the final project. The final evaluation, or completed scorecard, is included in the project file and retained on an internal SharePoint site; the district is also using scoring results in communications with the governor’s office, in press releases, and at ribbon-cuttings and groundbreaking activities.
Lessons Learned John Fortmann, the acting Region 1/District 1 engineer participating in development of I-LAST, notes that the tool is quantifying and encouraging decision-making that was already happening within the department, and says it is too early to tell if the tool has had a significant impact. I-LAST has been useful in highlighting for individuals or agencies new to transportation project development the opportunities available to develop and build a sustainable, livable project. Fortmann recommends mirroring New York State DOT’s approach in designating one individual to oversee its GreenLITES program, though Illinois DOT has not yet made such a designation for I-LAST. Updates to the tool are expected as new ideas and practices are brought forward. Illinois DOT found it challenging to work with outside parties in developing I-LAST. Fortmann urges other agencies considering development of a sustainability tool to “keep it simple.” He notes that academicians may not take into account resource limitations within state agencies and may attempt to structure a tool or process that is too complicated to support over time. The scorecard/checklist approach works well for Illinois DOT given its resource limitations. Not requiring feedback from the contractor until Phase 3 has also proved helpful, though the district is now deploying I-LAST in the field to see how well contractors work with the scoring process. While an overall assessment of the tool’s effectiveness may be premature, Illinois DOT has identified clear successes resulting from the tool’s development and early use. Early disagreements about some of the items included in the I-LAST tool have actually paved the way for agreement on the use of new practices. For example, when the use of warm-mix asphalt (WMA) was first considered for inclusion in the tool, some Illinois DOT staff were hesitant to advocate its use given concerns about rutting. Now WMA is more readily accepted as a viable option for the department.
Related Documents I-LAST: Illinois Livable and Sustainable Transportation Rating System and Guide, Version 2.0, Illinois Department of Transportation, January 31, 2012. http://www.dot.state.il.us/green/documents/I-LASTGuidebook.pdf This guide provides a comprehensive list of practices that have the potential to bring sustainable results to highway projects. I-LAST uses a point system for evaluating the sustainable measures included in a project with respect to livability, sustainability and effect on the natural environment.

15
Case Study in Sustainability: Creating the Illinois Livability and Sustainable Transportation (I-LAST) Tool, FHWA Sustainable Highways Program, January 2012. http://www.sustainablehighways.dot.gov/documents/ILAST_Case_Study.pdf This document describes the I-LAST tool’s development process, outcomes and lessons learned by the Joint Sustainability Group responsible for its development.
Contacts John Fortmann, Acting Region 1/District 1 Engineer, Illinois Department of Transportation, (847) 705-4118, [email protected]; Abdul Dahhan, Region 1 Materials Engineer, Illinois Department of Transportation, (847) 705-4363, [email protected].
North Carolina DOT: Accountability Framework
Background Rather than using a clearly defined sustainability tool or a stand-alone plan, North Carolina DOT is implementing an accountability framework that includes a set of principles, objectives, performance measures and strategies that meet the department’s expanded mission. The department broadened its core mission statement in April 2012 to include the importance of enhancing the economy and health and well-being of North Carolina. The broadened mission now emphasizes a “triple bottom line” of economic development, public health and well-being, and environmental sensitivity.
Sustainability Tool Description Development began in 2009 on the draft Blueprint for Sustainability that was published in May 2012. The Blueprint was developed to help NCDOT adopt sustainability as a department value by embedding sustainability into the department’s policies and practices to advance the following goals:
• Make our transportation network safer.
• Make our transportation network move people and goods more efficiently.
• Make our infrastructure last longer.
• Make our organization a place that works well.
• Make our organization a great place to work. The principles and objectives (see the table on the next page) serve as a second level of accountability for the mission statement and the department’s 2040 Plan. Working from the overarching mission and goals framework, the principles and objectives expand upon key concepts and offer specific ways in which the department’s programs, policies, and projects can contribute to the communities and regions it serves.

16
North Carolina DOT’s Principles and Objectives to Meet Its Expanded Mission
Principle Objective
Improve the reliability of all modes of transportation
Reduce congestion Moving people and goods: Efficient transportation network
Reduce travel times
Expand and enhance alternatives to automobile travel
Improve intermodal connectivity Choices: Choice in how to travel
Reduce growth rate of single-occupancy vehicle travel
Enhance transportation network connectivity
Improve pedestrian and bicycle linkages to activity centers
Encourage comprehensive planning at the state, regional and local levels
Invest in multimodal, mixed-use transit centers
Connectivity: Integration of transportation and land use
Reduce average trip length
Improve air quality and reduce transportation-related emissions
Protect and enhance water quality
Increase energy and water conservation and efficiency
Resource protection: Protection and conservation of natural resources
Enhance “3 R” (reduce, reuse and recycle) efforts
Leverage effective funding strategies for transportation investment to meet long-term needs
Use transportation investment to support economic development, job creation and commerce
Prosperity: Economic growth and development
Increase the efficiency and cost-effectiveness of goods movement
Improve performance-based program delivery
Use value management tools, including life cycle, risk assessment, and return on investment analyses, for transportation decision-making
Maximize the capacity potential of the existing transportation network (all modes)
Accountability: Balance of needs and interests with available resources
Improve NCDOT’s level of customer service
17
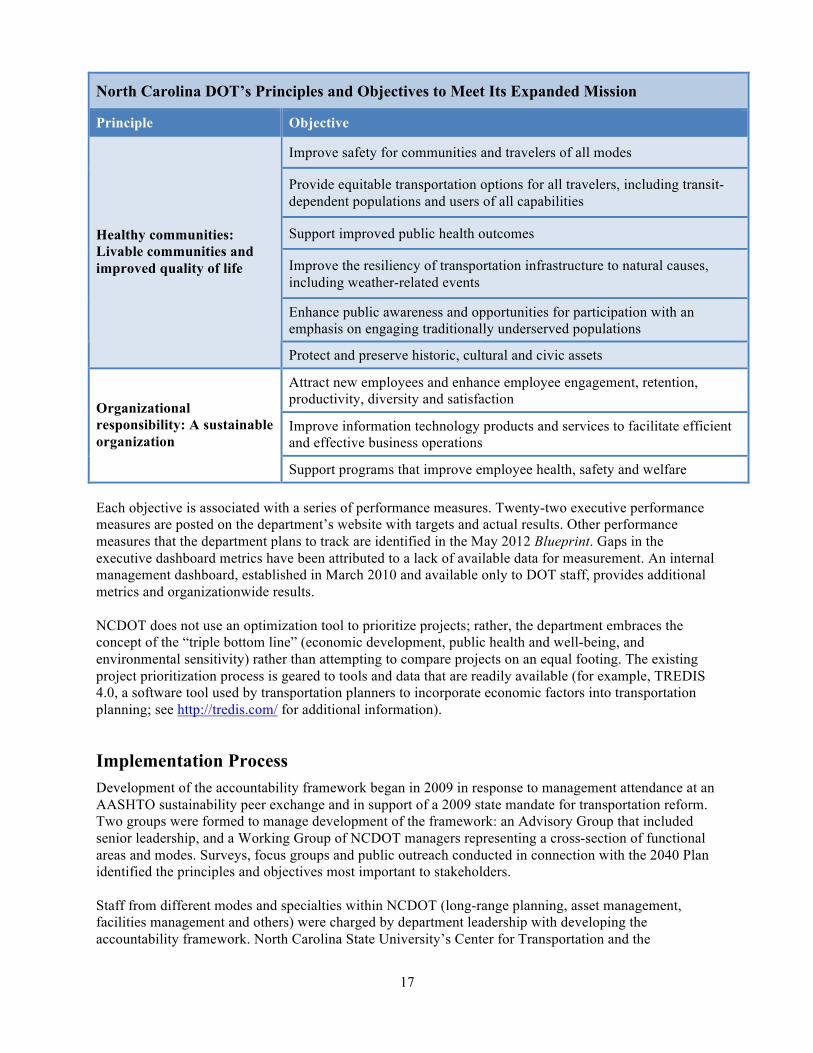
North Carolina DOT’s Principles and Objectives to Meet Its Expanded Mission
Principle Objective
Improve safety for communities and travelers of all modes
Provide equitable transportation options for all travelers, including transit-dependent populations and users of all capabilities
Support improved public health outcomes
Improve the resiliency of transportation infrastructure to natural causes, including weather-related events
Enhance public awareness and opportunities for participation with an emphasis on engaging traditionally underserved populations
Healthy communities: Livable communities and improved quality of life
Protect and preserve historic, cultural and civic assets
Attract new employees and enhance employee engagement, retention, productivity, diversity and satisfaction
Improve information technology products and services to facilitate efficient and effective business operations
Organizational responsibility: A sustainable organization
Support programs that improve employee health, safety and welfare Each objective is associated with a series of performance measures. Twenty-two executive performance measures are posted on the department’s website with targets and actual results. Other performance measures that the department plans to track are identified in the May 2012 Blueprint. Gaps in the executive dashboard metrics have been attributed to a lack of available data for measurement. An internal management dashboard, established in March 2010 and available only to DOT staff, provides additional metrics and organizationwide results. NCDOT does not use an optimization tool to prioritize projects; rather, the department embraces the concept of the “triple bottom line” (economic development, public health and well-being, and environmental sensitivity) rather than attempting to compare projects on an equal footing. The existing project prioritization process is geared to tools and data that are readily available (for example, TREDIS 4.0, a software tool used by transportation planners to incorporate economic factors into transportation planning; see http://tredis.com/ for additional information).
Implementation Process Development of the accountability framework began in 2009 in response to management attendance at an AASHTO sustainability peer exchange and in support of a 2009 state mandate for transportation reform. Two groups were formed to manage development of the framework: an Advisory Group that included senior leadership, and a Working Group of NCDOT managers representing a cross-section of functional areas and modes. Surveys, focus groups and public outreach conducted in connection with the 2040 Plan identified the principles and objectives most important to stakeholders. Staff from different modes and specialties within NCDOT (long-range planning, asset management, facilities management and others) were charged by department leadership with developing the accountability framework. North Carolina State University’s Center for Transportation and the

18
Environment (CTE) provided research assistance. The framework sets forth the actions that should be taken, with performance measures tracking performance and strategies identifying how to impact measurement results.. A total of 114 metrics were developed—existing and new, and primary and secondary. Of these, two-thirds were already being tracked by the department.
Use of the Sustainability Tool The framework for sustainability practices was developed in conjunction with the department’s 2040 Plan and expanded to the department’s Policy to Projects document. The framework is a work in progress that must be open to change to ensure its continued relevance, which requires continual integration over time. Metrics are reviewed and evaluated based on new research to remain faithful to the triple bottom line. It is not clear which of the metrics are most important to assess sustainability. Julie Hunkins, manager of NCDOT’s Quality Enhancement Unit, notes that the triple bottom line elements are not equal and that optimization is situation-specific. Gaps in the metrics include those associated with the “healthy communities” principle, and more work is needed to identify metrics for the “prosperity” principle associated with economic growth and development. CTE is still under contract with the department, and there is still interest in obtaining baseline data and developing an automated process to manage the data for additional performance metrics. Hunkins estimates that additional metrics may be available within the next one to two years.
Lessons Learned For NCDOT, keys to implementation success include:
• Branding. Using the term “sustainability” can be problematic with some constituencies. While the term “Blueprint for Sustainability” was used during the outreach and development process, the project became temporarily known as the “Blueprint” and was later rebranded as the “Accountability Framework.”
• Integration. The Accountability Framework was reflected in the department’s expanded mission statement; its 2040 Plan, a statewide plan to establish high-level investment priorities; and its Policy to Projects document (NCDOT’s statewide transportation improvement plan (STIP)).
• Communications. The specific communications plan is under development. Internal communications are expected to emphasize performance measurement, while external communications will address performance-based accountability to the department’s external stakeholders.
• Maintenance and monitoring. The department expects the framework to require continuous review and updating through tracking outcomes and ensuring performance-based accountability. Work continues on identifying targets for all performance measures and developing baselines for new metrics.
Better decision-making will come from a heightened understanding of sustainability issues and strong partnerships with other agencies, such as those focused on commerce, human services and natural resources. Hunkins notes that there are opportunities to take the eight principles beyond the current high-level application in policy statements. NCDOT advises other agencies wishing to establish a sustainability framework to be realistic. An agency can have admirable goals and things to measure, but those measurements have to be achievable. Also important is the ability to isolate the effectiveness of a particular measure when there are many factors
19
outside the control of an agency (safety and air quality are examples). Other advice and lessons learned include:
• Support from senior leadership is critical. It is important to have leadership identify sustainability as a priority and encourage its integration at all levels (policy, programs and projects).
• Take advantage of opportunities to shift policy direction and integrate sustainability with other department initiatives.
• Be flexible about the final product; a formal plan may not be what the department really needs. Allow the process to dictate its own outcomes.
• Don’t let perfect get in the way of good.
• Involve employees in the development process. Allow them to identify ways in which sustainability can be achieved in their day-to-day activities.
• Embed the framework in department practices and documents (2040 Long-Range Plan, 10-year and 5-year STIP (Policy to Projects).
• Align performance measures with objectives.
Related Documents Performance Accountability Framework, North Carolina Department of Transportation, May 2, 2012. See Appendix A This document lays out the department’s vision for continuous improvement and innovation. Draft Blueprint, North Carolina Department of Transportation, May 2012. See Appendix B This document provides the objectives, performance measures and strategies employed in the department’s accountability framework. NCDOT Mission, Goals, Principles and Objectives, DRAFT, North Carolina Department of Transportation, June 6, 2012. See Appendix C Another representation of the elements of the accountability framework established by NCDOT. Executive Performance Metrics, First Quarter Results for State Fiscal Year 2012, North Carolina Department of Transportation, January 3, 2012. http://www.ncdot.gov/download/performance/12_quarter1_scorecard.pdf This document presents the department’s goals and performance measures, as well as State Fiscal Year (SFY) 11 results, SFY 12 targets, SFY YTD results and trends in meeting the targets. Organizational Performance, North Carolina Department of Transportation. https://apps.dot.state.nc.us/dot/dashboard/default.aspx This website presents the department’s Organizational Performance Dashboard, which serves as an indicator of how well the department is meeting its mission and goals. North Carolina Statewide Transportation Plan, 2040 Plan: NCDOT From Policy to Projects, North Carolina Department of Transportation, August 2012. http://www.ncdot.gov/download/performance/NCDOT_2040TransportationPlan.pdf This policy-based document identifies long-term needs, revenues, and investment strategies. The document addresses policy initiatives, including the Sustainability Blueprint.

20
Policy to Projects, Draft, North Carolina Department of Transportation, September 5, 2012. http://www.ncdot.gov/download/performance/ncdot_2012_policy_to_projects_web_draft.pdf NCDOT lays out its strategic planning framework in this document. From page 7 of the PDF:
This document, known as the “Policy to Projects document,” outlines the Department’s recommended strategic plan for the next ten years. It includes major components of the transportation reform framework covering investment outcomes and deliverables that will accomplish the Department’s vision, mission and goals. The three major sections of the Policy to Projects document include strategic planning (the “why”), from policy to projects (the “how and who”) and the project list (the “what, when and where”).
Sustainability Blueprint Working Group, Center for Transportation and the Environment, North Carolina State University, undated. http://www.cte.ncsu.edu/sustainability/index.html This website includes information about the working group’s meetings, literature review findings, an inventory of sustainable best practices and more.
Contact Julie Hunkins, Manager, Quality Enhancement Unit, North Carolina Department of Transportation, (919) 508-1852, [email protected].
Rhode Island Statewide Planning Program: Transportation Improvement Program Scoring Tool
Background A grant to Rhode Island’s KeepSpace Partners, a coalition of state agencies and nonprofit organizations, funded development of a project selection tool to assess and prioritize applications for competitive funding for transportation, housing and infrastructure projects. The tool uses yes/no checklists and narrative responses to award points in the following categories:
• Transportation choice and accessibility.
• Housing choice and affordability.
• Economic development.
• Support of existing communities and designated growth centers.
• Community character and collaboration.
• Environmental protection and public health. The criteria can be adjusted for urban, suburban and rural projects. To date, the tool has been subjected to limited testing; none of the testing has included a large-scale analysis of transportation investments. Currently, Rhode Island’s Statewide Planning Program uses a scoring process to aid in selection of projects for inclusion in its Transportation Improvement Program (TIP)—a list of the transportation projects the state intends to implement using federal highway and transit funds—rather than the KeepSpace project selection tool. While not in use today, the KeepSpace tool may have a future use in evaluating Rhode Island’s transportation investments.

21
Sustainability Tool Description Project evaluation criteria apply only to project applications for the TIP. The State Planning Council, acting as the single statewide metropolitan planning organization in Rhode Island, is responsible for adopting a new TIP every four years. The State Planning Council’s Transportation Advisory Committee (TAC) works with Rhode Island Statewide Planning Program staff in developing a draft TIP. The following categories of criteria are used in the scoring and selection of projects and reflect the goals established in the state’s long-range plan:
• Mobility benefits.
• Cost-effectiveness.
• Economic development impact.
• Environmental impact.
• Support of local and state goals and plans.
• Safety, security and technology. Each criteria category is worth 20 points, with a total of 120 points available. Each of the six categories includes between five and nine subcriteria that may be applied to individual scoring sheets used in connection with the following TIP program categories:
• Administrative. • Major projects. • Bicycle/pedestrian. • Planning. • Bridge. • Pavement management. • Congestion mitigation/air quality.
• Study and development. • Enhancement. • Traffic safety. • Highway. • Transit program (rail and bus). • Interstate.
Only the relevant project evaluation criteria are included in customized program scoring sheets used by the TAC subcommittees evaluating projects for the TIP.
Implementation Process The current project scoring process was first used for the TIP developed in 2004. The State Planning Council made limited changes to the criteria for 2012 TIP scoring.
Use of the Sustainability Tool Project scoring has allowed the state to quantify the expected benefits of projects, but is only one aspect of the overall project evaluation process. Municipalities submitting proposed projects provide a project prioritization to rank their projects according to importance to the community. Statewide Planning Program staff providing support to the TAC gather additional information about the proposed projects that augments composite and average scores (for example, other investments associated with a proposed project). An analysis that attempts to provide an equitable geographic distribution of projects across the state also affects the final analysis of projects.
22
Lessons Learned Linsey Callaghan, transportation supervising planner for Rhode Island’s Statewide Planning Program, recommends using tools such as the project scoring process as one aspect of an overall evaluation. Scoring has proved to be a useful way to rank projects in advance of TAC meetings during which all projects are examined in greater detail. Internal reviews, analysis of supplemental information, and TAC discussion are all significant elements of the evaluation of transportation projects for inclusion in the state’s TIP.
Related Documents A Project Selection Tool for the State of Rhode Island: Leveraging State Transportation, Housing and Infrastructure Investments, Office of Sustainable Growth, Smart Growth Program, U.S. Environmental Protection Agency, August 2012. http://www.epa.gov/dced/pdf/ri_sgia_final_report.pdf This report describes the development process for the project selection tool, as well as the assessment categories, project selection criteria and ideas for using and adapting the project selection tool. A Guide to Rhode Island’s Transportation Improvement Program (TIP) Development Process, Federal Fiscal Years 2013-2016, Rhode Island Statewide Planning Program, August 2011. http://www.planning.ri.gov/misc/TIP2013%20Docs/TIP%20Guide%20with%20Appendix.pdf This guide provides assistance to stakeholders interested in development of Rhode Island’s TIP for 2013-2016. TIP Project Proposal Evaluation Criteria and Guidance, Transportation Advisory Committee, Rhode Island State Planning Council, August 2011. http://www.planning.state.ri.us/misc/TIP2013%20Docs/TIP%20Evaluation%20Criteria%20and%20Guidance.pdf This document provides the six project evaluation criteria and guidance on applying the criteria and subcriteria for evaluation of project proposals. Subcommittee Reports—Detailed Summary of Recommendations, various transportation advisory committees, State of Rhode Island, February 29, 2012. http://www.planning.state.ri.us/misc/tip13/Subcommittee%20Reports%20-%20All.pdf See page 28 of the PDF for a list of the recommended highway projects that were evaluated in part using the project scoring tool (see the column labeled “Avg Score”).
Contacts Linsey J. Callaghan, Transportation Supervising Planner, Statewide Planning Program, Rhode Island Department of Administration, (401) 222-6479, [email protected]; Jeff Davis, Principal Planner, Statewide Planning Program, Rhode Island Department of Administration, (401) 222-4718, [email protected].
23
Texas DOT: Sustainability Enhancement Tool
Background A project led by Texas DOT produced the Sustainability Enhancement Tool, a user-friendly, Excel-based tool that provides a platform for evaluating sustainable transportation performance measures and combining them into a final sustainability index. That project laid the groundwork for the work presented in the NCHRP publication A Guidebook for Sustainability Performance Measurement for Transportation Agencies. See Related Documents below for a citation for this NCHRP publication.
Sustainability Tool Description TxDOT’s sustainability tool is flexible and was developed to be a la carte—for example, the user can select or exclude alternatives for urban or rural applications as appropriate. The tool does not provide benefit-cost analyses or a return on investment analysis, and does not relate to the department’s asset management practices. Bill Knowles, director of TxDOT’s Traffic Analysis Section and the sustainability tool’s project coordinator, characterizes the sustainability tool as the practice of “value planning,” providing a mechanism to ensure that a project will have value that lasts over time (typically normalizing projects over a 20-year horizon). The tool helps to answer this question: Will the project improve conditions over the long run? The tool in its current configuration is focused on planning-level corridor analyses. Further development could expand the tool to cover programming and project development, design, construction, maintenance and operations. The department might also explore the possibility of applying a sustainability rating system on a statewide basis.
Implementation Process A transition in department administration that took place two years ago led to a new direction with regard to sustainability. At this time, there has been no further work on the sustainability tool in terms of further development or practical application of the tool. The only application to date has been in connection with a section of US 281 in San Antonio, TX. See Related Documents below for the citation to a publication describing this pilot effort.
Use of the Sustainability Tool The Sustainability Enhancement Tool contains a series of input sheets covering a base case and up to three future cases. The tool currently supports corridor analysis, allowing the user to break the corridor into 10 links for independent analysis. The menu-driven tool automatically implements measures and variable weighting and provides a visual comparison of alternative options. The table below summarizes the performance measures included in the tool.

24
Performance Measures Used in TxDOT’s Sustainability Enhancement Tool
TxDOT Strategic Plan Goal Objectives Performance Measure
Improve mobility on highways Travel time index Reduce congestion
Improve reliability of highway travel Buffer index
Reduce crash rates and crash risk Annual severe crashes per mile Enhance safety Improve traffic incident detection
and response Percentage lane-miles under traffic monitoring/surveillance
Optimize land use mix for development potential Land use balance
Expand economic opportunity Improve road-based freight
movement Truck throughput efficiency
Maintain existing highway system quality Average pavement condition score
Reduce cost and impact of highway capacity expansion
Capacity addition within available right of way
Leverage nontraditional funding sources for highways
Cost recovery from alternative sources
Preserve the value of transportation assets
Increase use of alternatives to single-occupant automobile travel
Proportion of non-single-occupant vehicle travel
Reduce adverse human health impacts and comply with ambient air quality standards
Air Quality Index Improve air quality
Reduce greenhouse gas emissions Daily CO2 emissions per mile of roadway
Each individual measure is assigned a weight that reflects its contributions to the overall goal area. Default weightings are provided and stratified across a rural or urban project setting. The user can change these weightings or keep the default settings. Data inputs include required inputs for the base case (the current environment) and future cases and optional inputs for the future case that can provide greater precision in the calculation of the performance measures. The tool uses a scaling process to express all measures on a common basis, with 1 representing the “best” case and 0 representing the “worst” case. Each measure has predefined “best” and “worst” case values. The scaled values of the measures associated with an individual goal area are combined as a weighted sum to create an index value on the 0-to-1 scale. The worksheet compares the base and future cases across the five goal areas to see which measures have improved or worsened over the base case.

25
Lessons Learned Knowles notes that effective marketing of a research effort such as the one undertaken by TxDOT is essential. Branding the effort is also important, taking care to accurately describe the project. For example, in Texas some were concerned that the tool under development would be used for project selection. TxDOT was careful to describe the tool as a self-assessment mechanism that provides users with the opportunity to practice value planning. Knowles likens value planning to value engineering, which has been defined as “an organized effort directed at analyzing the functions of systems, equipment, facilities, services and supplies for the purpose of achieving the essential functions at the lowest life cycle cost consistent with the required performance, reliability, quality and safety.”1 Knowles echoes other interviewees in noting that the tool sets out best practices in engineering and planning. Higher scores are earned by those projects using more of the best practices identified in the tool. Knowles also advises other agencies to keep things simple and avoid attempting to do too much with an initial research effort or implementation.
Related Documents A Guidebook for Sustainability Performance Measurement for Transportation Agencies, NCHRP Report 708, June 2011. http://onlinepubs.trb.org/onlinepubs/nchrp/nchrp_rpt_708.pdf This guidebook demonstrates how performance measurement can be implemented to assess the relative sustainability of the agencies’ transportation networks and corridors over space and time. “Sustainability Enhancement Tool for State Departments of Transportation Using Performance Measurement,” Tara L. Ramani, Josias Zietsman, William E. Knowles, Luca Quadrifoglio, Journal of Transportation Engineering, Vol. 137, No. 6, June 2011: 404-415. Citation at http://cedb.asce.org/cgi/WWWdisplay.cgi?280446 In this project, researchers developed a performance measurement–based framework and evaluation methodology for sustainable transportation that is linked to agency strategic planning goals. The methodology was applied and tested for TxDOT in the agency’s highway-corridor planning process. Researchers identified 12 performance measures, including measures of congestion, safety, alternative modes and air quality, to address the goals and objectives in TxDOT’s strategic plan. The authors also present results from a pilot application of the methodology for a section of US 281 in San Antonio, TX. Incorporating Sustainability into TxDOT’s Transportation Decision Making—Summary of Work Performed, Methods Used, and Results Achieved, Texas Transportation Institute, Report No. 5-5541-01-1, February 2011. http://tti.tamu.edu/documents/5-5541-01-1.pdf This TxDOT implementation project involved the development of workshop material aimed at disseminating research findings and training participants in hands-on use of the Excel-based calculator—Sustainability Enhancement Tool—that applies performance measures for sustainability at the highway corridor level.
1 Value Engineering Program Guide for Design and Construction, U.S. General Services Administration, December 1992; http://www.gsa.gov/graphics/pbs/New_VEPG_Volume_I_R2Q-iK_0Z5RDZ-i34K-pR.pdf

26
User’s Manual for Sustainable Transportation Performance Measures Calculator, Texas Transportation Institute, August 2010. http://tti.tamu.edu/documents/5-5541-01-P2.zip (Open the zipped folder and select the file “User Manual_02-16-2011.pdf.”) This set of documents is the product of the 2009 research project “Developing Sustainable Transportation Measures for TxDOT’s Strategic Plan.” The overall goal of that project was to develop sustainable transportation performance measures for TxDOT’s strategic goals and objectives as well as a framework for TxDOT to implement a sustainable transportation system in Texas. This report contains the user’s manual for the user-friendly analysis tool developed in Microsoft Excel to serve as a platform for evaluating the performance measures and combining them into a final sustainability index tool. Included are a user’s manual, an Excel spreadsheet and sample results, and instructor and participant materials for training sessions.
Contact Bill Knowles, Director, Traffic Analysis Section, Texas Department of Transportation, (512) 465-7648, [email protected].
Examination of Sustainability Practices in Selected California MPOs
We contacted four metropolitan planning organizations/regional transportation authorities within California to identify the tools and practices in place to incorporate sustainability into transportation planning and decision-making. The agencies include:
• Metropolitan Transportation Commission.
• Sacramento Area Council of Governments.
• San Francisco County Transportation Authority.
• Santa Cruz County Regional Transportation Commission. The sustainability practices of these agencies have been affected by the requirements of Senate Bill 375, Sustainable Communities and Climate Protection Act of 2008. Each of California’s 18 metropolitan planning organizations (MPOs) is subject to the requirements of the Act, which requires California’s MPOs to prepare a sustainable communities strategy (SCS) that demonstrates how the region will meet its greenhouse gas reduction target through integrated land use, housing and transportation planning. Once adopted by the MPO, the SCS will be incorporated into that region’s federally enforceable regional transportation plan. An MPO’s final plan is reviewed to determine whether it would, if implemented, achieve the greenhouse gas emission reduction target for its region. (See http://www.arb.ca.gov/cc/sb375/sb375.htm for more information about Senate Bill 375.)

27
Metropolitan Transportation Commission: Performance Targets and Targets Scoring
Background The Metropolitan Transportation Commission (MTC) serves 101 cities and nine counties in the San Francisco Bay Area and is a sister agency to Association of Bay Area Governments. MTC collaborated with Association of Bay Area Governments, which is responsible for the land-use and housing assumptions, in developing Plan Bay Area, the long-range transportation and land use/housing plan for the San Francisco Bay Area. The plan includes the Regional Transportation Plan that is updated every four years. The 2012 plan is the first to include the agency’s sustainable communities strategy.
Sustainability Tool Description MTC uses two models to aid in assessing sustainability:
• A regional travel demand model that is activity based; model development began in 2008-2009 and was completed in 2011.
• UrbanSim, an open source software package described as a “simulation system for supporting planning and analysis of urban development, incorporating the interactions between land use, transportation, the economy and the environment.” The model, completed in 2012, was developed more quickly than the regional travel demand model although it was a more time-intensive effort. See Related Documents below for more information about UrbanSim.
The models help to measure the performance of different scenarios using a set of 10 performance targets (see the table on page 28). Assessments are completed at the scenario level, with 14 different combinations of land use patterns that address both urban and rural areas. Each project within the scenario is assessed by measuring support for each of the 10 adopted targets on a five-point scale:
• Strong support (1).
• Moderate support (0.5).
• Minimal impact (0).
• Moderate adverse impact (-0.5).
• Strong adverse impact (-1). Scores for all targets are combined into a “targets net score.” Staff had originally intended to use quantitative output from the travel demand model, when such data were available from the benefit-cost assessment. However, MTC found it challenging to integrate the quantitative model results, which are available for only some projects and targets, with qualitative assessment criteria, and chose to apply the qualitative criteria to all projects. The performance measures are associated with numeric targets, which are at the center of the process. While there are more measures for livability, all measures have the same weight. There has been no consensus that any one of the 10 performance targets is more important than another. Targets are categorized by goal.
28
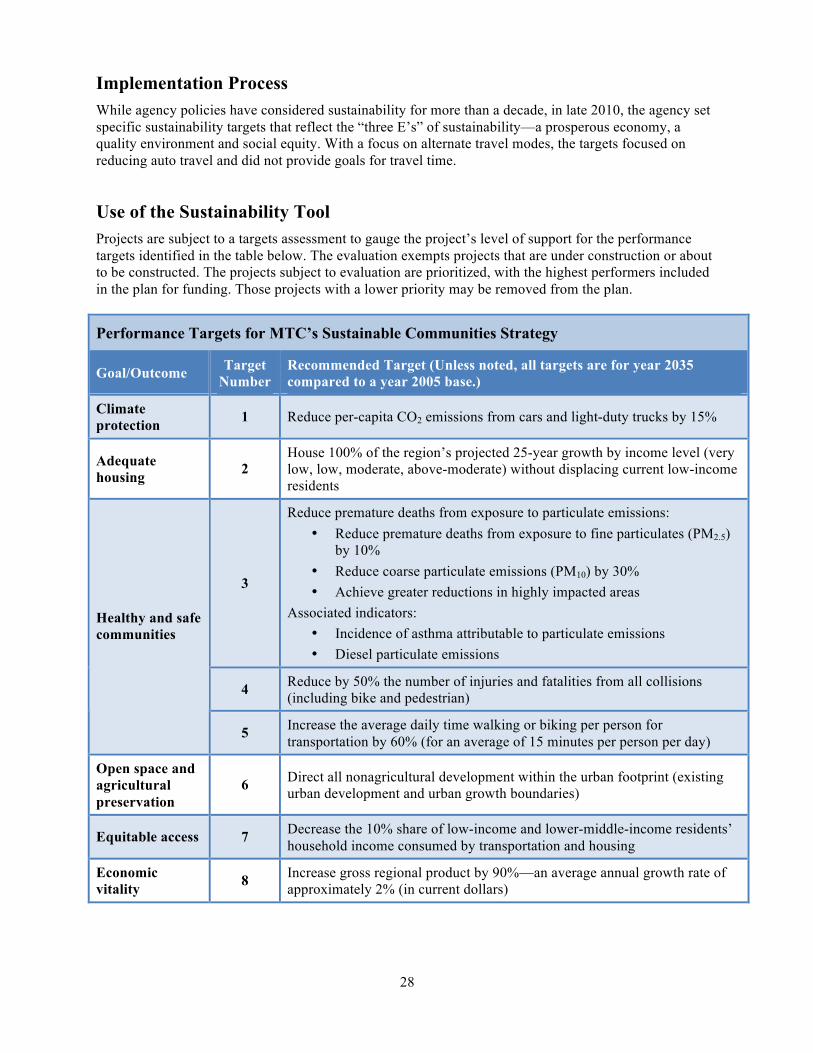
Implementation Process While agency policies have considered sustainability for more than a decade, in late 2010, the agency set specific sustainability targets that reflect the “three E’s” of sustainability—a prosperous economy, a quality environment and social equity. With a focus on alternate travel modes, the targets focused on reducing auto travel and did not provide goals for travel time.
Use of the Sustainability Tool Projects are subject to a targets assessment to gauge the project’s level of support for the performance targets identified in the table below. The evaluation exempts projects that are under construction or about to be constructed. The projects subject to evaluation are prioritized, with the highest performers included in the plan for funding. Those projects with a lower priority may be removed from the plan.
Performance Targets for MTC’s Sustainable Communities Strategy
Goal/Outcome Target Number
Recommended Target (Unless noted, all targets are for year 2035 compared to a year 2005 base.)
Climate protection 1 Reduce per-capita CO2 emissions from cars and light-duty trucks by 15%
Adequate housing 2
House 100% of the region’s projected 25-year growth by income level (very low, low, moderate, above-moderate) without displacing current low-income residents
3
Reduce premature deaths from exposure to particulate emissions: • Reduce premature deaths from exposure to fine particulates (PM2.5)
by 10% • Reduce coarse particulate emissions (PM10) by 30% • Achieve greater reductions in highly impacted areas
Associated indicators: • Incidence of asthma attributable to particulate emissions • Diesel particulate emissions
4 Reduce by 50% the number of injuries and fatalities from all collisions (including bike and pedestrian)
Healthy and safe communities
5 Increase the average daily time walking or biking per person for transportation by 60% (for an average of 15 minutes per person per day)
Open space and agricultural preservation
6 Direct all nonagricultural development within the urban footprint (existing urban development and urban growth boundaries)
Equitable access 7 Decrease the 10% share of low-income and lower-middle-income residents’ household income consumed by transportation and housing
Economic vitality 8 Increase gross regional product by 90%—an average annual growth rate of
approximately 2% (in current dollars)
29
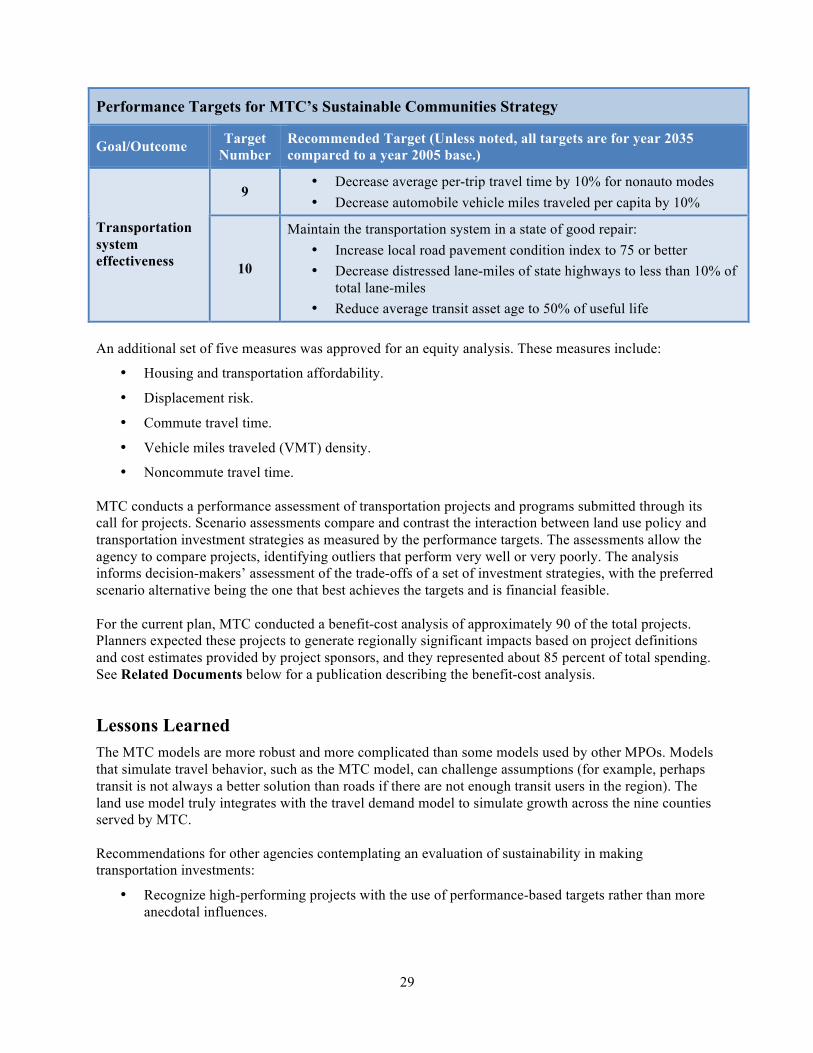
Performance Targets for MTC’s Sustainable Communities Strategy
Goal/Outcome Target Number
Recommended Target (Unless noted, all targets are for year 2035 compared to a year 2005 base.)
9 • Decrease average per-trip travel time by 10% for nonauto modes • Decrease automobile vehicle miles traveled per capita by 10%
Transportation system effectiveness 10
Maintain the transportation system in a state of good repair: • Increase local road pavement condition index to 75 or better • Decrease distressed lane-miles of state highways to less than 10% of
total lane-miles • Reduce average transit asset age to 50% of useful life
An additional set of five measures was approved for an equity analysis. These measures include:
• Housing and transportation affordability.
• Displacement risk.
• Commute travel time.
• Vehicle miles traveled (VMT) density.
• Noncommute travel time. MTC conducts a performance assessment of transportation projects and programs submitted through its call for projects. Scenario assessments compare and contrast the interaction between land use policy and transportation investment strategies as measured by the performance targets. The assessments allow the agency to compare projects, identifying outliers that perform very well or very poorly. The analysis informs decision-makers’ assessment of the trade-offs of a set of investment strategies, with the preferred scenario alternative being the one that best achieves the targets and is financial feasible. For the current plan, MTC conducted a benefit-cost analysis of approximately 90 of the total projects. Planners expected these projects to generate regionally significant impacts based on project definitions and cost estimates provided by project sponsors, and they represented about 85 percent of total spending. See Related Documents below for a publication describing the benefit-cost analysis.
Lessons Learned The MTC models are more robust and more complicated than some models used by other MPOs. Models that simulate travel behavior, such as the MTC model, can challenge assumptions (for example, perhaps transit is not always a better solution than roads if there are not enough transit users in the region). The land use model truly integrates with the travel demand model to simulate growth across the nine counties served by MTC. Recommendations for other agencies contemplating an evaluation of sustainability in making transportation investments:
• Recognize high-performing projects with the use of performance-based targets rather than more anecdotal influences.

30
• Begin with a good framework to build on and think long-term. Rather than developing a tool quickly, build on data accumulated over many years. Be willing to invest time and resources and navigate a steep learning curve to build and implement a model or tool that will address individual travel behaviors and patterns.
• For MTC, each geographic area prioritizes its own New Starts and Small Starts transit projects. It is most important to look at each project’s performance and not be constrained by a geographical identification and ranking of projects.
Related Documents Performance Targets for the Sustainable Communities Strategy/Regional Transportation Plan, One Bay Area, undated. http://www.onebayarea.org/pdf/PerfTargetsSCS-RTP.pdf This document provides the performance targets represented in the table on page 28 of this report. Targets Assessment Methodology, One Bay Area, undated. http://www.onebayarea.org/pdf/TPPA/Attachment_C_-_Targets_Assessment.pdf This document describes the methodology to assess the 10 Plan Bay Area targets. Included are guidelines for assessing projects and examples for each target. The guidelines were developed with input from MTC’s Partnership Technical Advisory Committee, the Regional Advisory Working Group, and the Ad Hoc Project Performance Assessment Technical Committee. Plan Bay Area Project Performance Assessment: Benefit-Cost Assessment Methodology, One Bay Area, February 6, 2012. http://www.onebayarea.org/pdf/SA1_BC_Methodology.pdf MTC calculated benefit-cost ratios for approximately 90 higher-cost projects with regionally significant impacts based on project definitions and cost estimates provided by projects sponsors. UrbanSim, January 12, 2013. http://www.urbansim.org/Main/WebHome From the website: UrbanSim is a software-based simulation system for supporting planning and analysis of urban development, incorporating the interactions between land use, transportation, the economy, and the environment. It is intended for use by Metropolitan Planning Organizations (MPOs), cities, counties, nongovernmental organizations, researchers and students interested in exploring the effects of infrastructure and policy choices on community outcomes such as motorized and nonmotorized accessibility, housing affordability, greenhouse gas emissions, and the protection of open space and environmentally sensitive habitats.
Contact Dave Vautin, Transportation Planner/Analyst, Metropolitan Transportation Commission, (510) 817-5709, [email protected].

31
Sacramento Area Council of Governments: Performance Measures
Background Sacramento Area Council of Governments (SACOG) is the MPO for the six-county, 22-city Sacramento region. SACOG engages in an 18-month update process for its regional transportation plan every four years. The 2012 plan was the first to include a sustainable communities strategy linking housing, land use and transportation.
Sustainability Tool Description SACOG looks at sustainability at a high level, not at a project level, beginning with the application of regional sustainability principles in its transportation plan. Next, the agency monitors performance measures at the system level. For its next plan in 2016, the agency expects to engage its partners and stakeholders to identify a method to apply measures at the project level. The measures now used may require modification before they can be applied to projects. Performance measures in place at the global level since development of the 2002 regional transportation plan include:
• VMT.
• Congestion.
• Transit services. Every plan adds new measures. In 2008, greenhouse gas emissions were expanded in response to SB 375; land use measures have grown over time. The agency will review existing performance measures to identify measures that can be added to the 2016 plan and consider how can they be monitored.
Implementation Process In the course of updating its current plan, SACOG held 24 focus groups and invited the public to nine public workshops plus additional public meetings for input on a preferred draft scenario. Focus groups convened at the beginning of the development process identified the performance measures that were most important to stakeholders and partners (federal, state and local agencies, and interest groups including builders, agricultural interests and social services). SACOG staff noted that some of the recommended measures were not related to the plan or required data that was not available. Measures and metrics were refined as input was gathered. A regional scorecard was used in public workshops to allow for side-by-side comparison of performance measures and outcomes by scenario. Staff observed heightened interest in measures related to active transportation and public health as stakeholders became more educated through the course of the process. Kacey Lizon, SACOG senior planner, reported that not all aspects of the goals or objectives identified by stakeholders can be measured.

32
Use of the Sustainability Tool In preparing its long-range transportation plan, SACOG examined regional transportation investment packages and compared land use scenarios to identify a preferred package of projects. Performance measures in the following categories were used to describe differences between scenarios:
• Land use.
• Transportation.
• Environmental.
• Environmental justice. The number of land use measures has been growing since the agency initiated its innovative Sacramento Region Blueprint in 2005. See Related Documents below for a publication presenting the 30 indicators and 60+ related measures associated with the 2012 regional transportation plan in the four categories identified above. Data needed to assess the performance measures used to examine transportation investment packages are available within SACOG or through the use of public datasets. As more data becomes available, new performance measures can be developed and existing measures can be examined in greater detail. A measure in the latest plan—farmland conversion—provides an example of the benefits of the availability of more detailed data. Over the last 10 years, the agency developed more detailed land use datasets in the urban area; in the last five years, rural land use data became available. In the current plan, using a measure that provides a ratio of the urban and rural datasets, planners identified a dramatically smaller farmland conversion ratio. The lower ratio is attributed to compact land use patterns and represents a dramatic improvement over previous years.
Lessons Learned The use of performance measures has improved the decision-making process, providing a three-dimensional view of the long-range plan and ensuring a connection between the performance measure and individual projects. The public now expects an extensive portfolio of performance measures when discussions begin in connection with a proposed regional transportation plan, and new measures are proposed during each new plan cycle. Lizon noted that creating a new performance measure requires a commitment of time and resources to support continued use of the measure. Data are needed to create the measure, and a tool, model or analytical framework is needed to manipulate the data for monitoring purposes. Stakeholders come to expect that new performance measures will be available to further aid in assessing a long-range plan, and an agency must be willing to commit the resources needed to develop and maintain these measures.
Related Documents Metropolitan Transportation Plan/Sustainable Communities Strategy, Sacramento Area Council of Governments, adopted April 19, 2012. http://www.sacog.org/2035/files/MTP-SCS/MTPSCS%20WEB.pdf

33
This is SACOG’s long-range plan. A discussion of new performance measures recommended by focus groups appears on page 19 of the PDF. Performance Measures for the MTP/SCS: Appendix G-6, Draft Final Metropolitan Transportation Plan/Sustainable Communities Strategy 2035, Sacramento Area Council of Governments, February 20, 2012. http://www.sacog.org/2035/files/Final-Draft-MTP/appendices/G-6%20MTP-SCS%20Performance%20Measures.pdf This table provides a quick reference to the range of measures used to assess the performance of SACOG’s long-range plan, and where in the plan the measure and related analysis may be found. Land Use Forecast Background Documentation: Appendix E-3, Draft Final Metropolitan Transportation Plan/Sustainable Communities Strategy 2035, Sacramento Area Council of Governments, February 20, 2012. http://www.sacog.org/2035/files/Final-Draft-MTP/appendices/E-3%20Land%20Use%20Forecast%20Background%20Documentation.pdf “Framework for a Draft Preferred MTP2035 Update Scenario” begins on page 13 of the PDF. From page 14 of the PDF:
The preparation of a draft preferred scenario represents the third round of scenario building. It will naturally evolve from the prior work, with more extensive input from our members and partner agencies, and more refined technical work to try to ensure that it is both realistic to implement and also produces strong performance benefits. The performance measures presented to the public during the nine public workshops in October showed some performance advantages of Scenario 3. Workshop participants in large majorities selected Scenario 3 as their preferred scenario, with notable variations in Sutter and Placer Counties, where there was more support for Scenario 2. Staff will begin the preparation of the draft preferred scenario from the foundation of Scenario 3, but expect there to be substantial blending of all three scenarios, and refinements that may not have been in included in any of the scenarios, as this next phase evolves.
Contact Kacey Lizon, Senior Planner, Sacramento Area Council of Governments, (916) 340-6265, [email protected].
San Francisco County Transportation Authority: Scoring Process
Background As part of its responsibilities for the long-range transportation planning for the city of San Francisco, the San Francisco County Transportation Authority (SFCTA) analyzes, designs and funds improvements for San Francisco’s roadway and public transportation networks.

34
Sustainability Tool Description In collaboration with Cambridge Systematics, Inc., the planning and technical services divisions of SFCTA developed a scoring process that uses results from its innovative travel demand model to evaluate enhancement and expansion projects for inclusion in its long-range plan, San Francisco Transportation Plan (SFTP). The scoring process applies at the planning and funding levels and does not assess project implementation. The scoring process prioritizes projects based in part on performance metrics that measure success in addressing the four goals for the county’s transportation system (see the table below). All four metrics are weighted equally.
San Francisco Transportation Plan Goals and Performance Metrics
SFTP Goal Performance Metric
Economic competitiveness Average motorized travel time per trip (travel time)
Livability Share of trips made by walking, bicycling and transit (mode share)
A healthy environment Greenhouse gas emissions
World-class infrastructure Level of crowding on transit lines (crowding) The county’s activity-based travel demand model, SF-CHAMP (San Francisco Chained Activity Modeling Process), provides the data for the quantitative metrics that contribute to the scoring process. However, SF-CHAMP can provide data to quantify the benefits of only certain types of projects. Examples of such projects include route extensions, new transit stations and road diets. Projects that cannot be modeled within SF-CHAMP include smaller-scale intersection improvement projects or streetscape improvements, pedestrian bulb-outs, tree plantings, light rail turnarounds and maintenance facilities for transit. For projects such as these, agency planners apply judgment informed by reviewing and interpreting results of prior studies. Sole use of the travel demand model to assess projects based on performance measures presented the agency with another challenge. The labor-intensive effort required to make multiple SF-CHAMP runs requires bundling of projects when applying the model, precluding the examination of projects on an individual basis.
Implementation Process SFCTA developed the scoring process for the recent update to the agency’s countywide transportation plan. The agency expects to use the process in connection with future updates of the plan. The scoring methodology was subject to multiple reviews before its use to score and rank projects for inclusion in plan scenarios. In the course of preparing the draft methodology for the scoring process, the project team encountered concerns that too much weight was given to the needs of rapidly developing areas of the city. To address this, existing and future transportation needs are treated equally in the model. Another adjustment to the draft scoring process addressed concerns about too heavily weighting projects that serve growth areas by balancing growth over time with performance in any given year. Staff were also concerned with finding the right balance to ensure that larger projects that serve many markets did not preclude the inclusion in the plan of smaller projects serving fewer travel markets. A

35
gap analysis ensured that the draft plan included projects intended to address all travel markets with the greatest transportation needs and potential for cost-effective improvement. The walking/bicycling community raised concerns about the lack of a rigorous review of programmatic improvements that were not part of a capital expansion. An additional evaluation of projects was undertaken to assess improvements associated with pedestrians and biking.
Use of the Sustainability Tool The framework developed for use in the most recent update of the countywide plan applies a scoring process to rank and sort projects into tiers. The scoring process adopted by SFCTA blends quantitative results based on output from SF-CHAMP with qualitative information from prior studies. Projects excluded from the prioritizing process include projects under construction or fully funded projects; previously evaluated and rejected projects; nontransportation projects; programmatic improvements that are low-cost, lacking a complete project description or other small-scale projects; and projects difficult to evaluate using traditional tools. Each project is assigned a “benefit score” that represents how well the project contributes to the transportation plan goals. The benefit score is the product of three subscores:
• Market subscore. This score, which ranges from 1 to 3, reflects how many of the area’s approximately 200 travel markets are potentially affected by the project.
• Problem subscore. Ranging from 1 to 3, this score addresses the severity of current and future transportation needs in the primary travel market that will be served by the candidate project, with 1 indicating the least severe problem and 3 indicating the highest severity.
• Effect subscore. This score, which ranges from -1 to 2, reflects the degree to which the project would improve transportation performance in each of the four goal areas. A score of -1 indicates that the project makes the problem worse; a score of 1 indicates a positive effect; and a score of 2 indicates a strongly positive effect.
Project costs are considered in the second step in the scoring process. Capital and operating costs for each project are annualized by dividing the total capital cost by the project’s useful life. The annualized capital cost is added to the average incremental (new) operating cost to obtain the average total cost per year. A final proxy benefit/cost index for each project is calculated by dividing the project’s benefit score by the annualized project cost. To identify project benefits that cannot be measured through results of SF-CHAMP modeling, SFCTA staff examine other considerations that contribute to the plan’s four goals. Examples of such considerations include safety, operational benefits, support for growth in a Priority Development Area and projects that support the equity goal. The three scores plus the annualized cost of each project are used to place projects into four tiers (high, middle-high, middle-low and low). The resulting project tiers provide a starting point for identifying projects to include in plan scenarios that will be presented for advisory committee review and public comment. Projects in the high tier are expected to make the greatest contribution to the four SFTP goals (economic competitiveness, livability, a healthy environment and world-class infrastructure) relative to their costs.

36
Lessons Learned It is too early for SFCTA to determine the efficacy of the scoring process. However, stakeholders have found scoring results to be relatively intuitive. The scoring model is expected to continue to inform policy-making decisions associated with adoption of the new plan. Recommendations arising from SFCTA’s experience include:
• Incorporate a strong public outreach effort. This practice strengthened the agency’s effort, serving as one of the most effective ways to shape the plan.
• A tool to quantify the assessment can be extremely helpful, providing an intuitive way for planners and others to contemplate what goes into the plan and offering the benefits of a rational methodology. Be prepared to devote the time and energy needed to develop an effective tool.
• Incorporating sustainability into transportation planning is more of an art than a science; tweak the process until the results seem intuitive.
• Do not lose sight of the values component, which can be more significant than a technical monetization.
• Ensure that at least some analysis has been completed before beginning a robust outreach campaign to identify the values to measure and how they should be weighted.
• The benefits of the agency’s travel demand model cannot be overstated. The model provides the metrics that underlie the scoring process for many of the projects included in the plan.
• The team cautions against taking tools or practices developed by another agency and attempting to apply them elsewhere. Each agency’s context informs how a tool develops. For example, the progressive nature of San Francisco and the Bay Area is a significant factor in how the transportation plan is structured and the values the plan supports. In recognition of this, the primary metrics of the scoring process are progressive and become a critical feature of the model.
Related Documents Draft SFTP Project Performance Evaluation Results, Memo to SFTP Community Advisory Committee, San Francisco County Transportation Authority, September 19, 2012. http://www.sfcta.org/sites/default/files/content/Planning/SFTP2/CallforProjects_Oct12/Project%20Evaluation%20Memo%20CAC%209.19.12.pdf This memo focuses on the ranked projects included in the SFTP and describes the process of evaluating expansion and enhancement projects for inclusion in the plan. “An Innovative Approach to Prioritizing Projects for San Francisco's Countrywide Plan,” Ryan Greene-Roesel, Rachel Hiatt, Checkpoint, TRB Committee on Performance Measurement (ABC30), Summer 2012. http://trbperformance.org/node/652 This brief article describes the development of SFCTA’s scoring process. Project Tier Justification: Part 1, San Francisco County Transportation Authority, undated. See Appendix D This spreadsheet shows how projects in the middle-high and high tiers performed in connection with the project evaluation conducted for the current plan.
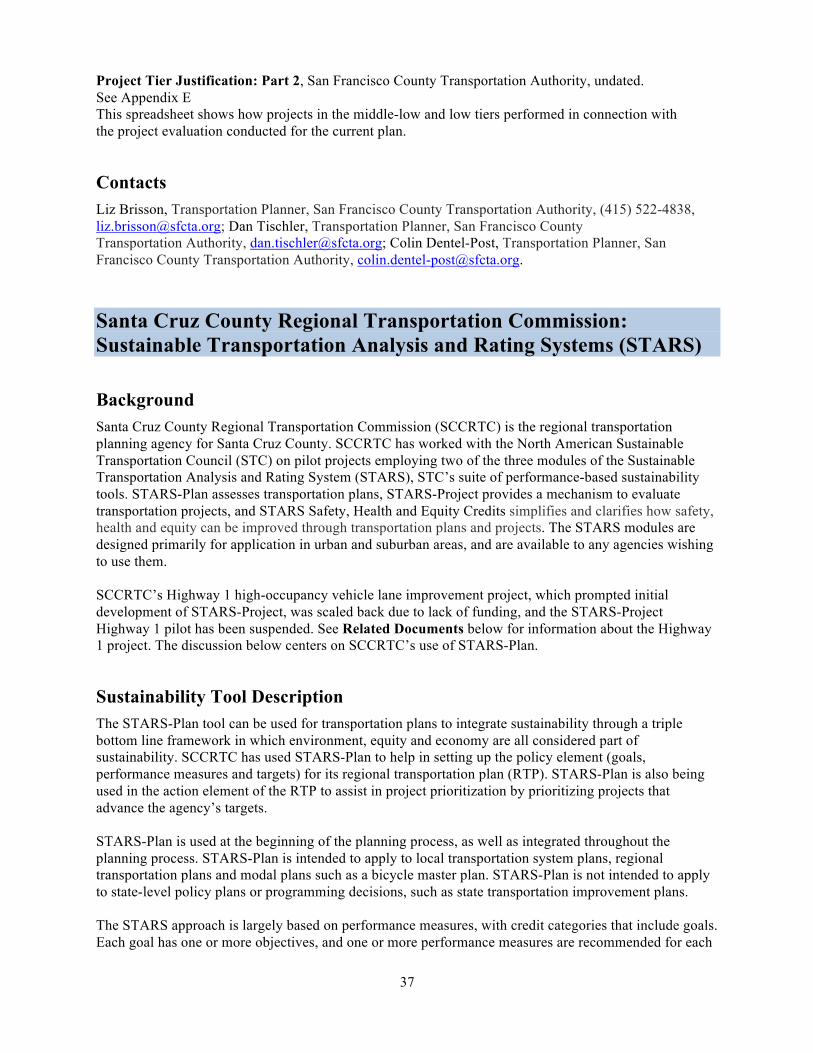
37
Project Tier Justification: Part 2, San Francisco County Transportation Authority, undated. See Appendix E This spreadsheet shows how projects in the middle-low and low tiers performed in connection with the project evaluation conducted for the current plan.
Contacts Liz Brisson, Transportation Planner, San Francisco County Transportation Authority, (415) 522-4838, [email protected]; Dan Tischler, Transportation Planner, San Francisco County Transportation Authority, [email protected]; Colin Dentel-Post, Transportation Planner, San Francisco County Transportation Authority, [email protected].
Santa Cruz County Regional Transportation Commission: Sustainable Transportation Analysis and Rating Systems (STARS)
Background Santa Cruz County Regional Transportation Commission (SCCRTC) is the regional transportation planning agency for Santa Cruz County. SCCRTC has worked with the North American Sustainable Transportation Council (STC) on pilot projects employing two of the three modules of the Sustainable Transportation Analysis and Rating System (STARS), STC’s suite of performance-based sustainability tools. STARS-Plan assesses transportation plans, STARS-Project provides a mechanism to evaluate transportation projects, and STARS Safety, Health and Equity Credits simplifies and clarifies how safety, health and equity can be improved through transportation plans and projects. The STARS modules are designed primarily for application in urban and suburban areas, and are available to any agencies wishing to use them. SCCRTC’s Highway 1 high-occupancy vehicle lane improvement project, which prompted initial development of STARS-Project, was scaled back due to lack of funding, and the STARS-Project Highway 1 pilot has been suspended. See Related Documents below for information about the Highway 1 project. The discussion below centers on SCCRTC’s use of STARS-Plan.
Sustainability Tool Description The STARS-Plan tool can be used for transportation plans to integrate sustainability through a triple bottom line framework in which environment, equity and economy are all considered part of sustainability. SCCRTC has used STARS-Plan to help in setting up the policy element (goals, performance measures and targets) for its regional transportation plan (RTP). STARS-Plan is also being used in the action element of the RTP to assist in project prioritization by prioritizing projects that advance the agency’s targets. STARS-Plan is used at the beginning of the planning process, as well as integrated throughout the planning process. STARS-Plan is intended to apply to local transportation system plans, regional transportation plans and modal plans such as a bicycle master plan. STARS-Plan is not intended to apply to state-level policy plans or programming decisions, such as state transportation improvement plans. The STARS approach is largely based on performance measures, with credit categories that include goals. Each goal has one or more objectives, and one or more performance measures are recommended for each
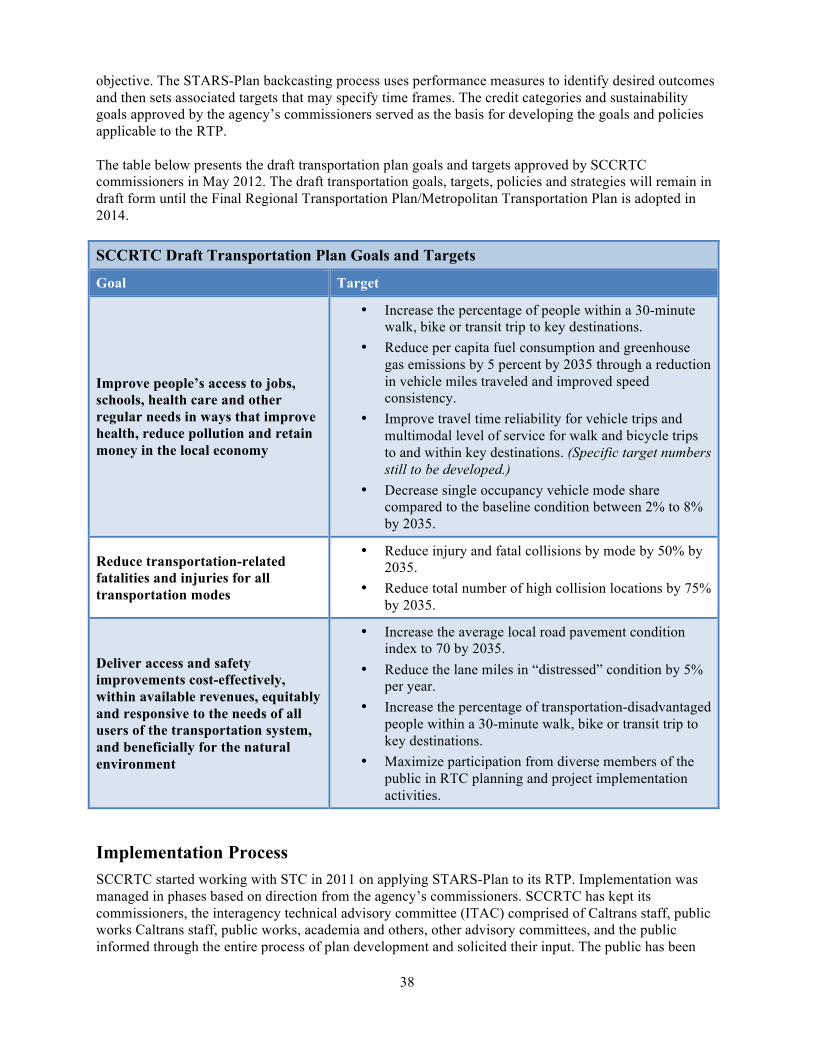
38
objective. The STARS-Plan backcasting process uses performance measures to identify desired outcomes and then sets associated targets that may specify time frames. The credit categories and sustainability goals approved by the agency’s commissioners served as the basis for developing the goals and policies applicable to the RTP. The table below presents the draft transportation plan goals and targets approved by SCCRTC commissioners in May 2012. The draft transportation goals, targets, policies and strategies will remain in draft form until the Final Regional Transportation Plan/Metropolitan Transportation Plan is adopted in 2014.
SCCRTC Draft Transportation Plan Goals and Targets
Goal Target
Improve people’s access to jobs, schools, health care and other regular needs in ways that improve health, reduce pollution and retain money in the local economy
• Increase the percentage of people within a 30-minute walk, bike or transit trip to key destinations.
• Reduce per capita fuel consumption and greenhouse gas emissions by 5 percent by 2035 through a reduction in vehicle miles traveled and improved speed consistency.
• Improve travel time reliability for vehicle trips and multimodal level of service for walk and bicycle trips to and within key destinations. (Specific target numbers still to be developed.)
• Decrease single occupancy vehicle mode share compared to the baseline condition between 2% to 8% by 2035.
Reduce transportation-related fatalities and injuries for all transportation modes
• Reduce injury and fatal collisions by mode by 50% by 2035.
• Reduce total number of high collision locations by 75% by 2035.
Deliver access and safety improvements cost-effectively, within available revenues, equitably and responsive to the needs of all users of the transportation system, and beneficially for the natural environment
• Increase the average local road pavement condition index to 70 by 2035.
• Reduce the lane miles in “distressed” condition by 5% per year.
• Increase the percentage of transportation-disadvantaged people within a 30-minute walk, bike or transit trip to key destinations.
• Maximize participation from diverse members of the public in RTC planning and project implementation activities.
Implementation Process SCCRTC started working with STC in 2011 on applying STARS-Plan to its RTP. Implementation was managed in phases based on direction from the agency’s commissioners. SCCRTC has kept its commissioners, the interagency technical advisory committee (ITAC) comprised of Caltrans staff, public works Caltrans staff, public works, academia and others, other advisory committees, and the public informed through the entire process of plan development and solicited their input. The public has been

39
involved at many steps in development of the policy and action elements of the RTP through workshops, surveys and online input. The agency continues its development of the STARS-Plan sustainability tool with STC, and plans to use STARS-Plan for a corridor investment study this year as funded by Caltrans.
Using the Sustainability Tool While sustainability is often viewed as limited to environmental sustainability, Ginger Dykaar, SCCRTC transportation planner, notes that sustainability more appropriately applies to the triple bottom line in which environment, equity and economy are all considered a part of sustainability. The performance measures most critical for SCCRTC in addressing all three bottom-line considerations include:
• Reducing VMT.
• Improving access through coordinated land use and transportation for all users.
• Reducing the number of collisions and fatalities.
• Maintaining the transportation system. The agency has not yet formally incorporated sustainability into the programming of funding for projects but has used sustainability considerations informally. SCCRTC is developing its project list and determining which projects will be constrained versus unconstrained. SCCRTC is finalizing methodologies for forecasting the benefits of its projects. The methodologies rely on data from the U.S. Census, the Statewide Integrated Traffic Records System, GIS databases of roadways, the Caltrans Performance Measurement System, regional travel demand model inputs and more. The agency is limited in what it can forecast by data constraints and limits associated with its modeling efforts. In addition to its use in establishing and assessing the RTP, and evaluating financially constrained and unconstrained projects, STARS-Plan can also be used establish and assess local transportation plans and for network and corridor evaluation.
Lessons Learned It is too early for SCCRTC to draw conclusions about the effectiveness of STARS-Plan in incorporating sustainability in its RTP. However, the agency has identified challenges associated with data availability and keeping the methodology simple enough to incorporate within a reasonable time frame but detailed enough to make a difference in project selection. In terms of successes, the agency notes that use of STARS-Plan has increased awareness among commissioners, project sponsors and the public of the need to adopt sustainability practices in long-range transportation plans. Dykaar advises other agencies wishing to implement a sustainability tool to realize that incorporating sustainability in transportation decision-making is a process to move toward. First attempts may fail to consider all relevant issues. Focus on accomplishing the things that agency resources will allow and recognize that after reviewing the entire process, an agency can more readily identify where adjustments can be made for more effective future plan development.

40
Related Documents Sustainable Transportation Analysis & Rating System (STARS-Plan), Introduction, Pilot Plan Application Manual, Version 1.0, North American Sustainable Transportation Council, Portland Bureau of Transportation, January 10, 2012. http://www.transportationcouncil.org/wp-content/uploads/2011/12/Plan_Report_Introduction.pdf STARS-Plan is one of three STARS tools that have been developed: STARS-Project for transportation projects; STARS-Plan for transportation plans; and the STARS Safety, Health, and Equity Tool. STARS-Plan is being developed in three phases. This report is the result of the first phase. At this time, STARS-Plan consists of credit categories, goals and objectives. The second phase of STARS-Plan will establish the requirements and methods needed to meet the goals and objectives outlined in the credit framework. The third phase involves training transportation planners to use STARS-Plan and developing a certification process to rate transportation plans using the STARS framework. “Developing a Comprehensive Sustainable Transportation Analysis Framework,” George Dondero, Kelly Rodgers, Peter T. Hurley, TRB 92nd Annual Meeting Compendium of Papers DVD, Paper #13-0348, 2013. http://sccrtc.org/wp-content/uploads/2010/12/TRB-STARS-Paper-121115-GD-revision.-Final.pdf From the abstract: STARS provides a suite of credits incorporating tools and guidance based upon triple bottom line principles. Backcasting is used to establish desired future outcomes, rather than the more traditional forecasting process. STARS uses performance measures to analyze all transport modes and strategies. A pilot project in Santa Cruz County, California is highlighted. Performance monitoring will determine whether the system changes practices and outcomes. Revised Draft Regional Transportation Plan Goals, Targets and Policies—Santa Cruz County Components of the Metropolitan Transportation Plan, Memo to Regional Transportation Commission (RTC) Transportation Policy Workshop, Santa Cruz County Regional Transportation Commission, May 17, 2012. http://sccrtc.org/wp-content/uploads/2010/12/StaffReport_TPWDraftGoalsPolicies.pdf This memo describes the draft transportation plan goals, targets, policies, and strategies recommended by SCCRTC staff and includes comments received in connection with the proposal. STARS, Multi-Modal Projects, Santa Cruz County Regional Transportation Commission, undated. http://sccrtc.org/projects/multi-modal/stars/ This Web page offers information about the collaboration between SCCRTC and a team of STARS developers to use the Highway 1 high-occupancy vehicle lane project as a test bed for developing 12 credits of a total of 28 planned to comprise the fully operational STARS program. Related resources:
Sustainable Transportation Analysis and Rating System (STARS-Project), Pilot Project Application Manual, Version 1.1, North American Sustainable Transportation Council, Portland Bureau of Transportation, February 6, 2011. http://sccrtc.org/wp-content/uploads/2011/04/STARS-Pilot-Project-Application-Manual.pdf STARS is a planning and evaluation tool for transportation projects that evaluates multimodal access benefits and costs over the full life cycle, including operations, where most of a project’s benefits and impacts occur. STARS is organized into 29 “credits,” 12 of which are detailed in this manual. Not all credits are applicable to or realistic for all projects, so only a portion of the credits are required for a given project.

41
Fact Sheet, STARS (Sustainable Transportation Access Rating System), Santa Cruz County Regional Transportation Commission, April 2011. http://sccrtc.org/wp-content/uploads/2011/04/042011-STARS-Fact-Shee.pdf This document summarizes the now-suspended pilot project and the 12 credits originally planned for use in the analysis of the Highway 1 improvement project.
Contact Ginger Dykaar, Transportation Planner, Santa Cruz County Regional Transportation Commission, (831) 460-3213, [email protected].
National Sustainability Tools
To supplement a review of sustainability tools and practices employed by state and regional transportation agencies, we examined two tools developed by national organizations:
• Infrastructure Voluntary Evaluation Sustainability Tool (INVEST), developed by the Federal Highway Administration (FHWA).
• Land Use and Transportation Scenario Analysis and Microsimulation (LUTSAM), developed by the State Smart Transportation Initiative in conjunction with the Delaware Department of Transportation.
Of the two tools, INVEST appears to be most relevant to the type of sustainability assessment of interest to Caltrans.
Infrastructure Voluntary Evaluation Sustainability Tool (INVEST)
Background FHWA launched Infrastructure Voluntary Evaluation Sustainability Tool (INVEST) 1.0 in October 2012 after several years of testing and piloting the tool with experts and transportation agencies across the country. Described as a “practical, Web-based collection of voluntary best practices and criteria designed to help transportation agencies integrate sustainable practices into their projects, plans and programs,” the tool can be used by transportation agencies—state DOTs, municipal planning organizations, federal lands and local governments—to assess the sustainability of current practices and estimate the benefits of improved practices.
Sustainability Tool Description The tool includes 60 criteria organized into three modules:
• System planning. An agency’s systemwide network is evaluated in this module that includes 16 criteria plus one bonus criterion. One scorecard is used for all criteria.
• Project development. This module is used for specific projects that are conceptualized and programmed. Twenty-nine criteria are organized into six scorecards used to evaluate projects based on project type and location. The scorecards include:
42
o Paving. Paving projects in both rural and urban locations.
o Basic Rural. Small, rural reconstruction or rural bridge replacement projects that do not expand capacity of the roadway.
o Basic Urban. Small, urban reconstruction or urban bridge replacement projects that do not expand capacity of the roadway.
o Extended Rural. Rural projects for a new roadway facility; new structures; and major reconstruction projects that add travel lanes to an existing roadway or bridge.
o Extended Urban. Urban projects for a new roadway facility; new structures; and major reconstruction projects that add travel lanes to an existing roadway or bridge.
o Custom. For projects that do not fit the other five scorecards. Includes a core set of 19 criteria that must be included as part of the score.
The six scorecards include different combinations of the 29 criteria based on the project type, ranging from a high of all 29 criteria included in the Extended Urban scorecard to a low of 12 criteria included in the Paving scorecard.
• Operations and maintenance. For the third step in the life cycle of a transportation project, this module includes 14 criteria applied to one scorecard, with four aimed at internal operations and 10 focused on maintenance and operations of the highway system.
Focused on highways and transportation, the INVEST tool is based on ideas from other tools such as New York State DOT’s GreenLITES transportation environmental sustainability rating program, Illinois DOT’s I-LAST (see page 12 of this report for more information about I-LAST), and Greenroads, a sustainability rating system for roadway design and construction. The tool is free to use and voluntary, and provides agencies with “an opportunity to quantify sustainability and put it on an equal footing with other performance measures in the decision making process but does not in any way attempt to mandate values or choices.”
Implementation Process To encourage the use of INVEST, FHWA is making available a limited pool of funding for partner agencies wishing to implement INVEST and work with FHWA to identify lessons learned from the implementation process. FHWA anticipates partnering with approximately 12 transportation agencies on the implementation projects. Interested agencies submitted letters of interest to be considered for the initial round of funding in March 2013. Some of the agencies participating in the 2011 FHWA pilot of an earlier version of INVEST have expressed interest in partnering with FHWA on implementing INVEST 1.0. Decisions on funding had not yet been made at the time of publication. Awards are expected to range from $25,000 to $150,000 based on the funding available. Participants are expected to provide a final report describing the INVEST implementation project that can be shared with other agencies.
Use of the Sustainability Tool INVEST can be used to evaluate performance after projects are completed or constructed. The tool can also be used to consider ideas during project planning and development. Such evaluation can occur at each phase of a project—conceptual design, preliminary design, or final design and construction.

43
Lessons Learned FHWA anticipates gathering benefit-cost data based on pilot projects to better understand the relationship between sustainable practices and costs. Any major revisions to Version 1.0 are not expected for at least a year.
Related Documents INVEST Version 1.0, FHWA, undated. https://www.sustainablehighways.org/ This website provides a guided tour that explains why and how sustainability is measured. Browse through INVEST’s 60 criteria organized by module, or log in to score a project or program. FAQ, INVEST, FHWA, undated. https://www.sustainablehighways.org/140/faq.html Check this website for answers to the frequently asked questions collected during the development of Version 1 of INVEST. Solicitation for INVEST Implementation Projects, FHWA, undated. http://www.fhwa.dot.gov/environment/climate_change/sustainability/self-evaluation_tool/solicitation.cfm Learn more about FHWA’s interest in partnering with state DOTs, metropolitan planning organizations, federal lands and local governments on implementing INVEST 1.0 to assess and enhance the sustainability of their projects and programs.
Contact Tina Hodges, Environmental Protection Specialist, Sustainable Transport and Climate Change Team, Federal Highway Administration, (202) 366-4287, [email protected].
Land Use and Transportation Scenario Analysis and Microsimulation (LUTSAM)
Background The State Smart Transportation Initiative provided technical assistance to the Delaware Department of Transportation to develop LUTSAM (Land Use and Transportation Scenario Analysis and Microsimulation). This tool integrates geographic information systems, transportation modeling and microsimulation software to accelerate scenario development and analysis and demonstrate the benefits of smart growth policies that encourage compact, mixed-use development and quantify bicycle and pedestrian-related mobility improvements.
Sustainability Tool Description LUTSAM is intended to improve current four-step and advanced travel demand models to work at the parcel and building levels. The tool can be used to design new residential and commercial developments using standard GIS software, connecting the development to the existing road network to assess its impact on travel patterns. LUTSAM streamlines the process of linking these developments to the road network and, with the use of 3-D microsimulation software, shows congestion, queuing and other traffic patterns.
44
Model inputs include highway and sidewalk networks, demographics, buildable region layers (tax parcels, land use, environmental and topographical considerations) and base map layers. Developed as a GIS extension, the user prepares scenarios for evaluation, concluding the development process by connecting homes and sidewalks to the roadway and sidewalk network and merging the new roadway/sidewalk network with the original model networks. “Development of the State Smart Transportation Initiative’s DelDOT 3-D Micro Model Process - A Scenario Planning Tool to Evaluate Urban Form, Land Use, and Multimodal Investment Impacts on Mobility,” Scott Thompson-Graves, Michael DuRoss, Rafey Subhani, Bill Holloway, Eric Sundquist, undated. http://www.ssti.us/wp/wp-content/uploads/2012/06/LUTSAM_TRB_Paper_version-9.pdf This paper describes the LUTSAM GIS application, the travel demand process, microsimulation and case studies that quantify the community impacts of differing development styles. Land Use and Transportation Scenario Analysis and Microsimulation User’s Manual: SSTI 3D Micro Modeling Process, Whitman, Requardt & Associates, LLP, Delaware Department of Transportation, State Smart Transportation Initiative, undated. http://www.ssti.us/wp/wp-content/uploads/2012/06/LUTSAM-Users-Manual.pdf This is the user manual for the LUTSAM application, which estimates future land forms based upon various residential development patterns and proposed commercial and industrial land uses.
Contact Eric Sundquist, State Smart Transportation Initiative at the Center on Wisconsin Strategy, University of Wisconsin–Madison, (608) 265-6155, [email protected].

Pla
nn
ing
De
liv
ery
Vis
ion
N.C. Department of Transportation
Performance Accountability Framework
Results
Business Unit
Work Plans
(Division Performance)
MeasuresPriorities
PDAs
Prioritization Results
and
Program & Resource
Plan (10-Year)
2040 Plan
05/02/12
C
on
tin
uo
us
Im
pro
ve
me
nt
& In
no
va
tio
n
(Employee Performance)
1-Year Spend Plan
Public
Dashboard
&
Performance
Scorecard
Principles & ObjectivesMission & Goals
Internal Management
Dashboard
Quarterly Business
Unit Results
Annual Employee
Results
Work Program(5-Year)
Executive Performance
Measures & Targets
(NCDOT Performance)
Situational Reports
Kim
Typewritten Text
APPENDIX A

Draft Blueprint – May 9, 2012
Italicized text indicates measures/strategies not currently being implemented by the Department
CHOICES: Choice in how to travel Objectives (The WHAT) Performance Measures (The EVALUATION) Example Strategies (The HOW)
Expand and enhance alternatives to automobile travel
Improve intermodal connectivity
Reduce growth rate of single-‐occupancy vehicle (SOV) travel
• Percentage increase in public transit ridership • VMT per capita
• Number of transit route miles (urban, rural, regional) • Miles each of greenways, designated bike lanes, and
sidewalks • Percent of buses/trains with bike racks • Number of non-‐general-‐purpose lane miles (e.g. HOT,
HOV, bus on shoulder)
• Complete Streets • Transportation Demand Management
Program • Passenger Rail (Piedmont
Improvement Program) • Statewide Bicycle and Pedestrian Plan
CONNECTIVITY: Integration of transportation and land use Objectives (The WHAT) Performance Measures (The EVALUATION) Example Strategies (The HOW)
Enhance transportation network connectivity
Improve pedestrian and bicycle linkages to activity centers
Encourage comprehensive planning at the state, regional, and local levels
Invest in multimodal, mixed-‐use transit centers
Reduce average trip length
• Number of areas with a bicycle/pedestrian plan
• Average density of sidewalk mileage within municipalities that have pedestrian plans
• Number of CTPs adopted annually by NCDOT
• Statewide Bicycle and Pedestrian Plan • Comprehensive Transportation
Planning • Complete Streets • Interagency Leadership Team • Healthy Environments Collaborative • Governor’s Logistics Task Force • Intermodal station projects • Interagency Policy Advisory Group
• Quantify the economic benefits of NCDOT’s investment in TOD projects
RESOURCE PROTECTION: Protection and conservation of natural resources Objectives (The WHAT) Performance Measures (The EVALUATION) Example Strategies (The HOW)
Improve air quality and reduce transportation-‐related emissions
Protect and enhance water quality
Increase energy and water conservation and efficiency
Conserve high-‐quality ecosystem services
Enhance “3 R” (reduce, reuse, and recycle) efforts
• Average score for erosion control/environmental permit compliance
• Overall condition rating and/or level of service for stormwater devices
• Number of ICAs, PCNs, NOVs issued • Average energy efficiency rating of NCDOT buildings
(BTU/SQFT) • Percent reduction in metered water consumption • Gallons of fuels purchased by NCDOT, by fuel type • Average environmental compliance score for
construction and maintenance projects • Percent of management plans implemented for
endangered species sites • Tons of reused and recycled office material • Tons of reutilized materials on construction and
maintenance projects
• Interagency Leadership Team • Stormwater Pollution Prevention
Plan • Alternative Fuels Program • TranSHARE • Delegated environmental programs • Resource conservation and 3R
programs • Performance Contracting • Facility Condition Assessment
Program
MOVING PEOPLE AND GOODS: Efficient transportation network Objectives (The WHAT) Performance Measures (The EVALUATION) Example Strategies (The HOW)
Improve the reliability of all modes of transportation
Reduce congestion
Reduce travel times
• Percentage of ferry boardings completed as scheduled • Percentage of passenger train boardings completed on
schedule • Department infrastructure health score • Travel time index for surveyed roadways • Average statewide accident clearance time • Average operating speeds on surveyed roadways
• Average operating speeds of freight rail movement
• Governor’s Logistics Task Force • Low-‐Impact Bridge Replacement
Program • Intelligent Transportation System
Strategic Deployment • Passenger Rail • Mobility Fund
Kim
Typewritten Text
APPENDIX B
Kim
Typewritten Text
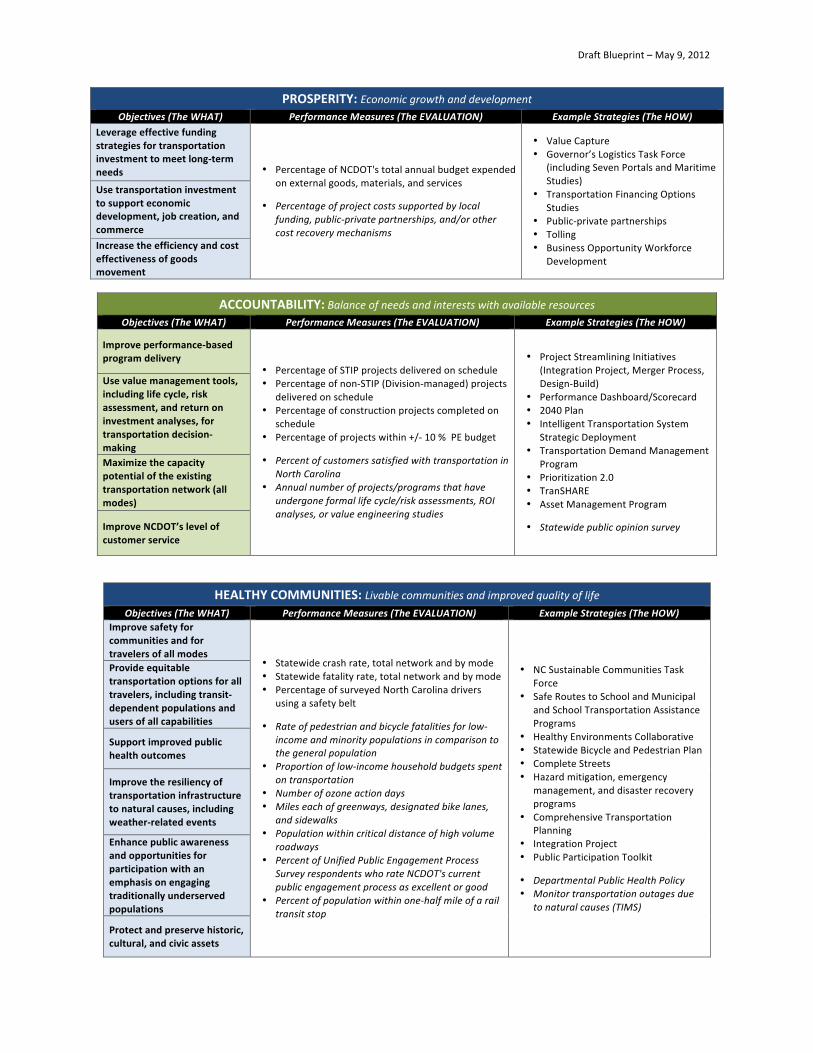
Draft Blueprint – May 9, 2012
Italicized text indicates measures/strategies not currently being implemented by the Department
PROSPERITY: Economic growth and development Objectives (The WHAT) Performance Measures (The EVALUATION) Example Strategies (The HOW)
Leverage effective funding strategies for transportation investment to meet long-‐term needs
Use transportation investment to support economic development, job creation, and commerce
Increase the efficiency and cost effectiveness of goods movement
• Percentage of NCDOT's total annual budget expended on external goods, materials, and services
• Percentage of project costs supported by local funding, public-‐private partnerships, and/or other cost recovery mechanisms
• Value Capture • Governor’s Logistics Task Force
(including Seven Portals and Maritime Studies)
• Transportation Financing Options Studies
• Public-‐private partnerships • Tolling • Business Opportunity Workforce
Development
ACCOUNTABILITY: Balance of needs and interests with available resources Objectives (The WHAT) Performance Measures (The EVALUATION) Example Strategies (The HOW)
Improve performance-‐based program delivery
Use value management tools, including life cycle, risk assessment, and return on investment analyses, for transportation decision-‐making Maximize the capacity potential of the existing transportation network (all modes)
Improve NCDOT’s level of customer service
• Percentage of STIP projects delivered on schedule • Percentage of non-‐STIP (Division-‐managed) projects
delivered on schedule • Percentage of construction projects completed on
schedule • Percentage of projects within +/-‐ 10 % PE budget
• Percent of customers satisfied with transportation in North Carolina
• Annual number of projects/programs that have undergone formal life cycle/risk assessments, ROI analyses, or value engineering studies
• Project Streamlining Initiatives (Integration Project, Merger Process, Design-‐Build)
• Performance Dashboard/Scorecard • 2040 Plan • Intelligent Transportation System
Strategic Deployment • Transportation Demand Management
Program • Prioritization 2.0 • TranSHARE • Asset Management Program
• Statewide public opinion survey
HEALTHY COMMUNITIES: Livable communities and improved quality of life
Objectives (The WHAT) Performance Measures (The EVALUATION) Example Strategies (The HOW) Improve safety for communities and for travelers of all modes Provide equitable transportation options for all travelers, including transit-‐dependent populations and users of all capabilities
Support improved public health outcomes
Improve the resiliency of transportation infrastructure to natural causes, including weather-‐related events
Enhance public awareness and opportunities for participation with an emphasis on engaging traditionally underserved populations
Protect and preserve historic, cultural, and civic assets
• Statewide crash rate, total network and by mode • Statewide fatality rate, total network and by mode • Percentage of surveyed North Carolina drivers
using a safety belt
• Rate of pedestrian and bicycle fatalities for low-‐income and minority populations in comparison to the general population
• Proportion of low-‐income household budgets spent on transportation
• Number of ozone action days • Miles each of greenways, designated bike lanes,
and sidewalks • Population within critical distance of high volume
roadways • Percent of Unified Public Engagement Process
Survey respondents who rate NCDOT's current public engagement process as excellent or good
• Percent of population within one-‐half mile of a rail transit stop
• NC Sustainable Communities Task Force
• Safe Routes to School and Municipal and School Transportation Assistance Programs
• Healthy Environments Collaborative • Statewide Bicycle and Pedestrian Plan • Complete Streets • Hazard mitigation, emergency
management, and disaster recovery programs
• Comprehensive Transportation Planning
• Integration Project • Public Participation Toolkit
• Departmental Public Health Policy • Monitor transportation outages due
to natural causes (TIMS)
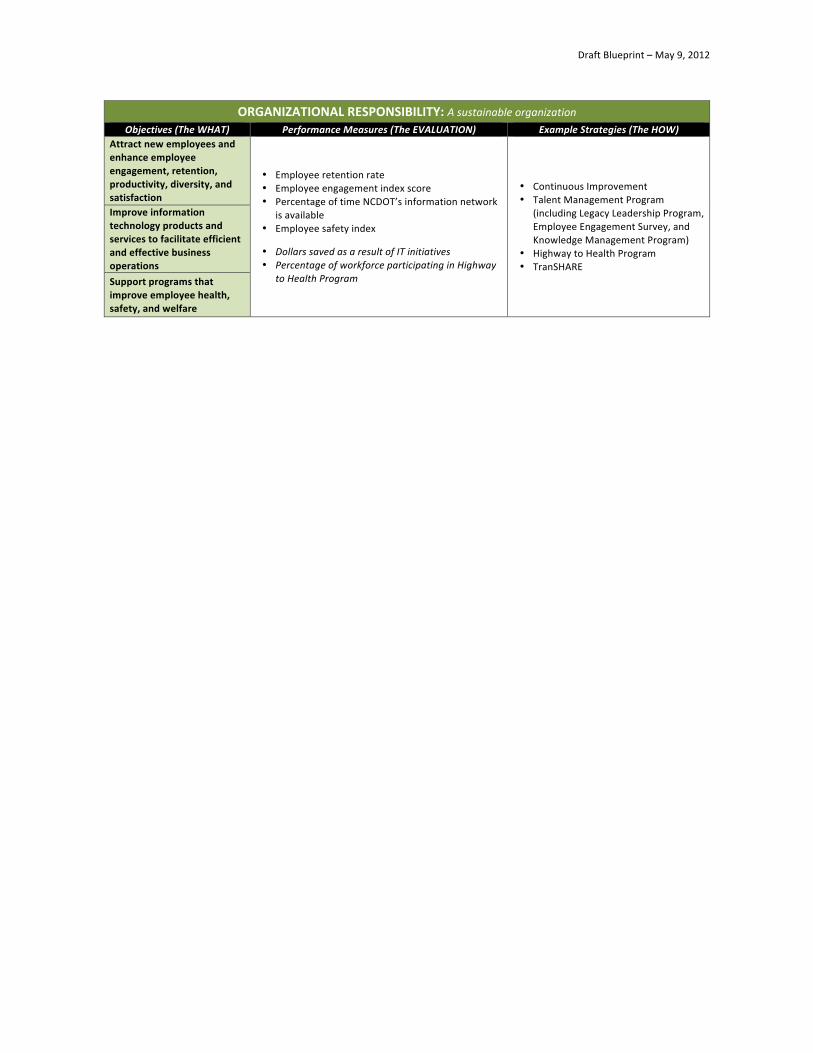
Draft Blueprint – May 9, 2012
Italicized text indicates measures/strategies not currently being implemented by the Department
ORGANIZATIONAL RESPONSIBILITY: A sustainable organization Objectives (The WHAT) Performance Measures (The EVALUATION) Example Strategies (The HOW)
Attract new employees and enhance employee engagement, retention, productivity, diversity, and satisfaction Improve information technology products and services to facilitate efficient and effective business operations
Support programs that improve employee health, safety, and welfare
• Employee retention rate • Employee engagement index score • Percentage of time NCDOT’s information network
is available • Employee safety index
• Dollars saved as a result of IT initiatives • Percentage of workforce participating in Highway
to Health Program
• Continuous Improvement • Talent Management Program
(including Legacy Leadership Program, Employee Engagement Survey, and Knowledge Management Program)
• Highway to Health Program • TranSHARE
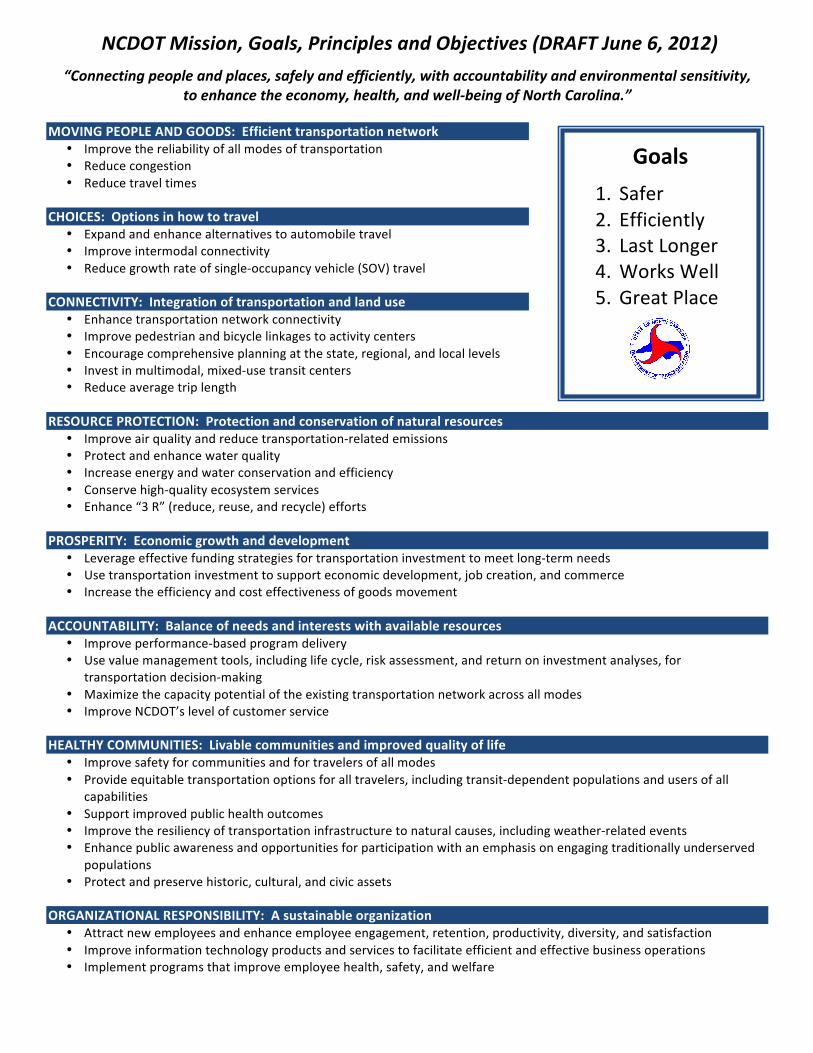
NCDOT Mission, Goals, Principles and Objectives (DRAFT June 6, 2012)
“Connecting people and places, safely and efficiently, with accountability and environmental sensitivity, to enhance the economy, health, and well-‐being of North Carolina.”
MOVING PEOPLE AND GOODS: Efficient transportation network
• Improve the reliability of all modes of transportation • Reduce congestion • Reduce travel times
CHOICES: Options in how to travel
• Expand and enhance alternatives to automobile travel • Improve intermodal connectivity • Reduce growth rate of single-‐occupancy vehicle (SOV) travel
CONNECTIVITY: Integration of transportation and land use
• Enhance transportation network connectivity • Improve pedestrian and bicycle linkages to activity centers • Encourage comprehensive planning at the state, regional, and local levels • Invest in multimodal, mixed-‐use transit centers • Reduce average trip length
RESOURCE PROTECTION: Protection and conservation of natural resources
• Improve air quality and reduce transportation-‐related emissions • Protect and enhance water quality • Increase energy and water conservation and efficiency • Conserve high-‐quality ecosystem services • Enhance “3 R” (reduce, reuse, and recycle) efforts
PROSPERITY: Economic growth and development
• Leverage effective funding strategies for transportation investment to meet long-‐term needs • Use transportation investment to support economic development, job creation, and commerce • Increase the efficiency and cost effectiveness of goods movement
ACCOUNTABILITY: Balance of needs and interests with available resources
• Improve performance-‐based program delivery • Use value management tools, including life cycle, risk assessment, and return on investment analyses, for
transportation decision-‐making • Maximize the capacity potential of the existing transportation network across all modes • Improve NCDOT’s level of customer service
HEALTHY COMMUNITIES: Livable communities and improved quality of life
• Improve safety for communities and for travelers of all modes • Provide equitable transportation options for all travelers, including transit-‐dependent populations and users of all
capabilities • Support improved public health outcomes • Improve the resiliency of transportation infrastructure to natural causes, including weather-‐related events • Enhance public awareness and opportunities for participation with an emphasis on engaging traditionally underserved
populations • Protect and preserve historic, cultural, and civic assets
ORGANIZATIONAL RESPONSIBILITY: A sustainable organization
• Attract new employees and enhance employee engagement, retention, productivity, diversity, and satisfaction • Improve information technology products and services to facilitate efficient and effective business operations • Implement programs that improve employee health, safety, and welfare
Goals
1. Safer 2. Efficiently 3. Last Longer 4. Works Well 5. Great Place
Kim
Typewritten Text
APPENDIX C
Kim
Typewritten Text
Kim
Typewritten Text
Kim
Typewritten Text

Project Tier Description
Total
Benefit
Score
Capital
Cost
($mil,
2013)
Annual-
ized Cost
($mil,
2013)
Annual
Operating
Costs
($mil/year,
2013)
Total
Cost
($mil,
YOE)
B/C Proxy
ScoreDiscussion
Travel Market
Reach
Travel Market
Performance
(without project)
Travel Market
Performance (with
project)
Costs
Serves many travel
markets
Affects markets with
the most signifcant
or growing
performance
problems
Causes significant
improvement in
performance of
affected travel
markets
Annualized costs
are low relative to
other projects
BART 30th St. Infill Station Middle-High
Construction of a new BART Station on the existing BART
Mission Street line between the existing stations at 24th
Street and Glen Park.
18 $525.6 $7.8 $1.2 $813.5 2
This project addresses travel and transit crowding between the Noe-Glen-
Bernal district and Downtown, a corridor in need of significant improvement.
Travel time improvements will be significant. Finally, although the project has
a relatively high cost, it has a long useful life, making the annualized cost
relatively low for an expensive project.
BART Metro turnback Middle-High
Construct a track extension allowing BART trains from the
East Bay to turn around in San Francisco, and provide
additional improvements that allow BART to run more
frequent transbay service to the core of San Francisco.
20 $650.0 $8.1 $0.0 $978.9 2
This project would improve performance in the affected markets significantly
relative to other projects. Although the project has a relatively high cost, it has
a long useful life, making the annualized cost relatively low for an expensive
project.
Better Market Street High
Re-design and improve Market Street for transit, bicycling,
and pedestrians between Steuart Street and Octavia
Boulevard.33 $250.0 $12.5 $0.0 $258.0 3
This project affects many markets, many of which have significant need for
improvement. It also improves all four performance measures.
Congestion Pricing Pilot HighImplementation of a demonstration congestion pricing
program in the San Francisco downtown area.33 $101.8 $5.1 $0.0 $105.1 6
This project affects multiple markets, improves all four performance measures,
and has a modest annualized cost.
Evans Avenue transit priority
treatmentsMiddle-High
Provide a dedicated transit lane with signal priority from
Highway 101 to Hunters Point.8 $47.4 $2.4 $0.0 $71.4 3
This project has a relatively low annualized cost, and improves GHG and
travel time between Bayshore and Sunset, a market with significant GHG and
travel time problems without the project.
Express bus service from Hunters
Point and Candlestick Point to
downtown
Middle-High New express bus services to and from downtown. 13 $21.6 $7.3 $6.2 $146.6 2This project provides benefits across all measures and positively affects travel
between Bayshore and Cordon, a market in significant need of improvement.
Geary Boulevard BRT Middle-HighConstruct rail-ready bus rapid transit (BRT) on Geary
Boulevard from downtown to the ocean.21 $208.8 $10.4 $0.0 $229.5 2
This project provides benefits across all measures and affects a significant
number of markets, but for a primary market with relatively fewer performance
problems to begin with.
Geneva Avenue Extension Middle-High
Extend Geneva Avenue from Bayshore Boulevard to
Harney Way, under or over Highway 101, to provide access
to new development at Hunters Point and Candlestick Point.
9 $98.3 $4.9 $0.0 $148.1 2
This project has a relatively low annualized cost, and positively affects travel
between the Bayshore and the Outer Mission districts, a market with
significant GHG, travel time, and modeshare problems.
Geneva TPS/BRT Middle-High
Install BRT, in dedicated lanes, from Bayshore Boulevard to
Prague Street; and provide transit-preferential treatments in
mixed-traffic lanes from Prague to Ocean Avenue/Balboa
BART station.
10 $78.4 $3.9 $0.0 $91.8 3
This project has a relatively low annualized cost, and positively affects travel
between Bayshore and Outer Mission, a market with significant GHG, travel
time, and modeshare problems.
Historic Streetcar Expansion
Program - E turnaroundHigh
Provide a turnaround to enable direct historic streetcar
service between Fisherman’s Wharf and the 4th Street
Caltrain station22 $16.0 $7.7 $7.2 $148.6 3
This project affects multiple markets, many of which have significant need for
improvement. It has the potential to improve GHG emissions, modeshare,
and crowding performance problems.
Middle-High and High Tier Projects
Kim
Typewritten Text
APPENDIX D

Project Tier Description
Total
Benefit
Score
Capital
Cost
($mil,
2013)
Annual-
ized Cost
($mil,
2013)
Annual
Operating
Costs
($mil/year,
2013)
Total
Cost
($mil,
YOE)
B/C Proxy
ScoreDiscussion
Travel Market
Reach
Travel Market
Performance
(without project)
Travel Market
Performance (with
project)
Costs
Serves many travel
markets
Affects markets with
the most signifcant
or growing
performance
problems
Causes significant
improvement in
performance of
affected travel
markets
Annualized costs
are low relative to
other projects
Middle-High and High Tier Projects
HOV lane conversion on 101 in San
Francisco south of Cesar ChavezMiddle-High
HOV lanes on 101 from county line to Cesar Chavez,
complementing HOV lanes through San Mateo County. This
would convert a mixed traffic lane in each direction to an
HOV 3+ lane to enhance carpool and transit operations
during peak periods.
6 $30.7 $1.5 $0.0 $32.7 4This project has modest benefits but very low annualized costs, resulting in a
high benefit-cost ratio relative to other projects.
HOV lane conversion on Central
FreewayHigh
Convert an existing travel lane into a carpool lane in each
direction between I-80 and the South Van Ness/Mission off-
ramps.
6 $10.2 $0.5 $0.0 $15.4 12Although benefits are modest, it has very low annualized costs, resulting in a
high benefit-cost ratio relative to other projects.
HOV lane conversion on I-280 Middle-HighConvert general purpose lanes to HOV lanes on I-280 from
county line to 6th Street.8 $76.8 $3.8 $0.0 $115.6 2
This project has modest benefits but low annualized costs, resulting in a high
benefit-cost ratio relative to other projects.
M-line 19th Avenue west-side
alignment Middle-High
Construct a west-side alignment and grade separation to
improve travel times and reliability on the Muni Metro M line. 10 $180.0 $3.6 $0.0 $271.1 3This project improves both motorized travel time and modeshare, and has a
relatively low annualized cost.
New Caltrain Station at Oakdale
Avenue High Construction of a new Caltrain Station at Oakdale Ave. 4 $51.2 $0.2 $0.9 $62.1 5
This project has a modest modeshare benefit but very low annualized costs,
resulting in a high benefit-cost ratio.
Potrero/Bayshore BRT High
Provide rail-like transit service by installing dedicated bus
lanes and other transit priority treatments on Potrero and
Bayshore.
22 $85.3 $4.3 $0.0 $128.4 5This project affects multiple markets, has the potential to improve all four
performance measures, and has a modest annualized cost.
Stockton Transit Priority and Partial
Bus Rapid TransitMiddle-High
Improve reliability and reduce travel times for Stockton
Street buses by providing transit priority treatments between
between Market and Columbus, and a separated bus lane
on Stockton Street between Bush and Market.
3 $23.0 $1.1 $0.0 $34.6 3
This project has modest benefits but very low annualized costs, resulting in a
high benefit-cost ratio relative to other projects, and serves the Cordon area,
which has a high need for improvement.
T-line extension to Southern
Intermodal TerminalMiddle-High
Extend the T-Third Street line from Bayshore/Sunnydale to
the Bayshore Caltrain station.14 $50.0 $6.6 $4.9 $152.2 2
This project has modest GHG and modeshare benefits and improves travel
between Bayshore and San Mateo, a market in significant need of
improvement.
Transit Effectiveness Project High
Improve Muni reliability and reduce travel times systemwide
through stop infrastructure, lane modifications, stop controls
and placement, and other transit preferential measures
36 $156.9 $7.8 $0.0 $178.0 5This project affects a large number of markets and has the potential to
improve all four performance measures.

Project Tier Description
Total
Benefit
Score
Capital
Cost
($mil,
2013)
Annual-
ized Cost
($mil,
2013)
Annual
Operating
Costs
($mil/year,
2013)
Total
Cost
($mil,
YOE)
B/C Proxy
ScoreDiscussion
Travel Market
Reach
Travel Market
Performance
(without project)
Travel Market
Performance (with
project)
Costs
Serves many travel
markets
Affects markets with
the most signifcant
or growing
performance
problems
Causes significant
improvement in
performance of
affected travel
markets
Annualized costs
are low relative to
other projects
Middle-High and High Tier Projects
Transit Performance Initiative (TPI) High
Provide one or more major capital investments to improve
transit travel times and reliability at key bottlenecks, such as
the Embarcadero Muni Metro turnaround, Mission Bay
Loop, J-Church and N-Judah merge point, and at West
Portal.
39 $535.0 $6.7 $0.0 $805.7 6
This project affects markets citywide, many of which have significant need for
improvement. It also has the potential to improve all four performance
measures.
Treasure Island Congestion Pricing HighImplement peak period congestion charge for automobiles
entering or exiting Treasure Island.16 $14.0 $0.7 $0.0 $14.4 23
This project has modest benefits but very low annualized costs, resulting in a
high benefit-cost ratio relative to other projects.

Project Tier Description
Total
Benefit
Score
Capital
Cost
($mil,
2013)
Annual-
ized Cost
($mil,
2013)
Annual
Operating
Costs
($mil,
2013)
Total
Cost
($mil,
YOE)
B/C Proxy
ScoreDiscussion Market Reach
Market
Performance
(without project)
Market
Performance (with
project)
Costs
Serves few travel
markets
Market
performance
problems are low
relative to other
markets
Improvement in
affected markets is
low relative to other
projects
Costs are high
relative to benefits
14-Mission trolleybus extension to
Daly CityLow Extend 14-Mission trolleybus route to Daly City BART. 0 $18.0 $1.9 $0.6 $38.8 <1
This project does not have sufficient benefit in
addition to the existing 14L service to Daly City to
score above a 0 on any of the four measures.
BART expansion: Additional
Transbay TubeMiddle-Low
Construction of a new BART tube to provide additional
capacity and accommodate projected future ridership
growth.
30 $10,000 $146.8 $21.8 $15,459 <1
This project has high benefits but very high
annualized costs, leading to a relatively low benefit-
cost ratio.
Bridge over Yosemite Slough Middle-Low
Four-lane bridge to connect planned new neighborhoods in
the former Hunters Point Naval Shipyard to Candlestick
Point.
4 $56.8 $2.8 $0.0 $68.6 1
This project serves only a small number of markets
and travel time benefits are modest relative to other
projects.
Cable Car Extension to Japantown Low - 0 $50.0 $4.3 $2.6 $123.2 <1
This project does not provide significant benefit on
any of the four measures because it would provide
only a marginal increase in service parallel to existing
transit routes.
Candlestick Park Ferry Low Ferry terminal at Candlestick Point. 0 $43.0 $2.1 $1.0 $82.9 <1
Improvements to affected markets are low relative to
other projects, and serves relatively few projected
trips.
Central Freeway removal/Octavia
Boulevard ExtensionMiddle-Low
Remove Central Freeway from Bryant Street to Market
Street and replace it with a surface boulevard.6 $150.0 $7.5 $0.0 $225.9 1
This project has a relatively low benefit as it
negatively affected motorized travel time and does
not address the neediest markets.
Central Subway extension to North
Beach and Fisherman’s WharfMiddle-Low
Implement a subway transit extension from the Central
Subway terminal in Chinatown, through North Beach to a
terminal in Fishermans Wharf (from Jackson & Stockton to
Van Ness & North Point)
16 $1,100.0 $15.4 $1.6 $1,686.5 1
This project provides improvements to both crowding
and motorized travel time, but does not affect other
measures and has a relatively high annualized cost.
Contra-flow carpool lane on the Bay
BridgeMiddle-Low
Convert an existing travel lane on the Bay Bridge in the off-
peak direction into a lane for AC Transit buses and
carpools, with direct access to the Transbay Terminal.
10 $305.3 $15.3 $0.0 $335.5 1
This project results in modest improvements, but has
a relatively high annualized cost and does not affect
the most needy markets.
Extend M-Line to Daly City Middle-Low
Extend the Muni Metro M-line from ParkMerced to the Daly
City BART station, using dedicated transit lanes. 4 $250.0 $8.3 $0.0 $376.5 <1
This project only improves crowding, while having
minimal affect on other measures, in addition to
affecting only a small number of markets.
Middle Low and Low Tier Projects
Kim
Typewritten Text
APPENDIX E
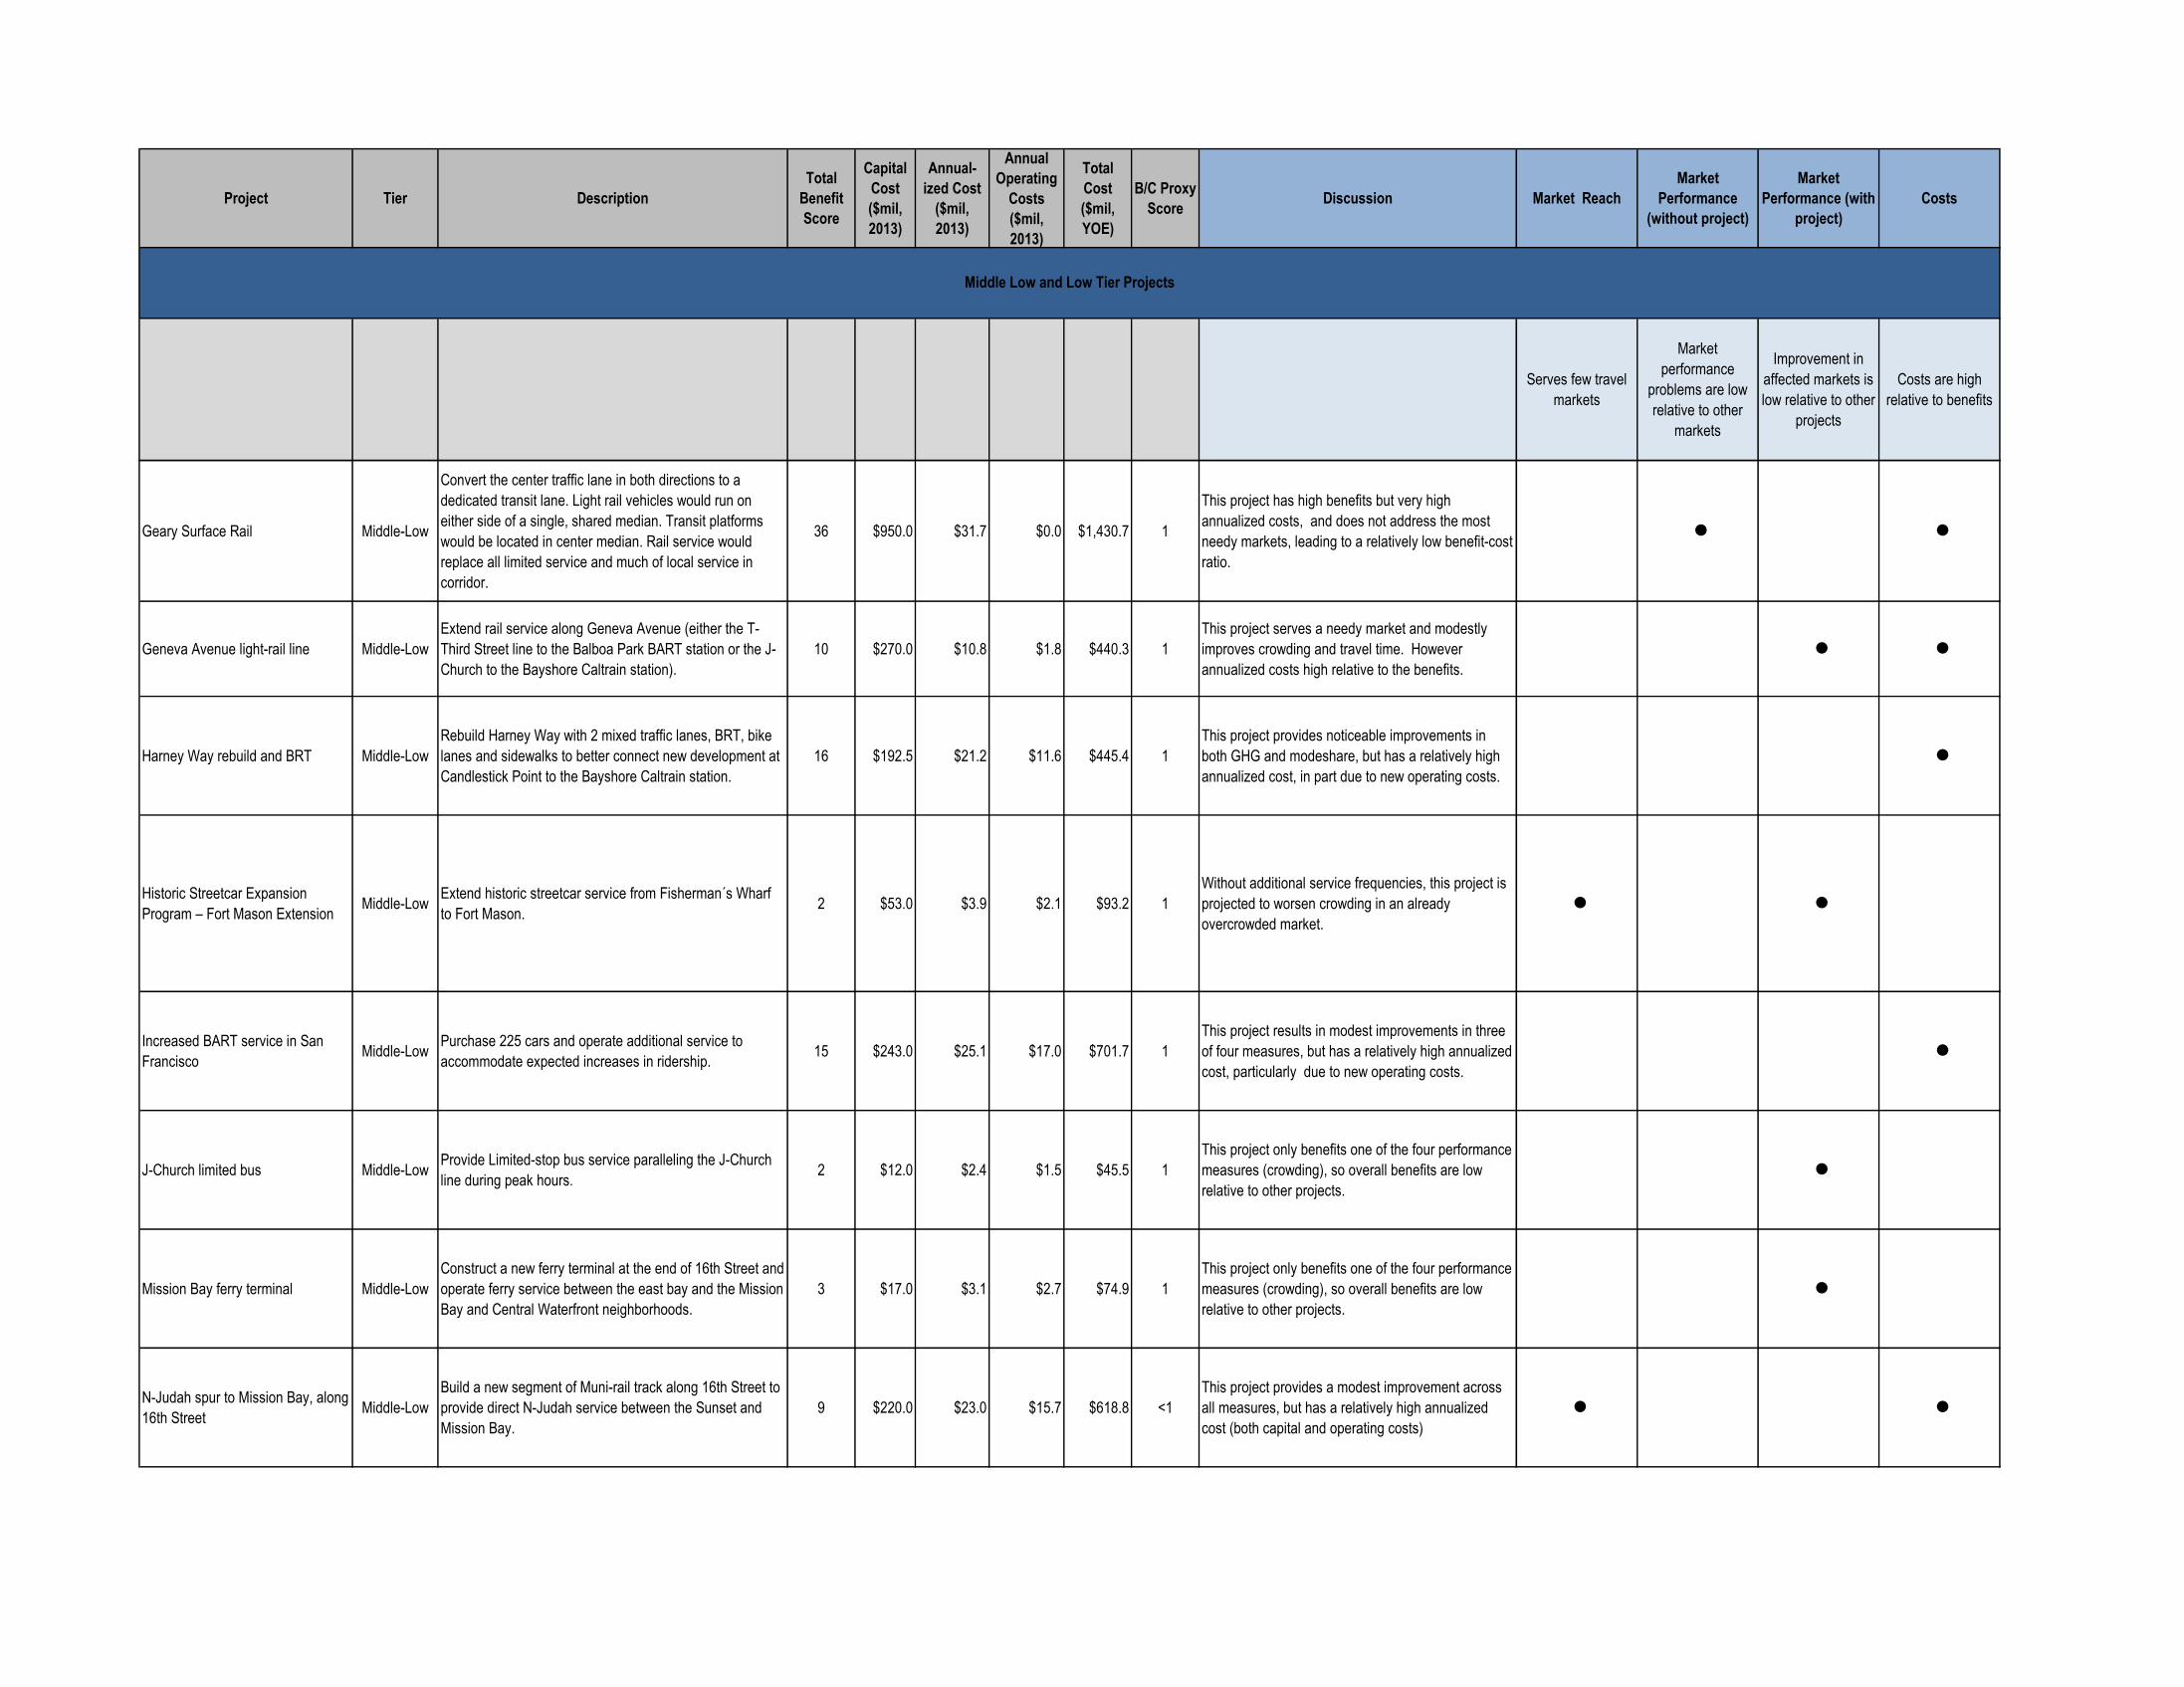
Project Tier Description
Total
Benefit
Score
Capital
Cost
($mil,
2013)
Annual-
ized Cost
($mil,
2013)
Annual
Operating
Costs
($mil,
2013)
Total
Cost
($mil,
YOE)
B/C Proxy
ScoreDiscussion Market Reach
Market
Performance
(without project)
Market
Performance (with
project)
Costs
Serves few travel
markets
Market
performance
problems are low
relative to other
markets
Improvement in
affected markets is
low relative to other
projects
Costs are high
relative to benefits
Middle Low and Low Tier Projects
Geary Surface Rail Middle-Low
Convert the center traffic lane in both directions to a
dedicated transit lane. Light rail vehicles would run on
either side of a single, shared median. Transit platforms
would be located in center median. Rail service would
replace all limited service and much of local service in
corridor.
36 $950.0 $31.7 $0.0 $1,430.7 1
This project has high benefits but very high
annualized costs, and does not address the most
needy markets, leading to a relatively low benefit-cost
ratio.
Geneva Avenue light-rail line Middle-Low
Extend rail service along Geneva Avenue (either the T-
Third Street line to the Balboa Park BART station or the J-
Church to the Bayshore Caltrain station).
10 $270.0 $10.8 $1.8 $440.3 1
This project serves a needy market and modestly
improves crowding and travel time. However
annualized costs high relative to the benefits.
Harney Way rebuild and BRT Middle-Low
Rebuild Harney Way with 2 mixed traffic lanes, BRT, bike
lanes and sidewalks to better connect new development at
Candlestick Point to the Bayshore Caltrain station.
16 $192.5 $21.2 $11.6 $445.4 1
This project provides noticeable improvements in
both GHG and modeshare, but has a relatively high
annualized cost, in part due to new operating costs.
Historic Streetcar Expansion
Program – Fort Mason Extension Middle-Low
Extend historic streetcar service from Fisherman´s Wharf
to Fort Mason.2 $53.0 $3.9 $2.1 $93.2 1
Without additional service frequencies, this project is
projected to worsen crowding in an already
overcrowded market.
Increased BART service in San
FranciscoMiddle-Low
Purchase 225 cars and operate additional service to
accommodate expected increases in ridership.15 $243.0 $25.1 $17.0 $701.7 1
This project results in modest improvements in three
of four measures, but has a relatively high annualized
cost, particularly due to new operating costs.
J-Church limited bus Middle-LowProvide Limited-stop bus service paralleling the J-Church
line during peak hours.2 $12.0 $2.4 $1.5 $45.5 1
This project only benefits one of the four performance
measures (crowding), so overall benefits are low
relative to other projects.
Mission Bay ferry terminal Middle-Low
Construct a new ferry terminal at the end of 16th Street and
operate ferry service between the east bay and the Mission
Bay and Central Waterfront neighborhoods.
3 $17.0 $3.1 $2.7 $74.9 1
This project only benefits one of the four performance
measures (crowding), so overall benefits are low
relative to other projects.
N-Judah spur to Mission Bay, along
16th Street Middle-Low
Build a new segment of Muni-rail track along 16th Street to
provide direct N-Judah service between the Sunset and
Mission Bay.
9 $220.0 $23.0 $15.7 $618.8 <1
This project provides a modest improvement across
all measures, but has a relatively high annualized
cost (both capital and operating costs)

Project Tier Description
Total
Benefit
Score
Capital
Cost
($mil,
2013)
Annual-
ized Cost
($mil,
2013)
Annual
Operating
Costs
($mil,
2013)
Total
Cost
($mil,
YOE)
B/C Proxy
ScoreDiscussion Market Reach
Market
Performance
(without project)
Market
Performance (with
project)
Costs
Serves few travel
markets
Market
performance
problems are low
relative to other
markets
Improvement in
affected markets is
low relative to other
projects
Costs are high
relative to benefits
Middle Low and Low Tier Projects
Replace L surface rail with BRT Low BRT to replace L west of West Portal. 0 $82.0 $2.7 $0.0 $123.5 <1
This project does not provide a significant benefit on
any of the four measures relative to the existing L-
Taraval LRT service.
Southeast Waterfront transit priority
and increased serviceMiddle-Low
Implement transit priority treatments, such as signal
priority, on key east-west streets in Bayview/Hunters Point,
and purchase new buses and rail vehicles for the T-Third
Muni Metro line. Operate expanded Muni bus and T-Third
service on these routes to accommodate new growth in
residents and jobs in Candlestick Point and Hunters Point.
20 $205.8 $42.4 $34.2 $876.1 <1
This project provides noticeable improvements in
three of four measures, but has a very high
annualized cost, due to new operating costs and
costs to purchase new vehicles.