caltrain SP QX4Strategic+Plan+2004/Cal...28 the future scenarios ... paul ave bayshore south sf san...
28
2004 2023 C A L T R A I N STRATEGIC PLAN JULY 1, 2004 PENINSULA CORRIDOR JOINT POWERS BOARD (CALTRAIN) 1250 SAN CARLOS AVE. SAN CARLOS, CALIF. 94070 800-660-4287 WWW.CALTRAIN.COM
Transcript of caltrain SP QX4Strategic+Plan+2004/Cal...28 the future scenarios ... paul ave bayshore south sf san...
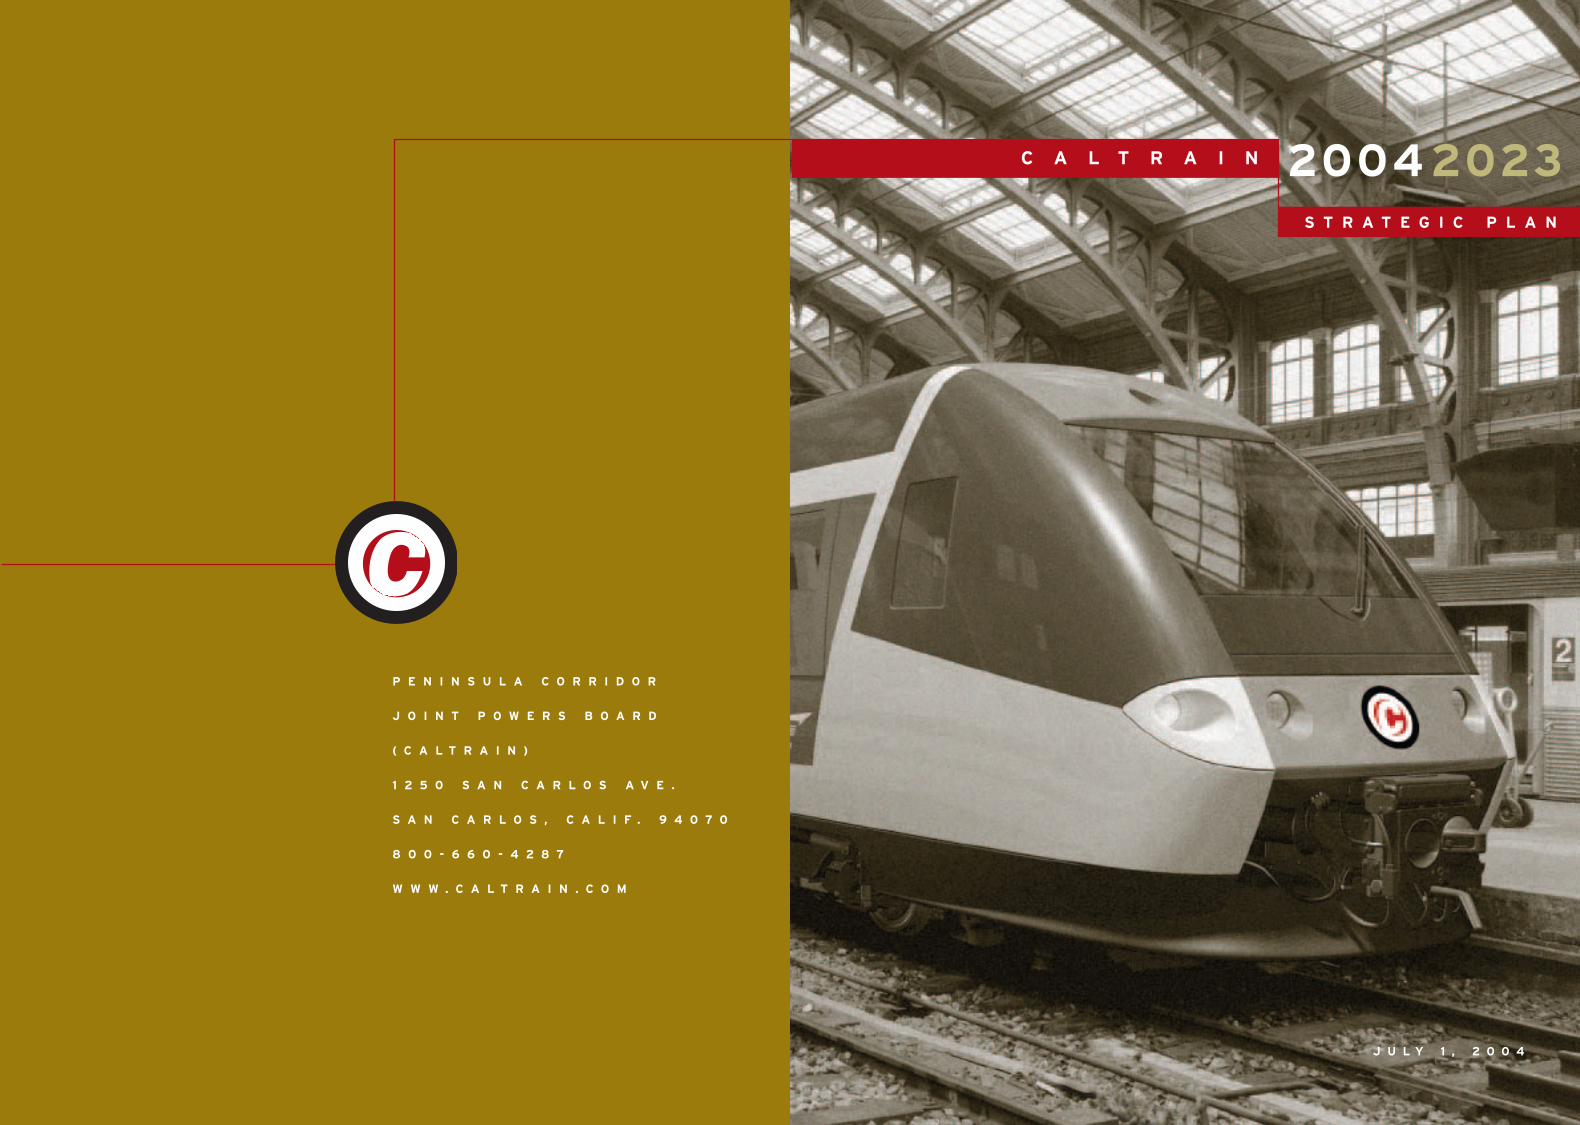
2004 2023C A L T R A I N
S T R A T E G I C P L A N
J U L Y 1 , 2 0 0 4
P E N I N S U L A C O R R I D O R
J O I N T P O W E R S B O A R D
( C A L T R A I N )
1 2 5 0 S A N C A R L O S A V E .
S A N C A R L O S , C A L I F . 9 4 0 7 0
8 0 0 - 6 6 0 - 4 2 8 7
W W W . C A L T R A I N . C O M
1 From the Executive Director
2 Introduction
2 The Caltrain Strategic Plan 2004–20235 Along the Peninsula7 Caltrain Today
8 Vision & Guiding Principles
8 The Caltrain Vision9 Guiding Principles
20 From Principle to Policy
20 The Scenario Approach21 Policy Questions25 Snapshot of the Continuum
and Future Improvements
28 The Future Scenarios
28 Developing the Scenarios47 Evaluating the Scenarios
50 Conclusions
S T R A T E G I C P L A N
2 0 0 4 | 2 0 2 3
T A B L E O F C O N T E N T S
A C K N O W L E D G M E N T S
Peninsula Corridor Joint Powers Board1250 San Carlos Ave., San Carlos, California 94070
2004 BOARD OF DIRECTORS
John McLemore, ChairMike Nevin, Vice ChairMichael BurnsJosé CisnerosDon GageJim HartnettArthur L. LloydSophie MaxwellKen Yeager
Sue Lempert, Metropolitan Transportation Commission Liason
Michael J. Scanlon, Executive DirectorGeorge Cameron, Chief Administrative Officer and
Acting Chief Financial OfficerChuck Harvey, Chief Operating OfficerRita Haskin, Chief Communications OfficerIan McAvoy, Chief Development Officer
PROJECT STAFF
Larry Stueck, Manager, Planning and ResearchApril Chan, Manager, Capital Programming and GrantsCorinne Goodrich, Manager, Special ProjectsDouglas Kolozsvari, Associate Planner
HNTB CORPORATION1330 Broadway #1630, Oakland, CA 94612Camille Tsao, Senior Transportation Planner
NANCY WHELAN CONSULTING201 Mission Street #1450, San Francisco, CA 94105
NELSON\NYGAARD CONSULTING ASSOCIATES833 Market Street #900, San Francisco, CA 94103
WILBUR SMITH ASSOCIATES201 Mission Street #1450, San Francisco, CA 94105
Art direction, design and production by MIG, Inc., Berkeley, California

CALTRAIN STRATEGIC PLAN 2004 | 2023 1
From the Executive Director
Friends of Caltrain:
On behalf of the Peninsula Corridor Joint Powers Board, (JPB) we are pleased to present the
20-Year Strategic Plan for Caltrain service.
This document is a product of challenging economic times demanding hard choices and
difficult decisions. But it also reflects an optimistic vision and a conviction that continued
dramatic development and even more significant milestones lie ahead in the Caltrain corridor
as we respond to relentless demand by new generations of patrons for faster travel, frequent
schedules, improved facilities and more convenient access.
In 1992, the Joint Powers Board assumed stewardship of the Caltrain system, which was hard
pressed at the time to operate 52 weekday trains over a worn and tired infrastructure.
Throughout the industry, they called it a “fixer-upper railroad.” From any perspective, we have
done some significant fixing during the last 12 years. We have completed a $300 million infra-
structure upgrade including new trackage, rolling stock, signal systems, and—in conjunction with
many of the cities we serve—station improvements for comfort, convenience and accessibility.
That 52-train schedule has expanded to 86, including 10 Baby Bullet trips linking San Jose
Diridon and San Francisco stations in less than an hour.
Much of this upgrade effort has taken place during a chilling economic downturn that has
imposed unprecedented fiscal challenges on every transportation system. Nevertheless, we
have not stopped building; we have not stopped improving; and, as this document will attest,
we have not stopped planning for the future.
Where do we go from here?
This Strategic Plan positions us to proceed as fast, and as far, as market demand and resources
will permit. It outlines three distinct growth patterns: Moderate, Enhanced, and Build-Out. The
document provides for potential service extensions to the south, north and east; for system
electrification; additional trains and more express schedules; and, ultimately, incorporation of
High Speed Rail sometime in the next decade.
Any long-term planning document must contain the means to deal with contingencies. Caltrain
has met that challenge during its developmental years, and we believe the current Strategic
Plan includes adequate measures to assure continued success.
Michael J. ScanlonExecutive Director

CALTRAIN STRATEGIC PLAN 2004 | 2023
INTRODUCTION
3CALTRAIN STRATEGIC PLAN 2004 | 20232
Introduction
The Caltrain Strategic Plan 2004–2023The Strategic Plan is a blueprint for the future of Caltrain. It presents a vision
and guiding principles that shape broad-level policy decisions as well as specific
strategies for service and capital improvements. The Strategic Plan is intended to
be a reference for policymakers, Caltrain staff, and members of the public that
guides them toward a common vision for Caltrain. Above all, it is meant to be an
agent for change.
The Caltrain Strategic Plan includes the following elements:
(1) The Vision & Guiding Principles, which present a vision for Caltrain
and outline principles for guiding policy decisions;
(2) A summary of the Service Plan, which details the service characteristics,
policies, and budget requirements for Caltrain over the next 20 years;
(3) A summary of the Capital Improvement Program (CIP), which identifies
policy and prioritizes capital improvements over the next 20 years; and
(4) A summary of the Finance Plan, which discusses funding strategies
for Caltrain.
Information from the Service, Capital Improvement, and Finance plans is presented
through four future scenarios: the Status Quo, Moderate Growth, Enhanced, and
Build-Out Scenarios. The scenarios are described in detail in the Future Scenarios
chapter (page 28). The service characteristics, operations and capital costs, and
member agency contributions reflected in each of the scenarios are based upon
the Draft Short-Range Transit Plan, Capital Improvement Plan, and Finance Plan as
of June 1, 2004. The information in the Strategic Plan provides a general under-
standing of the costs and benefits of each scenario and provides a basis for com-
paring the scenarios. Adoption of the Strategic Plan does not commit the member
agencies to the funding requirements, service levels, or capital priorities presented
in this document but is an agreement on the principles and policies which will
guide the development of the Short-Range Transit Plan, Service Plan, Capital
Improvement Plan, and Finance Plan. These plans are being finalized and will be
adopted separately from the Strategic Plan in the Fall/Winter of 2004.
Any updated information related to JPB actions subsequent to the adoption of
the Strategic Plan will be included as these supporting plans are finalized. Any
revisions to the Strategic Plan after adoption will be included in an addendum or
in the next Strategic Plan update, anticipated by 2010.
StrategicPlan
Finance Plan
Vision & GuidingPrinciples
Service Plan
Capital Improvement
Plan
S T R AT E G I C P L A N C O M P O N E N T S
CALTRAIN STRATEGIC PLAN 2004 | 2023
INTRODUCTION
5
All of the scenarios are based on rea-
sonable assumptions of revenue avail-
ability—based on past experience and
estimates of future events—and opti-
mize federal and state funds. Where
estimated revenue meets or exceeds
capital program costs, the capital pro-
grams are considered to be fully fund-
ed. Underlying the financial analysis is
the assumption that the local funds
required to match the maximum avail-
able federal revenues will be provided
by Caltrain’s member agencies. These
local matching funds are subject to
annual approval by the three member
agencies. If local matching funds are
not allocated and alternative local
sources are not identified, Caltrain
would not be able to use all of the
federal funds included in the financial
plans and other sources will be required
to meet any shortfalls.
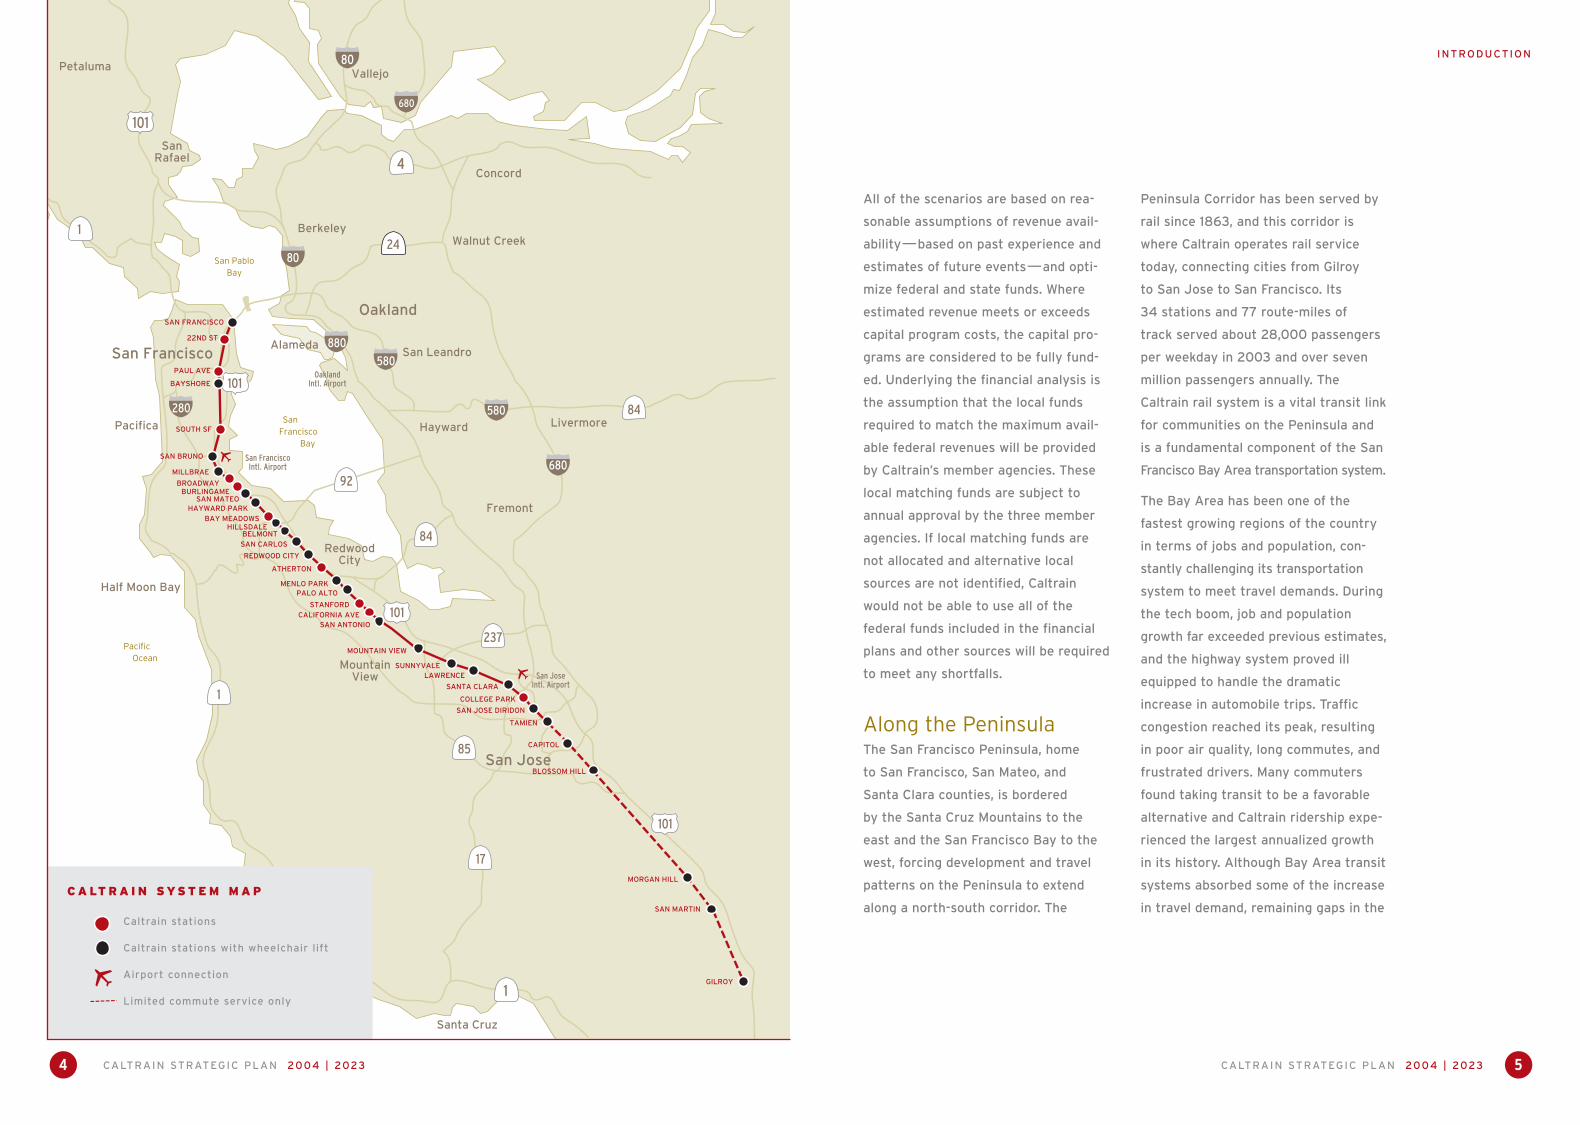
Along the PeninsulaThe San Francisco Peninsula, home
to San Francisco, San Mateo, and
Santa Clara counties, is bordered
by the Santa Cruz Mountains to the
east and the San Francisco Bay to the
west, forcing development and travel
patterns on the Peninsula to extend
along a north-south corridor. The
Peninsula Corridor has been served by
rail since 1863, and this corridor is
where Caltrain operates rail service
today, connecting cities from Gilroy
to San Jose to San Francisco. Its
34 stations and 77 route-miles of
track served about 28,000 passengers
per weekday in 2003 and over seven
million passengers annually. The
Caltrain rail system is a vital transit link
for communities on the Peninsula and
is a fundamental component of the San
Francisco Bay Area transportation system.
The Bay Area has been one of the
fastest growing regions of the country
in terms of jobs and population, con-
stantly challenging its transportation
system to meet travel demands. During
the tech boom, job and population
growth far exceeded previous estimates,
and the highway system proved ill
equipped to handle the dramatic
increase in automobile trips. Traffic
congestion reached its peak, resulting
in poor air quality, long commutes, and
frustrated drivers. Many commuters
found taking transit to be a favorable
alternative and Caltrain ridership expe-
rienced the largest annualized growth
in its history. Although Bay Area transit
systems absorbed some of the increase
in travel demand, remaining gaps in the
CALTRAIN STRATEGIC PLAN 2004 | 20234
1
880
80
580
80
680
4
280
1
1
680
580 84
85
237
101
101
101
101
92
84
17
San Francisco
Oakland
San Jose
RedwoodCity
Pacifica
Santa Cruz
Half Moon Bay
MountainView
Berkeley
San Leandro
Hayward
Alameda
Fremont
Livermore
Walnut Creek
SanRafael
Vallejo
Concord
Petaluma
24
OaklandIntl. Airport
San FranciscoIntl. Airport
San JoseIntl. Airport
Pacific Ocean
San Francisco Bay
San PabloBay
SAN FRANCISCO
22ND ST
PAUL AVE
BAYSHORE
SOUTH SF
SAN BRUNO
MILLBRAE
BROADWAYBURLINGAME
SAN MATEOHAYWARD PARK
BAY MEADOWSHILLSDALE
BELMONTSAN CARLOS
REDWOOD CITY
ATHERTON
MENLO PARKPALO ALTO
STANFORDCALIFORNIA AVE
SAN ANTONIO
MOUNTAIN VIEW
SUNNYVALELAWRENCE
SANTA CLARA
COLLEGE PARK
SAN JOSE DIRIDON
TAMIEN
CAPITOL
BLOSSOM HILL
MORGAN HILL
SAN MARTIN
GILROY
C A LT R A I N S YS T E M M A P
Caltrain stations
Caltrain stations with wheelchair lift
Airport connection
Limited commute service only

CALTRAIN STRATEGIC PLAN 2004 | 2023
INTRODUCTION
6
regional transit network became more
pronounced and many commuters
chose to drive and battle congested
roads and highways. It became appar-
ent that regional mobility and transit
connectivity in the Bay Area needed to
be improved to provide viable trans-
portation alternatives and choices.
Because the Bay Area is the foremost
international center for major tech-
nological development, travel demands
within, to, and from the region are
expected to grow dramatically in the
next 20 years and beyond. Plans for
a High Speed Rail (HSR) system in
California, and multiple Bay Area tran-
sit and highway projects, speak to the
urgency of these transportation needs.
In 2003, the Millbrae intermodal station
opened, making it possible for passen-
gers to transfer directly between
Caltrain and BART. In June 2004,
Caltrain introduced its express or
“Baby Bullet” service, which reduces
overall travel time between San Jose
and San Francisco. In the initial plan-
ning stages are the San Francisco
Downtown Extension, Dumbarton Rail
Project, and expansion of the Diridon
Station in San Jose, all of which will
greatly improve the connectivity
between Caltrain and other major tran-
sit systems in the region. Furthermore,
the prospect of HSR brings tremendous
opportunities for Caltrain to serve
interregional travelers and to imple-
ment system-wide improvements, given
that the two rail systems would share
the existing Caltrain corridor and key
stations between San Jose and San
Francisco. Through these and other
service and operational improvements,
Caltrain is positioned to assume an
ever increasing role in contributing to
regional mobility solutions to meet the
needs of Bay Area residents and visitors.
CALTRAIN STRATEGIC PLAN 2004 | 2023
INTRODUCTION
7
Whether serving travel needs at a
local or regional level, Caltrain is an
ideal transit alternative to support
the quality of life in local communities
along the Peninsula and contribute
to the achievement of the region’s
broader goals.
Caltrain Today Caltrain is owned and operated by
the Peninsula Corridor Joint Powers
Board (JPB), which consists of three
members from each of the JPB
partners: San Francisco, San Mateo,
and Santa Clara counties. The San Mateo
County Transit District (SamTrans) is
the managing agency which includes
oversight of the contract operator,
engineering, finance, capital project
development, project monitoring,
planning, marketing, customer service,
fare and schedule development,
performance monitoring, personnel
recruitment, budget and grant adminis-
tration, and public outreach. Amtrak
was awarded the operating contract
on a competitive basis and is responsi-
ble for providing train service, main-
taining Caltrain equipment, collecting
fares, and conducting ridership counts
and passenger surveys as necessary.
Four committees provide input to
Caltrain on a regular basis: the Staff
Coordinating Council, which includes
staff from the three partners; the
Citizens Advisory Committee, consist-
ing of three citizens from each of the
three counties; the Bicycle Advisory
Committee, comprised of Caltrain staff
and community members with an
interest in bicycle issues; and the
Accessibility Advisory Committee,
which includes Caltrain staff, Caltrain
riders with disabilities, and other repre-
sentatives of people with disabilities.
6,000,000
7,000,000
8,000,000
9,000,000
10,000,000
11,000,000
92–93 93–94 94–95 96–97 97–98 98–99 99–00 00–01 01–02 02–03 03–0490–91 91–92FY 95–96
A N N U A L R I D E R S H I P F Y 1 9 9 1 - F Y 2 0 0 4

CALTRAIN STRATEGIC PLAN 2004 | 2023
VIS ION & GUID ING PRINCIPLES
9CALTRAIN STRATEGIC PLAN 2004 | 20238
At the regional level, Caltrain must play a key role in mobility management. It must
offer people an attractive option to automobile travel while helping to achieve con-
gestion relief and air quality goals. It must encourage the use of other alternative
modes by facilitating seamless connections to local and regional transit systems,
providing state-of-the-art facilities for bicycles and wheelchairs, and improving
pedestrian access.
Guiding PrinciplesThe following Guiding Principles are designed to bring policy-makers and decision-
makers one step closer to turning the Caltrain vision into reality. The Guiding
Principles do not prescribe specific actions but provide a policy framework for lead-
ing the Caltrain management team in a direction that will enable it to achieve its
ultimate goals. They are:
• Satisfy passengers and build ridership
• Invest wisely in system improvements
• Promote regional connectivity and cooperation with other
transportation providers
• Partner with communities and broaden communications with the public
• Develop a solid financial foundation that ensures long-term sustainability
Each of the Guiding Principles is explained further on the following pages with asso-
ciated objectives, challenges, and opportunities.
Vision & Guiding Principles
The Caltrain VisionThe Caltrain Vision through 2023 is to become the preferred mode of travel along
the Peninsula Corridor by:
• Providing passengers with a world-class travel experience
• Acting as a major catalyst for redevelopment and economic activity in
communities along its route
• Playing a key role in mobility management along the Peninsula Corridor
and in the Bay Area region as a whole
Caltrain is a vital component of the Bay Area transportation system that will have
an ever increasing impact at the individual, local and regional levels. For it to be the
preferred mode of travel along the Peninsula Corridor, it must succeed and excel at
these three levels.
At the individual level, Caltrain must provide passengers with a world-class travel
experience. It should keep and attract passengers by offering convenient, efficient,
pleasant, and economical service that is safe and secure. Riding Caltrain should
allow people to enjoy a quality of life they cannot experience while driving in traffic.
At the local level, Caltrain must act as a major catalyst for redevelopment and eco-
nomic activity. It must support existing communities along its route by serving the
people that live, work, and play there. By keeping and attracting passengers, Caltrain
will bring potential customers to local businesses near its stations. Caltrain must be
a partner with the communities through which it travels to realize development
opportunities and meet other common goals. Caltrain stations must be inviting and
contribute to a community’s sense of place.
1
2
3
4
5
CALTRAIN STRATEGIC PLAN 2004 | 2023
GUID ING PRINCIPLES
11
To satisfy passengers and build ridership Caltrain must:
• Provide a flexible mix of local and express service that reflects the
travel needs of Caltrain passengers. Reduce overall travel time with
operational and platform improvements to facilitate faster boarding.
Increase frequency of service.
• Provide or facilitate passenger amenities on board trains and at stations,
such as Internet access, banking, dry cleaning, child care, and other
“non-transit” services.
• Address station access needs with a balanced approach that includes
coordinating service with connecting transit operators in San Francisco, San
Mateo, and Santa Clara counties; promoting walking, bicycling, carpooling,
and carsharing to and from stations; improving access for persons with
disabilities; and finding innovative and effective solutions for meeting
parking demand.
• Create inviting stations that serve as landmarks and activity centers for the
communities in which they are located.
• Provide complete, reliable, real-time information that is easily obtainable at
transit stations, over the phone, via the Internet, or through other media.
• Implement a fare structure that is easy to understand and a universal fare
medium that is easy to collect and transfer across transit providers.
• Understand current and potential markets along the Caltrain route to
establish ridership targets, set service levels, and market Caltrain service to
potential riders.
• Regularly conduct passenger market research to evaluate service
performance, measure customer satisfaction, and improve service.
• Continually strive to improve the passenger experience and the Caltrain
organization as a whole.
CHALLENGES
> A major challenge to satisfy-ing passengers and increasingridership will be to build a solidfinancial foundation thatensures long-term, dedicatedfunding for substantial systemand service improvements.
> Another challenge will be toreshape the public perceptionand brand image of Caltrain asa viable and preferred alterna-tive to the automobile.
OPPORTUNITIES
> Transit-Oriented Development(TOD) presents opportunities tobuild potential ridership bylocating residences, businesses,and services near Caltrain stations.
> The proposed California HighSpeed Rail would present anumber of opportunities forcomplementary capitalimprovements that will makeCaltrain a more attractive transit system by improvingservice, improving Caltrain’simage, and increasing opportu-nities for regional connections.
> Planned capital programs and enhanced service improve-ments can enable Caltrain toserve the travel demands ofcurrent and potential riders andshape the public perception ofCaltrain as a modern, fast, andreliable transportation mode.
> Amenities for Caltrain customers could be provided at low cost by providing anenvironment to attract privatevendors that could provideservices.
CALTRAIN STRATEGIC PLAN 2004 | 202310
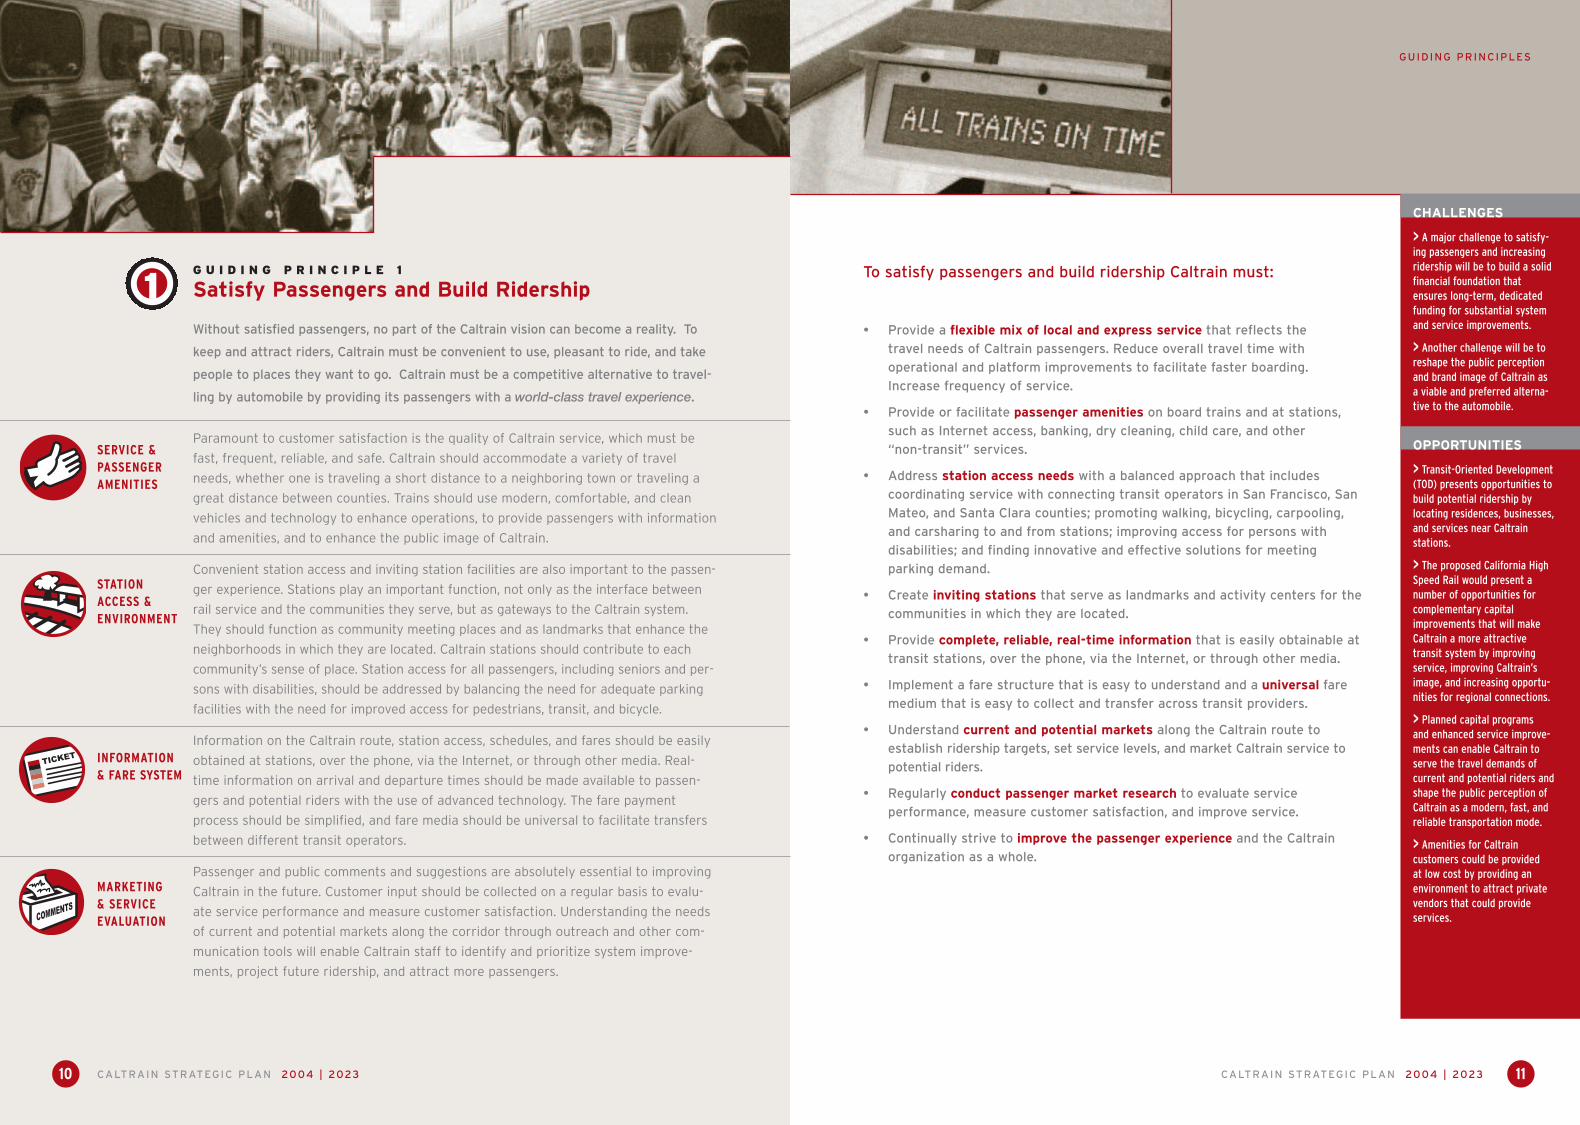
1G U I D I N G P R I N C I P L E 1
Satisfy Passengers and Build Ridership
Without satisfied passengers, no part of the Caltrain vision can become a reality. To
keep and attract riders, Caltrain must be convenient to use, pleasant to ride, and take
people to places they want to go. Caltrain must be a competitive alternative to travel-
ling by automobile by providing its passengers with a world-class travel experience.
SERVICE & PASSENGERAMENITIES
STATION ACCESS & ENVIRONMENT
INFORMATION & FARE SYSTEM
MARKETING & SERVICEEVALUATION
Paramount to customer satisfaction is the quality of Caltrain service, which must be
fast, frequent, reliable, and safe. Caltrain should accommodate a variety of travel
needs, whether one is traveling a short distance to a neighboring town or traveling a
great distance between counties. Trains should use modern, comfortable, and clean
vehicles and technology to enhance operations, to provide passengers with information
and amenities, and to enhance the public image of Caltrain.
Convenient station access and inviting station facilities are also important to the passen-
ger experience. Stations play an important function, not only as the interface between
rail service and the communities they serve, but as gateways to the Caltrain system.
They should function as community meeting places and as landmarks that enhance the
neighborhoods in which they are located. Caltrain stations should contribute to each
community’s sense of place. Station access for all passengers, including seniors and per-
sons with disabilities, should be addressed by balancing the need for adequate parking
facilities with the need for improved access for pedestrians, transit, and bicycle.
Information on the Caltrain route, station access, schedules, and fares should be easily
obtained at stations, over the phone, via the Internet, or through other media. Real-
time information on arrival and departure times should be made available to passen-
gers and potential riders with the use of advanced technology. The fare payment
process should be simplified, and fare media should be universal to facilitate transfers
between different transit operators.
Passenger and public comments and suggestions are absolutely essential to improving
Caltrain in the future. Customer input should be collected on a regular basis to evalu-
ate service performance and measure customer satisfaction. Understanding the needs
of current and potential markets along the corridor through outreach and other com-
munication tools will enable Caltrain staff to identify and prioritize system improve-
ments, project future ridership, and attract more passengers.

CALTRAIN STRATEGIC PLAN 2004 | 2023
GUID ING PRINCIPLES
13
To invest wisely in system improvements Caltrain must:
• Balance service and capital improvements with market demand and
availability of financial resources. Develop financial and capital
improvement plans that consider various funding scenarios and subsequent
plans of action.
• Use valuable market research to inform decisions about service
improvements that will attract more riders, such as employing “universal
design elements” that appeal to many travelers.
• Develop standards and targets that are useful in monitoring the efficient
and effective use of resources.
• Balance system rehabilitation and modernization projects to increase
reliability; deliver fast and frequent service; and provide quieter, cleaner, and
more comfortable trains. Expand and manage system capacity effectively to
maximize use of the tracks without overbuilding.
• Find balanced and cost-effective solutions for improving station access for
all passengers. Ensure that Caltrain passengers can access rail stations via
transit, bicycle, or walking. Facilitate transfers by coordinating schedules
with other transit operators and promoting increased feeder service to
Caltrain stations. Encourage bicycling and walking to stations by providing
related facilities and amenities. Balance the need for adequate parking
facilities at stations where it is appropriate.
• Enhance stations to create transportation facilities that are “places” and
integral parts of the communities in which they are located. Factor in the
unique characteristics of stations when planning station facilities and
access.
• Capitalize on opportunities presented by partnerships and third party
investments to improve the system. (These may include route extensions,
station enhancements, or other system improvements that are funded by
other organizations.)
CALTRAIN STRATEGIC PLAN 2004 | 202312
2G U I D I N G P R I N C I P L E 2
Invest Wisely in System Improvements
Investing wisely means that capital programs and service improvements must be
balanced with market demand and financial feasibility. Capital projects must have
longevity, and improvements overall must benefit a majority of users and prove
effective in achieving Caltrain goals.
FINANCIAL FEASIBILITY
MARKETAWARENESS
SERVICE & CAPITALIMPROVEMENTS
THIRD PARTYINVOLVEMENT
Implementation of system improvements must be prioritized and measured against the
availability of financial resources. The development of multiple funding scenarios will
enable Caltrain to strategize the financing and implementation of improvements over
the next 20 years.
To provide the level of service that passengers seek from a world-class rail transit
system, ongoing efforts to plan and implement system improvements must be
complemented by market awareness. It is essential that regular market research
be conducted to evaluate whether Caltrain is meeting the needs of its passengers
and to plan for system improvements that will attract potential passengers.
The ability of Caltrain to provide enhanced service is inextricably linked to capital
improvements, therefore service and capital improvements must be carefully
coordinated. They must respond to market demand and be balanced with financial
feasibility. Management of system capacity will be required in conjunction with
capacity expansion in order to maximize use of the right-of-way and to avoid
costly overbuilding.
Involvement from partnering agencies or third parties, such as local government
funding of route extensions or private investment in station improvements, allows
Caltrain to stretch its dollars to fund more improvements. Working with other
organizations requires more coordination to maximize the opportunities that result
from pooling resources.
CHALLENGES
> Challenges to implementingsystem improvements willinclude acceptance by thegoverning boards of the JPB partners and securingadequate and long-term fundingto finance the improvements.Achieving consensus onpriorities and funding.
> Another challenge toimplementing systemimprovements will be to develop the public and privatepartnerships necessary to implement systemimprovements efficiently and effectively.
OPPORTUNITIES
> Many of the plannedimprovements to the Caltrainsystem will enable Caltrain to be more efficient and to be compatible with othersystems. Electrification, forexample, would be one of theways that would allow Caltrainto be extended into downtownSan Francisco and would berequired to accommodate futureHigh Speed Rail on the Caltrainroute. It would also improveenvironmental quality byreducing noise and emissions.

CALTRAIN STRATEGIC PLAN 2004 | 2023
GUID ING PRINCIPLES
15
To promote regional connectivity and cooperation with other
transportation providers Caltrain must:
• Understand the influence of the land use/transportation nexus so that
Caltrain can become an active participant in addressing regional mobility
needs.
• Maximize connectivity between Caltrain and regional transportation
providers including ACE, Amtrak, Capitol Corridor, BART, VTA light rail,
MUNI Metro, regional bus service, and airport connectors. Strategies include
increasing feeder service to stations, coordinating schedules, developing
fare agreements, and integrating public information. Minimize transfer time
and total travel time of regional trips with timed transfers, an integrated fare
system, and system improvements to facilitate quick boarding and alighting.
• Expand Caltrain service with network extensions to facilitate regional trips
and to better serve Caltrain passengers. (Service expansion could be
achieved through partnerships with other agencies or by third party
implementation.)
• Provide transit transfer information at stations that is easy to follow and
understand.
• Work with other transportation providers and local agencies to build
adequate facilities for joint use between multiple transit operators. (Factor
track capacity needs of other transit providers and freight operators that
use the Caltrain right-of-way.)
• Capture an increasing percentage of the mode split of north-south trips
made along the Peninsula corridor.
CHALLENGES
> The primary challenge to promoting regionalconnectivity is developing theinteragency partnerships thatare required to coordinatemultiple transit systems so thatthey function seamlessly.
> Another challenge topromoting regional connectivitywill be financing the capital andservice improvements thatmust be made in order tofacilitate seamless connectionsbetween transit systems.
OPPORTUNITIES
> Expansion projects at theDiridon Station in San Jose andthe Transbay Terminal in SanFrancisco would facilitate directconnections between multipletransit operators (rail and bus).
> Several of the planned system improvements presentopportunities for servingregional trips on Caltrain. These include extensions todowntown San Francisco, across the Dumbarton Bridge to the East Bay, and to Salinasand Monterey.
> By connecting with HighSpeed Rail, Caltrain will have an opportunity to serve ridersthat are traveling to and fromthe region.
CALTRAIN STRATEGIC PLAN 2004 | 202314
3G U I D I N G P R I N C I P L E 3
Promote Regional Connectivity and Cooperation with Other Transportation Providers
Promoting regional connectivity is essential to meet regional mobility needs, achieve
environmental goals, and provide Bay Area residents and visitors with viable
transportation options. It is also a critical component of developing a more
sustainable future for the Bay Area through a stronger integration of land use and
the transportation system. By cooperating with other agencies and transportation
providers, Caltrain can improve the movement of people and goods throughout
the region.
MOBILITY &CONGESTIONMANAGEMENT
INTERAGENCYCOORDINATION
FREIGHT & GOODS MOVEMENT
To serve regional objectives, Caltrain must be effective in alleviating traffic congestion,
particularly along the Peninsula Corridor. As population and job growth occur over
the next 20 years, continued low-density development patterns and the scarcity of
affordable housing in urban centers will result in more automobile travel, more traffic,
and environmental degradation. The problems that stem from traffic congestion
challenge all Bay Area transportation providers to be proactive in finding a solution.
To meet regional travel demands, the regional transportation system must function
as one seamless system rather than as multiple disjointed parts. An optimal regional
system facilitates timed transfers, employs an integrated fare system, and delivers
real-time information. The contribution that Caltrain makes to improve regional
connectivity will assist in meeting regional goals related to congestion management,
air quality, and land use. Coordinating with other transit providers to connect service
and build intermodal facilities will allow Caltrain to better serve its passengers and the
communities along its route.
The Caltrain right-of-way provides the only freight rail access to the Peninsula and
San Francisco. It plays a key role in goods movement and alleviating truck traffic
congestion on local roads and highways. Understanding freight needs is essential for
Caltrain to continue improving regional mobility and supporting local businesses.
CALTRAIN STRATEGIC PLAN 2004 | 2023
GUID ING PRINCIPLES
17
To partner with communities and broaden communications with
the public Caltrain must:
• Strive to improve relationships with cities and external agencies. Develop
strong relationships with the public, policy makers, and Caltrain staff by
conducting frequent outreach efforts and acting upon lessons learned
from outreach. Develop an effective external affairs program.
• Find win-win solutions for community issues, such as safety, and train and
construction noise.
• Manage corridor capacity to maximize and coordinate use of the tracks by
multiple transportation operators.
• Continue to improve system safety and security as necessary and work
with local jurisdictions and law enforcement to effectively implement
safety measures. Support programs in emergency preparedness and crime
prevention.
• Promote and create stations as public spaces. Present any station
improvements, grade separations, and other route enhancements as part of
a larger corridor plan.
• Maximize transit-oriented development opportunities along the Caltrain
route. Work with member agencies in pursuing TOD in the individual
counties. Work with local jurisdictions to support businesses by attracting
people to the communities where stations are located.
CHALLENGES
> A major challenge to partneringand broadening communicationswith the public and other transpor-tation providers is being able tobuild consensus and find win-winsolutions for competing interests.
OPPORTUNITIES
> Caltrain can foster solidrelationships with other agenciesand communities by collaboratingto achieve system improvements,whether gathering public input orsharing responsibility forimplementing projects. Systemimprovements that reduce trainnoise or increase system safety inthe Caltrain right-of-way benefitpassengers and non-passengersalike.
> Engaging in joint-developmentventures on TOD projects is one wayin which Caltrain can begin toestablish partnerships with publicand private entities. Future TODprojects in the planning stageinclude: (1) the new TransbayTerminal in downtown SanFrancisco, which will serve Caltrain,AC Transit, BART, Golden GateTransit, Muni’s Metro and buses,SamTrans, and HSR. It will besurrounded by over seven millionsquare feet of new developmentincluding 4,700 residential units; (2)the Peninsula Corridor Plan whichincludes plans for creating vibrantcommunities and building TODaround multiple San Mateo CountyCaltrain stations; and (3) theDiridon/Arena StrategicDevelopment Plan, which includesthe expansion of the Diridon Stationin San Jose and intensive housingand commercial development. Theexpanded Diridon Station will serveCaltrain, ACE, Amtrak, BART, CapitalCorridor, HSR, VTA light rail, andbuses.
CALTRAIN STRATEGIC PLAN 2004 | 202316
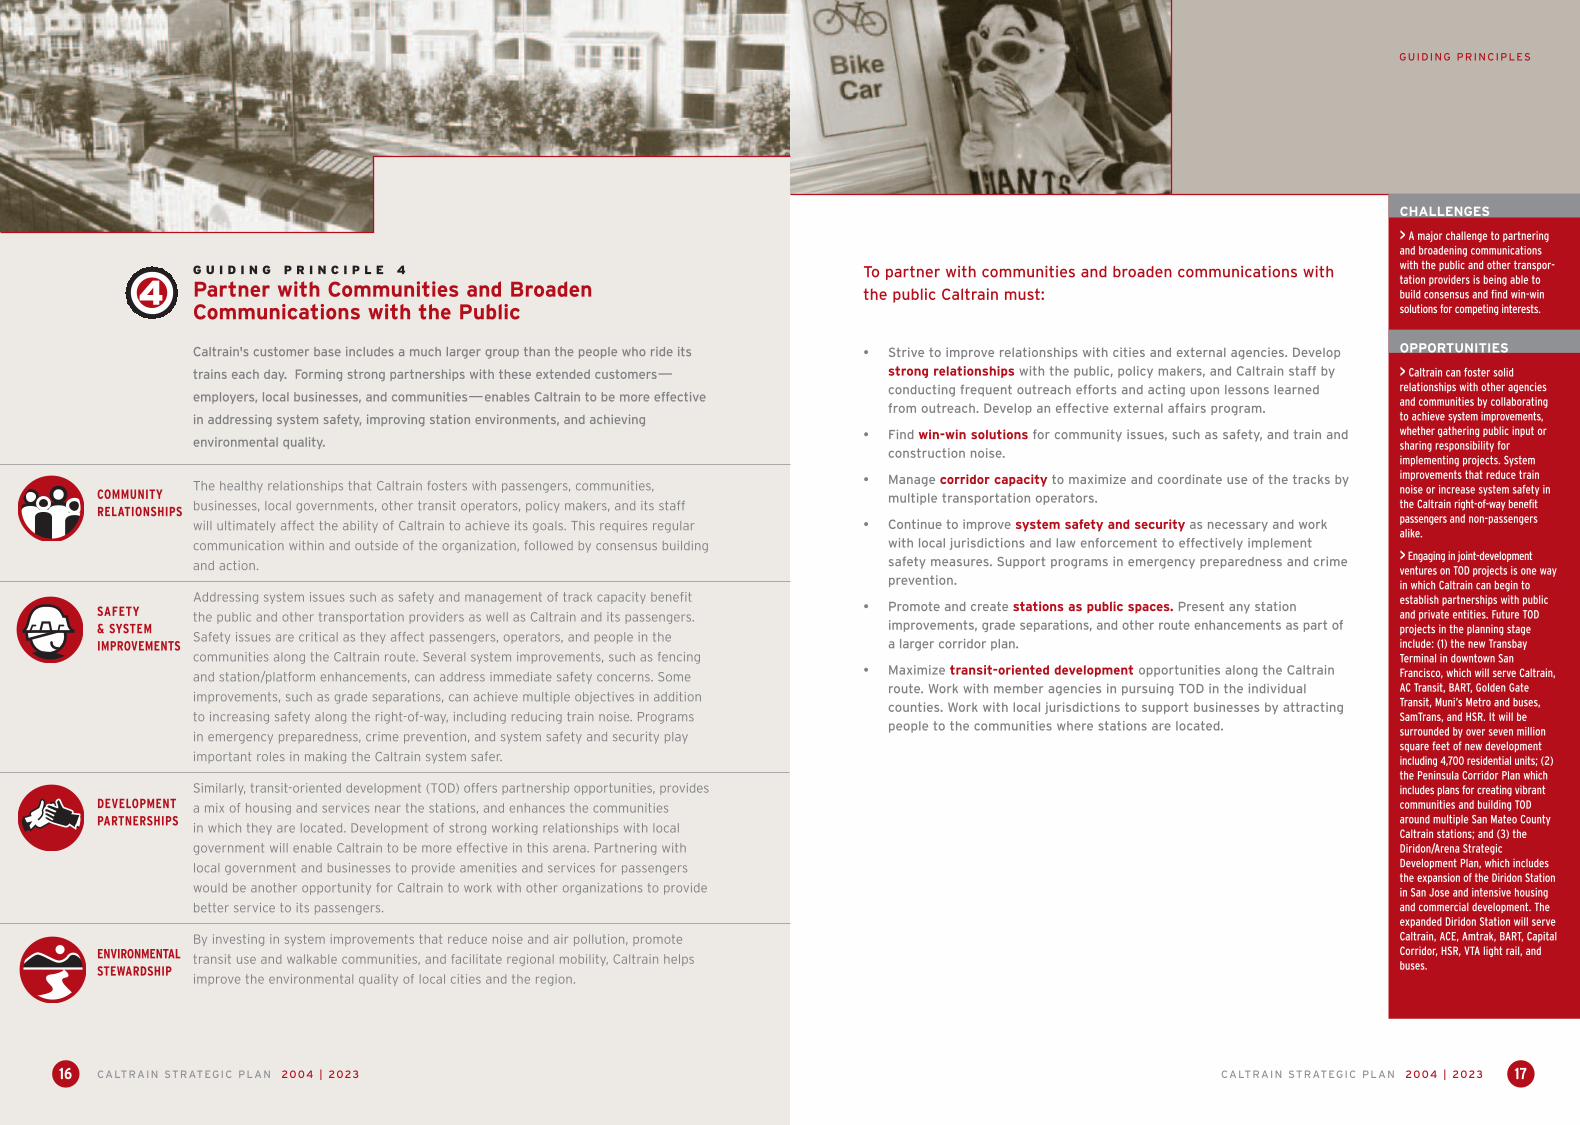
4G U I D I N G P R I N C I P L E 4
Partner with Communities and Broaden Communications with the Public
Caltrain's customer base includes a much larger group than the people who ride its
trains each day. Forming strong partnerships with these extended customers—
employers, local businesses, and communities—enables Caltrain to be more effective
in addressing system safety, improving station environments, and achieving
environmental quality.
COMMUNITYRELATIONSHIPS
SAFETY & SYSTEMIMPROVEMENTS
DEVELOPMENTPARTNERSHIPS
ENVIRONMENTALSTEWARDSHIP
The healthy relationships that Caltrain fosters with passengers, communities,
businesses, local governments, other transit operators, policy makers, and its staff
will ultimately affect the ability of Caltrain to achieve its goals. This requires regular
communication within and outside of the organization, followed by consensus building
and action.
Addressing system issues such as safety and management of track capacity benefit
the public and other transportation providers as well as Caltrain and its passengers.
Safety issues are critical as they affect passengers, operators, and people in the
communities along the Caltrain route. Several system improvements, such as fencing
and station/platform enhancements, can address immediate safety concerns. Some
improvements, such as grade separations, can achieve multiple objectives in addition
to increasing safety along the right-of-way, including reducing train noise. Programs
in emergency preparedness, crime prevention, and system safety and security play
important roles in making the Caltrain system safer.
Similarly, transit-oriented development (TOD) offers partnership opportunities, provides
a mix of housing and services near the stations, and enhances the communities
in which they are located. Development of strong working relationships with local
government will enable Caltrain to be more effective in this arena. Partnering with
local government and businesses to provide amenities and services for passengers
would be another opportunity for Caltrain to work with other organizations to provide
better service to its passengers.
By investing in system improvements that reduce noise and air pollution, promote
transit use and walkable communities, and facilitate regional mobility, Caltrain helps
improve the environmental quality of local cities and the region.
CALTRAIN STRATEGIC PLAN 2004 | 2023
GUID ING PRINCIPLES
19
To develop a solid financial foundation that ensures long-term
sustainability Caltrain must:
• Balance the implementation and timing of system improvements with
committed funding.
• Develop a capital improvement program that outlines potential development
scenarios based on prospective funding opportunities.
• Explore innovative ways to secure long-term funding to guide Caltrain into
the future. Programs such as high-speed rail bonds, bridge tolls, local sales
tax authorizations, future federal authorizations as well as non-traditional
programs such as tax increment financing, lease backs, public private part-
nerships, and joint TOD opportunities should be pursued to ensure funding is
available to meet future needs.
• Support each county’s effort toward developing a dedicated source of
funding. Secure local matching funds to leverage committed state and
federal capital grants.
• Develop financial plans and programs that reflect the financial capacity of
the member agencies.
CHALLENGES
> A major challenge to developing a strong financialfoundation will be garneringlegislative support for dedicat-ed funding sources, such as asales tax measure.
> Another challenge will be to establish partnerships with public or private entitiesto explore more innovativefinancing options.
OPPORTUNITIES
> Opportunities for solidifyinglong-term financial resourcesfor Caltrain include multipleinnovative funding strategiesthat have proven effective else-where, including joint TODopportunities near stations.
CALTRAIN STRATEGIC PLAN 2004 | 202318
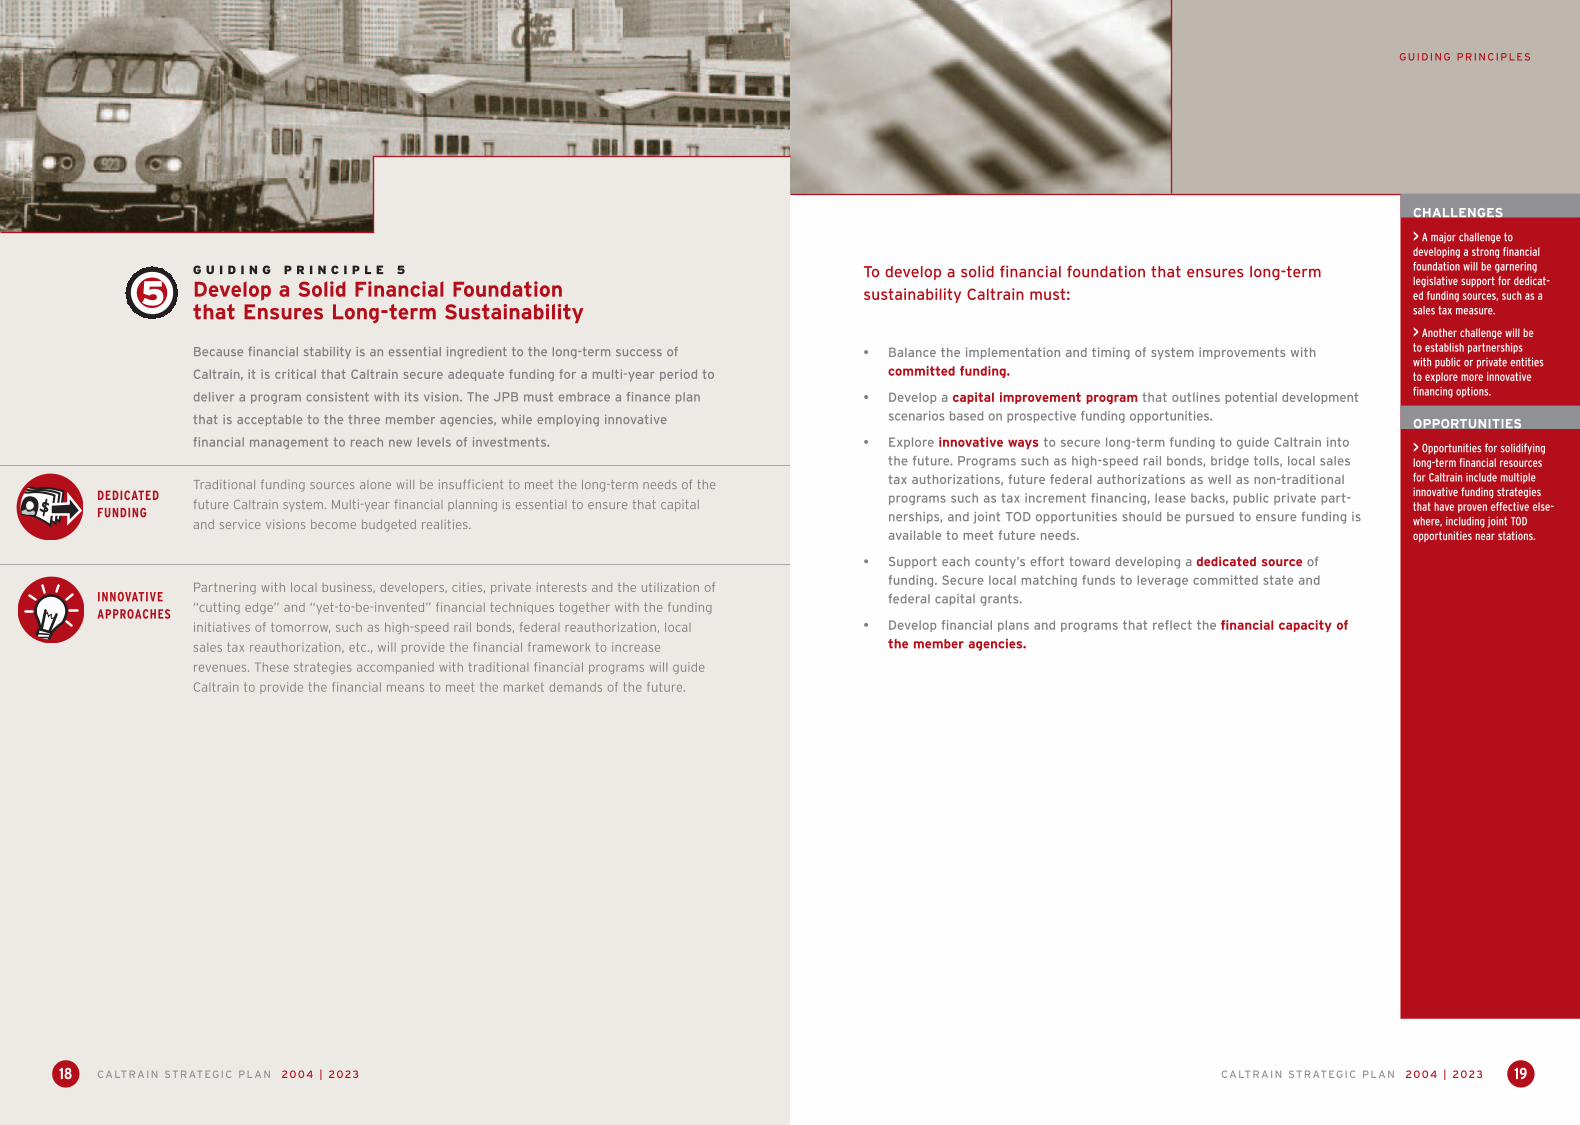
5G U I D I N G P R I N C I P L E 5
Develop a Solid Financial Foundation that Ensures Long-term Sustainability
Because financial stability is an essential ingredient to the long-term success of
Caltrain, it is critical that Caltrain secure adequate funding for a multi-year period to
deliver a program consistent with its vision. The JPB must embrace a finance plan
that is acceptable to the three member agencies, while employing innovative
financial management to reach new levels of investments.
DEDICATEDFUNDING
INNOVATIVEAPPROACHES
Traditional funding sources alone will be insufficient to meet the long-term needs of the
future Caltrain system. Multi-year financial planning is essential to ensure that capital
and service visions become budgeted realities.
Partnering with local business, developers, cities, private interests and the utilization of
“cutting edge” and “yet-to-be-invented” financial techniques together with the funding
initiatives of tomorrow, such as high-speed rail bonds, federal reauthorization, local
sales tax reauthorization, etc., will provide the financial framework to increase
revenues. These strategies accompanied with traditional financial programs will guide
Caltrain to provide the financial means to meet the market demands of the future.
CALTRAIN STRATEGIC PLAN 2004 | 2023
FROM PRINCIPLE TO POLICY
21CALTRAIN STRATEGIC PLAN 2004 | 202320
The Build-Out Scenario is the “ultimate” scenario that integrates Caltrain and the
proposed statewide high-speed rail system. The objective of the Build-Out Scenario
is to capture a significant market share of trips by providing a travel experience sim-
ilar to the Enhanced Scenario that is complemented by the additional service and
amenities offered by the connection to high-speed rail. It assumes that additional
funding resources via high-speed rail bonds and other resources would be available.
An aggressive innovative financing program would be required.
More detailed information on each of the scenarios is presented in the chapter titled
“The Future Scenarios.”
Policy QuestionsSix policy questions were developed that address how Caltrain will make key decisions
regarding future service and capital improvements and financial strategies. Many
decisions regarding capital improvements need to be made within the next few years
so that the necessary funding can be secured and costly re-dos are avoided. The
findings and evaluation of the scenarios, along with input received from the member
agencies and the general public were used to answer the following policy questions:
• Scenario Approach: Should one scenario be selected or should the scenar-
ios be viewed as part of a continuum? In a continuum, key funding opportu-
nities and increased demand for service can trigger a shift to another
scenario.
• Financial Strategy: Should Caltrain continue with annual review utilizing the
“pay-as-you-go” approach or strive for long-term stability by utilizing innova-
tive finance techniques?
• Service Levels: Should service levels be determined by projected financial
resources or should it be market-driven?
• System Rehabilitation: Should Caltrain follow a normalized rehabilitation
and replacement schedule or follow an accelerated schedule that is com-
bined with other capital improvement projects?
From Principle to Policy
The Scenario ApproachFollowing the development of the Vision & Guiding Principles, four future scenarios
were developed to prepare Caltrain for different possible financial futures in light of
multiple unknowns, such as upcoming ballot measures and the economic climate.
These scenarios were used to answer key policy questions and will set a clear direc-
tion for making detailed service, capital, and financial decisions. The four scenarios
are: Status Quo, Moderate Growth, Enhanced, and Build-Out.
The Status Quo Scenario is the most financially constrained scenario. It follows a
“pay-as-you-go” approach and assumes that only current (2004) levels of commit-
ted and programmed funds are available. It is assumed that upcoming local sales tax
measures would not be reauthorized and no innovative funding sources would be
pursued. The objective of the Status Quo Scenario is to keep the railroad operating
at current levels of service, optimize existing infrastructure, and limit investment in
improvements other than normalized rehabilitation and replacement.
The Moderate Growth Scenario is a steady growth scenario and is financially con-
strained in the first five years. Similar to the Status Quo Scenario it follows a “pay-
as-you-go” approach, but requires some additional resources above current levels to
fund planned improvements. It is assumed that upcoming local sales tax measures
would not be reauthorized and no innovative funding sources would be pursued. The
objective of the Moderate Growth Scenario is to optimize the operating and capital
programs with limited increases in funding resources, service, and capital improve-
ments.
The Enhanced Scenario is the “market-driven” scenario. It is financially constrained
in the first five years (same as the Moderate Growth Scenario), and assumes that
additional resources become available in the outer years. The main objective of the
Enhanced Scenario is to capture latent market demand by providing optimal levels
of service, improving station access and regional connectivity, and incorporating uni-
versal design elements and customer amenities that are characteristic of a “world
class” railroad. Innovative financing techniques would have to be pursued.

CALTRAIN STRATEGIC PLAN 2004 | 202322 CALTRAIN STRATEGIC PLAN 2004 | 2023 23
FROM PRINCIPLE TO POLICY
approach given the unpredictable
nature of the economic climate and
future funding sources. The strategy
for Caltrain should be to begin with
the Status Quo Scenario and
advance to the Moderate Growth,
Enhanced, or Build-Out Scenario
when critical milestones are
reached. Critical milestones would
include securing additional capital
and operating funds. Because the
first five years of the capital pro-
gram are financially constrained
in all scenarios, there is some flexi-
bility with regard to securing funds
to meet the projected shortfalls.
• Financial Strategy: Should Caltrain
continue with annual review by
utilizing the “pay-as-you-go”
approach or strive for long-term
stability by utilizing innovative
finance techniques?
Given the uncertainty of the “pay-
as-you-go” approach and the com-
plexities it creates when planning
and coordinating future improve-
ments, Caltrain should strive for
long-term stability through dedicat-
ed funding sources and innovative
techniques. This strategy is in line
with the fifth guiding principle,
which is to “develop a solid financial
foundation that ensures long-term
sustainability.” Securing dedicated
funding sources will enable Caltrain
to meet projected funding shortfalls,
plan future service and capital
improvements, and implement the
improvements in a timely manner. It
will be critical for shifting from the
Status Quo or Moderate Growth to
the Enhanced or Build-Out Scenario.
• Service Levels: Should service
levels be determined by financial
resources or should it be market-
driven?
Service levels must be tied to
productivity and public demand, yet
balanced with funding availability.
Good information on market demand
is necessary to determine the
service characteristics that are
desired by the public and to
prioritize service improvements as
funding becomes available. Because
service improvements sometimes
require capital projects, the avail-
ability of capital funding can directly
affect service levels.
• System Rehabilitation: Should
Caltrain follow a normalized rehabili-
tation and replacement schedule or
an accelerated schedule?
FROM PRINCIPLE TO POLICY
• Electrification: Should electrifica-
tion be deferred until funding is
available or should design continue?
• Capacity Improvements:
What level of capacity improve-
ments should Caltrain invest in to
improve headways and reliability of
service in the peak periods?
Each scenario has a different combina-
tion of assumptions regarding funding
availability and finance strategies,
service levels, and capital improve-
ments. These shape the general policy
direction and objective of each
scenario. In general, the Status Quo
and Moderate Growth scenarios take a
more conservative approach in their
policy positions, while the Enhanced
and Build-Out Scenarios include
market-driven service and capital
improvements as well as innovative
financing techniques. The scenario policy
approaches are presented below in
Table 1.
The following conclusions to the six
policy questions were drawn based on
comprehensive outreach to the public
and to the member agencies:
• Scenario Approach: Should one
scenario be selected or should
the scenarios be viewed as part of
a continuum?
It is clear that the continuum is the
most prudent and practical scenario
TA B L E 1 : S C E N A R I O P O L I C I E S
MODERATESTATUS QUO GROWTH ENHANCED BUILD-OUT
Annual review, Long-term stability, Long-term stability,Financial Maintain 2004 Annual review, Innovative InnovativeStrategy level of Pay-as-you-go Finance Finance
investment Strategies Strategies
Service Maintain 2004 Moderate Market-driven Market-drivenLevels level of service growth
System Scheduled/ Scheduled/ Accelerated AcceleratedRehabilitation Normalized Normalized
Continue Deferred Deferred until with Design,
Electrification indefinitely funding Continue with must coordinate Design with HSR construction
Only CTX North quadrant Capacity improvements (San Mateo North, Central, Entire routeImprovements complete in County) and and South
2004 South (Partial)
available

CALTRAIN STRATEGIC PLAN 2004 | 2023
FROM PRINCIPLE TO POLICY
25
Snapshot of theContinuum and FutureImprovementsBased on the policy approach outlined
in the previous section, a conceptual
schedule was developed for the capital
improvements that can be expected in
the next 20 years. The following time-
line provides a snapshot of what the
capital program will include. The
projects or programs that depend on
service and financial triggers, such
as establishing dedicated funding
sources, are distinguished from ongoing
programs, such as rehabilitation, which
are almost completely funded.
Projections of revenue availability
are based on past experience and
reasonable estimates of future events.
These revenue projections assume
that all of the local matching funds
identified in the financial plans will
be approved annually by Caltrain’s
three member agencies.
As shown in the header row of the time-
lines below, Caltrain could begin with
the Status Quo Scenario and shift to
the Moderate Growth Scenario within
the first five years, once funding for
identified shortfalls is secured and a
funding plan for electrification is devel-
oped. By the end of the first five years,
CALTRAIN STRATEGIC PLAN 2004 | 2023
FROM PRINCIPLE TO POLICY
24
Capital replacement and rehabilita-
tion must not be deferred but should
be implemented in the most cost-
effective manner. When opportuni-
ties arise, rehabilitation should be
accelerated to prevent a situation of
deferred maintenance, which can
greatly increase maintenance costs.
It is critical to balance rehabilitation
with other improvements in the
capital program.
• Electrification: Should electrifica-
tion be deferred until funding is
available or should design continue?
Design for the electrification
project should continue and should
be factored into all improvement
projects along the right-of-way.
Phasing of implementation should
be part of the design development.
A funding plan must be created in
order to implement the project and
avoid further delays.
• Capacity Improvements: What level
of capacity improvements should
Caltrain invest in to improve head-
ways and reliability of service in the
peak periods?
Capital improvements that expand
system capacity, such as adding
additional tracks, must be tied to
service objectives, and must be bal-
anced with other projects in the
capital program. Caltrain should
explore the most cost-effective
means for improving service before
investing in capacity expansion.F U T U R E I M P R O V E M E N T S T I M E L I N E
REPLACEMENT AND REHABILITATION
ENHANCEMENT PROGRAM
Electrification
Other Enhancements
CAPACITY EXPANSION
SUPPORT PROGRAM
EXPANSION (THIRD-PARTY PROJECTS)
Downtown San Francisco Extension
Dumbarton Rail Corridor
Monterey/Salinas Extension
STATUS QUO TO
MOD. GROWTH
2004-2008
MOD. GROWTH TO
ENH./BUILD-OUT
2009-2013
ENHANCED/BUILD-OUT
2014-2018 2019-2023
Programmed for completion within timeframe
Requires funding or other trigger for completion within timeframe
(includes design/development and construction).
CALTRAIN STRATEGIC PLAN 2004 | 2023
FROM PRINCIPLE TO POLICY
27
ENHANCEMENT PROGRAM
• Electrification project completed
within the first ten years. Full
funding has been identified for
the project in the outer years of the
20-year time period. A funding plan
to bring all dedicated funds forward
must be developed in order to
implement the project within the
ten-year time frame.
• Other enhancements, such as
improved station access and
customer amenities, will require
additional funding.
CAPACITY EXPANSION
• Funding has been identified in
the first five years for capacity
expansion projects, which include
grade separations, track and signal
construction, and station improve-
ments. Additional capacity expansion
may be necessary to substantially
improve service levels and will
depend on demand for service
and the availability of funds.
SUPPORT PROGRAM
• The support program consists of
project development and capital pro-
gram development. Full funding has
been identified for the next 20 years.
REGIONAL EXTENSIONS
• Regional extensions include the
Downtown extension to a rebuilt
Transbay Terminal in San Francisco,
the Dumbarton Rail Corridor, and
the extension to Monterey and
Salinas. These are considered third-
party projects whose capital costs
are not included in the Capital Plan.
While they are all currently partially
funded and not included in the
Status Quo or Moderate Growth
Scenarios, it is assumed that plan-
ning and design will continue and
that they will be implemented within
the next 10 years.
CALTRAIN STRATEGIC PLAN 2004 | 2023
FROM PRINCIPLE TO POLICY
26
it will be determined whether or not
high-speed rail will be constructed
along the Caltrain corridor. In the
second five-year period, Caltrain could
shift from the Moderate Growth
Scenario to either the Enhanced or
Build-Out Scenario, depending on the
status of the high-speed rail project.
This scenario shift from the Moderate
Growth Scenario would require Caltrain
to secure operating and capital funds
for the Enhancement and Capacity
Expansion programs. By the second
half of the 20-year period, Caltrain
would be in the Enhanced or
Build-Out Scenario.
Existing sales tax measures (Measure
A) in San Mateo and (Measure A) Santa
Clara counties and a new sales tax
measure (Proposition K) in San
Francisco County provide funds for
Caltrain capital projects. Two upcoming
ballot measures that would provide
funding for enhancements and capacity
expansion are the reauthorization of
the San Mateo County sales tax
(November 2004) and the high-speed
rail bond measure (November 2006 or
2008). Revenue from the San Mateo
County sales tax would help to meet
most of the $220 million capital short-
fall in the Moderate Growth Scenario.
Any additional funding sources could be
used toward achieving improvements
included in the Enhanced Scenario.
If the high-speed rail bond measure
passes, Caltrain would be positioned
to shift into the Build-Out Scenario by
the second five-year period.
The following describes the capital
program according to the scenario
approach outlined above:
REPLACEMENT AND
REHABILITATION
• Ongoing throughout 20-year period
independent of scenario. May be
accelerated in the Enhanced and
Build-Out Scenarios. Full funding has
been identified for the Replacement
and Rehabilitation program in the
Status Quo and Moderate Growth
Scenarios. Over ninety-five percent
of Replacement and Rehabilitation
funding sources have been identified
for the Enhanced and Build-Out
Scenarios.
• Major programs include replacement
and overhaul of rolling stock and
rehabilitation of track, bridges,
tunnels, signals and grade crossings.
Replacement of rolling stock must
be coordinated with the timing of
the electrification project which will
require the purchase of new electric
locomotives. Platform improvements
at key stations to remove the hold-
out rule are included.

CALTRAIN STRATEGIC PLAN 2004 | 2023
THE FUTURE SCENARIOS
29CALTRAIN STRATEGIC PLAN 2004 | 202328
The Future Scenarios
Developing the ScenariosOnce the policy approach for each scenario was defined, the financial, service, and
capital assumptions were developed further and are detailed in three supporting
plans: the Finance, Service, and Capital Plans. The three plans are currently being
finalized and will be presented to the Joint Powers Board for adoption in Fall/Winter
of 2004. The following are descriptions and objectives of each supporting plan.
FINANCE PLAN OBJECTIVES
The Finance Plan details the funding assumptions and funding strategies for each
scenario. Specifically, the Finance Plan objectives are to:
• Identify available funding over the next 20 years
• Maximize the availability of federal and state revenues in cooperation
with the member agencies
• Identify discretionary sources that are not being utilized
• Develop an inventory of potential innovative finance programs
• Match available funding with eligible capital and service programs
• Project funding shortfalls and develop strategies to deliver future programs
SERVICE PLAN OBJECTIVES
The Service Plan outlines the service goals for each of the scenarios as well as a
20–year plan to deliver them. Its main objectives are to:
• Determine future level of service (Trains per day/per hour)
• Design a flexible mix of service (Express/Limited/Local)
• Identify the triggers (productivity or other performance measures)
for changes in service
• Identify the efforts needed to increase market share
As stated in the Guiding Principles, understanding market demand is the key to
retaining existing riders and attracting new riders. It will influence the mix and
scheduling of Caltrain service, the nature and timing of capital improvements that
support service and operations, and the overall passenger experience on Caltrain.
Meeting market demand requires:
• Creating a flexible mix of service—local, limited, express
• Optimizing service levels and reducing overall trip times
• Improving connections between Caltrain and other systems
• Providing better access to stations (pedestrian, ADA, transit, bicycle
and vehicular access)
• Providing amenities to enhance the passenger experience
Universal Design Elements. Market research in the Caltrain service area reveals
that many service improvements to transit will have broad appeal to existing and
potential riders and will substantially increase ridership. These universal design ele-
ments address key traveler attitudes and desires, forming the core of the Caltrain
brand identity:
• Privacy and Comfort is important to all of the service population in varying
degrees. Travelers desire comfortable, stress-free travel and privacy from
other travelers. Lower cost strategies include training and enforcement
policies to control noisy or unruly passengers. Higher cost efforts include
providing spacious seating on all trains and interiors with some separation
from other travelers.
• Personal Safety is perceived as very important to the vast majority of our
service population while accessing or riding the system. Strategies to address
the need for personal safety include zero tolerance policies for aggressive
behavior and well-lighted, graffiti-free shelters with 911 emergency phones.
• Addressing Flexibility, or the need to travel to many locations at times that
vary from day to day, is a challenge for transit. Successful strategies include
mid-day shuttle services at major business parks, station cars and other
personal transport rentals, and improved land use to increase access to
retail and commercial services.

CALTRAIN STRATEGIC PLAN 2004 | 2023
THE FUTURE SCENARIOS
31CALTRAIN STRATEGIC PLAN 2004 | 2023
THE FUTURE SCENARIOS
30
• Reliability of service is a key
attribute that addresses passengers’
desire to minimize unexpected delay.
Improving stations to eliminate
“hold-out” delays, providing for
faster boarding of passengers
needing assistance, and increasing
Caltrain track capacity will all
contribute to increased service reli-
ability. Also important are reliable
connections to other rail services,
buses, and shuttles.
• Increasing the Ease of Transit Use
is possible through service improve-
ments such as universal fare media
or including transfer costs in a sin-
gle fare, providing easy access to
transit information, and implement-
ing real-time information. In addition
to making transit more user-friendly,
the increasing hassle and cost of
auto use—external factors often
associated with parking and traffic
congestion—make transit a more
attractive option for travelers.
CAPITAL PLAN OBJECTIVES
The Capital Improvement Plan consists
of a wide array of improvements,
categorized by Replacement and
Rehabilitation, Enhancement, and
Support programs. Regional extensions
are categorized as third-party projects.
The Capital Plan supports the Service
Plan by including improvements that
are necessary to implement the service
goals of each scenario. The main objec-
tives of the Capital Plan are to:
• Identify the magnitude of system
rehabilitation and replacement
• Identify the improvements required
to realize the service goals
• Develop conceptual cost estimates
of proposed capital programs
• Develop techniques for implementing
cost-effective capital improvement
programs
Replacement and Rehabilitation projects
include improvements needed to bring
the railroad into a good state of repair
and to continue scheduled replacement
of infrastructure and rolling stock.
The major projects in this category
are bridge rehabilitation, rolling stock
overhaul and replacement, and track
rehabilitation, which comprise two-thirds
of the approximate $900 million
Replacement and Rehabilitation pro-
gram (in 2003 dollars). Also included is
the reconstruction of stations to elimi-
nate the hold-out rule at most stations.
The replacement and rehabilitation
needs are generally consistent between
scenarios. Any variations are due to
reconstruction projects that occur
under the enhancement program and
defer the need for replacement.
Enhancement projects include
upgrades to the system, new construc-
tion, and amenities. The major projects
TA B L E 2 : C A P I TA L I M P R O V E M E N T P L A N P R O J E C T S
REPLACEMENT AND REHABILITATION
ENHANCEMENT PROGRAM
SUPPORT PROGRAM
REGIONAL EXTENSIONS (THIRD PARTY PROJECTS)
ADA Station & Rolling Stock Upgrades
Bridge Rehabilitation
Capitalized Maintenance
Communication Equipment
Fare Equipment Replacement
Fencing Replacement
Grade Crossing Rehabilitation
Operational Facilities & Equipment
Parking Rehabilitation
Rolling Stock Overhaul & Replacement
Seismic Retrofit Evaluation
Station Improvements (Access)
Station Improvements (Hold-out rule)
Track Rehabilitation*
Tunnel Rehabilitation
Automatic Train Control
Bicycle Facilities
Bridge Construction
Construction/Maintenance/Equipment
Contractor Operator Support
Electrification
Fare Equipment
Fencing
Fiber Optic Communications
Grade Separations*
Integrated Messaging
Intelligent Transportation Systems
Parking Expansion
Right-of-Way Access Control
Security
Signal Construction*
Station Improvements
Track Construction*
Transit-0riented/Joint Development
Tunnel Construction
Capital Program Support, Development Project Development
Downtown San Francisco Extension
Dumbarton Rail Corridor
Monterey/Salinas Extension
* Indicates improvements typically included in capacity expansion projects.
in this category include electrification
and improvements related to capacity
expansion, such as grade separations
and track construction. Capacity
expansion projects can include track
rehabilitation as well as new construction
and are necessary to increase express
service in the peak periods. The capacity
expansion projects are typically pack-
aged together because it is more
cost-effective to implement them
simultaneously.

CALTRAIN STRATEGIC PLAN 2004 | 2023 33
THE FUTURE SCENARIOS
TA B L E 3 : S C E N A R I O C H A R A C T E R I S T I C S S U M M A R Y—S TAT U S Q U O A N D M O D E R AT E G R O W T H
FINANCE (IN 2003 $) STATUS QUO MODERATE GROWTH
OperationsFarebox Revenue Historical Some Growth
Member Contributions Stabilized* Stabilized* or Decrease
CapitalFederal/State/Local Historical Historical
San Francisco Sales Tax Through 2034 Through 2034
San Mateo Sales Tax Through 2008 Through 2008
Santa Clara Sales Tax Through 2036 Through 2036
High-Speed Rail Bonds None None
Innovative Techniques None None
SERVICE BY 2023 STATUS QUO MODERATE GROWTH
Express Service Goal 10 trains/weekday 20 trains/weekdayone-hour headways one-hour headways
Weekday Total Trains 86 100
Saturday/Sunday Trains 32/30 32/30
Shuttle Buses (station access) 45 59
Customer Amenities Low Low
Average Weekday Ridership 43,700 59,600
Annual Ridership 14,369,000 19,484,000
Annual Operating Cost Avg./Total $83M / $1.67B $90M / $1.81B
Annual Member Contrb. Avg./Total $44M / $873M $44M / $872M
CAPITAL (IN 2003 $) STATUS QUO MODERATE GROWTH
Replacement & Rehabilitation Same Rehabilitation needs in all scenarios
Capacity Expansion North quadrant North and (partial) (SM County grade South quadrants
separations) by 2011
Electrification (Revenue Service) None 2018
Regional Extensions (Third-Party Projects)Downtown San Francisco No No
Dumbarton No No
Salinas/Monterey No No
Calif. High-Speed Rail No No
Total Capital Program Cost $1.151 Billion $2.000 Billion
(Shortfall) without innovative sources $0M Assumes ($217M) Assumes and HSR bonds $159M local match $164M local match
Note: Some figures may be revised once the Service and Capital Plans are finalized.*Member contributions that are stabilized are constant year-to-year with the exception of increases due to inflation.
CALTRAIN STRATEGIC PLAN 2004 | 2023
THE FUTURE SCENARIOS
32
The cost of the Enhancement program
varies widely between the scenarios
and depends primarily on the inclusion
of electrification and the extent of
capacity expansion along the corridor.
Due to inflation, the timing of projects
will also affect costs; however, only
constant dollars (2003) are shown in
the Strategic Plan. In the case of elec-
trification, the timing and coordination
with other improvements is also criti-
cal. Estimates show that electrifying
the railroad prior to the construction of
a grade separation can increase capital
costs (of electrification and the grade
separation) in the vicinity of the grade
separation project by 65 percent.
The Support program includes capital
program development and project
development.
Regional Extensions include the exten-
sion to Downtown San Francisco to a
rebuilt Transbay Terminal, the
Dumbarton Rail Corridor, and the exten-
sion to Monterey/Salinas. These exten-
sions are considered to be third-party
projects, and their capital costs are not
included in the Caltrain Capital
Improvement Plan. Additional operating
costs associated with the extension to
Downtown San Francisco have been
included in the Enhanced Scenario
beginning in 2010 and Build-Out
Scenario beginning in 2014. Operating
costs that would be incurred by the
Joint Powers Board for the Dumbarton
and Monterey/Salinas projects have not
been determined.
The financial, service, and capital
characteristics of the scenarios are
summarized in Tables 3 and 4 (pages
33 and 34) and are described further
on the following pages, followed by a
comparison and evaluation of all three
scenarios. All costs and revenues are
shown in 2003 dollars and shortfalls do
not include potential revenue from
innovative funding sources.
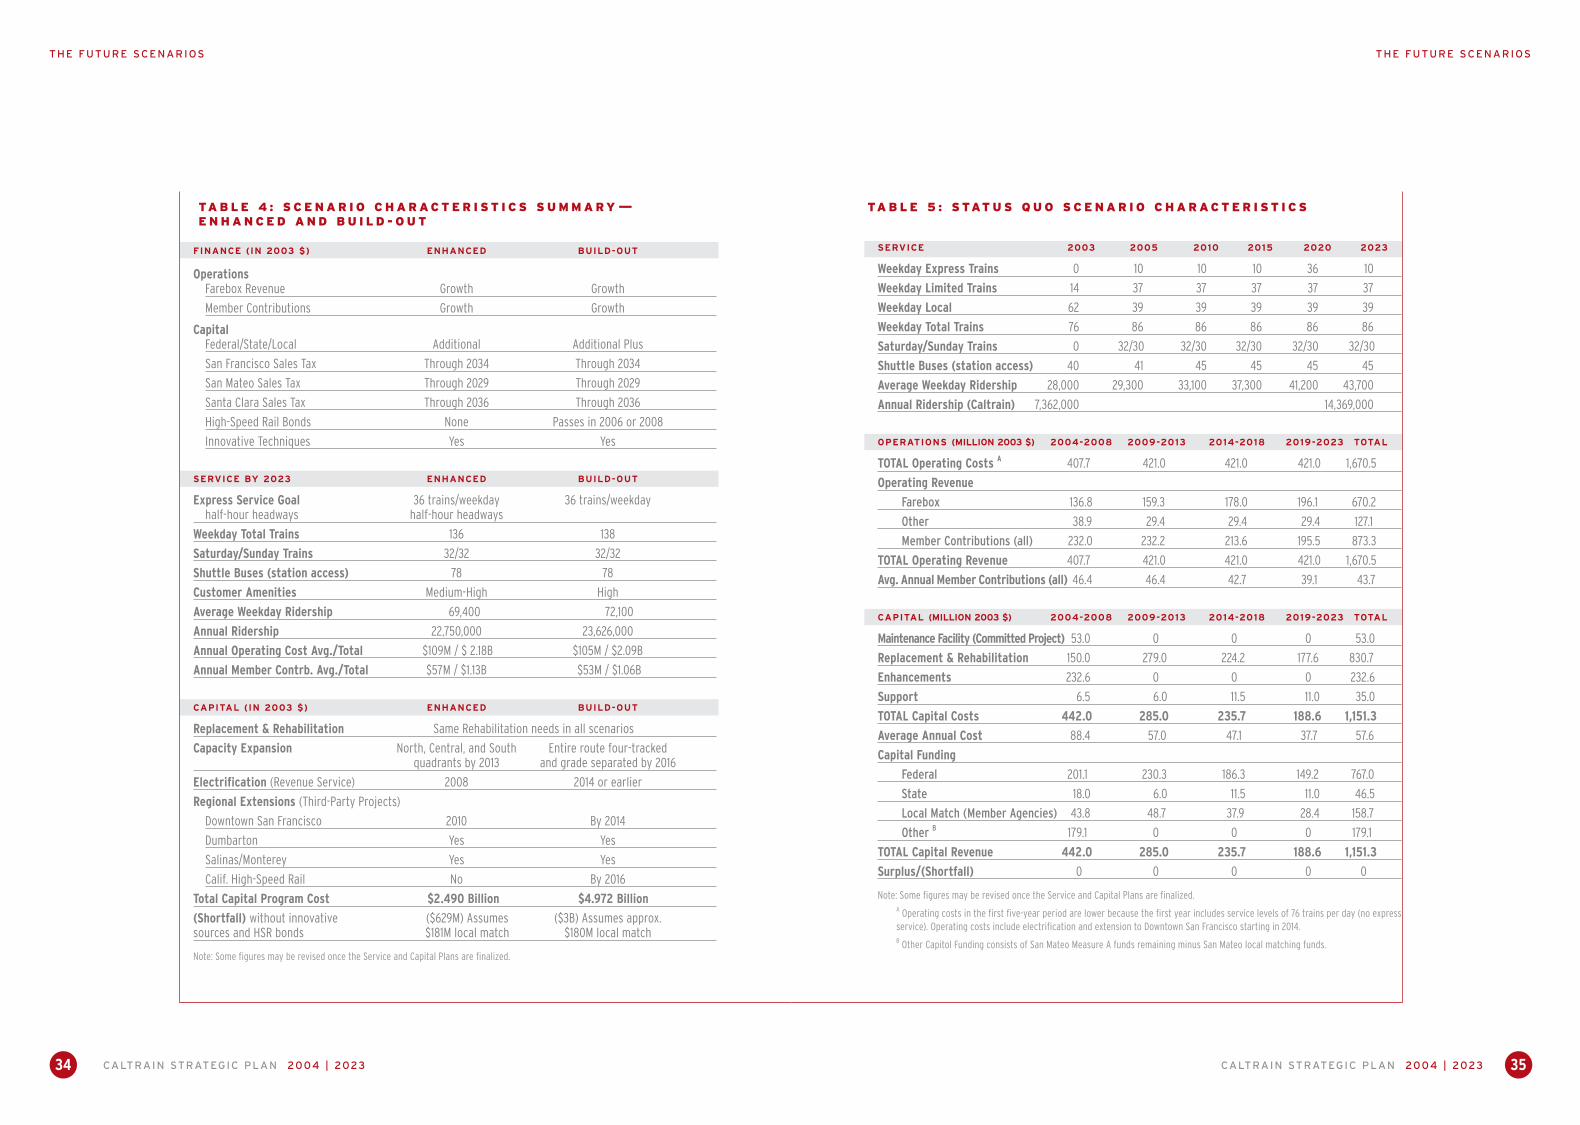
SERVICE 2003 2005 2010 2015 2020 2023
Weekday Express Trains 0 10 10 10 36 10
Weekday Limited Trains 14 37 37 37 37 37
Weekday Local 62 39 39 39 39 39
Weekday Total Trains 76 86 86 86 86 86
Saturday/Sunday Trains 0 32/30 32/30 32/30 32/30 32/30
Shuttle Buses (station access) 40 41 45 45 45 45
Average Weekday Ridership 28,000 29,300 33,100 37,300 41,200 43,700
Annual Ridership (Caltrain) 7,362,000 14,369,000
OPERATIONS (MILLION 2003 $) 2004-2008 2009-2013 2014-2018 2019-2023 TOTAL
TOTAL Operating Costs A 407.7 421.0 421.0 421.0 1,670.5
Operating Revenue
Farebox 136.8 159.3 178.0 196.1 670.2
Other 38.9 29.4 29.4 29.4 127.1
Member Contributions (all) 232.0 232.2 213.6 195.5 873.3
TOTAL Operating Revenue 407.7 421.0 421.0 421.0 1,670.5
Avg. Annual Member Contributions (all) 46.4 46.4 42.7 39.1 43.7
CAPITAL (MILLION 2003 $) 2004-2008 2009-2013 2014-2018 2019-2023 TOTAL
Maintenance Facility (Committed Project) 53.0 0 0 0 53.0
Replacement & Rehabilitation 150.0 279.0 224.2 177.6 830.7
Enhancements 232.6 0 0 0 232.6
Support 6.5 6.0 11.5 11.0 35.0
TOTAL Capital Costs 442.0 285.0 235.7 188.6 1,151.3
Average Annual Cost 88.4 57.0 47.1 37.7 57.6
Capital Funding
Federal 201.1 230.3 186.3 149.2 767.0
State 18.0 6.0 11.5 11.0 46.5
Local Match (Member Agencies) 43.8 48.7 37.9 28.4 158.7
Other B 179.1 0 0 0 179.1
TOTAL Capital Revenue 442.0 285.0 235.7 188.6 1,151.3
Surplus/(Shortfall) 0 0 0 0 0
Note: Some figures may be revised once the Service and Capital Plans are finalized. A Operating costs in the first five-year period are lower because the first year includes service levels of 76 trains per day (no expressservice). Operating costs include electrification and extension to Downtown San Francisco starting in 2014.B Other Capitol Funding consists of San Mateo Measure A funds remaining minus San Mateo local matching funds.
CALTRAIN STRATEGIC PLAN 2004 | 2023 35CALTRAIN STRATEGIC PLAN 2004 | 202334
THE FUTURE SCENARIOS
TA B L E 5 : S TAT U S Q U O S C E N A R I O C H A R A C T E R I S T I C S
THE FUTURE SCENARIOS
TA B L E 4 : S C E N A R I O C H A R A C T E R I S T I C S S U M M A R Y—E N H A N C E D A N D B U I L D - O U T
FINANCE (IN 2003 $) ENHANCED BUILD-OUT
OperationsFarebox Revenue Growth Growth
Member Contributions Growth Growth
CapitalFederal/State/Local Additional Additional Plus
San Francisco Sales Tax Through 2034 Through 2034
San Mateo Sales Tax Through 2029 Through 2029
Santa Clara Sales Tax Through 2036 Through 2036
High-Speed Rail Bonds None Passes in 2006 or 2008
Innovative Techniques Yes Yes
SERVICE BY 2023 ENHANCED BUILD-OUT
Express Service Goal 36 trains/weekday 36 trains/weekdayhalf-hour headways half-hour headways
Weekday Total Trains 136 138
Saturday/Sunday Trains 32/32 32/32
Shuttle Buses (station access) 78 78
Customer Amenities Medium-High High
Average Weekday Ridership 69,400 72,100
Annual Ridership 22,750,000 23,626,000
Annual Operating Cost Avg./Total $109M / $ 2.18B $105M / $2.09B
Annual Member Contrb. Avg./Total $57M / $1.13B $53M / $1.06B
CAPITAL (IN 2003 $) ENHANCED BUILD-OUT
Replacement & Rehabilitation Same Rehabilitation needs in all scenarios
Capacity Expansion North, Central, and South Entire route four-tracked quadrants by 2013 and grade separated by 2016
Electrification (Revenue Service) 2008 2014 or earlier
Regional Extensions (Third-Party Projects)
Downtown San Francisco 2010 By 2014
Dumbarton Yes Yes
Salinas/Monterey Yes Yes
Calif. High-Speed Rail No By 2016
Total Capital Program Cost $2.490 Billion $4.972 Billion
(Shortfall) without innovative ($629M) Assumes ($3B) Assumes approx.sources and HSR bonds $181M local match $180M local match
Note: Some figures may be revised once the Service and Capital Plans are finalized.
The capital program in the Status Quo Scenario assumes only current levels of
funding would be available through the 20-year period. Federal, State, and local
match funds for capital improvements are assumed to remain at historic levels.
Remaining funds from existing San Francisco, San Mateo, and Santa Clara
county sales tax measures would remain through 2008 and 2036, respectively.
Funds from the reauthorization of the sales tax measure in San Mateo County
are not included in the Status Quo assumptions.
Operating funds consist primarily of contributions from the member agencies
and farebox revenues. In the Status Quo Scenario, projected ridership and
farebox revenues would experience some growth, primarily as a result of popu-
lation and job growth in the area, since the level-of-service on Caltrain would
not change. Member agency contributions would remain constant or decrease
as ridership and farebox revenues increase.
Caltrain Express, included in all scenarios, will improve travel times for passen-
gers using this service. Passengers using the local service will experience no
service increases over time. In the Status Quo Scenario, most of the capital
program would consist of rehabilitation and replacement, which would not
make a noticeable difference to the passenger experience.
The Status Quo Scenario will result in an increase in annual ridership and rev-
enues. Ridership is projected to increase by approximately 100 percent over
the 20-year period and operating costs will stabilize. Member subsidies will sta-
bilize or gradually decrease in the future if farebox revenues increase. Most of
the $1 billion capital program would support rehabilitation and replacement to
keep the railroad in a good state of repair and avoid a system of deferred
maintenance.
Suggested triggers for switching from the Status Quo to the Moderate Growth
Scenario would include the availability of additional funding resources,
increased demand as measured by productivity criteria (load factors), or
demand for improved service that require additional capacity expansion. The
member agencies would have to agree on the level of service and associated
operating costs and capital investment required to provide this service.
FINANCIALRESOURCES
PASSENGEREXPERIENCE
KEY FINDINGS
A
Keep the railroad operating at current levels of service and limit investment in
improvements other than normalized rehabilitation and replacement.
The Status Quo Scenario is the most fiscally conservative of the four scenarios. It
assumes that current levels of funding will support 86-train weekday service
planned for 2004, normalized infrastructure rehabilitation and replacement, and
some capacity expansion in San Mateo County. It does not include the extension to
downtown San Francisco, extensions across the Dumbarton Bridge or to Salinas/
Monterey, or High-Speed Rail in California. Details of the Staus Quo Scenario charac-
teristics in five-year increments are shown in Table 5 (page 35).
The primary service goal is to maintain existing (2004) levels of service1, including
initial Caltrain Express or “Baby Bullet” service, through the 20-year period. The Status
Quo level-of-service on a typical weekday is capped at 86 trains per day, which includes
10 express trains. A flexible mix of local, limited, and express trains would have to be
scheduled to optimize service with existing infrastructure. Weekend and Gilroy service
would not change. Up to 45 shuttle bus routes would provide station access services.
The capital improvements in the Status Quo Scenario consist primarily of scheduled
replacement and rehabilitation projects, some station and platform improvements to
remove the hold-out rule2, programmed capacity expansion projects (grade separa-
tions in San Mateo County), and construction of the Caltrain Maintenance Facility.
These are projects with committed or programmed funds. There would be no High-
Speed Rail system along the Caltrain corridor in the Status Quo Scenario. In this sce-
nario, Capacity Expansion projects including track rehabilitation, grade separations,
signal construction, and track construction, comprise approximately $259 million (in
2003 dollars) of the total expenditures. These improvements, with the exception of
track rehabilitation, are funded by existing San Mateo County Measure A sales tax
revenue.
F U T U R E S C E N A R I O A
The Status Quo Scenario
1 Caltrain Express or “Baby Bullet” is a limited stop service which serves key stations along the Caltrain route. Express serviceoffers travel times of less than one hour between San Jose and San Francisco, compared to the one-and-a-half hour travel timeon local trains.
2 The hold-out rule is a safety measure that prevents a train from entering a station while another train is at the station boardingor unloading passengers. The hold-out rule is enforced at stations where passengers must cross active tracks to access a train,and can result in delays. Improvements associated with the Caltrain Express project will remove the hold-out rule at four stationsleaving a total of 12 hold-out stations by June 2004.
OBJECTIVE
GENERALCHARACTERISTICS
SERVICEIMPROVEMENTS
CAPITALIMPROVEMENTS
CALTRAIN STRATEGIC PLAN 2004 | 202336
FUTURE SCENARIOS
CALTRAIN STRATEGIC PLAN 2004 | 2023 37
FUTURE SCENARIOS
FUTURE SCENARIOSFUTURE SCENARIOS FUTURE SCENARIOS
The capital program in the Moderate Growth Scenario assumes a “pay-as-you-
go” approach. Federal, State, and local match funds for capital improvements
are assumed to remain at historic levels for the 20-year period. Remaining
funds from existing San Mateo and Santa Clara county sales tax measures are
assumed to remain, as well as the new sales tax measure in San Francisco.
However, the reauthorization of the sales tax measure in San Mateo County is
not included in the Moderate Growth assumptions. The electrification project is
included in Track 1 of MTC’s Regional Transportation Plan and has a funding
plan under MTC’s Regional Transit Expansion Policy, Resolution 3434. The timing
of the availability of electrification funds varies among the member agencies,
therefore, in this scenario it is assumed that funding for the project from MTC
and the member agencies will not be available until 2014.
Caltrain Express, included in all scenarios, will improve travel times for passen-
gers using this service. Passengers using the local service will experience nomi-
nal service increases over time. Programmed capital improvements are
designed to reduce delays and improve travel time for all passengers. These
projects will require up to ten years to complete, therefore, time-savings relat-
ed to these improvements will be realized gradually. Passengers could benefit
from a combination of local, limited, and express service once these improve-
ments are in place.
In the Moderate Growth Scenario, ridership is projected to increase by nearly
165 percent between 2004 and 2023. The additional increase over the Status
Quo ridership is primarily due to the increase in peak period express service, in
addition to more Gilroy service and better station access via shuttle buses. While
operating costs will increase over time, it is estimated that average annual
operating subsidies will eventually decrease due to growth in farebox revenues.
The $2 billion capital program will result in an estimated $217 million shortfall.
The potential triggers for shifting from the Moderate Growth to the Enhanced
Scenario include availability of additional funding sources, increased demand
as measured by productivity criteria (load factors), or demand for improved
service that requires additional capacity expansion and customer amenities.
Optimize the operating and capital programs with limited increases to funding
resources, service, and capital improvements.
The Moderate Growth Scenario is a steady growth scenario. It assumes that commit-
ted and programmed funding will allow for normalized infrastructure rehabilitation,
some capacity expansion projects to improve the reliability of Caltrain Express, a
nominal increase in service, and electrification of the Caltrain line.3 It does not
include the extensions to downtown San Francisco, across the Dumbarton Bridge or
to Salinas/Monterey; or High-Speed Rail in California. A summary of the Moderate
Growth Scenario characteristics are shown in Table 6 (page 40).
The primary service goal is to deliver reliable express service at one-hour headways,
primarily in the peak periods. The Moderate Growth level-of-service by 2023 on a
typical weekday is capped at 100 trains per day, which includes 20 express trains.
A flexible mix of local, limited, and express trains would have to be scheduled to
optimize service with existing and planned capacity expansion. Gilroy service will
increase gradually over time, with trains added to the peak-direction, to the reverse-
direction, and possibly one train in the mid-day, for a total of ten trains in each
direction by 2023. Up to 59 shuttle bus routes would provide station access services.
The capital improvements in the Moderate Growth Scenario include critical replace-
ment and rehabilitation projects, station and platform improvements to remove the
hold-out rule, and capacity expansion projects to meet the one-hour headway and
service reliability goals. Also included in the capital program are enhancements,
such as construction of grade separations in key locations to improve safety, accom-
modate Caltrain Express, and accomodate increases in Gilroy service; electrification
of the line and replacement of rolling stock; ADA compliance through station improve-
ments; replacement and installation of fencing in select locations along the rail corri-
dor; and moderate improvements to communications and station access for all
modes. It is anticipated that electrification would come on line later in the Moderate
Growth Scenario than in other scenarios due to the time required to accumulate ade-
quate funding. Parking expansion would be limited, and it is anticipated that an
aggressive parking management plan would be necessary to address the high
demand for parking at specific stations. In this scenario, Capacity Expansion projects
including track rehabilitation, grade separations, signal construction, and track construc-
tion, comprise approximately $298 million (in 2003 dollars) of the total expenditures.
BF U T U R E S C E N A R I O B
The Moderate GrowthScenario
3 The electrification project would convert Caltrain from a dieselengine-powered rail system to an electrified system.
OBJECTIVE
GENERALCHARACTERISTICS
SERVICEIMPROVEMENTS
CAPITALIMPROVEMENTS
FINANCIALRESOURCES
PASSENGEREXPERIENCE
KEY FINDINGS
CALTRAIN STRATEGIC PLAN 2004 | 202338 CALTRAIN STRATEGIC PLAN 2004 | 2023 39

CALTRAIN STRATEGIC PLAN 2004 | 2023 41CALTRAIN STRATEGIC PLAN 2004 | 202340
FUTURE SCENARIOS
SERVICE 2003 2005 2010 2015 2020 2023
Weekday Express Trains 0 12 20 28 36 36
Weekday Limited Trains 14 37 42 45 48 50
Weekday Local 62 39 42 45 48 50
Weekday Total Trains 76 88 104 118 132 136
Saturday/Sunday Trains 0 32/30 32/32 32/32 32/32 32/32
Shuttle Buses (station access) 40 42 52 62 72 78
Average Weekday Ridership 28,000 30,900 41,300 52,700 63,500 69,400
Annual Ridership 7,362,000 22,749,700
OPERATIONS (MILLION 2003 $) 2004-2008 2009-2013 2014-2018 2019-2023 TOTAL
TOTAL Operating CostsA 425.6 521.2 591.6 636.7 2,175.1
Operating Revenue
Farebox 148.7 200.3 251.1 299.0 899.2
Other 39.3 31.7 34.1 36.6 141.7
Member Contributions (all) 237.6 289.2 306.4 301.2 1,134.2
TOTAL Operating Revenue 425.6 521.2 591.6 636.7 2,175.1
Avg Annual Member Contributions (all) 47.5 57.8 61.3 60.2 56.7
CAPITAL (MILLION 2003 $) 2004-2008 2009-2013 2014-2018 2019-2023 TOTAL
Maintenance Facility(Committed Project) 53.0 0 0 0 53.0
Rehabilitation & Replacement 150.0 289.1 241.3 186.5 866.9
Enhancements 841.1 505.6 163.6 77.9 1,588.2
Support 6.5 6.0 11.5 11.0 35.0
TOTAL Capital Costs 1,050.5 800.7 416.4 275.4 2,543.0
Average Annual Cost 212.0 160.1 69.0 55.1 124.1
Capital Funding
Federal 201.3 266.2 302.0 148.4 917.8
State 18.0 6.0 76.5 11.0 111.5
Local Match (Member Agencies) 43.8 57.7 51.5 28.1 181.0
Other B 179.1 107.5 417.0 0 703.5
TOTAL Capital Revenue 442.1 437.3 847.0 187.5 1,913.8
Surplus/(Shortfall) (608.4) (363.4) 430.6 (87.9) (629.2)
Note: Some figures may be revised once the Service and Capital Plans are finalized.A Operating costs in the first five-year period are lower because the first year includes service levels of 76 trains per day (no express
service). Operating costs include electrification starting in 2008 and extension to Downtown San Francisco in 2010.B “Other” Capital Funding consists of funds from remaining San Mateo Measure A minus local matching funds, San Mateo Reauthorization,
and VTA 2000 Measure A funds. It also includes funds from CARB/AB434 and Salvage Value for diesel locomotives replaced with electriclocomotives.
TA B L E 7 : E N H A N C E D S C E N A R I O C H A R A C T E R I S T I C SS U M M A R Y
FUTURE SCENARIOS
TA B L E 6 : M O D E R AT E G R O W T H S C E N A R I O C H A R A C T E R I S T I C SS U M M A R Y
SERVICE 2003 2005 2010 2015 2020 2023
Weekday Express Trains 0 10 14 16 18 20
Weekday Limited Trains 14 37 38 40 40 40
Weekday Local 62 39 40 40 40 40
Weekday Total Trains 76 86 92 96 98 100
Saturday/Sunday Trains 0 32/30 32/30 32/30 32/30 32/30
Shuttle Buses (station access) 40 41 46 51 56 59
Average Weekday Ridership 28,000 30,600 38,300 46,600 54,500 59,600
Annual Ridership 7,362,000 19,483,700
OPERATIONS (MILLION 2003 $) 2004-2008 2009-2013 2014-2018 2019-2023 TOTAL
TOTAL Operating Costs A 416.0 450.5 456.3 484.4 1,807.2
Operating Revenue
Farebox 143.8 182.8 220.2 256.0 802.9
Other 38.9 29.9 31.1 32.3 132.2
Member Contributions (all) 233.4 237.7 205.0 196.0 872.1
TOTAL Operating Revenue 416.0 450.5 456.3 484.4 1,807.2
Avg Annual Member Contributions (all) 46.7 47.5 41.0 39.2 43.6
CAPITAL (MILLION 2003 $) 2004-2008 2009-2013 2014-2018 2019-2023 TOTAL
Maintenance Facility (Committed Project) 53.0 0 0 0 53.0
Replacement & Rehabilitation 150.0 301.7 252.6 189.0 893.1
Enhancements 232.6 89.0 648.7 48.2 1,018.5
Support 6.5 6.0 11.5 11.0 35.0
TOTAL Capital Costs 442.0 396.7 912.7 248.2 1,999.5
Average Annual Cost 88.4 79.3 182.5 49.6 100.0
Capital Funding
Federal 201.2 245.6 314.6 149.9 911.3
State 18.0 6.0 76.5 11.0 111.5
Local Match (Member Agencies) 43.8 52.4 39.2 28.5 163.9
OtherB 179.1 0 417.0 0 596.0
TOTAL Capital Revenue 442.0 304.1 847.3 189.4 1,782.7
Surplus/(Shortfall) 0 (92.6) (65.4) (58.8) (216.8)
Notes: Some figures may be revised once the Service and Capital Plans are finalized.A Operating costs in the first five-year period are lower because the first year includes service levels of 76 trains per day (no express
service). Operating costs include electrification starting in 2018.B “Other” Capital Funding consists of funds from and remaining San Mateo Measure A minus local matching funds and VTA 2000 Measure
A funds. It also includes funds from CARB/AB434 and Salvage Value for diesel locomotives replaced with electric locomotives.

GENERALCHARACTERISTICS
SERVICEIMPROVEMENTS
CAPITALIMPROVEMENTS
FUTURE SCENARIOSFUTURE SCENARIOS FUTURE SCENARIOSFUTURE SCENARIOS
The Enhanced Scenario assumes there will be enhanced levels of funding from
Federal, State, and local sources, as well as innovative financing techniques, to fund
and implement capital improvements. San Mateo County will introduce a measure
to add to/reauthorize the half-cent countywide sales tax on its 2004 ballots. In the
Enhanced Scenario, it is assumed that this ballot measure will pass4. The sales tax
expenditure plans for the measures will specify the amounts available for Caltrain
improvements. All three route extensions would be funded by third parties.
Additional funding advocacy would be required to pursue accelerated implementa-
tion of all the capital projects in the Enhanced Scenario. The feasibility of various
state and federal innovative financing techniques will require further investigation.
Revenues from potential innovative sources are not included in the estimates of cap-
ital shortfalls.
Once the “Enhanced Caltrain” is operational, there will be frequent express service
every half-hour in the peak periods as well as some service in the off-peak.
Passengers will be riding sleek, modern trains that are more comfortable, quieter,
faster, and reliable. Many of the stations would be rehabilitated or reconstructed to
facilitate rapid boarding, include passenger amenities, improve station access, and
expand parking at selected locations.
Passengers will be able to travel further on Caltrain with route extensions to
downtown San Francisco, the East Bay via the Dumbarton corridor, and Salinas/
Monterey. Important connections with other transit operators will be available at
a new northern terminus at the Transbay Terminal in downtown San Francisco
(AC Transit, BART, Muni, Golden Gate, and intercity bus), at the Dumbarton Terminus
in Union City (ACE, AC Transit, BART, Capitol Corridor), at the Santa Clara station
(BART), and Diridon Stations (ACE, Amtrak, BART, Capitol Corridor, VTA).
Ridership is projected to increase by about 200 percent over the 20-year period.
Operating costs will increase over time as well as member subsidies.
In the Enhanced Scenario, the electrification project has a completion date
of 2008. Due to an inconsistency in programming of electrification funds by
the member agencies, funding for the electrification project will not be available
until 2014. A plan to fund electrification in the near-term will need to be devised.
The total capital program cost is nearly $2.5 billion with an estimated shortfall
of approximately $629 million. This does not include potential resources from
innovative financing techniques. These innovative sources will take time to establish.
The potential trigger to shift from the Enhanced to the Build-out Scenario is the
passage of the statewide high-speed rail bond measure in November 2006.
4 The San Francisco Measure passed in November 2003.
FINANCIALRESOURCES
PASSENGEREXPERIENCE
KEY FINDINGS
Capture latent market demand by providing optimal levels of service, improve
station access and regional connectivity, and invest in key system improve-
ments and amenities that will attract passengers and build ridership.
The Enhanced Scenario embodies the vision of Caltrain by encompassing most
of the improvements and passenger amenities that would begin to transform
Caltrain into a “world-class” railroad. It includes major improvement projects that
will improve service and the passenger experience. It assumes that route exten-
sions to downtown San Francisco, across the Dumbarton Bridge to the East Bay,
and to Salinas/Monterey will be constructed. Table 7 (page 41) details the charac-
teristics of the Enhanced Scenario.
The service goal in the Enhanced Scenario is to improve express train service
by providing half-hour headways (from one-hour headways in the Status Quo and
Moderate Growth Scenarios) primarily in the peak periods and part of the off-peak
periods. The Enhanced Scenario would also include improvements in connectivity
and passenger amenities that will build ridership. A flexible combination of local,
limited, and express service will be provided to meet a variety of travel needs.
Target increases in service will include an average of two additional weekday trains
each year, with a goal of 136 weekday trains by 2023, and additional Gilroy service.
Up to 78 shuttle bus routes would provide station access services.
The Enhanced Scenario includes all of the capital improvements in the Moderate
Growth Scenario, as well as access improvements, enhanced passenger amenities,
and route extensions. In conjunction with the electrification project, both the pas-
senger cars and diesel locomotives would be replaced, giving Caltrain an entirely
different look and feel, as well as a new image. Route extensions to downtown San
Francisco, across the Dumbarton Bridge to the East Bay, and to Salinas/Monterey
would improve regional connectivity. This scenario assumes there would be no
high-speed rail in California in the 20-year timeframe. In this scenario, Capacity
Expansion projects comprise approximately $610 million (in 2003 dollars) of the
total expenditures.
CF U T U R E S C E N A R I O C
The Enhanced Scenario
OBJECTIVE
CALTRAIN STRATEGIC PLAN 2004 | 2023 43CALTRAIN STRATEGIC PLAN 2004 | 202342

FUTURE SCENARIOS
The Build-Out Scenario includes the enhanced levels of funding in the
Enhanced Scenario plus new sources of funding, primarily from the
proposed high-speed rail bond measure scheduled for voter consideration in
November 2006. While the high-speed rail bonds would not supplant other
innovative financing techniques, they would guarantee a significant portion of
funds for major Caltrain improvements. Revenues from high-speed rail bonds or
potential innovative sources are not included in the estimates of capital short-
falls.
The total number of system improvements included in the Build-Out Scenario
would be greater than in the other scenarios. In addition to the passenger
experience benefits of electrification and service extensions, the Build-Out
includes extensive grade separations, track capacity improvements, and
station reconstruction that will dramatically affect the passenger experience. A
grade-separated route will increase service reliability, reduce delays, improve safe-
ty, improve local pedestrian and traffic circulation, and reduce noise.
Additional track capacity provided by four-tracking will allow the flexibility
required for high levels of express service. With statewide High-Speed Rail
service available in 2016, it is anticipated that regional and intrastate
connectivity will be greatly improved.
In the absence of constructability issues, funding for High-Speed Rail could
accelerate the timing of many improvements along the Caltrain route. It is pro-
jected that ridership and farebox revenues will grow, however, the full potential
of this growth would probably be realized outside of the 20-year time horizon
of this plan. Ridership is projected to increase by over 220
percent between 2004 and 2023, which does not include potential ridership
gains from transfers between HSR and Caltrain. Operating costs and
member agencies contributions are expected to increase, but will depend ulti-
mately on how the systems are operated and coordinated.
The capital program totals approximately $5 billion and will result in a
$3 billion shortfall. The shortfall does not include the potential revenues from
high-speed rail bonds or other innovative financing techniques.
FUTURE SCENARIOSFUTURE SCENARIOS
FINANCIALRESOURCES
PASSENGEREXPERIENCE
KEY FINDINGS
Capture a significant market share of trips by providing enhanced “world
class” service, complemented by the intra-state connectivity and amenities
offered by the connection to High-Speed Rail.
The Build-Out Scenario is the “ultimate” future scenario for Caltrain and assumes
that High-Speed Rail (HSR) would operate on the Caltrain right-of-way. It includes
all the characteristics and amenities of the Enhanced Scenario and rail connectivity
with all the major metropolitan areas in California via HSR. The Build-Out Scenario
includes improvements that will allow HSR to operate on the Caltrain right-of-way
and assumes major funding resources for these improvements would be made
available through high-speed rail bonds and other innovative financing techniques.
The characteristics of the Build-Out Scenario are summarized in Table 8 (page 46).
The Build-Out Scenario is very similar to the Enhanced Scenario in many ways in
terms of Caltrain service. One of the added service benefits would be that the HSR
system would be accessible through two or more Caltrain stations, making
statewide intercity rail travel available to Caltrain passengers as early as 2016.
Caltrain would function as a feeder system for HSR passengers as well, with trans-
fers taking place between HSR and Caltrain. Additional work must be performed to
optimize the integration of HSR and Caltrain. Up to 78 shuttle bus routes would
provide station access services.
The Build-Out Scenario includes several major infrastructure modifications that
would allow HSR and Caltrain to operate on the same line. The Build-Out Scenario
includes a fully grade-separated alignment and widening of the entire route to
accommodate four tracks. Some stations would have to be relocated or recon-
structed. Platform configurations would have to be optimized to accommodate
HSR and Caltrain. A new signal and communications systems would also be
required. The electrification project and extension to Downtown San Francisco
begin operation by 2014 at the latest but could be accelerated depending on the
coordination with other projects such as grade separations and track capacity
improvements related to HSR. In this scenario, capacity expansion projects includ-
ing track rehabilitation, bridge construction, grade separations, signal construc-
tion, station improvements, track construction and tunnel construction comprise
approximately $3 billion (in 2003 dollars) of the total expenditures.
DF U T U R E S C E N A R I O D
The Build-out Scenario
OBJECTIVE
GENERALCHARACTERISTICS
SERVICEIMPROVEMENTS
CAPITALIMPROVEMENTS
FUTURE SCENARIOS
CALTRAIN STRATEGIC PLAN 2004 | 202344 CALTRAIN STRATEGIC PLAN 2004 | 2023 45

CALTRAIN STRATEGIC PLAN 2004 | 2023 47
Evaluating the ScenariosThere are several ways in which the
scenarios can be evaluated: by how well
they promote the vision or follow the
five guiding principles, by return-on-
investment or by customer satisfaction.
Vision & Guiding Principles. Each
scenario is different in its effectiveness
to meet the Vision for Caltrain to
become the preferred mode of travel
along the Peninsula. The Vision has
three components at the individual,
local and regional levels which are to (1)
provide passengers with a world-class
travel experience; (2) act as a major
catalyst for redevelopment and eco-
nomic activity in communities along its
route; and (3) play a key role in mobility
management along the Peninsula
Corridor and in the Bay Area region as
a whole.
The Enhanced and Build-Out Scenarios
will be the most effective in promoting
the Vision because of the market-
driven investments in service and capital
improvements and customer amenities,
in station access and joint develop-
ment, and in support of regional con-
nections with other transit systems.
When evaluating the potential perform-
ance of each scenario according to the
five guiding principles, the Enhanced
and Build-Out Scenarios are the most
effective in meeting the objectives of
the first and third principles—to satisfy
passengers and build ridership and pro-
mote regional connectivity. In terms of
the second principle, “invest wisely in
system improvements,” the Status Quo
Scenario has the lowest total operating
and capital costs, but is the least effec-
tive in attracting new riders to the sys-
tem. This is because over the 20-year
period and beyond, the Status Quo has
the lowest investment in system
improvements which build ridership.
While the Build-Out Scenario does not
appear to do as well in the arena of
cost effectiveness, as presented in the
next section, it has the greatest poten-
tial for inducing ridership growth well
beyond the 20-year horizon.
The scenarios were not evaluated by
the fourth and fifth guiding principle
because these are principles that should
apply to the way Caltrain does business
on a daily basis. Regardless of which
scenario or continuum of scenarios that
Caltrain pursues developing strong
community and business relationships,
supporting environmental stewardship
and promoting safety along the railroad
are paramount. Likewise, Caltrain must
pursue a secure financial future by
building a foundation of long-term sus-
tainability so that the Caltrain Vision
can become a reality.
CALTRAIN STRATEGIC PLAN 2004 | 202346
FUTURE SCENARIOSFUTURE SCENARIOS
TA B L E 8 : B U I L D - O U T S C E N A R I O C H A R A C T E R I S T I C S S U M M A R Y
SERVICE 2003 2005 2010 2015 2020 2023
Weekday Express Trains 0 12 18 24 36 36
Weekday Limited Trains 14 37 40 40 48 51
Weekday Local 62 39 40 40 48 51
Weekday Total Trains 76 88 98 104 132 138
Saturday/Sunday Trains 0 32/30 32/32 32/32 32/32 32/32
Shuttle Buses (station access) 40 42 52 62 72 78
Average Weekday Ridership 28,000 30,900 40,900 50,700 64,100 72,100
Annual Ridership (Caltrain) 7,362,000 23,626,200
OPERATIONS (MILLION 2003 $) 2004-2008 2009-2013 2014-2018 2019-2023 TOTAL
TOTAL Operating Costs A 425.0 458.5 567.0 643.1 2,093.6
Operating Revenue
Farebox 148.7 196.5 245.8 304.8 895.9
Other 39.4 31.7 34.1 36.6 141.8
Member Contributions (all) 236.9 230.4 287.1 301.7 1,056.1
TOTAL Operating Revenue 425.0 458.5 567.0 643.1 2,093.6
Avg. Annual Member Contributions (all) 47.4 46.1 57.4 60.3 52.8
CAPITAL (MILLION 2003 $) 2004-2008 2009-2013 2014-2018 2019-2023 TOTAL
Maintenance Facility (Committed Project) 53.0 0 0 0 53.0
Replacement & Rehabilitation 151.3 285.1 250.8 186.5 873.7
Enhancements 232.6 804.9 2,945.0 27.9 4,010.4
Support 6.5 6.0 11.5 11.0 35.0
TOTAL Capital Costs 443.3 1,096.0 3,207.3 225.4 4,972.0
Average Annual Cost 88.7 207.9 640.5 45.1 245.5
Capital Funding - - - - -
Federal 201.3 266.2 302.0 145.3 914.7
State 18.0 6.0 76.5 11.0 111.5
Local Match (Member Agencies) 43.8 57.7 51.5 27.4 180.3
Other A 179.1 13.7 525.8 0 718.6
TOTAL Capital Revenue 442.1 343.6 959.8 183.7 1,929.1
Surplus/(Shortfall) (1.3) (752.4) (2,247.5) (41.7) (3,042.9)
Note: Some figures may be revised once the Service and Capital Plans are finalized. A Operating costs in the first five-year period are lower because the first year includes service levels of 76 trains per day (noexpress service). Operating costs include electrification and extension to Downtown San Francisco starting in 2014.B “Other” Capital Funding consists of funds from remaining San Mateo Measure A minus local matching funds, San MateoReauthorization, and VTA 2000 Measure A funds. It also includes funds from CARB/AB434 and Salvage Value for diesel locomotivesreplaced with electric locomotives.

CALTRAIN STRATEGIC PLAN 2004 | 2023 49CALTRAIN STRATEGIC PLAN 2004 | 202348
FUTURE SCENARIOS
year average of operating plus capital
costs and ridership, and shows that the
Status Quo Scenario is most cost-
effective using this evaluation criterion.
However, when comparing total cost per
new passenger gained over the 20-year
period in column (B), the Status Quo
Scenario is the least effective in attract-
ing new passengers to the system. The
Enhanced Scenario is the most cost-
effective scenario using this perform-
ance measure as shown in Column (D).
The ridership projections for the Build-
Out Scenario do not include potential
transfers between high-speed system
and Caltrain, and over time, could sur-
pass the Enhanced Scenario in ridership
gains. In comparison with the Status
Quo, the Enhanced Scenario is 1.7 times
the cost, but yields almost twice as
many new riders over the 20-year period
than the Status Quo.
(A) OPERATING (B) 20-YEAR (C) AVERAGE (D) COST
+ CAPITAL [RIDERSHIP ANNUAL COST-PER- PER-NEW-
COST PER COSTS [AVG. AVG., NEW PASSENGER PASSENGER
PASSENGER ANNUAL, TOTAL] PASSENGERS*] TRIP TRIP GAINED
Status Quo $141 Million 11,816,000 $11.94 $31.68$2.82 Billion 89,085,000
Moderate Growth $190 Million 14,425,000 $13.19 $26.95$3.81 Billion 141,260,000
Enhanced $236.0 Million 16,155,000 $14.60 $26.83$4.72 Billion 175,860,000
Build-Out $353 Million 16,096,000 $21.95 $40.45$7.1 Billion 174,670,000
Based on estimated 2003 ridership of 7,362,000 passengers per year.
Note: Some figures may be revised once the Service and Capital Plans are finalized.
CAPITAL (A) CAPITAL COSTS (B) LOCAL MATCH ALL (C) SURPLUS/
[AVERAGE ANNUAL, MEMBER AGENCIES (SHORTFALL)
TOTAL] [AVERAGE ANNUAL, TOTAL]
Status Quo $57.6 Million $8 Million $0 Million$1.151 Billion $159 Million
Moderate Growth $100 Million $8.2 Million ($217 Million)$2.000 Billion $164 Million
Enhanced $127 Million $9 Million ($629 Million)$2.543 Billion $181 Million
Build-Out $249 Million ($9 Million) ($3 Billion)$4.972 Billion ($180 Million)
Note: Some figures may be revised once the Service and Capital Plans are finalized
TA B L E 1 0 : C A P I TA L C O S T S , L O C A L M AT C H , A N D S H O R T FA L L B Y S C E N A R I O
TA B L E 1 1 : C O S T P E R PA S S E N G E R T R I P B Y S C E N A R I O
FUTURE SCENARIOS
Return on Investment and Ridership.
The figures in the following tables were
calculated using projected expenses
and revenue sources which are based
on ridership projections and traditional
funding formulas. These do not include
potential revenue from innovative
financing resources. All dollar figures
are in 2003$.
As shown above in Table 9, 20-year
operating costs are lowest in the Status
Quo Scenario. Even though the total
operating costs in the Moderate Growth
Scenario are slightly higher, projected
ridership and thus farebox revenues
increase over time, offsetting a greater
portion of operating costs and resulting
in a similar level of member subsidies as
the Status Quo Scenario. Although aver-
age operating costs in the Build-Out
Scenario are lower than the Enhanced
Scenario, they are greater then the
Enhanced Scenario in the outer years.
As shown in Table 10 (opposite, above),
the Status Quo Scenario is the only
alternative that does not result in a
shortfall over the 20-year period of the
capital program. These amounts were
calculated based on the assumption
that the local match amounts shown in
column (B) would be available. The local
match required is lowest in the Status
Quo Scenario, but caps out around
$180 million as evident in the other
scenarios. Although the shortfalls are
significantly greater in the Enhanced
and Build-Out Scenarios, these figures
do not include potential revenues that
might become available from innovative
finance techniques or high-speed rail
bonds.
Table 11 (opposite, below) compares the
scenarios by cost per passenger trip and
cost-per-new-passenger trip gained.
Column (C) presents the average annual
cost-per-passenger trip, based on a 20-
OPERATIONS (A) SERVICE LEVEL (B) ANNUAL (C) OPERATING (D) MEMBER
IN 2023 RIDERSHIP COST (AVERAGE SUBSIDY
(WEEKDAY, EXPRESS IN ANNUAL, (AVERAGE ANNUAL,
HEADWAYS) 2023 TOTAL) TOTAL)
Status Quo 86 trains 14,369,000 $83 Million $44 Million1 hr $1.67 Billion $873 Million
Moderate Growth 100 trains 19,483,700 $90 Million $44 Million1 hr $1.81 Billion $872 Million
Enhanced 136 trains 22,749,700 $109 Million $57 MillionΩ hour $2.18 Billion $1.13 Billion
Build-Out 138 trains 23,626,200 $105 Million $53 MillionΩ hour $2.09 Billion $1.06 Billion
Note: Some figures may be revised once the Service and Capital Plans are finalized.
TA B L E 9 : O P E RAT I N G COSTS A N D M E M B E R S U B S I DY BY S C E N A R I O
CALTRAIN STRATEGIC PLAN 2004 | 202350
C A L T R A I N B O A R D
O F D I R E C T O R S
Representing City and County of San Francisco
Sophie MaxwellAppointed by San Francisco County Board of Supervisors
José CisnerosAppointed by the Mayor of San Francisco
Michael T. BurnsAppointed by S.F. Public Transportation Commission
Representing San Mateo County Transit District
Michael D. NevinAppointed by San Mateo County Board of Supervisors
Jim HartnettAppointed by City Selection Committee
Arthur L. LloydAppointed by San Mateo County Transit District
Representing Santa Clara Valley Transportation Authority
John L. McLemore (Chair)Appointed by Santa Clara Cities Association (Metropolitan Transportation Commission Representative)
Ken YeagerAppointed by Santa Clara Valley Transportation Authority
Don GageAppointed by Santa Clara Valley Transportation Authority
Sue LempertMetropolitan Transportation Commission Liason
Conclusions
The multiple scenarios present alternative futures for Caltrain, from the Status Quo,
a financially-constrained alternative, to the Build-Out, the “ultimate world-class”
future for Caltrain. These scenarios provide insight into the level of investment that
will be necessary to realize the Caltrain vision of becoming the preferred mode of
travel along the Peninsula. The Caltrain vision is achievable, if desired, but not with-
out careful action planning for implementation and significant policy commitment
from the Joint Powers Board and the member agencies. With the adoption of this
Plan, Caltrain will proceed with the proposed continuum approach, beginning with
the five-year financially-constrained service and capital plan, while supporting the
guiding principles, preparation for long-term financial sustainability, and pursuit of
the Caltrain Vision. The Strategic Plan, along with the service, capital, and financial
plans, are essential tools for preparing for the future of Caltrain.