
Calpers RE 2
22
Attachment 1 – Real Estate Program Review Real Estate Program Review April 19, 2010
Transcript of Calpers RE 2

Attachm
ent 1 –R
eal Estate Program R
eview
Real Estate Program Review
April 19, 2010
Real Estate Program Review
2
Purpose of Real Estate Program Review
• Overview of the Real Estate Program• Discuss 2009 Market, CalPERS Performance and Peer
Returns• Program Restructuring and Risk Mitigation Measures • Roadmap: Priorities for 2010
Real Estate Program Review
3
Executive Summary• Beginning in 1998-2004, CalPERS implemented a new core portfolio strategy.• In 2004, a flood of capital entered the real estate markets driving down yields.• CalPERS sold a large portion of the core portfolio generating $16B in sales and recommitted
over $30B in higher risk real estate strategies.• Allocations were increased to real estate between 2001-2006, with new investments
disproportionately made to higher risk investments that increased both vintage year concentration as well as portfolio leverage.
• Results were that CalPERS outperformed both the benchmark and peers between 2004-2007; currently, the Portfolio is underperforming both the benchmark and peers.
• CalPERS began restructuring its Real Estate Program in 2007 with a focus on risk mitigation. • The credit crisis of 2007 and the financial crisis of 2008 have triggered a correction in
commercial and residential real estate markets which will take several years to fully unfold. • The dislocation in the real estate market will present investment opportunities.• CalPERS is well positioned to benefit from the dislocation due to the enhanced processes
and risk mitigation measures now in place.
Real Estate Program Review
4
Role of Real Estate Per Current Policy
•Provide diversification to the overall CalPERS Investment Portfolio (core)•Generate attractive risk-adjusted rates of return for CalPERS
(risk taking)•Provide a hedge against inflation
Both the role of Real Estate and the Strategic Plan for the Program will be revisited in coordination with the 2010 Asset Allocation Process.
Real Estate Program Review
5
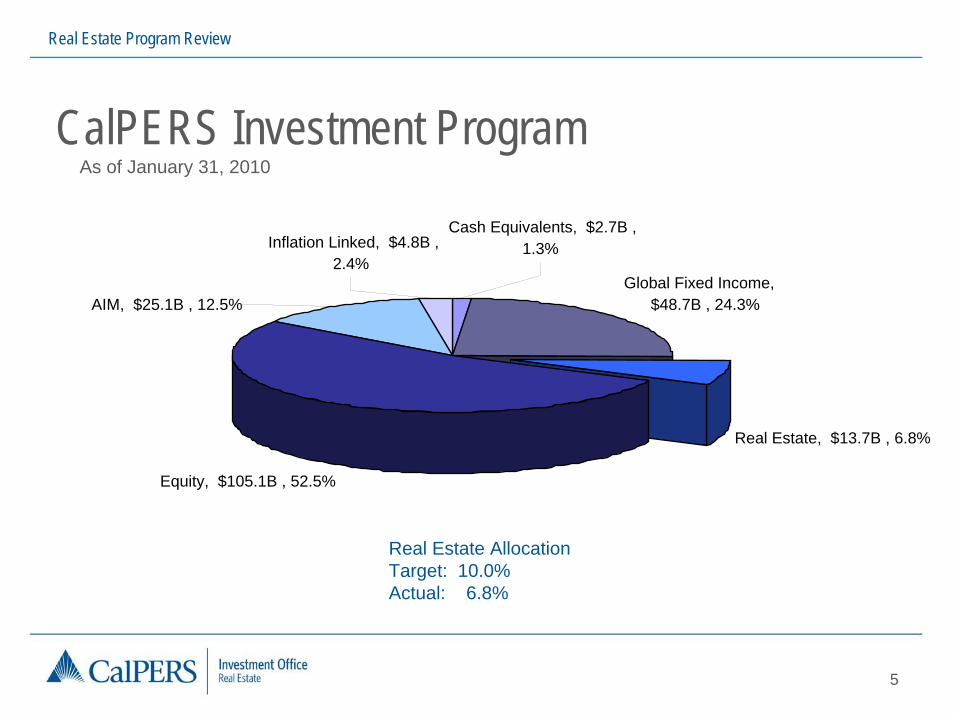
CalPERS Investment ProgramAs of January 31, 2010
Real Estate AllocationTarget: 10.0%Actual: 6.8%
Global Fixed Income, $48.7B , 24.3%
Real Estate, $13.7B , 6.8%
Equity, $105.1B , 52.5%
Inflation Linked, $4.8B , 2.4%
AIM, $25.1B , 12.5%
Cash Equivalents, $2.7B , 1.3%
Real Estate Program Review
6
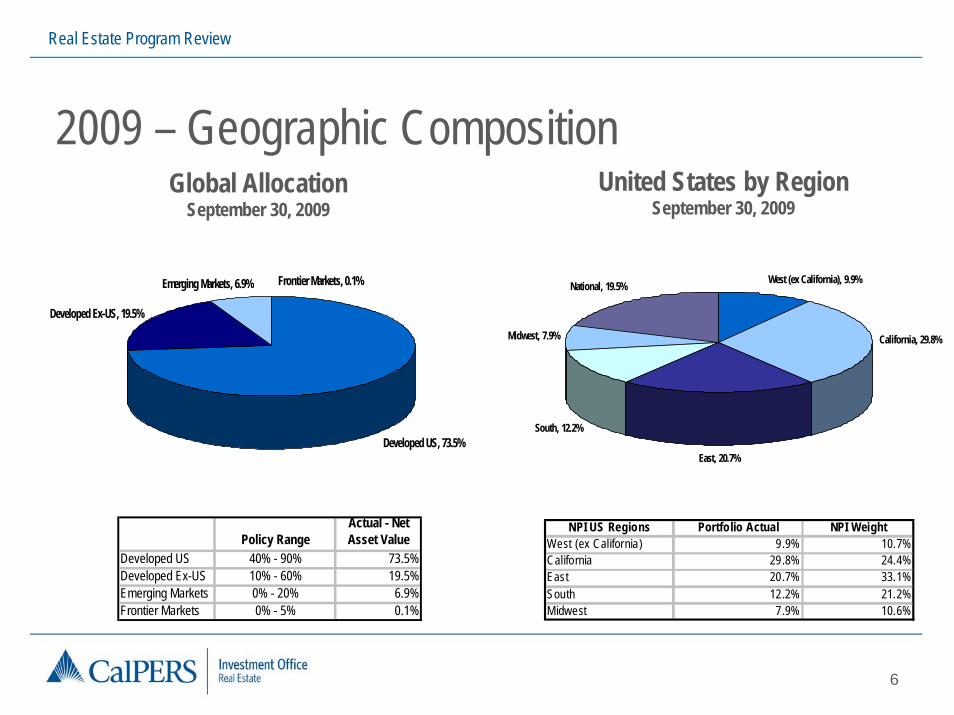
2009 – Geographic Composition
Developed US, 73.5%
Developed Ex-US, 19.5%
Emerging Markets, 6.9% Frontier Markets, 0.1%
Global AllocationSeptember 30, 2009
Policy RangeActual - Net Asset Value
Developed US 40% - 90% 73.5%Developed Ex-US 10% - 60% 19.5%Emerging Markets 0% - 20% 6.9%Frontier Markets 0% - 5% 0.1%
United States by RegionSeptember 30, 2009
West (ex California), 9.9%
California, 29.8%
East, 20.7%
South, 12.2%
Midwest, 7.9%
National, 19.5%
NPI US Regions Portfolio Actual NPI WeightWest (ex California) 9.9% 10.7%California 29.8% 24.4%East 20.7% 33.1%South 12.2% 21.2%Midwest 7.9% 10.6%
Real Estate Program Review
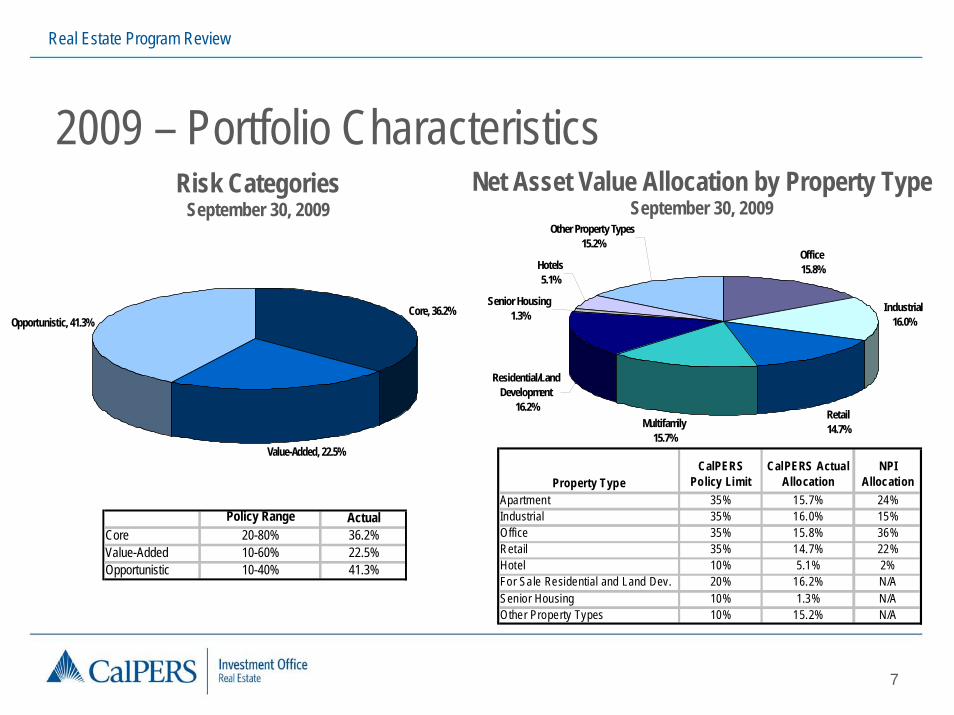
Office15.8%
Industrial16.0%
Retail14.7%Multifamily
15.7%
Senior Housing1.3%
Hotels5.1%
Other Property Types15.2%
Residential/Land Development
16.2%
2009 – Portfolio CharacteristicsRisk Categories
September 30, 2009Net Asset Value Allocation by Property Type
September 30, 2009
Policy Range
7
ActualCore 20-80% 36.2%Value-Added 10-60% 22.5%Opportunistic 10-40% 41.3%
Core, 36.2%
Value-Added, 22.5%
Opportunistic, 41.3%
Property TypeCalPERS
Policy LimitCalPERS Actual
AllocationNPI
AllocationApartment 35% 15.7% 24%Industrial 35% 16.0% 15%Office 35% 15.8% 36%Retail 35% 14.7% 22%Hotel 10% 5.1% 2%For Sale Residential and Land Dev. 20% 16.2% N/ASenior Housing 10% 1.3% N/AOther Property Types 10% 15.2% N/A
Real Estate Program Review
8
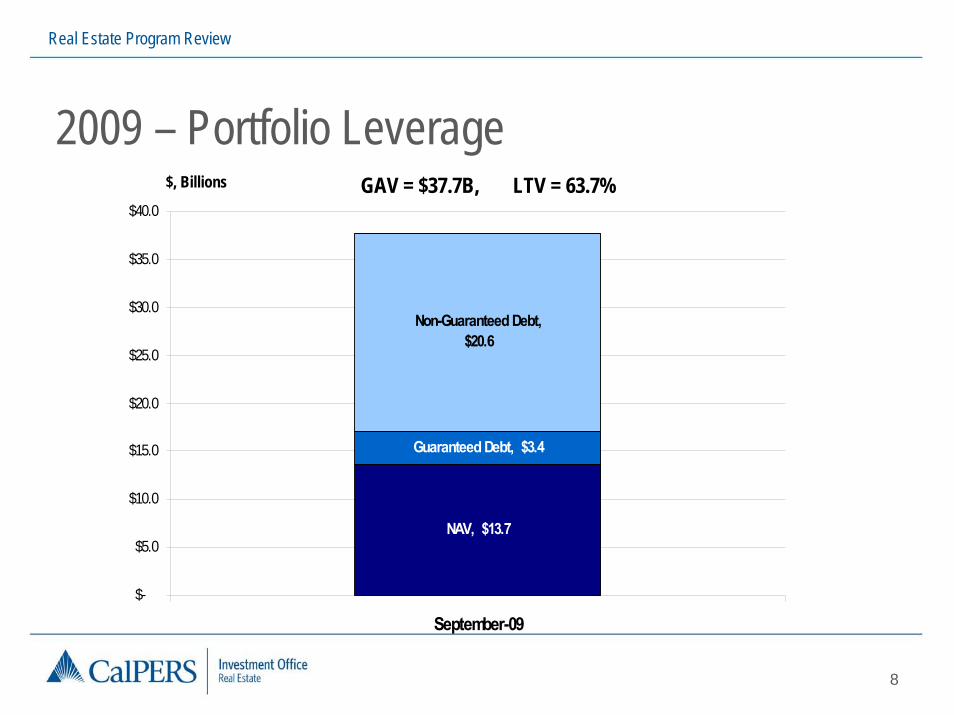
2009 – Portfolio Leverage
NAV, $13.7
Guaranteed Debt, $3.4
Non-Guaranteed Debt, $20.6
$-
$5.0
$10.0
$15.0
$20.0
$25.0
$30.0
$35.0
$40.0
September-09
$, Billions GAV = $37.7B, LTV = 63.7%
Real Estate Program Review
9
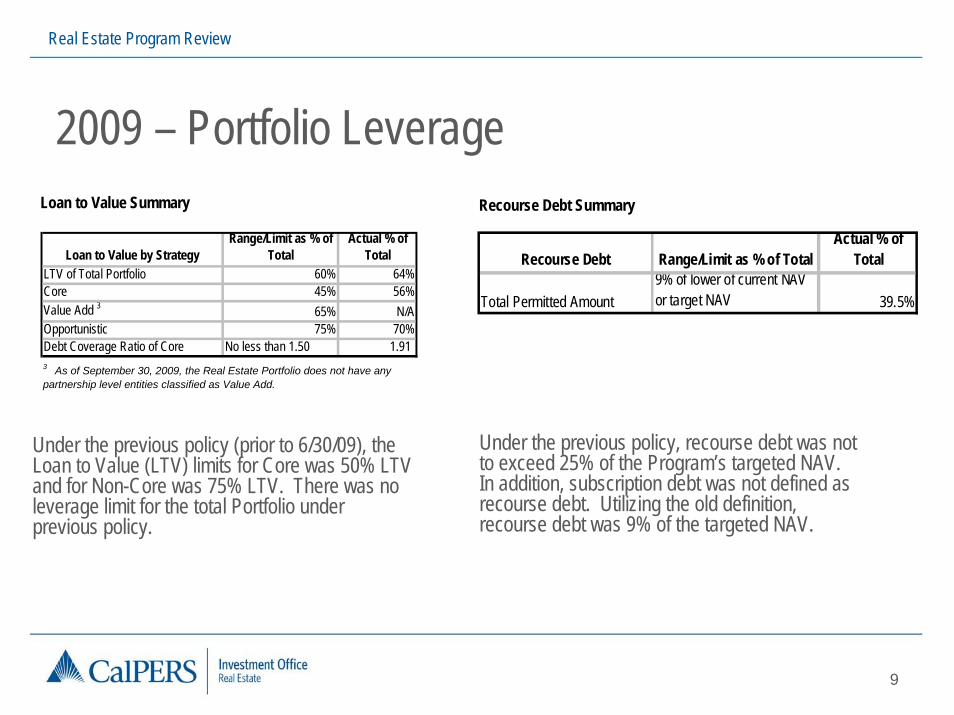
2009 – Portfolio LeverageLoan to Value Summary Recourse Debt Summary
Under the previous policy (prior to 6/30/09), the Loan to Value (LTV) limits for Core was 50% LTV and for Non-Core was 75% LTV. There was no leverage limit for the total Portfolio under previous policy.
Recourse Debt Range/Limit as % of TotalActual % of
Total
Total Permitted Amount9% of lower of current NAV or target NAV 39.5%
Under the previous policy, recourse debt was not to exceed 25% of the Program’s targeted NAV. In addition, subscription debt was not defined as recourse debt. Utilizing the old definition, recourse debt was 9% of the targeted NAV.
Loan to Value by StrategyRange/Limit as % of
TotalActual % of
TotalLTV of Total Portfolio 60% 64%Core 45% 56%Value Add 3 65% N/AOpportunistic 75% 70%Debt Coverage Ratio of Core No less than 1.50 1.91 3 As of September 30, 2009, the Real Estate Portfolio does not have any partnership level entities classified as Value Add.
Real Estate Program Review
10
Real Estate Market ContextCapital A flood of capital came into real estate equity and mortgage
markets in the last decade.
Yields As a result, interest rates and current equity yields were driven to historic lows.
Higher Risk Many investment managers pursued higher risk transactions to achieve return goals.
Financial Crisis The flow of capital shut down with the Wall Street financial crisis in 2008. The impact on commercial real estate will take several years to work through the system.
Real Estate Program Review
11
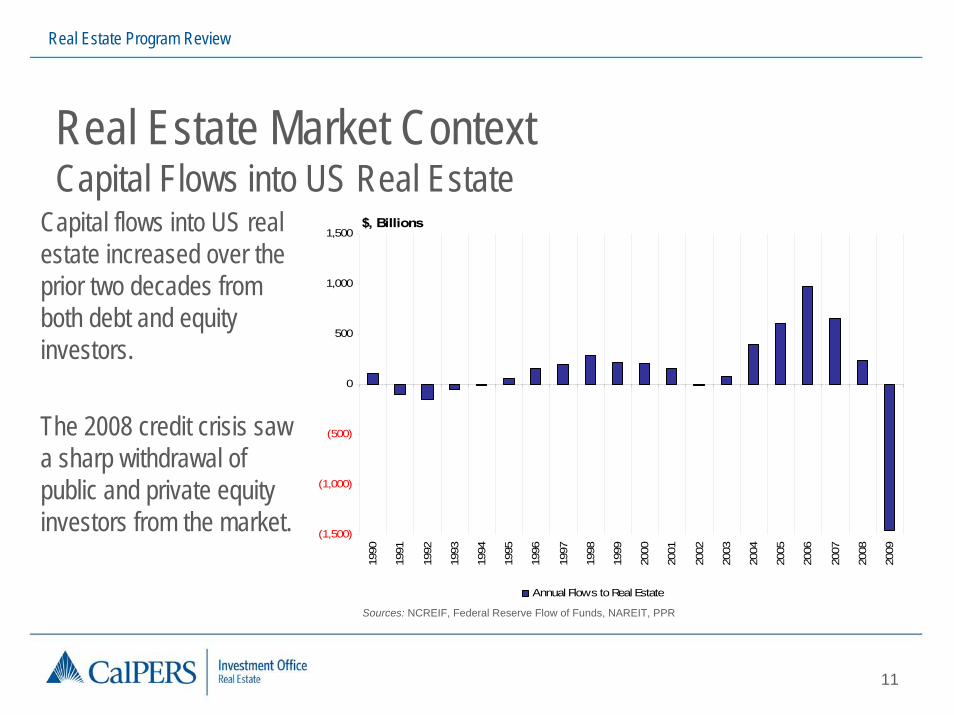
Real Estate Market ContextCapital Flows into US Real Estate
Capital flows into US real estate increased over the prior two decades from both debt and equity investors.
The 2008 credit crisis saw a sharp withdrawal of public and private equity investors from the market.
Sources: NCREIF, Federal Reserve Flow of Funds, NAREIT, PPR
(1,500)
(1,000)
(500)
0
500
1,000
1,500
1990
1991
1992
1993
1994
1995
1996
1997
1998
1999
2000
2001
2002
2003
2004
2005
2006
2007
2008
2009
$, Billions
Annual Flows to Real Estate
Real Estate Program Review
12
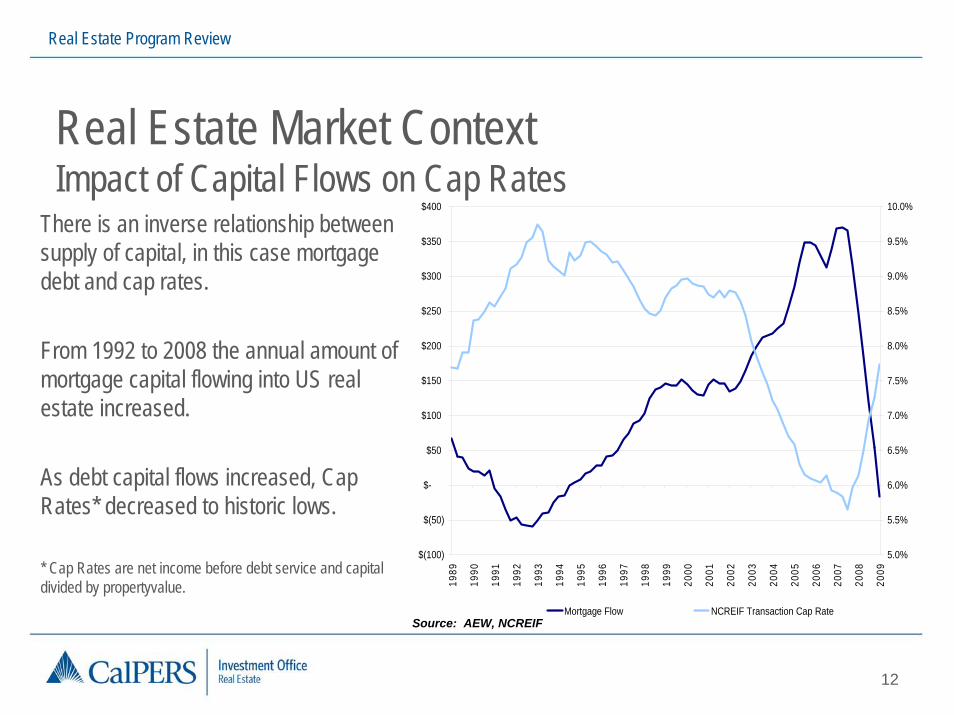
Real Estate Market ContextImpact of Capital Flows on Cap Rates
There is an inverse relationship between supply of capital, in this case mortgage debt and cap rates.
From 1992 to 2008 the annual amount of mortgage capital flowing into US real estate increased.
As debt capital flows increased, Cap Rates* decreased to historic lows.
* Cap Rates are net income before debt service and capital divided by propertyvalue.
$(100)
$(50)
$-
$50
$100
$150
$200
$250
$300
$350
$400
1989
1990
1991
1992
1993
1994
1995
1996
1997
1998
1999
2000
2001
2002
2003
2004
2005
2006
2007
2008
2009
5.0%
5.5%
6.0%
6.5%
7.0%
7.5%
8.0%
8.5%
9.0%
9.5%
10.0%
Mortgage Flow NCREIF Transaction Cap RateSource: AEW, NCREIF
Real Estate Program Review
13
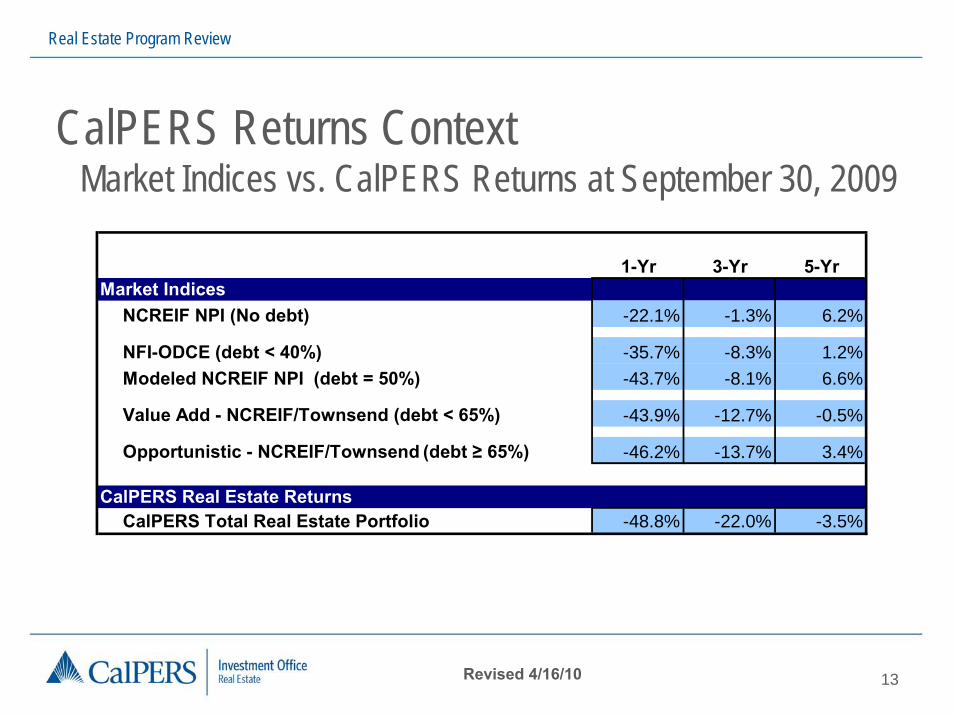
CalPERS Returns Context Market Indices vs. CalPERS Returns at September 30, 2009
1-Yr 3-Yr 5-YrMarket Indices
NCREIF NPI (No debt) -22.1% -1.3% 6.2%
NFI-ODCE (debt < 40%) -35.7% -8.3% 1.2%Modeled NCREIF NPI (debt = 50%) -43.7% -8.1% 6.6%
Value Add - NCREIF/Townsend (debt < 65%) -43.9% -12.7% -0.5%
Opportunistic - NCREIF/Townsend (debt ≥ 65%) -46.2% -13.7% 3.4%
CalPERS Real Estate ReturnsCalPERS Total Real Estate Portfolio -48.8% -22.0% -3.5%
Revised 4/16/10
Real Estate Program Review
14
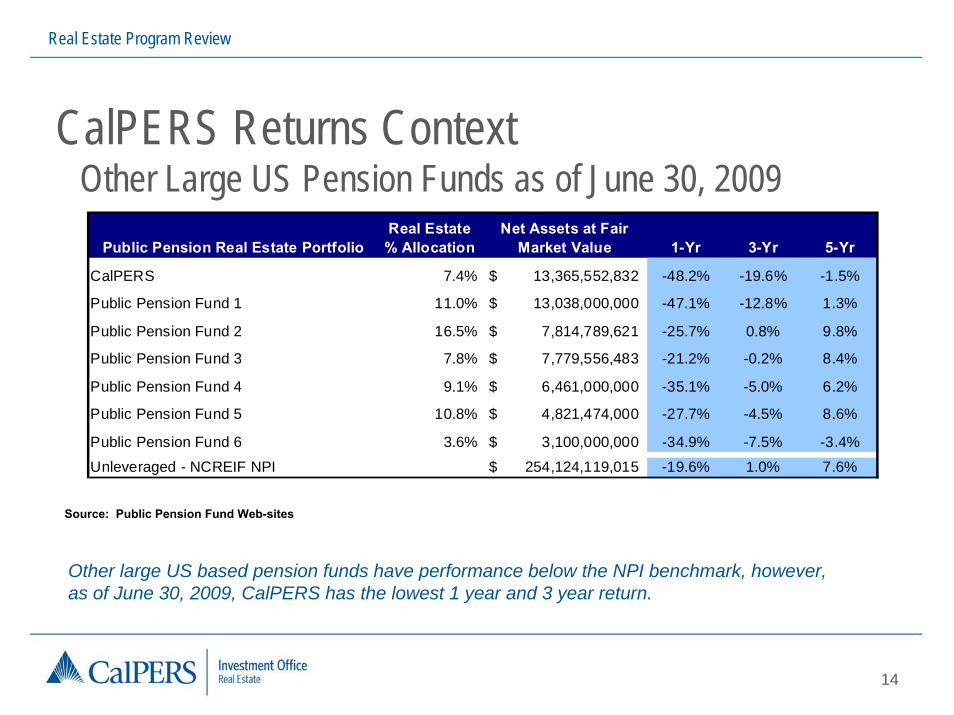
CalPERS Returns Context Other Large US Pension Funds as of June 30, 2009
Other large US based pension funds have performance below the NPI benchmark, however, as of June 30, 2009, CalPERS has the lowest 1 year and 3 year return.
Source: Public Pension Fund Web-sites
Public Pension Real Estate PortfolioReal Estate % Allocation
Net Assets at Fair Market Value 1-Yr 3-Yr 5-Yr
CalPERS 7.4% 13,365,552,832$ -48.2% -19.6% -1.5%
Public Pension Fund 1 11.0% 13,038,000,000$ -47.1% -12.8% 1.3%
Public Pension Fund 2 16.5% 7,814,789,621$ -25.7% 0.8% 9.8%
Public Pension Fund 3 7.8% 7,779,556,483$ -21.2% -0.2% 8.4%
Public Pension Fund 4 9.1% 6,461,000,000$ -35.1% -5.0% 6.2%
Public Pension Fund 5 10.8% 4,821,474,000$ -27.7% -4.5% 8.6%
Public Pension Fund 6 3.6% 3,100,000,000$ -34.9% -7.5% -3.4%
Unleveraged - NCREIF NPI 254,124,119,015$ -19.6% 1.0% 7.6%
Real Estate Program Review
15
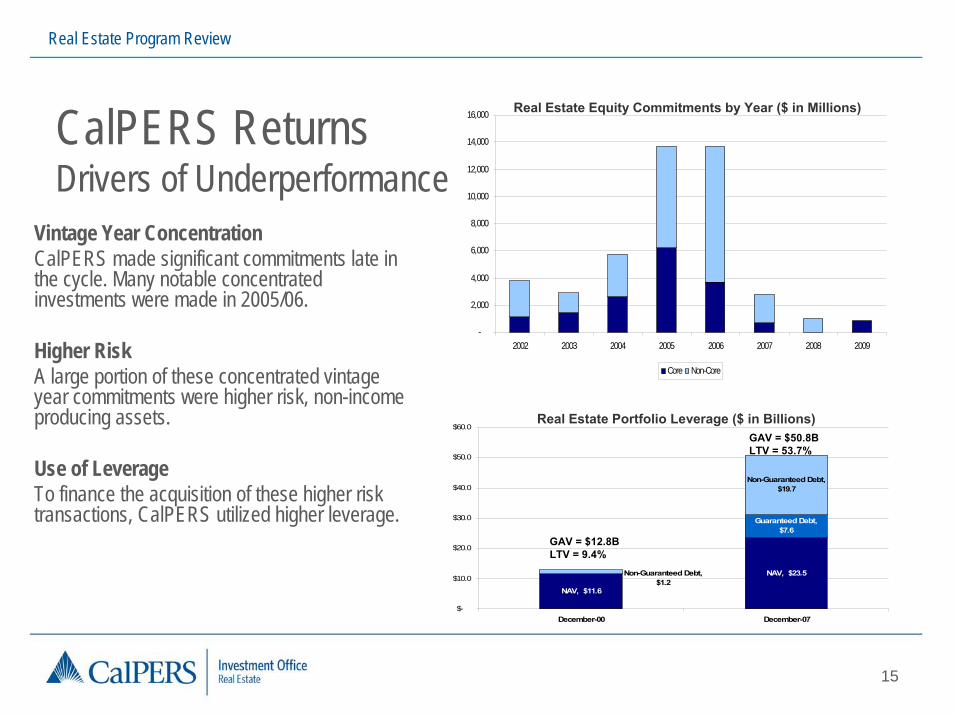
CalPERS ReturnsDrivers of Underperformance
Vintage Year ConcentrationCalPERS made significant commitments late in the cycle. Many notable concentrated investments were made in 2005/06.
Higher Risk A large portion of these concentrated vintage year commitments were higher risk, non-income producing assets.
Use of LeverageTo finance the acquisition of these higher risk transactions, CalPERS utilized higher leverage.
NAV, $23.5
NAV, $11.6
Guaranteed Debt, $7.6
Non-Guaranteed Debt, $19.7
Non-Guaranteed Debt, $1.2
$-
$10.0
$20.0
$30.0
$40.0
$50.0
$60.0
December-00 December-07
-
2,000
4,000
6,000
8,000
10,000
12,000
14,000
16,000
2002 2003 2004 2005 2006 2007 2008 2009
Core Non-Core
Real Estate Equity Commitments by Year ($ in Millions)
Real Estate Portfolio Leverage ($ in Billions)
GAV = $12.8BLTV = 9.4%
GAV = $50.8BLTV = 53.7%
Real Estate Program Review
16
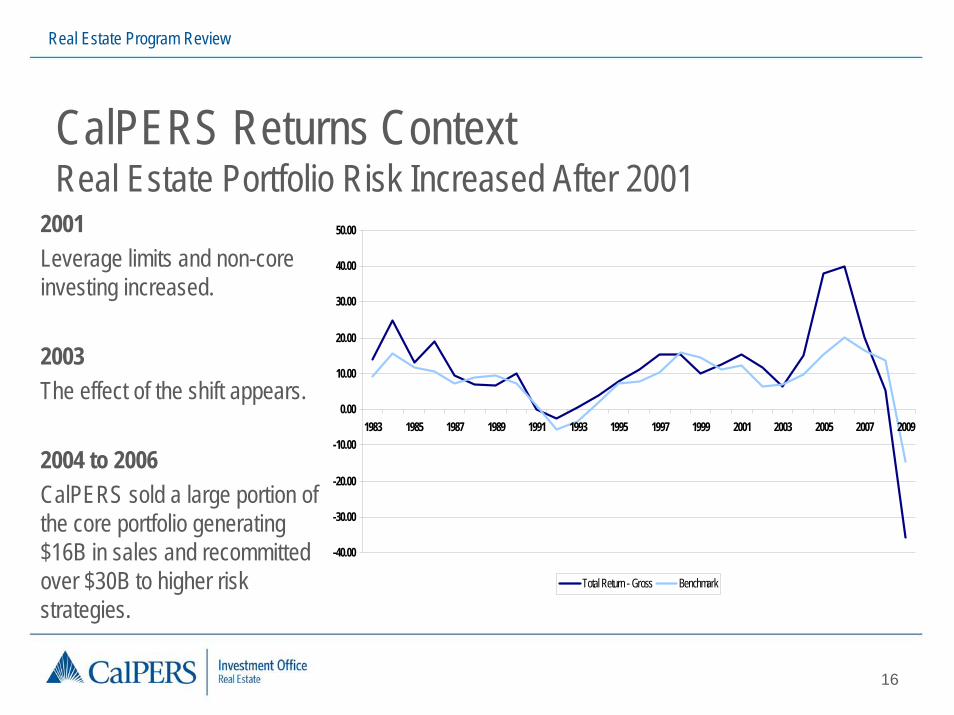
CalPERS Returns ContextReal Estate Portfolio Risk Increased After 2001
2001Leverage limits and non-core investing increased.
2003The effect of the shift appears.
2004 to 2006CalPERS sold a large portion of the core portfolio generating $16B in sales and recommitted over $30B to higher risk strategies.
-40.00
-30.00
-20.00
-10.00
0.00
10.00
20.00
30.00
40.00
50.00
1983 1985 1987 1989 1991 1993 1995 1997 1999 2001 2003 2005 2007 2009
Total Return - Gross Benchmark
Real Estate Program Review
17
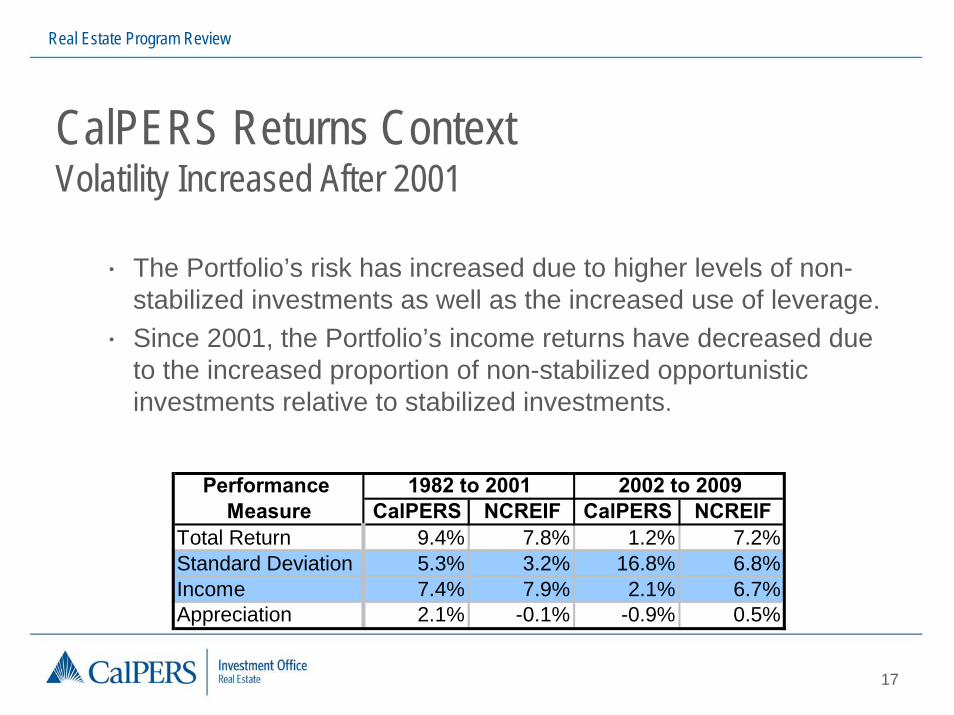
CalPERS Returns ContextVolatility Increased After 2001
• The Portfolio’s risk has increased due to higher levels of non-stabilized investments as well as the increased use of leverage.
• Since 2001, the Portfolio’s income returns have decreased due to the increased proportion of non-stabilized opportunistic investments relative to stabilized investments.
Performance Measure CalPERS NCREIF CalPERS NCREIF
Total Return 9.4% 7.8% 1.2% 7.2%Standard Deviation 5.3% 3.2% 16.8% 6.8%Income 7.4% 7.9% 2.1% 6.7%Appreciation 2.1% -0.1% -0.9% 0.5%
1982 to 2001 2002 to 2009
Real Estate Program Review
18
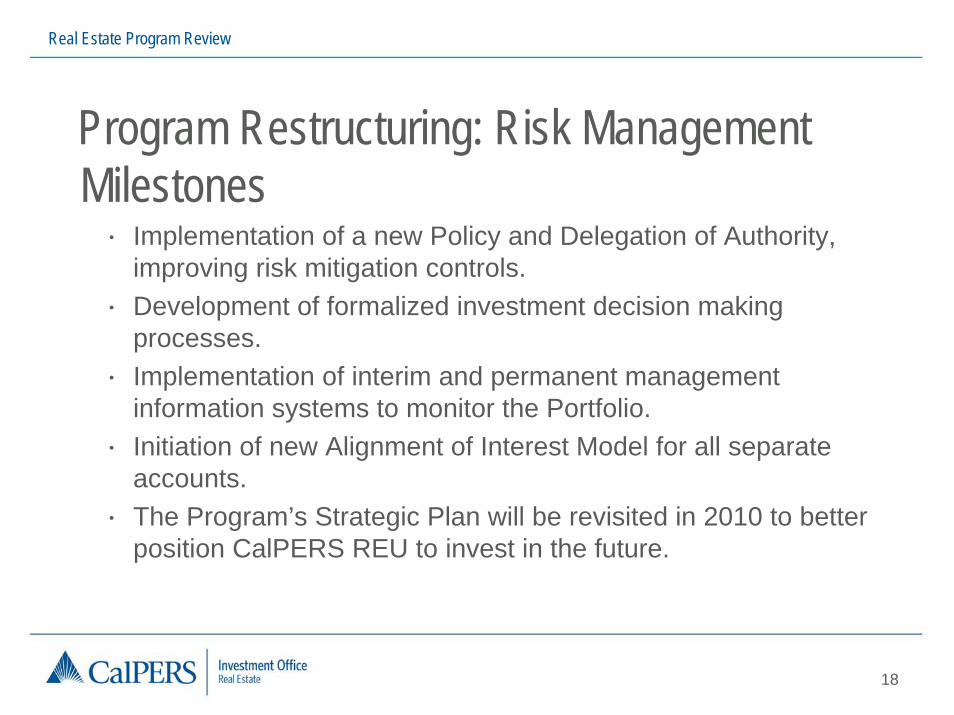
Program Restructuring: Risk Management Milestones• Implementation of a new Policy and Delegation of Authority,
improving risk mitigation controls.• Development of formalized investment decision making
processes.• Implementation of interim and permanent management
information systems to monitor the Portfolio.• Initiation of new Alignment of Interest Model for all separate
accounts.• The Program’s Strategic Plan will be revisited in 2010 to better
position CalPERS REU to invest in the future.
Real Estate Program Review
19
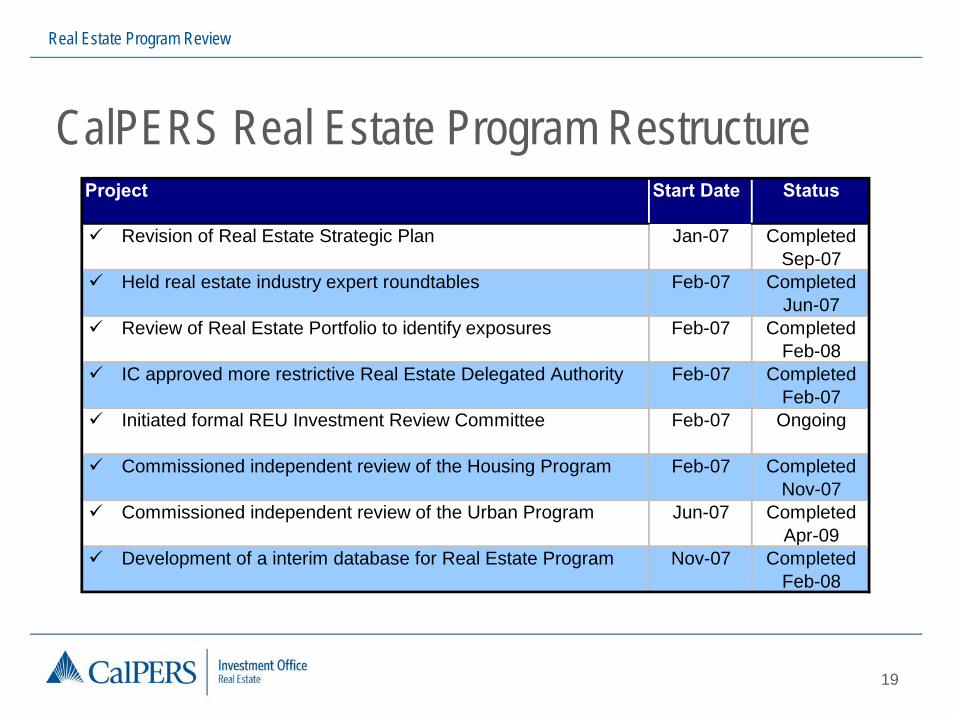
CalPERS Real Estate Program RestructureProject Start Date Status
Revision of Real Estate Strategic Plan Jan-07 Completed Sep-07
Held real estate industry expert roundtables Feb-07 Completed Jun-07
Review of Real Estate Portfolio to identify exposures Feb-07 Completed Feb-08
IC approved more restrictive Real Estate Delegated Authority Feb-07 Completed Feb-07
Initiated formal REU Investment Review Committee Feb-07 Ongoing
Commissioned independent review of the Housing Program Feb-07 Completed Nov-07
Commissioned independent review of the Urban Program Jun-07 Completed Apr-09
Development of a interim database for Real Estate Program Nov-07 Completed Feb-08
Real Estate Program Review
20
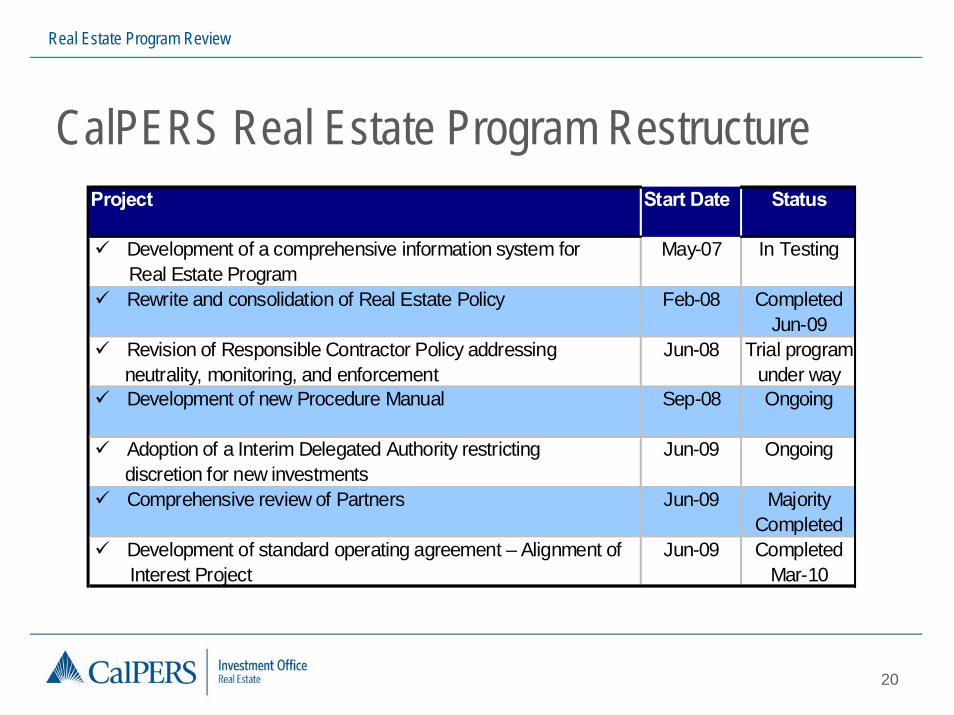
CalPERS Real Estate Program RestructureProject Start Date Status
Development of a comprehensive information system for ---- Real Estate Program
May-07 In Testing
Rewrite and consolidation of Real Estate Policy Feb-08 Completed Jun-09
Revision of Responsible Contractor Policy addressing ___neutrality, monitoring, and enforcement
Jun-08 Trial program under way
Development of new Procedure Manual Sep-08 Ongoing
Adoption of a Interim Delegated Authority restricting ___discretion for new investments
Jun-09 Ongoing
Comprehensive review of Partners Jun-09 Majority Completed
Development of standard operating agreement – Alignment of ___ Interest Project
Jun-09 Completed Mar-10
Real Estate Program Review
21
Roadmap: Priorities for 2010
• Complete manager reviews and implement recommendations
• Continue restructuring of risk, leverage, and valuation• Clarify role of Real Estate• Revise Real Estate Strategic Plan• Continue implementation of enhanced systems and controls• Pursue new core investment opportunities that will benefit
from improving fundamentals anticipated during the economic recovery

Real Estate Program Review
22
Questions & Answers