Calpe Insurance Company Limited - TransRe · Calpe Insurance Company Limited Solvency and Financial...
57
Calpe Insurance Company Limited Solvency and Financial Condition Report As at 31 December 2016
Transcript of Calpe Insurance Company Limited - TransRe · Calpe Insurance Company Limited Solvency and Financial...

Calpe Insurance Company Limited
Solvency and Financial Condition Report
As at 31 December 2016

2
Calpe Insurance Company Limited ● Solvency and Financial Condition Report ● As at 31 December 2016
Table of contents
Table of contents .................................................................................................................................... 2 About this document ............................................................................................................................... 3 Directors’ statement ................................................................................................................................ 3 Executive summary................................................................................................................................. 4 A. Business and performance .............................................................................................................. 6 A.1 Business ............................................................................................................................................... 6 A.2 Underwriting performance .................................................................................................................... 8 A.3 Investment performance ....................................................................................................................... 9 A.4 Performance of other activities ............................................................................................................. 9 A.5 Any other information ........................................................................................................................... 9 B. System of Governance.................................................................................................................. 11 B.1 General information on the system of governance ............................................................................. 11 B.2 Fit and proper requirements ............................................................................................................... 14 B.3 Risk Management System including the ORSA ................................................................................. 15 B.4 Internal control system ....................................................................................................................... 17 B.5 Internal Audit function ......................................................................................................................... 18 B.6 Actuarial function ................................................................................................................................ 18 B.7 Outsourcing ........................................................................................................................................ 19 B.8 Any other information ......................................................................................................................... 19 C. Risk profile ................................................................................................................................... 20 C.1 Underwriting risk ................................................................................................................................. 20 C.2 Market risk .......................................................................................................................................... 22 C.3 Counterparty default (credit risk) ........................................................................................................ 25 C.4 Liquidity risk ........................................................................................................................................ 27 C.5 Operational risk .................................................................................................................................. 27 C.6 Other material risks ............................................................................................................................ 29 C.7 Any other information ......................................................................................................................... 29 D. Valuation for solvency purposes .................................................................................................... 30 D.1 Assets ................................................................................................................................................. 30 D.2 Technical provisions ........................................................................................................................... 33 D.3 Other liabilities .................................................................................................................................... 40 D.4 Alternative methods for valuation ....................................................................................................... 41 D.5 Any other information ......................................................................................................................... 41 E. Capital management ..................................................................................................................... 42 E.1 Own funds .......................................................................................................................................... 42 E.2 SCR and MCR .................................................................................................................................... 44 E.3 Use of the duration-based equity risk sub-module in the calculation of the SCR ............................... 45 E.4 Differences between the standard formula and any internal model used ........................................... 45 E.5 Non-compliance with the MCR and non-compliance with the SCR .................................................... 45 E.6 Any other information ......................................................................................................................... 45 Appendix 1: Abbreviations used in this report ......................................................................................... 46 Appendix 2: Public Quantitative Reporting Templates (QRT) .................................................................. 48

3
Calpe Insurance Company Limited ● Solvency and Financial Condition Report ● As at 31 December 2016
About this document
This document is the Solvency and Financial Condition Report (“SFCR”) for Calpe Insurance Company
Limited (“Calpe”) as at 31 December 2016.
This SFCR covers Calpe on a solo basis.
As this is the first year in which Calpe has published an SFCR, no comparatives against prior year are
included in this document.
Calpe’s functional and presentational currency is GBP.
Directors’ statement
We acknowledge our responsibility for preparing the SFCR in all material respects in accordance with the
GFSC Rules and the Solvency II Regulations.
We are satisfied that:
throughout the financial year in question, the insurer has complied in all material respects with the
requirements of the GFSC Rules and the Solvency II Regulations as applicable to the insurer other
than as detailed in Section E5; and
it is reasonable to believe that, at the date of publication of this SFCR, the insurer has continued so
to comply subsequently and will continue so to comply in future.
By order of the Board on 19 May 2017.
Paul Cole
Director
Douglas Murray
Director
4
Calpe Insurance Company Limited ● Solvency and Financial Condition Report ● As at 31 December 2016
Executive summary
Calpe Insurance Company Limited (“Calpe”) is a private limited company headquartered in Gibraltar which
is a wholly owned subsidiary of Transatlantic Reinsurance Company (“TRC”) (a reinsurance company
domiciled in New York), whose ultimate parent is Alleghany Corporation (“Alleghany”). Calpe was licensed
by the Gibraltar Financial Services Commission to commence underwriting in November 2010, and
provides the TransRe Group with a platform to write direct Insurance business in Europe. Calpe’s primary
focus to date has been writing UK motor business on a co-insurance basis and in support of MGAs.
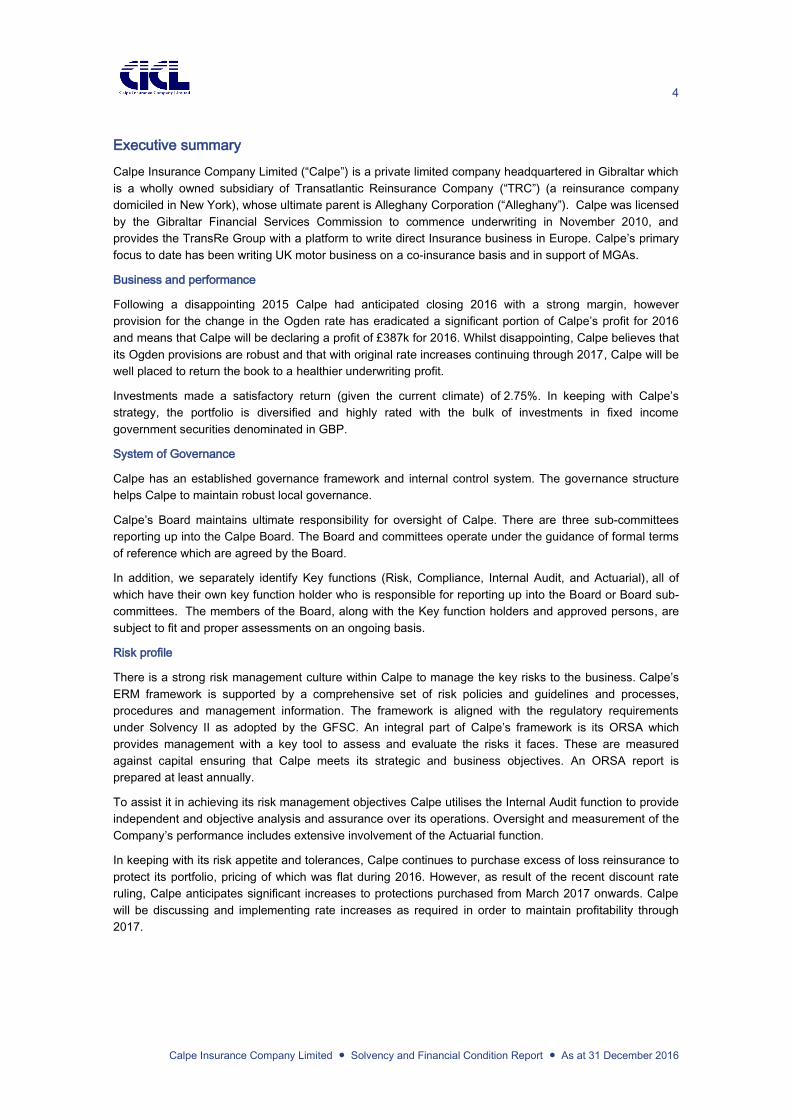
Business and performance
Following a disappointing 2015 Calpe had anticipated closing 2016 with a strong margin, however
provision for the change in the Ogden rate has eradicated a significant portion of Calpe’s profit for 2016
and means that Calpe will be declaring a profit of £387k for 2016. Whilst disappointing, Calpe believes that
its Ogden provisions are robust and that with original rate increases continuing through 2017, Calpe will be
well placed to return the book to a healthier underwriting profit.
Investments made a satisfactory return (given the current climate) of 2.75%. In keeping with Calpe’s
strategy, the portfolio is diversified and highly rated with the bulk of investments in fixed income
government securities denominated in GBP.
System of Governance
Calpe has an established governance framework and internal control system. The governance structure
helps Calpe to maintain robust local governance.
Calpe’s Board maintains ultimate responsibility for oversight of Calpe. There are three sub-committees
reporting up into the Calpe Board. The Board and committees operate under the guidance of formal terms
of reference which are agreed by the Board.
In addition, we separately identify Key functions (Risk, Compliance, Internal Audit, and Actuarial), all of
which have their own key function holder who is responsible for reporting up into the Board or Board sub-
committees. The members of the Board, along with the Key function holders and approved persons, are
subject to fit and proper assessments on an ongoing basis.
Risk profile
There is a strong risk management culture within Calpe to manage the key risks to the business. Calpe’s
ERM framework is supported by a comprehensive set of risk policies and guidelines and processes,
procedures and management information. The framework is aligned with the regulatory requirements
under Solvency II as adopted by the GFSC. An integral part of Calpe’s framework is its ORSA which
provides management with a key tool to assess and evaluate the risks it faces. These are measured
against capital ensuring that Calpe meets its strategic and business objectives. An ORSA report is
prepared at least annually.
To assist it in achieving its risk management objectives Calpe utilises the Internal Audit function to provide
independent and objective analysis and assurance over its operations. Oversight and measurement of the
Company’s performance includes extensive involvement of the Actuarial function.
In keeping with its risk appetite and tolerances, Calpe continues to purchase excess of loss reinsurance to
protect its portfolio, pricing of which was flat during 2016. However, as result of the recent discount rate
ruling, Calpe anticipates significant increases to protections purchased from March 2017 onwards. Calpe
will be discussing and implementing rate increases as required in order to maintain profitability through
2017.
5
Calpe Insurance Company Limited ● Solvency and Financial Condition Report ● As at 31 December 2016
Valuation for Solvency II purposes
An analysis of the differences between the valuation of assets and liabilities under Solvency II in
comparison to IFRS is provided in Sections D1 and D3 below. These sections provide a background to the
methods adopted under Solvency II, including the required inputs and any judgements or assumptions
made.
Technical provisions are the amount of capital Calpe needs to hold in reserve for claims and premiums net
of commissions and other expenses for all contractually obliged policies. This is equivalent to the current
amount an insurer would have to pay for an immediate transfer of its obligations to another insurer.
Technical provisions are made up of the best estimate liabilities and a risk margin.
Best estimate liabilities are the probability weighted average of future cash flows, discounted back to the
relevant balance sheet date using risk free discount rates.
The risk margin represents an allowance for the cost of capital necessary to support the policies to which
Calpe is obligated at the valuation date.
Calpe uses the IFRS insurance liabilities as the starting point for determining the Solvency II technical
provisions. Adjustments are made to move from the IFRS basis to the Solvency II basis. These
adjustments are detailed within Section D2.
Capital management
From 1 January 2016, Calpe transitioned into the Solvency II regime, which represents a more risk-based
approach to capital measurement and management. In February 2017, in response to the change in the
Ogden rate, Calpe adjusted its reserves as at 31 December 2016, recalculated its SCR and requested an
additional capital injection from its parent TRC.
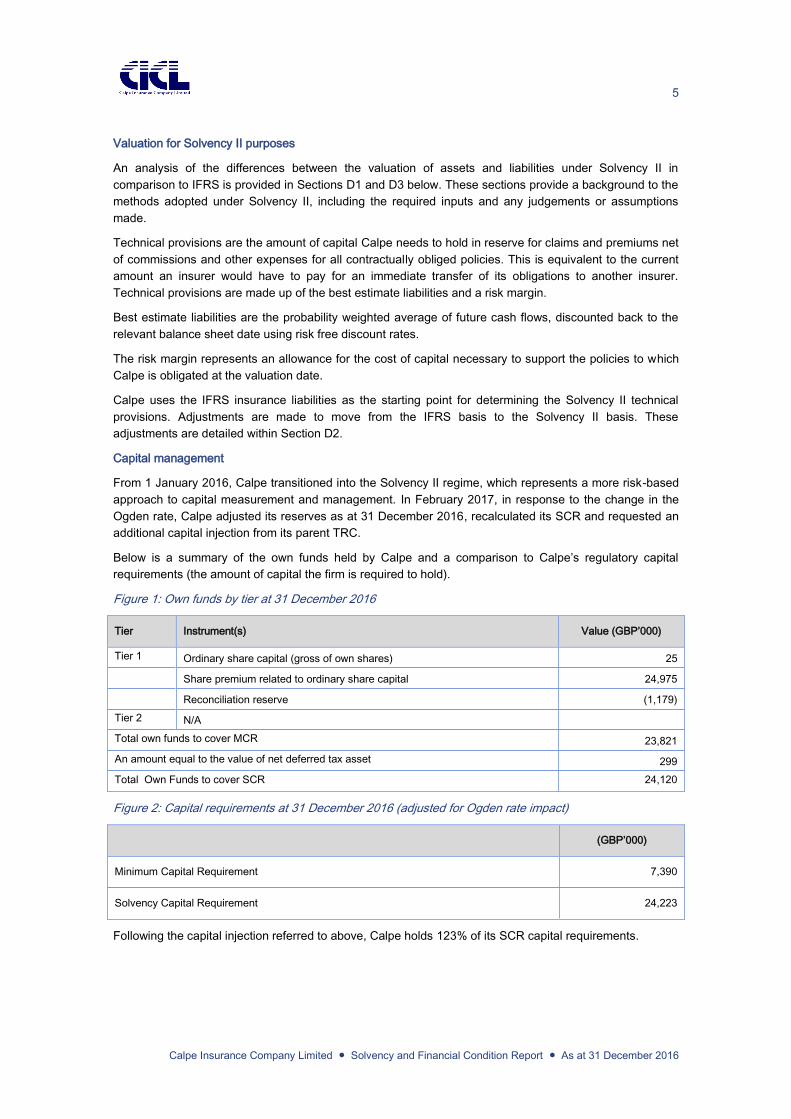
Below is a summary of the own funds held by Calpe and a comparison to Calpe’s regulatory capital
requirements (the amount of capital the firm is required to hold).
Figure 1: Own funds by tier at 31 December 2016
Tier Instrument(s) Value (GBP’000)
Tier 1 Ordinary share capital (gross of own shares) 25
Share premium related to ordinary share capital 24,975
Reconciliation reserve (1,179)
Tier 2 N/A
Total own funds to cover MCR 23,821
An amount equal to the value of net deferred tax asset 299
Total Own Funds to cover SCR 24,120
Figure 2: Capital requirements at 31 December 2016 (adjusted for Ogden rate impact)
(GBP’000)
Minimum Capital Requirement 7,390
Solvency Capital Requirement 24,223
Following the capital injection referred to above, Calpe holds 123% of its SCR capital requirements.

6
Calpe Insurance Company Limited ● Solvency and Financial Condition Report ● As at 31 December 2016
A. Business and performance
A.1 Business
Company information
Calpe Insurance Company Limited: PO Box 1338
First Floor Grand Ocean Plaza
Ocean Village
Gibraltar
Company number: 104429
Legal Entity Identifier: 2138004X13159LETLH50
External auditors: EY
Regal House
Queensway
GX111AA
Gibraltar
Regulator Gibraltar Financial Services Commission
PO Box 940
Suite 3, Ground Floor
Atlantic Suites
Europort Avenue
Gibraltar
Calpe is a private limited company, limited by shares, with its registered office in Gibraltar. It is a wholly
owned subsidiary of TRC, which is a reinsurance company domiciled in New York, USA. Calpe provides
the TransRe group (“TransRe”) with a platform to write direct insurance business in Europe. Calpe is
headquartered in Gibraltar and was licensed by the Gibraltar Financial Services Commission to commence
underwriting on 1 November 2010.
Calpe’s ultimate parent undertaking is Alleghany, a company incorporated in Delaware, USA. Further
information on Alleghany is available at www.alleghany.com.
In addition to TRC and Alleghany, Transatlantic Holdings, Inc., incorporated in Delaware, USA, is an
indirect parent and holder of a qualifying holding in Calpe.
Other than TRC, TRH and Alleghany, there are no other holders of qualifying holdings in Calpe. Calpe has
no related undertakings as defined in Article 212 of the Solvency II Directive. A simplified group structure
chart is shown below. The Alleghany group is subject to group supervision by the New Hampshire
Department of Insurance, NH, USA.
7
Calpe Insurance Company Limited ● Solvency and Financial Condition Report ● As at 31 December 2016
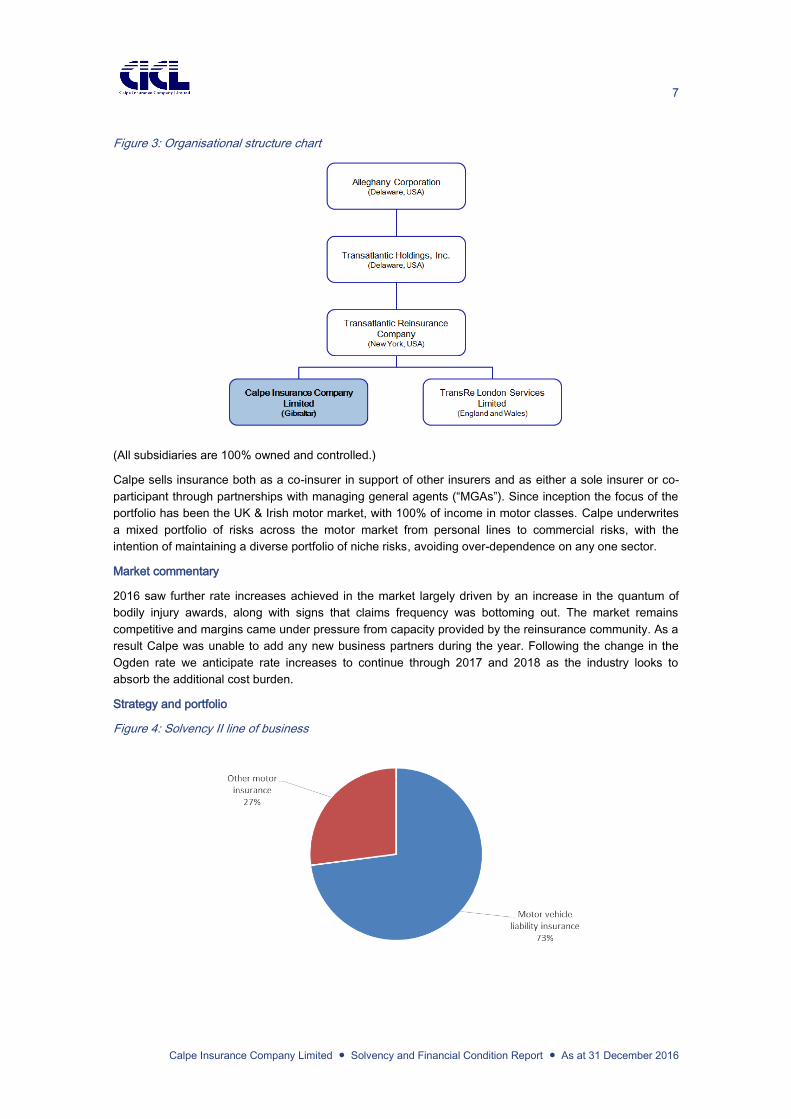
Figure 3: Organisational structure chart
(All subsidiaries are 100% owned and controlled.)
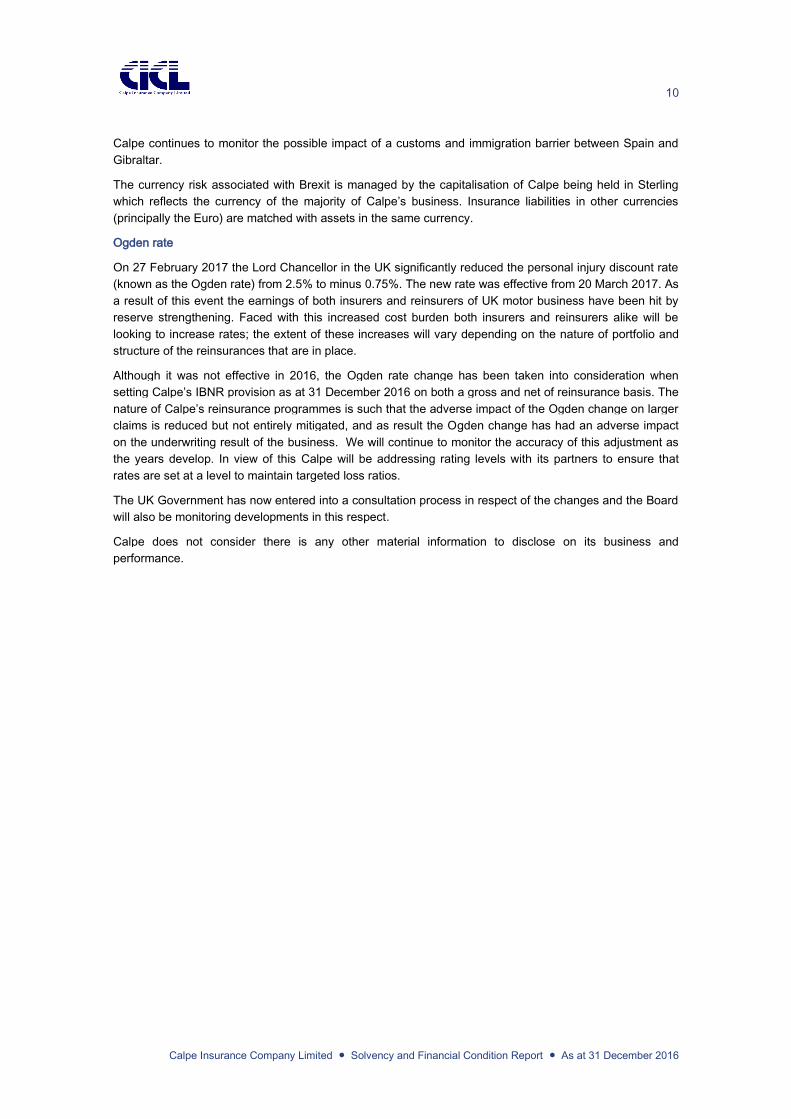
Calpe sells insurance both as a co-insurer in support of other insurers and as either a sole insurer or co-
participant through partnerships with managing general agents (“MGAs”). Since inception the focus of the
portfolio has been the UK & Irish motor market, with 100% of income in motor classes. Calpe underwrites
a mixed portfolio of risks across the motor market from personal lines to commercial risks, with the
intention of maintaining a diverse portfolio of niche risks, avoiding over-dependence on any one sector.
Market commentary
2016 saw further rate increases achieved in the market largely driven by an increase in the quantum of
bodily injury awards, along with signs that claims frequency was bottoming out. The market remains
competitive and margins came under pressure from capacity provided by the reinsurance community. As a
result Calpe was unable to add any new business partners during the year. Following the change in the
Ogden rate we anticipate rate increases to continue through 2017 and 2018 as the industry looks to
absorb the additional cost burden.
Strategy and portfolio
Figure 4: Solvency II line of business

8
Calpe Insurance Company Limited ● Solvency and Financial Condition Report ● As at 31 December 2016
Figure 5: Premium income by territory
During the review period no significant new classes of business were undertaken.
Calpe has been keen to expand its class spread and as part of its authorisation Calpe also holds a licence
to write direct business in property and engineering. However, the previous absence of an independent
financial strength rating coupled with Calpe’s disciplined approach and focus on underwriting profit made
adding new classes challenging. Calpe will continue to review the potential to expand the class base, but
not at the expense of achieving its required margin.
In August 2016, TRC received an A.M. Best financial strength rating up-grade to A+. On 19 January 2017,
A.M. Best announced that it had extended the A+ rating to Calpe.
A.2 Underwriting performance
Calpe’s gross written premium during 2016 increased by 9% from the prior year. Increased volumes
through two renewal agreements were the major drivers behind this increase, along with general increases
being experienced from original rates.
Following cancellation of a poor performing account and reserve strengthening on another in 2015, the
2016 underwriting year is showing improved profitability. We are seeing the impact on results from an
improved rating environment, although this will be negated to some extent by the change to the Ogden
rate.
For more details on Calpe’s underwriting performance please refer to QRT S.05.01.
Underwriting performance by line of business
Calpe’s business falls into two of the Solvency II lines of business. The table below summarises the
performance of those lines of business. Figures are presented on both a gross assumed basis and on a
net basis after all outwards reinsurance, including the TRL Quota Share described in Section B1.
Figure 6: Underwriting performance by Solvency II line of business
Net (€’000) Motor vehicle
liability
insurance
Other motor
insurance
Total
Premiums Written 29,213 11,563 40,776
Premiums Earned 27,510 10,793 38,303
Claims Incurred 22,429 8,458 30,887
Underwriting Ratio 82% 78% 81%
For details and the breakdown of premiums, claims and expenses by geographical spread please refer to
QRT S.05.02.01.

9
Calpe Insurance Company Limited ● Solvency and Financial Condition Report ● As at 31 December 2016
A.3 Investment performance
Net investment income
Net investment income recognised in the statement of profit or loss and other comprehensive income
includes investment income (comprising interest, dividends and the amortisation of any discount or
premium on available-for-sale debt securities and rents receivable for the period), realised gains and
losses and movements in unrealised gains and losses on financial assets held at fair value through profit
or loss, net of interest payable, investment expenses and impairment losses on financial assets.
Interest income is recognised as accrued based on the effective interest method. Dividend income is
recognised as Calpe’s right to those dividends becomes unconditional. Acquisition costs related to the
purchase of bonds are capitalised and expensed over duration of the investment.
Financial investments
Calpe’s investment portfolio is made up exclusively of fixed income securities. Over the year the
investment portfolio has made a net gain of £2,553k.
Figure 7: Net investment return
Asset Category (£’000) Income Gains / Losses Net Income
Gain / Loss Total SII Value
Corporate Bonds 632 878 1,510 37,413
Government Bonds 198 843 1,041 23,904
Cash and deposits 2 - 2 9,881
Total 832 1,721 2,553 71,198
Securitisations
Calpe’s asset portfolio does not include any securitised investments.
A.4 Performance of other activities
Calpe does not receive any material income other than from its underwriting and investment activities.
Calpe has no financial or operating lease arrangements.
Calpe’s reporting and presentational currency is GBP. The operating results and financial position of each
non-GPB ledger are translated into GBP. All resulting exchange differences are recognised in the
statement of profit and loss and other comprehensive income.
A.5 Any other information
Brexit
A referendum on the UK’s membership of the EU was held on 23 June 2016 and resulted in a majority of
52% in favour of the withdrawal of the UK from the EU, or “Brexit”. On 29 March 2017, the UK served
notice on the EU in accordance with Article 50 of the Treaty on European Union (“Article 50”). The Brexit
vote means that insurance carriers operating in Gibraltar now face a period of regulatory uncertainty as the
UK and the EU enter into a complex and potentially protracted process to redefine the UK’s economic and
political relationships with the EU.
The principal risks of Brexit to Calpe are a possible loss of access EU insurance markets in the future, the
risk of a customs and immigration barrier being established between Spain and Gibraltar and the
devaluation of Sterling.
As the majority of Calpe’s business is for policyholders in the UK, we do not anticipate that the possible
loss of access to the single market will have a significant impact on Calpe’s business and performance.
10
Calpe Insurance Company Limited ● Solvency and Financial Condition Report ● As at 31 December 2016
Calpe continues to monitor the possible impact of a customs and immigration barrier between Spain and
Gibraltar.
The currency risk associated with Brexit is managed by the capitalisation of Calpe being held in Sterling
which reflects the currency of the majority of Calpe’s business. Insurance liabilities in other currencies
(principally the Euro) are matched with assets in the same currency.
Ogden rate
On 27 February 2017 the Lord Chancellor in the UK significantly reduced the personal injury discount rate
(known as the Ogden rate) from 2.5% to minus 0.75%. The new rate was effective from 20 March 2017. As
a result of this event the earnings of both insurers and reinsurers of UK motor business have been hit by
reserve strengthening. Faced with this increased cost burden both insurers and reinsurers alike will be
looking to increase rates; the extent of these increases will vary depending on the nature of portfolio and
structure of the reinsurances that are in place.
Although it was not effective in 2016, the Ogden rate change has been taken into consideration when
setting Calpe’s IBNR provision as at 31 December 2016 on both a gross and net of reinsurance basis. The
nature of Calpe’s reinsurance programmes is such that the adverse impact of the Ogden change on larger
claims is reduced but not entirely mitigated, and as result the Ogden change has had an adverse impact
on the underwriting result of the business. We will continue to monitor the accuracy of this adjustment as
the years develop. In view of this Calpe will be addressing rating levels with its partners to ensure that
rates are set at a level to maintain targeted loss ratios.
The UK Government has now entered into a consultation process in respect of the changes and the Board
will also be monitoring developments in this respect.
Calpe does not consider there is any other material information to disclose on its business and
performance.
11
Calpe Insurance Company Limited ● Solvency and Financial Condition Report ● As at 31 December 2016
B. System of Governance
B.1 General information on the system of governance
Calpe’s governance structure reflects its membership of a large international group of companies, while
ensuring that it maintains robust local governance arrangements.
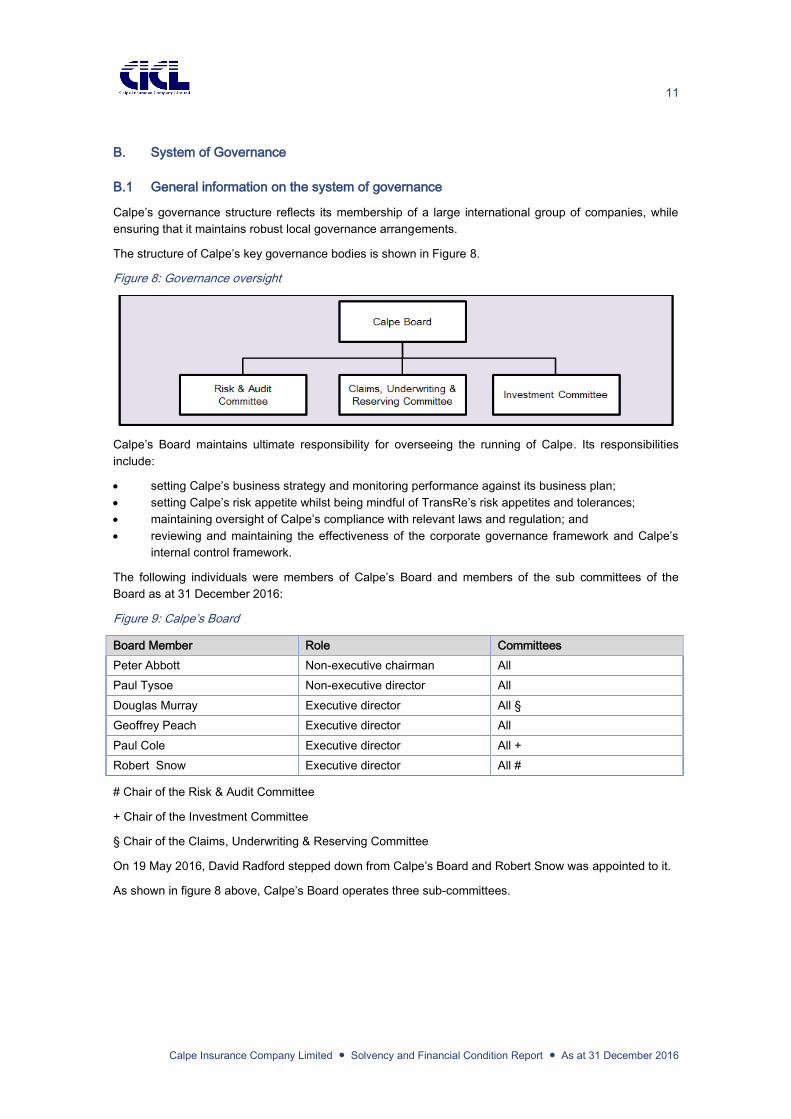
The structure of Calpe’s key governance bodies is shown in Figure 8.
Figure 8: Governance oversight
Calpe’s Board maintains ultimate responsibility for overseeing the running of Calpe. Its responsibilities
include:
setting Calpe’s business strategy and monitoring performance against its business plan;
setting Calpe’s risk appetite whilst being mindful of TransRe’s risk appetites and tolerances;
maintaining oversight of Calpe’s compliance with relevant laws and regulation; and
reviewing and maintaining the effectiveness of the corporate governance framework and Calpe’s
internal control framework.
The following individuals were members of Calpe’s Board and members of the sub committees of the
Board as at 31 December 2016:
Figure 9: Calpe’s Board
Board Member Role Committees
Peter Abbott Non-executive chairman All
Paul Tysoe Non-executive director All
Douglas Murray Executive director All §
Geoffrey Peach Executive director All
Paul Cole Executive director All +
Robert Snow Executive director All #
# Chair of the Risk & Audit Committee
+ Chair of the Investment Committee
§ Chair of the Claims, Underwriting & Reserving Committee
On 19 May 2016, David Radford stepped down from Calpe’s Board and Robert Snow was appointed to it.
As shown in figure 8 above, Calpe’s Board operates three sub-committees.
12
Calpe Insurance Company Limited ● Solvency and Financial Condition Report ● As at 31 December 2016
Risk & Audit Committee
The Risk & Audit Committee’s responsibilities include:
Risk
providing oversight and challenge to the effectiveness of Calpe’s Risk Management function,
Enterprise Risk Management (“ERM”) framework and risk management culture, including the
appetites and tolerances and progress embedding ERM in Calpe in alignment with TransRe’s
overall ERM and risk governance framework;
monitoring the effectiveness of Calpe’s risk management and internal control systems, including
financial, operational and compliance controls, and reporting any recommendations to the Board;
and
providing oversight and challenge to the effectiveness of Calpe’s Compliance Function, approving
the Compliance Monitoring [and Training] Plan and overseeing progress against it.
Audit
monitoring and reviewing the effectiveness of Calpe’s Internal Audit function;
approving the annual Internal Audit Plan and overseeing progress against it;
reviewing Internal Audit reports, findings and monitor the status of actions and recommendations;
monitoring the integrity of the financial statements of Calpe and any formal announcements relating
to Calpe’s financial performance;
reviewing Calpe’s internal financial controls;
making recommendations to the Board in relation to the appointment, re-appointment and removal
of the external auditor and approving the remuneration and terms of engagement of the external
auditor;
approving the external audit plan and overseeing progress against it; and
reviewing and monitoring the external auditor’s independence and objectivity and the effectiveness
of the audit process.
The Risk & Audit Committee meets at least four times per year.
Investment Committee
The Investment Committee’s responsibilities include:
reviewing and making recommendations to the Board in respect of Calpe’s investment strategy and
policy in a manner consistent with the prudent person principle;
receiving and reviewing summary reports on Calpe’s investment portfolio, investment activity and
investment practices;
considering investment performance and providing appropriate challenge and comment;
maintaining oversight of compliance by management with applicable legal and regulatory
requirements with respect to investments and the investment policies and decisions of Calpe’s
management; and
considering reports in respect of investment risk management, liquidity management and credit
management.
The Investment Committee meets at least four times per year.
Claims, Underwriting & Reserving Committee
The Claims, Underwriting & Reserving Committee’s responsibilities include:
Underwriting
considering new products, MGA and co-insurance opportunities and lines of business;
establishing, recommending and maintaining oversight of the underwriting strategy (including
reinsurance purchasing) and business planning activities;
13
Calpe Insurance Company Limited ● Solvency and Financial Condition Report ● As at 31 December 2016
recommending underwriting risk appetites and tolerances and reinsurance requirements for Calpe,
ensuring they are consistent with TransRe’s group;
reviewing underwriting performance, including pricing, claims trends, insurance buying patterns,
competitor analysis, and conversion and lapse rates; and
reviewing key aggregate management issues and development.
Claims
reviewing and monitoring claims activity and claims trends;
approving delegated claims handling authorities; and
assisting the Board in setting the claims philosophy and claims development policy to be adopted.
Reserving
establishing, recommending and maintaining oversight of the reserving strategy;
maintaining oversight on the reserving policy to ensure it is fit for purpose;
considering the adequacy of previously set reserves against actual outcomes and investigating
where material differences are identified; and
recommending a level of reserves for consideration by the Board.
The Claims, Underwriting & Reserving Committee meets at least four times per year.
The Board and its sub-committees maintain terms of reference that are reviewed at least annually.
Each of the sub-committees reports to the Board through their respective Chairs as a standing item on the
Board’s agenda.
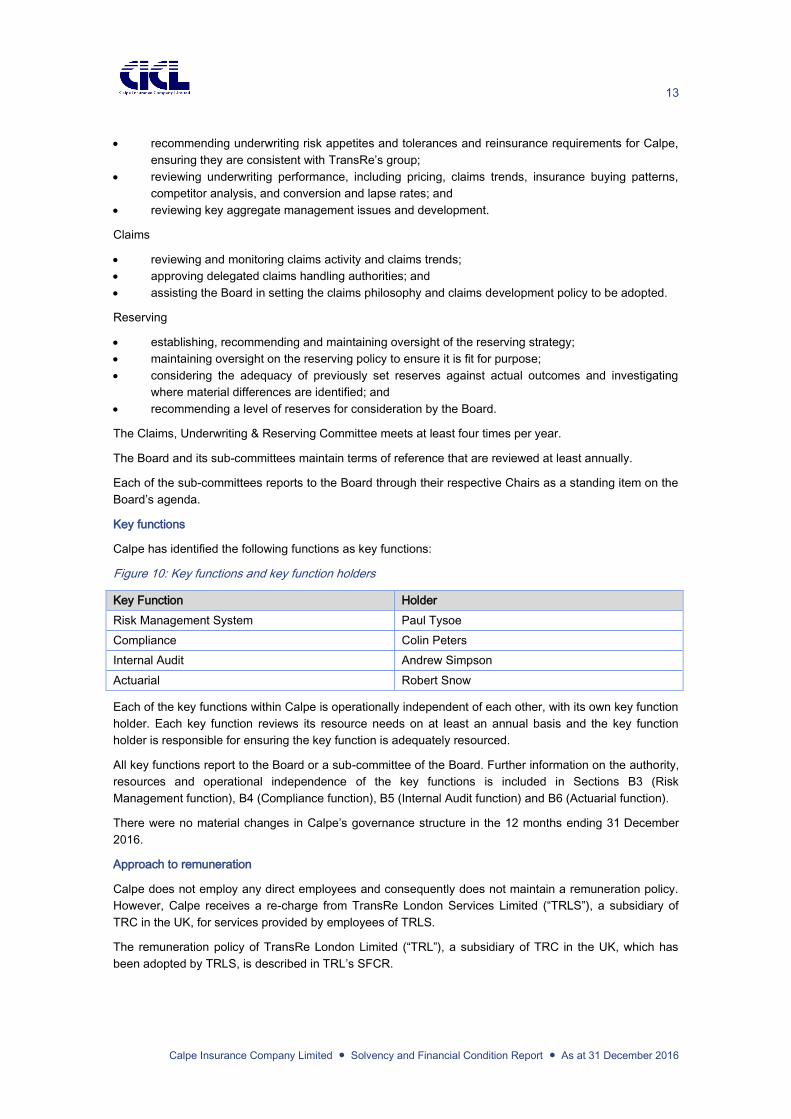
Key functions
Calpe has identified the following functions as key functions:
Figure 10: Key functions and key function holders
Key Function Holder
Risk Management System Paul Tysoe
Compliance Colin Peters
Internal Audit Andrew Simpson
Actuarial Robert Snow
Each of the key functions within Calpe is operationally independent of each other, with its own key function
holder. Each key function reviews its resource needs on at least an annual basis and the key function
holder is responsible for ensuring the key function is adequately resourced.
All key functions report to the Board or a sub-committee of the Board. Further information on the authority,
resources and operational independence of the key functions is included in Sections B3 (Risk
Management function), B4 (Compliance function), B5 (Internal Audit function) and B6 (Actuarial function).
There were no material changes in Calpe’s governance structure in the 12 months ending 31 December
2016.
Approach to remuneration
Calpe does not employ any direct employees and consequently does not maintain a remuneration policy.
However, Calpe receives a re-charge from TransRe London Services Limited (“TRLS”), a subsidiary of
TRC in the UK, for services provided by employees of TRLS.
The remuneration policy of TransRe London Limited (“TRL”), a subsidiary of TRC in the UK, which has
been adopted by TRLS, is described in TRL’s SFCR.
14
Calpe Insurance Company Limited ● Solvency and Financial Condition Report ● As at 31 December 2016
Fees paid to non-executive directors are calculated on a flat rate basis and there is no variable component.
Fees are reviewed periodically to ensure Calpe continues to attract and retain individuals of the
appropriate skills and experience.
Material transactions with shareholders
Other than the outsourcing arrangements described in Section B7 and the TRC Guarantee described
below, Calpe does not have any material transactions with the shareholders, members of the management
body or those who can exert significant influence over the business.
Amounts paid to connected companies are reviewed on an annual basis as part of a group-wide transfer
pricing exercise and the charges are reviewed and challenged by the Calpe Board. Additionally these
recharges are subject to regulatory approval from the GFSC.
Calpe has a variable whole account quota share reinsurance agreement with TRL (as reinsurer) (the “TRL
Quota Share”), under which the proportion ceded can be varied by Calpe between 50% and 80%.
In October 2016, TRC entered into a Capital Support Guarantee Agreement (the “TRC Guarantee”) in
favour of Calpe. Under the TRC Guarantee, TRC agrees to maintain Calpe’s regulatory capital in an
amount not less than 100% of Calpe’s Solvency Capital Requirement.
Calpe has assessed the nature, scale of complexity of its business against its governance structure and
considers its system of governance to be adequate.
B.2 Fit and proper requirements
The members of Calpe’s Board collectively possess appropriate qualification, experience and knowledge
about at least:
insurance and financial markets;
business strategy and business model;
system of governance;
financial and actuarial analysis; and
regulatory framework and requirements.
Persons subject to assessment
Calpe ensures that Board members and key function holders are at all times fit and proper persons. Calpe
does not draw a distinction between these categories when carrying out its own assessment of a person’s
fitness and propriety.
Timing of assessment
Calpe assesses fit and proper requirements on an ongoing basis, with the Directors subject to an annual
assessment. Calpe’s directors and managers (and all TransRe employees) are also expected to abide by
the group’s Code of Business Conduct and Ethics, which sets out standards of ethics and behaviours.
Nature of assessment
In deciding whether a person is fit and proper, Calpe must be satisfied that the person:
has the personal characteristics (including being of good repute and integrity);
possesses the level of competence, knowledge and experience;
has the qualifications; and
has undergone or is undergoing all training required to enable that person to perform his or her
function effectively and in accordance with any relevant regulatory requirements and to enable
sound and prudent management of Calpe.
Any breaches of the fit and proper requirements are internally reported to the Board and the Risk & Audit
Committee. Calpe’s Compliance Officer is responsible for notifying the relevant regulator(s) of the change
in circumstances and any remedial action that is being undertaken by Calpe.

15
Calpe Insurance Company Limited ● Solvency and Financial Condition Report ● As at 31 December 2016
Training and competency
Calpe subscribes to TransRe’s training and competency ethos, which is designed to promote learning and
development within TransRe and to ensure that Calpe employs personnel with the skills, knowledge and
expertise necessary for the discharge of the responsibilities allocated to them.
Calpe actively encourages staff to further develop and pursue professional qualifications. Development is
the responsibility of each staff member.
In addition to the above, all staff who maintain professional qualifications are expected to undertake
Continuing Professional Development (CPD) in line with their relevant professional body requirements.
B.3 Risk Management System including the ORSA
Calpe’s ERM framework has been developed to enable the Board and senior management to understand
and appropriately manage and mitigate the risks associated with Calpe’s objectives over the short,
medium and longer term in a manner that is commensurate with Calpe’s risk profile and business
arrangements.
The ERM framework seeks to engender a culture of no significant surprises and to ensure adequate tools
are available to manage the most important risks to Calpe, improve decision-making and to support the
achievement of Calpe’s business objectives. In summary, the purpose of Calpe’s ERM framework is to:
actively sponsor and foster a risk aware culture across Calpe, supporting staff in making risk
management/based judgements, encouraging effective management of exposures within Calpe’s
stated risk appetite;
ensure a clear, coherent risk strategy that includes policies and standards, risk appetites and clarity
of ownership for risks;
ensure risk is taken into account in key business decisions;
ensure that the ‘three lines of defence’ model operates effectively;
implement risk strategies and policies that align with Calpe’s strategic and operational objectives;
ensure risks and emerging risks are identified and understood and assessed on a forward-looking
basis to allow management to take proactive steps; and
sustain a robust Own Risk and Solvency Assessment (“ORSA”) process that informs
management’s view of risk and capital.
Calpe’s ERM framework is supported by a comprehensive set of risk policies, frameworks and guidelines
to help ensure adequate processes and procedures are in place to manage all types of risk which is
supported by a comprehensive suite of management information. The framework is aligned with the
regulatory requirements under the Solvency II regime as adopted by GFSC.
By adopting this approach, Calpe is able to effectively identify, measure, monitor, manage and report risks
at an individual / contract level and at an aggregated level on an ongoing basis.
Calpe senior management and risk owners identify key risks to the business, as part of a rolling risk
identification and assessment programme. Risk causes and consequences, together with mitigating
controls, are identified for each risk category. Key risks, owners and mitigating controls are recorded in a
risk register; which is presented to management on a quarterly basis for review and discussion.
The risks recorded in the register form part of Calpe’s ORSA process and are used as the basis for the
development of Calpe’s internal audit programme. Calpe’s Risk & Audit Committee recieves regular
reports from Calpe’s Risk Management function which consider key risks to Calpe, aggregations and
exposures across the key ERM pillars.
Calpe’s Risk Management function is integrated into the organisation through the governance reporting
lines to Calpe’s Risk Management function holder, Calpe’s Risk & Audit Committee and TransRe’s CRO.
Calpe’s Risk Management function holder is also a member of and participates in key decision making
forums. In addition to these reporting lines and membership responsibilities, TransRe’s Head of Risk –

16
Calpe Insurance Company Limited ● Solvency and Financial Condition Report ● As at 31 December 2016
International also attends Calpe’s Risk & Audit Committee to ensure that key matters can be escalated to
TransRe’s Corporate Risk Management Committee.
In addition, the Risk Management function’s roles and responsibilities include:
developing, communicating and implementing systems, processes and procedures for the
management and evaluation of risk accumulations and providing key risk indicator reports;
working alongside other key control functions and ensuring existing control activities and reports
are developed into the risk and control reporting framework;
coordinating with the key control functions to ensure internal policies, controls and procedures for
identifying and managing key risks are documented in sufficient detail to allow for effective
compliance, testing and auditing;
coordinating documentation of the key internal policies, procedures and controls for the
management of risks identified in the risk register; and
providing input and challenge into the development of stress and reverse stress tests for Calpe.
By adopting such an approach, ERM and risk management more broadly are key considerations as part of
the decision making process.
Own Risk and Solvency Assessment
The ORSA process considers Calpe’s own solvency assessment given its risk profile, business objectives
and capital management strategy against its regulatory solvency requirement in order to determine
whether additional solvency cover is required. The ORSA also considers the impact on Calpe should it be
subject to significant losses arising from both insurance and non-insurance events; against such extreme
events, the ORSA considers what actions Calpe management would undertake to mitigate the impact of
such events. Furthermore, as part of the ORSA process, Calpe considers the amount of capital it should
maintain to meet its contractual liabilities to “ultimate”.
Calpe produces an ORSA report on at least an annual basis. The ORSA is a key management tool and is
linked to Calpe’s business planning and strategy, the risks Calpe is exposed to and the capital required to
mitigate such risks.
The ORSA process can be diagrammatically represented as follows:
Figure 11: Calpe’s risk identification and ORSA framework
The ORSA process provides Calpe with a mechanism to assess the risks it faces and to determine the
necessary level of capital required to ensure Calpe meets its strategic and business objectives. The ORSA
is Calpe’s view of its exposure to underwriting and non-underwriting risks and its solvency position and
documents how Calpe has reached its conclusions. The ORSA aims to assess, in a continuous and
forward looking manner, the overall solvency needs of Calpe, whilst being mindful of its risk profile and
business environment.
17
Calpe Insurance Company Limited ● Solvency and Financial Condition Report ● As at 31 December 2016
Calpe senior management has identified a number of triggers that would result in the ORSA being re-run
at any point during the year; these triggers are tracked by the Risk Management function and reported to
the Risk & Audit Committee.
Calpe’s Risk Management function coordinates the relevant processes with subject matter experts across
the business and prepares the ORSA report for review and discussion by Calpe’s Board. Once the report
is reviewed, the ORSA and the amount of capital Calpe intends to maintain, based on its expected risk
profile, is approved by the Board and the ORSA report is shared with the GFSC.
B.4 Internal control system
Within Calpe, there is a robust internal control system that includes:
the corporate governance framework, procedures and controls;
a financial control framework;
independent control functions which comprise of the Actuarial, Compliance and Risk Management
functions; and
independent assurance provided by the Internal Audit function.
The financial control framework is designed to ensure that:
risks relevant to the preparation and fair presentation of the financial statements in accordance with
the applicable financial reporting framework have been identified and documented;
there are sufficient and effective controls in place (both manual and automated) to mitigate these
risks and to prevent or detect material misstatements in the financial statements and disclosures.
The IFRS financial statements are subject to rigorous controls in the production and review leading up to
publishing. The actuarial liabilities are produced using best practice actuarial practices that are subject to
independent review with the financial statements subject to internal review and external audit review. The
financial statements are subject to external audit and are presented to the Board for sign-off prior to
publishing.
In addition to the above, Calpe’s Internal Audit function, through planned and commissioned reviews of
Calpe’s processes, provides an independent opinion on the internal control framework of Calpe’s business.
Implementation of Calpe’s Compliance function
Calpe maintains compliance policies and procedures that establish systems of control and supervision
sufficient to provide reasonable assurance that Calpe, and those individuals acting on its behalf, comply
with Gibraltar legislation, and to manage the risks associated with its business in accordance with prudent
business practices and within TransRe’s overarching compliance requirements.
The day-to-day activities of the Compliance function are managed by Quest Insurance Management
(Gibraltar) Limited. Quest’s Compliance activities are supervised by Colin Peters as Compliance function
holder and Calpe’s Risk & Audit Committee.
The Compliance function has sufficient authority to carry out its functions on its own initiative without
obstruction from management and other staff members.
The Compliance function’s responsibilities include:
advising the Board on compliance with Solvency II and related laws and regulations;
providing training and guidance regarding applicable law and regulation and TransRe’s and Calpe’s
policies, and clearly communicating ethical guidance;
monitoring complaints received by MGAs and co-insurers from policyholders or claimants;
assessing the possible impact of any changes in the legal and regulatory environment on the
operations of Calpe;
identifying and assessing compliance risks relevant to Calpe and managing the control environment
that mitigates those risks;

18
Calpe Insurance Company Limited ● Solvency and Financial Condition Report ● As at 31 December 2016
undertaking compliance monitoring and making recommendations to improve the effectiveness of
compliance practices; and
identifying Calpe compliance training needs and implementing effective compliance training
programmes, as required.
B.5 Internal Audit function
Calpe’s Internal Audit function is an independent function and provides objective challenge and assurance
over Calpe.
The Internal Audit function supports Calpe in accomplishing its objectives by bringing a systematic,
disciplined approach to evaluate and improve the effectiveness of risk management, control, and
governance processes.
The Internal Audit function is led by the TransRe Director of Internal Audit, based in New York, USA.
The day-to-day activities of Calpe’s Internal Audit function are outsourced to Mazars LLP in the UK.
Mazars reports to Calpe’s Risk & Audit Committee and TransRe’s Director of Internal Audit. Rolling three-
year audit plans are submitted to Calpe’s Risk & Audit Committee for approval. Internal audit reports are
distributed to the Calpe’s Board and Risk & Audit Committee and to TRH’s Audit Committee. Outstanding
internal audit actions are tracked and progress reported at Risk & Audit Committee meetings.
The management of the Internal Audit function by the TransRe’s Director of Internal Audit and outsourcing
of day to day activities to Mazars helps to ensure that the Internal Audit function maintains independence
and objectivity.
B.6 Actuarial function
Calpe’s Actuarial function gains its authority from Calpe’s Board and TransRe’s Group Chief Actuary.
Calpe’s Board maintains ultimate responsibility for oversight of Calpe’s Actuarial function. Calpe’s Actuarial
function is provided by TRLS via an intragroup service agreement.
The Actuarial function is responsible for:
coordinating the calculation of technical provisions;
ensuring the appropriateness of the methodologies and underlying models used as well as the
assumptions made in the calculation of technical provisions;
assessing the sufficiency and quality of the data used in the calculation of technical provisions;
comparing best estimates against experience;
informing the administrative, management or supervisory body of the reliability and adequacy of the
calculation of technical provisions;
overseeing the calculation of technical provisions in the cases set out in Article 82;
expressing an opinion on the overall underwriting policy;
expressing an opinion on the adequacy of reinsurance arrangements; and
contributing to the effective implementation of the risk-management system.
These activities are undertaken on at least an annual basis and are reported to the Board in an internal
Actuarial Function Report.

19
Calpe Insurance Company Limited ● Solvency and Financial Condition Report ● As at 31 December 2016
B.7 Outsourcing
Outsourcing management
For each outsourcing arrangement, a Calpe manager (the “Outsourcing Owner”) is identified. The
Outsourcing Owner is responsible for identifying whether the activity to be outsourced is critical or
important, carrying out pre-contract due diligence including know your counterparty (“KYC”) checks and
agreeing the terms of the engagement. The Outsourcing Owner is also responsible for the ongoing
oversight and management of outsourcing arrangements.
Claims handling is outsourced to third party firms either directly in respect of Managing General Agents
(“MGA”) or indirectly via a claims handling agreement between the lead insurer and the claims handler
where Calpe’s role is one of a co-insurer.
Outsourcing of critical or important operational functions
Details of outsourcing in respect of Calpe’s critical or important operational functions are set out in
figure 12.
Figure 12: Outsourcing of critical or important operational functions
Outsourcing Jurisdiction
Insurance management services, including underwriting, claims and
reinsurance support and governance and company secretarial, financial
management, regulatory and compliance services, are provided by Quest
under an insurance management services agreement.
Gibraltar
Certain intra-group services and support services, including underwriting
support, claims and reinsurance support, actuarial, investment, accounting
and treasury services and internal audit are provided by TRLS and TRC
under a services agreement.
UK (TRLS)
New York, USA (TRC)
Calpe outsources the day-to-day activities of its Internal Audit function to
Mazars, as described in section B5. UK
Calpe’s day-to-day investment management activities are outsourced to
BlackRock Investment Management (UK) Limited (“BlackRock”), a member of
the BlackRock group. BlackRock’s performance is monitored by Alleghany’s
and TransRe’s treasury management functions, both based in New York, USA
with further oversight provided by TRL’s CFO in the UK. BlackRock reports
quarterly to Calpe’s Investment Committee.
UK
B.8 Any other information
Except as specifically identified in this Section B, Calpe’s system of governance has not materially
changed during the 12 month period to 31 December 2016.
Calpe does not consider there is any other material information to disclose on its system of governance.

20
Calpe Insurance Company Limited ● Solvency and Financial Condition Report ● As at 31 December 2016
C. Risk profile
Calpe is a primary insurer and maintains a licence to write motor and property business. Key points
regarding Calpe’s risk profile are:
provides insurance and co-insurance support to MGAs and insurers that have the expertise to
underwrite property and motor classes of business; and
predominantly focused on UK motor business.
Calpe’s Solvency Capital Requirement (“SCR”) is calculated using the Standard Formula for all
components. The Standard Formula is a risk based capital requirement that covers underwriting risk,
market risk, credit risk and operational risk in a formulaic way and can be diagrammatically represented as
follows:
Figure 13: Standard Formula risk modules
The above diagram does not include the effect of diversification benefits or adjustments.
Each of the key risk categories and keys risks relevant to Calpe are described in further detail below.
C.1 Underwriting risk
Key underwriting risks Calpe is exposed to include:
Premium / Underwriting risk
o excessive aggregation/catastrophe risks in a single region/location;
o writing outside of appetite;
o excess exposures in certain driver demographics and/or territories;
o underwriting below the technical price;
Reinsurance risk
o failure of reinsurance counterparties or reinsurance programmes; and
Reserve risk
o reserve risks, including inadequate reserving due to flaws in the provisioning/reserving
methodology or in the application of the methodology, inadequate Incurred But Not Reported
(“IBNR”) and inadequate Incurred But Not Enough Reported (IBNER).
Calpe maintains a number of risk mitigation techniques and approaches to manage the risks associated
with its underwriting risk profile. Further information on the monitoring and approach is provided below.

21
Calpe Insurance Company Limited ● Solvency and Financial Condition Report ● As at 31 December 2016
Premium / underwriting risk management
Calpe maintains a clear underwriting philosophy that is supported by risk appetites and tolerances,
procedures and controls in relation to pricing, rigorous risk selection criteria and the ability to underwrite a
diverse range of insurers and MGAs.
Calpe’s main risks are that an MGA or co-insurer fails or seeks to accept business that is outside of the
agreed underwriting criteria that Calpe has set.
Calpe has developed robust underwriting selection procedures and potential co-insurance and MGA
partners are subject to a comprehensive due diligence process.
Calpe assesses and mitigates these risks by having in place:
ongoing monitoring and exposure management, assessing individual and aggregate exposures;
ongoing exposure management against risk tolerances and against a range of extreme events and
stress tests; and
ongoing reviews of underwriting activities, including quarterly underwriting performance reviews,
pricing adequacy reviews and rate monitoring supplement the oversight framework.
Reinsurance risk
Calpe benefits from a comprehensive reinsurance programme that provides protection for Calpe. All
placements are subject to approval and must comply with TransRe’s group-wide retrocession/reinsurance
purchasing procedures (which include minimum credit quality and counterparty limits) and delegated
retrocession/reinsurance purchasing authorities.
Calpe does not have any exposure to any special purpose vehicles.
Reserve risk management
Reserve risk is managed through the oversight provided by Calpe’s Claims, Underwriting & Reserving
Committee which has put in place a number of controls and mitigants that include:
a comprehensive annual reserve study;
quarterly reserve reviews;
reserving risk controls that include major activity reports, high cost claim alerts, major loss memos
and reinsurance transaction alerts;
ad-hoc reserving studies; and
independent validation of reserves.
Risk sensitivity for underwriting risks
Calpe undertakes detailed stress and scenario testing as part of its ORSA process.
As part of the ORSA process, the solvency position and the projected solvency position over the business
planning period have been calculated following adverse stresses at different return periods for the material
underwriting risks (each risk’s stress is considered individually) in addition to multiple losses arising from
non-correlating events (eg, market risks and underwriting risks or a series of events). In addition to these
underwriting events, consideration has been given to a material deterioration in Calpe’s reserves, including
adverse development in claims ratios and IBNR.
The results of the analysis showed that the most material impact on the SCR arose from prolonged poor
underwriting results or through reserve deterioration (arising from poor/weak reserving methodology). The
analysis undertaken indicated that it would take a significant event to breach the SCR and therefore
Calpe’s underwriting risk profile was assessed to be resilient to withstand severe shocks and is within the
Board approved risk appetite.
22
Calpe Insurance Company Limited ● Solvency and Financial Condition Report ● As at 31 December 2016
Process(es) for monitoring the effectiveness of risk mitigation techniques
As a subsidiary of a globally active reinsurance company, Calpe benefits from a robust risk management
framework that oversees Calpe’s risk profile via various governance committees throughout Calpe and
TransRe, the ORSA process, Calpe’s risk register and the stress and scenario testing Calpe performs.
Furthermore, Calpe’s reserves are subject to a quarterly review and TransRe engages an external firm to
undertake an independent review of the adequacy of the group’s reserves.
Prudent person principle
When making investment decisions, Calpe considers the average duration of the assets that it invests in
and ensures there are no correlations between its underwriting profile and its investments.
C.2 Market risk
Market risk is the risk of loss or adverse change in Calpe’s financial situation resulting from changes in the
value of its assets and liabilities caused by the volatility of market prices of assets, liabilities and financial
instruments.
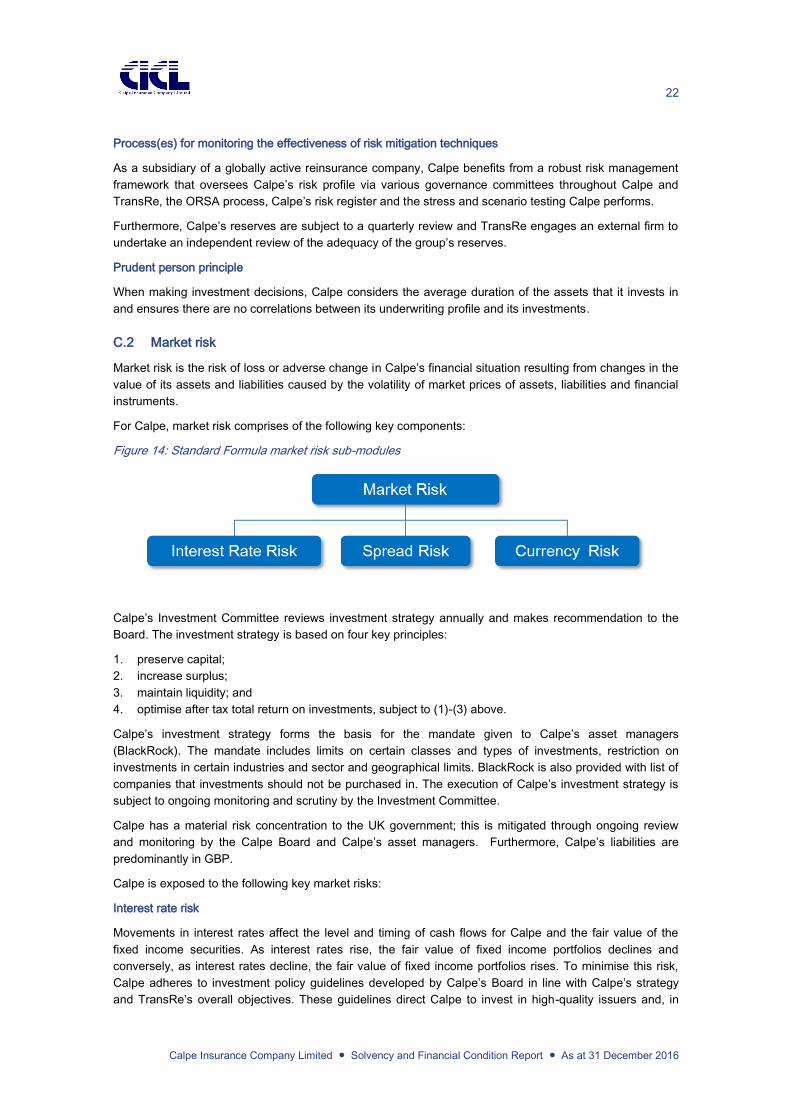
For Calpe, market risk comprises of the following key components:
Figure 14: Standard Formula market risk sub-modules
Calpe’s Investment Committee reviews investment strategy annually and makes recommendation to the
Board. The investment strategy is based on four key principles:
1. preserve capital;
2. increase surplus;
3. maintain liquidity; and
4. optimise after tax total return on investments, subject to (1)-(3) above.
Calpe’s investment strategy forms the basis for the mandate given to Calpe’s asset managers
(BlackRock). The mandate includes limits on certain classes and types of investments, restriction on
investments in certain industries and sector and geographical limits. BlackRock is also provided with list of
companies that investments should not be purchased in. The execution of Calpe’s investment strategy is
subject to ongoing monitoring and scrutiny by the Investment Committee.
Calpe has a material risk concentration to the UK government; this is mitigated through ongoing review
and monitoring by the Calpe Board and Calpe’s asset managers. Furthermore, Calpe’s liabilities are
predominantly in GBP.
Calpe is exposed to the following key market risks:
Interest rate risk
Movements in interest rates affect the level and timing of cash flows for Calpe and the fair value of the
fixed income securities. As interest rates rise, the fair value of fixed income portfolios declines and
conversely, as interest rates decline, the fair value of fixed income portfolios rises. To minimise this risk,
Calpe adheres to investment policy guidelines developed by Calpe’s Board in line with Calpe’s strategy
and TransRe’s overall objectives. These guidelines direct Calpe to invest in high-quality issuers and, in
23
Calpe Insurance Company Limited ● Solvency and Financial Condition Report ● As at 31 December 2016
particular, the strategy is to position its fixed income securities based on its view of future interest rates
and the yield curve, balanced with liquidity requirements.
Spread risk
This relates to the potential financial loss Calpe may suffer arising from a movement in the spread an asset
trades at when compared to a comparable government bond. Calpe is exposed to this as it maintains a
large amount of government or government backed bonds.
Foreign currency risk
Assets backing the liabilities of Calpe are predominantly maintained in GBP, thereby mitigating the
potential impact of foreign exchange and interest rate risk on Calpe’s solvency position
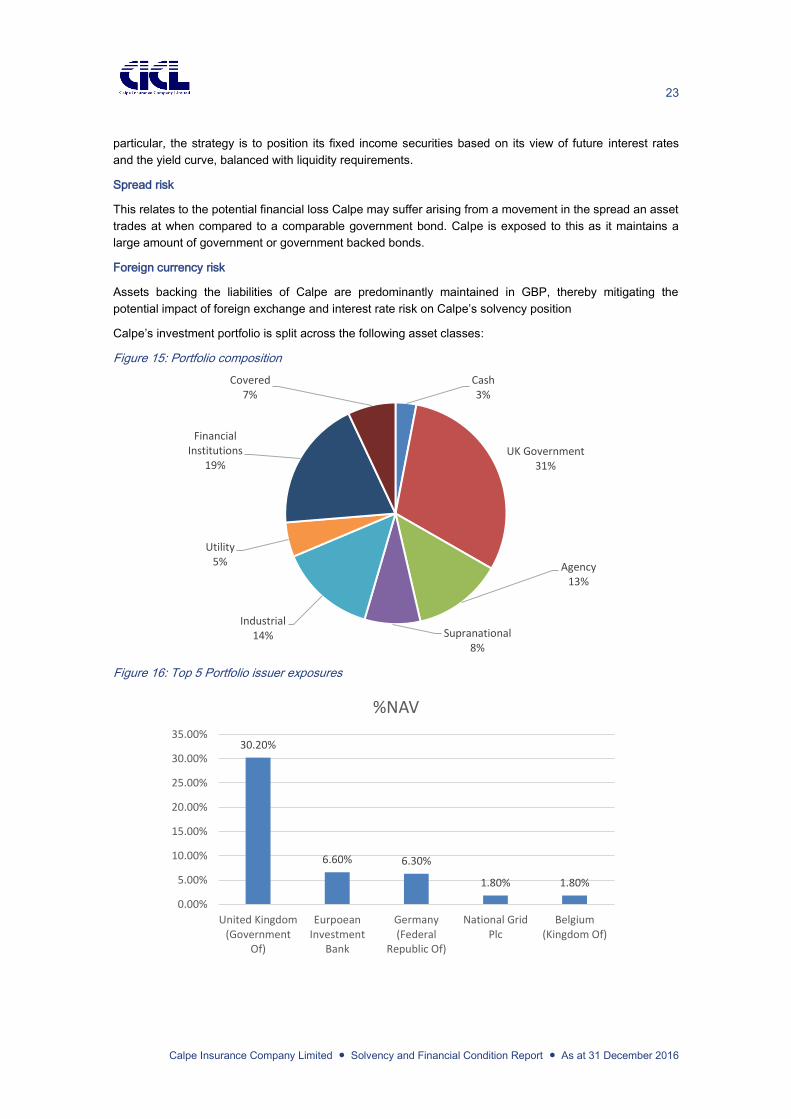
Calpe’s investment portfolio is split across the following asset classes:
Figure 15: Portfolio composition
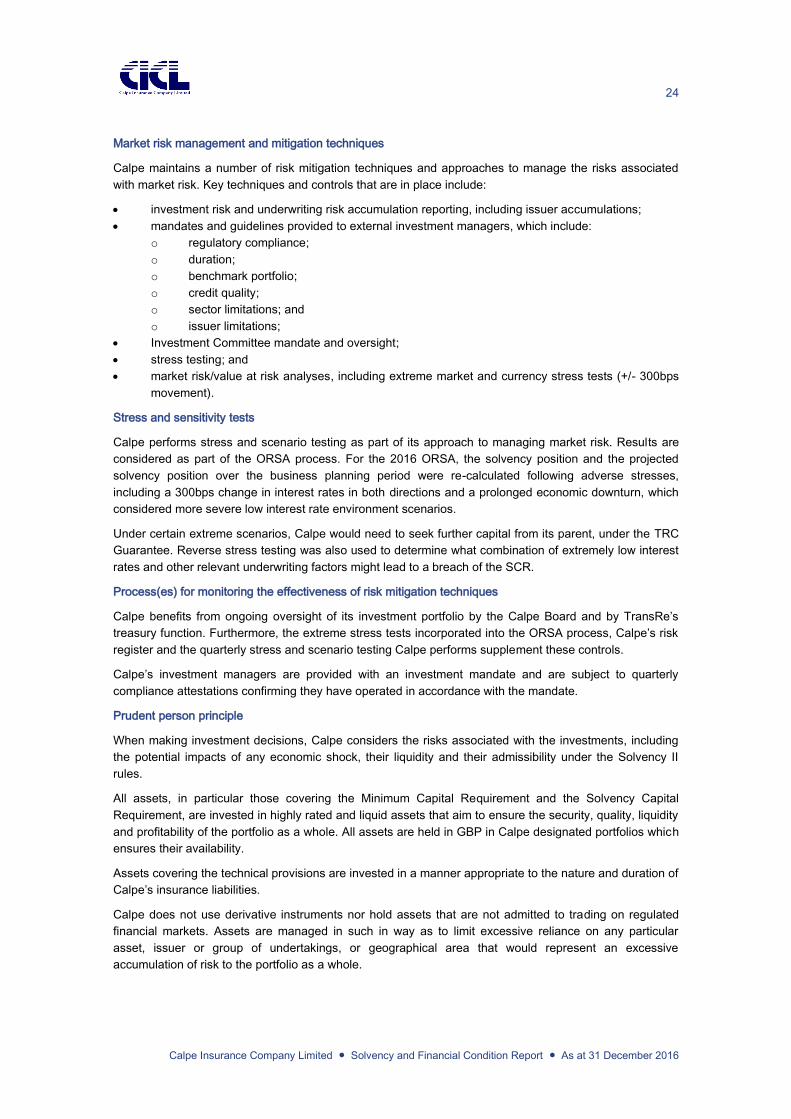
Figure 16: Top 5 Portfolio issuer exposures
Cash 3%
UK Government 31%
Agency 13%
Supranational 8%
Industrial 14%
Utility 5%
Financial Institutions
19%
Covered 7%
30.20%
6.60% 6.30%
1.80% 1.80%
0.00%
5.00%
10.00%
15.00%
20.00%
25.00%
30.00%
35.00%
United Kingdom(Government
Of)
EurpoeanInvestment
Bank
Germany(Federal
Republic Of)
National GridPlc
Belgium(Kingdom Of)
%NAV
24
Calpe Insurance Company Limited ● Solvency and Financial Condition Report ● As at 31 December 2016
Market risk management and mitigation techniques
Calpe maintains a number of risk mitigation techniques and approaches to manage the risks associated
with market risk. Key techniques and controls that are in place include:
investment risk and underwriting risk accumulation reporting, including issuer accumulations;
mandates and guidelines provided to external investment managers, which include:
o regulatory compliance;
o duration;
o benchmark portfolio;
o credit quality;
o sector limitations; and
o issuer limitations;
Investment Committee mandate and oversight;
stress testing; and
market risk/value at risk analyses, including extreme market and currency stress tests (+/- 300bps
movement).
Stress and sensitivity tests
Calpe performs stress and scenario testing as part of its approach to managing market risk. Results are
considered as part of the ORSA process. For the 2016 ORSA, the solvency position and the projected
solvency position over the business planning period were re-calculated following adverse stresses,
including a 300bps change in interest rates in both directions and a prolonged economic downturn, which
considered more severe low interest rate environment scenarios.
Under certain extreme scenarios, Calpe would need to seek further capital from its parent, under the TRC
Guarantee. Reverse stress testing was also used to determine what combination of extremely low interest
rates and other relevant underwriting factors might lead to a breach of the SCR.
Process(es) for monitoring the effectiveness of risk mitigation techniques
Calpe benefits from ongoing oversight of its investment portfolio by the Calpe Board and by TransRe’s
treasury function. Furthermore, the extreme stress tests incorporated into the ORSA process, Calpe’s risk
register and the quarterly stress and scenario testing Calpe performs supplement these controls.
Calpe’s investment managers are provided with an investment mandate and are subject to quarterly
compliance attestations confirming they have operated in accordance with the mandate.
Prudent person principle
When making investment decisions, Calpe considers the risks associated with the investments, including
the potential impacts of any economic shock, their liquidity and their admissibility under the Solvency II
rules.
All assets, in particular those covering the Minimum Capital Requirement and the Solvency Capital
Requirement, are invested in highly rated and liquid assets that aim to ensure the security, quality, liquidity
and profitability of the portfolio as a whole. All assets are held in GBP in Calpe designated portfolios which
ensures their availability.
Assets covering the technical provisions are invested in a manner appropriate to the nature and duration of
Calpe’s insurance liabilities.
Calpe does not use derivative instruments nor hold assets that are not admitted to trading on regulated
financial markets. Assets are managed in such in way as to limit excessive reliance on any particular
asset, issuer or group of undertakings, or geographical area that would represent an excessive
accumulation of risk to the portfolio as a whole.

25
Calpe Insurance Company Limited ● Solvency and Financial Condition Report ● As at 31 December 2016
C.3 Counterparty default (credit risk)
Credit risk is assumed whenever Calpe is exposed to a loss if another party fails to perform its financial
obligations to Calpe, including the failure to perform them in a timely manner. This includes default by
MGAs, brokers, reinsurers, customers, investment counterparties and suppliers. Included within this
category is the management of the credit risk associated with the TRL Quota Share, as described in
Section B1.
MGAs / brokers / intermediaries / reinsurers
Calpe has a credit risk with the co-insurers and MGAs that it generates business through as they represent
the major conduit of business to Calpe. All MGAs, co-insurers, brokers, intermediaries and reinsurers are
subject to ongoing review by a range of fora, which include the Risk & Audit Committee, the Claims,
Underwriting & Reserving Committee, the Investment Committee and ultimately Calpe’s Board.
Prior to transacting with brokers, cedants or ceded reinsurers for the first time a KYC check is carried out.
Retrocessionaires must go through a credit and security assessment which is overseen by TransRe’s
Global Risk Management function (“GRM”) based in New York. Once approved, they are placed on
TransRe’s approved Security List. All prospective markets and proposed programme limits are reviewed
against the Security List prior to placement and in some cases require specific GRM approval prior to
placement. The Security List designates separate short-tail and long-tail programme limits for each
retrocessionaire.
Investment counterparties
Calpe maintains a well-diversified and highly rated investment portfolio. Calpe maintains all its investments
in GBP, with its main investment exposure being to the UK Government and the average credit quality of
its portfolio Aa3/AA-.
Figure 17: Portfolio credit quality
Calpe credit risk management strategies outline the credit rating requirements for its investments.
Adherence with this ensures investments are selected in a way that enables the effective management of
the risk of counterparty default to an acceptable level in line with Calpe and TransRe approved risk
appetite and tolerances. The credit management strategy also takes into account the exposure to credit
spreads.
AAA 23%
AA 40%
A 20%
BBB 14%
Cash 3%
26
Calpe Insurance Company Limited ● Solvency and Financial Condition Report ● As at 31 December 2016
To ensure compliance with rating requirements in Calpe’s credit risk management strategy and to minimise
the risk of counterparty failure arising from external parties, Calpe has established key risk indicators which
are consistent with its investment strategy and investment risk appetite and tolerances. These indicators
take into account, but do not rely solely on, the financial security rating and credit rating assigned by
external rating agencies.
Calpe utilises external credit assessments primarily to:
review the credit quality of assets in their investment portfolios; and
review the credit quality of the retrocessionaires that they utilise.
Calpe and TransRe do not rely solely on one rating agency and give consideration to a range of views
provided by rating agencies as well as its own market knowledge and intelligence provided by professional
investment managers.
TRL Quota Share
The TRL Quota Share is Calpe’s largest credit risk. To mitigate the potential impact in the unlikely event
TRL is unable to meet its contractual obligations, Calpe has the ability to call on the TRC Guarantee to
require its parent to adequately recapitalise Calpe.
Key controls
The controls that aid in mitigating credit risk include:
Board oversight;
Risk & Audit Committee oversight
investment risk reporting;
approved reinsurer lists;
mandates and guidelines provided to external investment managers, which include:
o regulatory compliance;
o duration;
o benchmark portfolio;
o credit quality;
o sector limitations; and
o issuer limitations.
Risk sensitivity for credit risks
Although credit risk is a material risk to Calpe as a result of the quota share arrangement with TRL, the
sensitivity of the solvency ratio to credit defaults or rating downgrades of Calpe’s counterparties has also
been considered.
This demonstrated that Calpe is resilient to a range of events including severe counterparty rating
downgrades or failure of TRL to meet its obligations under the collateralised quota share arrangement.
Process(es) for monitoring the effectiveness of risk mitigation techniques
Calpe is able to leverage its membership of a globally active reinsurance company to continually monitor
and assess the effectiveness of its controls. Calpe’s Risk & Audit Management Committee and the Board
review the risks and effectiveness of controls on a regular basis as well as Calpe’s risk profile. Information
is provided to key forums to enable the monitoring of reinsurance recoverables and excessive counterparty
exposures to be tracked and action taken to enhance existing processes where appropriate.
Furthermore, Calpe benefits from the additional oversight provided by both TransRe’s Counterparty &
Credit Risk Committee and Alleghany’s Reinsurance Committee, which monitor the credit quality of the
retrocessionaires / reinsurers on TransRe’s security list that Calpe follows.
27
Calpe Insurance Company Limited ● Solvency and Financial Condition Report ● As at 31 December 2016
Prudent person principle applied to credit risks
Counterparties are selected by taking into account the credit rating and reputation of each entity. Credit
ratings are used as a way of properly identifying and managing the risk attached to a counterparty and
Calpe ensures only counterparties with a high enough credit rating are used. Calpe does not rely on a
single rating agency, rather seeking to use a number agencies as well as its own analysis.
C.4 Liquidity risk
Liquidity risk arises when Calpe, though solvent, either does not have sufficient financial resources
available to enable it to meet its obligations as they fall due, or can secure them only at excessive cost.
Calpe sees liquidity risk as the management of risk arising from short term cash flows, rather than the risk
arising from longer-term matching of assets and liabilities. Liquidity risk is considered by Calpe’s
Investment Committee and Board.
Key controls
Key controls that aid in mitigating this risk include:
investment risk and underwriting risk accumulation reporting;
cashflow forecasting;
asset/liability assessment performed every quarter;
quarterly reserving exercise;
quarterly balance sheet.
Risk sensitivity for liquidity risk
Calpe has carried out liquidity risk stress testing as part of its ORSA process with the results reviewed by
the Board. Calpe does not consider liquidity risk to be a material risk.
Process for monitoring the effectiveness of risk mitigation techniques
Calpe has established a liquidity risk framework which includes the establishment of a liquidity risk
appetite. Adherence to the appetite is reviewed with Calpe reviewing its ability to meet its short and
medium term financial commitments in a timely manner in both normal and stressed conditions.
Prudent person principle as applied to liquidity risks
The investment assets are prudently invested taking into account the liquidity requirements of the business
and the nature and timing of the insurance liabilities. Calpe manages its liquidity risk by maintaining a
diversified highly liquid investment portfolio.
Expected profit included in future premiums (“EPIFP”)
The EPIFP as at 31 December 2016 is £629k which includes expected profit commissions and reinsurance
recoveries.
C.5 Operational risk
Operational risk is the risk of loss resulting from inadequate or failed internal processes, people and
systems, or from external events. Operational risk is diverse in nature and permeates all business activities
but remains a distinct form of risk in its own right. Operational risk within Calpe has been divided into the
following key risk areas:
regulatory and legal risks - the risk of legal or regulatory sanctions or loss caused by a failure to
comply with applicable laws, regulations, internal policy and standards of best practice;
financial crime, including internal and external fraud – this is the risk that the firm might be used to
further financial crime;
financial & accounting – these are the risks associated with financial reporting and integrity of the
financial information;
28
Calpe Insurance Company Limited ● Solvency and Financial Condition Report ● As at 31 December 2016
people risk – this is the risk that people do not follow Calpe's procedures, practices and/or rules,
thus deviating from expected behaviour in a way that could damage Calpe;
business continuity management – the risk associated with the failure to appropriately manage
unforeseen events;
processing failures, including IT system failures; the risks associated with IT systems;
outsourcing; failures relating to the outsourcing of key activities; and
external events and other changes; failure to react to changes in the external business
environment.
Calpe’s directors identify the key risks, causes and consequences together with relevant mitigating
controls, within their function/span of control, on an ongoing basis.
Each risk identified is assessed and scored using a standard matrix, on both an inherent basis and a
Calpe maintains an Operational Risk policy that sets out Calpe’s approach to mitigating risks arising from
Operational Risks.
Key controls
Key controls that aid in mitigating this risk include:
Risk & Audit Committee oversight;
quarterly reviews by risk owners assessing the effectiveness of mitigating controls;
policies and procedures, including the Group’s Code of Conduct, business continuity plans and
succession planning;
operational risk appetites;
escalation procedures;
data quality;
compliance procedures; monitoring and oversight;
staff training, oversight and appraisals;
disaster recovery plan
service level agreements;
anti-bribery and corruption procedures; and
underwriting audits performed.
Risk sensitivities for operational risk
Calpe does not have any material concentrations to operational risk.
On an ongoing basis, Calpe carries out stress and scenario testing as part of its approach to managing
operational risk. Results are presented quarterly at the Calpe Risk & Audit Committee and considered as
part of the ORSA process.
For the 2016 ORSA, the solvency position and the projected solvency position over the business planning
period were re-calculated following adverse operational risk stresses. Under all of these scenarios, the
analysis indicated that Calpe was able to withstand these events without breaching its SCR.
Process for monitoring the effectiveness of risk mitigation techniques
Calpe and TransRe have established an operational risk framework that:
monitors and records key risks facing Calpe, including their mitigating controls and their
effectiveness;
the environment Calpe operates; and
emerging risks and the mitigating steps taken to monitor or address them.
The framework is supported by policies and procedures and a strong corporate culture that encourages
early notification of operational events or losses. This enables the business to learn from events or near
losses and to continually enhance its framework.

29
Calpe Insurance Company Limited ● Solvency and Financial Condition Report ● As at 31 December 2016
C.6 Other material risks
Franchise Value: Calpe recognises that its long-term success depends on its relationship with clients,
brokers, rating agencies, regulators and capital providers and the TransRe brand. Consequently, Calpe
and TransRe will not accept risks, both underwriting and non-underwriting, that may materially impair or
impact the reputation of Calpe or TransRe.
Group Risk: As a wholly owned subsidiary of a large international group, there is a risk Calpe could be
adversely affected by the actions of another company within the group. Should such an event arise that
Calpe is able to rely on its own unencumbered capital.
Brexit: Details of Brexit and the principal risks to Calpe arising from it are included in Section A5.
Emerging risks: On an ongoing basis, TransRe and Calpe undertake horizon scanning with a view to
identifying new and emerging risks. Annually, TransRe holds a Global Emerging Risk Forum in New York
with senior level executives and employees from across the world attending. Where new and emerging
risks are identified, these are tracked and reported on at key fora. This ensures Calpe is able to react
quickly should the environment it operates in change.
C.7 Any other information
Calpe does not consider there is any other material information to disclose on its risk profile.
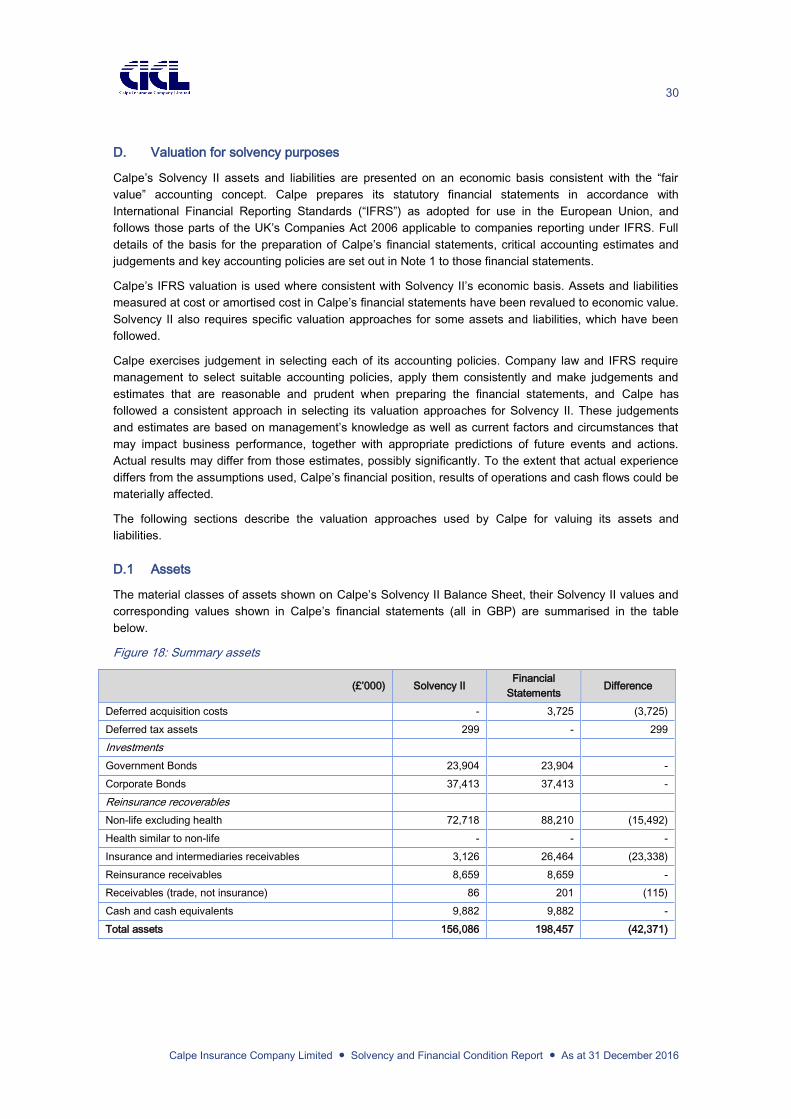
30
Calpe Insurance Company Limited ● Solvency and Financial Condition Report ● As at 31 December 2016
D. Valuation for solvency purposes
Calpe’s Solvency II assets and liabilities are presented on an economic basis consistent with the “fair
value” accounting concept. Calpe prepares its statutory financial statements in accordance with
International Financial Reporting Standards (“IFRS”) as adopted for use in the European Union, and
follows those parts of the UK’s Companies Act 2006 applicable to companies reporting under IFRS. Full
details of the basis for the preparation of Calpe’s financial statements, critical accounting estimates and
judgements and key accounting policies are set out in Note 1 to those financial statements.
Calpe’s IFRS valuation is used where consistent with Solvency II’s economic basis. Assets and liabilities
measured at cost or amortised cost in Calpe’s financial statements have been revalued to economic value.
Solvency II also requires specific valuation approaches for some assets and liabilities, which have been
followed.
Calpe exercises judgement in selecting each of its accounting policies. Company law and IFRS require
management to select suitable accounting policies, apply them consistently and make judgements and
estimates that are reasonable and prudent when preparing the financial statements, and Calpe has
followed a consistent approach in selecting its valuation approaches for Solvency II. These judgements
and estimates are based on management’s knowledge as well as current factors and circumstances that
may impact business performance, together with appropriate predictions of future events and actions.
Actual results may differ from those estimates, possibly significantly. To the extent that actual experience
differs from the assumptions used, Calpe’s financial position, results of operations and cash flows could be
materially affected.
The following sections describe the valuation approaches used by Calpe for valuing its assets and
liabilities.
D.1 Assets
The material classes of assets shown on Calpe’s Solvency II Balance Sheet, their Solvency II values and
corresponding values shown in Calpe’s financial statements (all in GBP) are summarised in the table
below.
Figure 18: Summary assets
(£’000) Solvency II Financial
Statements Difference
Deferred acquisition costs - 3,725 (3,725)
Deferred tax assets 299 - 299
Investments
Government Bonds 23,904 23,904 -
Corporate Bonds 37,413 37,413 -
Reinsurance recoverables
Non-life excluding health 72,718 88,210 (15,492)
Health similar to non-life - - -
Insurance and intermediaries receivables 3,126 26,464 (23,338)
Reinsurance receivables 8,659 8,659 -
Receivables (trade, not insurance) 86 201 (115)
Cash and cash equivalents 9,882 9,882 -
Total assets 156,086 198,457 (42,371)

31
Calpe Insurance Company Limited ● Solvency and Financial Condition Report ● As at 31 December 2016
The following sections provide further details on the specific valuation policies that Calpe has applied to
produce its Solvency II balance sheet.
Financial instruments
Recognition and derecognition of investments
For a background to Calpe’s approach to recognition and derecognition of investments see the 2016
Financial Statements.
Fair value of investments
For a background to Calpe’s approach to fair value of investments see the 2016 Financial Statements.
Impairment
For a background to Calpe’s approach to impairment see the 2016 Financial Statements.
Valuation differences between the Solvency II and IFRS balance sheets
Solvency II requires a hierarchy of valuation methods to be applied to value assets and liabilities on the
Solvency II balance sheet, as set out below:
1. The use of quoted market prices in active markets for the same assets or liabilities.
2. Where the use of quoted market prices in active markets for the same assets or liabilities is not
possible, quoted market prices in active markets for similar assets and liabilities are used, with
adjustments made to reflect factors specific to the asset or liability.
3. Where the criteria above are not satisfied, alternative valuation methods are used, which make
maximum use of relevant market inputs (adjusted for factors specific to the asset or liability under
valuation). To the extent that observable inputs are not available, use is made of unobservable inputs
reflecting the assumptions that market participants would use (including assumptions about risk in the
valuation technique).
Calpe considers its policy on the fair value of investments to be consistent with the hierarchy of valuation
methods required for Solvency II. Accordingly, the valuation policy on fair values is applied consistently
between Calpe’s Solvency II reporting and its statutory financial reporting. Calpe’s investment portfolio as
at 31 December 2016 includes only investments that are valued at fair value. There are accordingly no
differences in valuation relating to financial investments between Calpe’s Solvency II and IFRS balance
sheets, with the exception that the value of investments in the Solvency II balance sheet includes interest
accrued since the last coupon payment, compared to the presentation in Calpe’s financial statements
where it is accounted for separately as accrued interest.
Calpe defines fair value as the price that would be received upon the sale of an asset or paid to transfer a
liability in an orderly transaction between willing, able and knowledgeable market participants as at the
measurement date. As part of Calpe’s framework for measuring fair value, financial instruments are
classified into a three-level hierarchy that is consistent with the Solvency II hierarchy described above.
Fair value sources and use of pricing vendors
Calpe’s methodology for the valuation of investments is to use ICE Services (“ICE”). Calpe’s other sources
for fair values include its investment manager BlackRock.
Although Calpe outsources the portfolio valuation function to pricing vendors or relies on investment
managers for valuations in certain instances, Calpe is responsible for ensuring that the supporting
methodologies and assumptions employed by pricing vendors are consistent with and meet the objectives
of fair value determination.
Reinsurance recoverables
For the differences in the valuation methodology between IFRS and Solvency II see Section D2.

32
Calpe Insurance Company Limited ● Solvency and Financial Condition Report ● As at 31 December 2016
(Re)insurance and intermediaries receivable
Receivables and payables are recognised when due. These include amounts due to and from agents,
brokers and insurance contract holders. Receivables and payables are recognised at the amount expected
to be received or paid when due. Due to the short term nature of Calpe’s (re)insurance receivables and
payables, amounts are not discounted.
The presentation of (re)insurance receivables and payables on the Solvency II balance sheet differs from
Calpe’s statutory financial statements, since (re)insurance receivables and payables for financial reporting
purposes include premiums and claims which are included in Technical Provisions in the Solvency II
balance sheet.
Other receivables (trade not insurance)
The valuation and presentation of Calpe’s other receivables and payables is, in the Solvency II balance
sheet, is consistent with the treatment for Calpe’s external financial reporting.
Cash and cash equivalents
For a background to Calpe’s approach to cash and cash equivalents see page [XX] of the 2016 Financial
Statements.
Foreign currency transactions and balances
Calpe presents its financial statements in GBP, which is Calpe’s functional currency. Calpe applies a
consistent policy for translating transactions and balances in currencies other than the relevant currency of
presentation between its financial statements and Solvency II reporting. Where necessary, ground up
recalculations for each reporting currency are performed for items with multiple underlying exchange rates
(for example, for deferred acquisition costs).
For further background to Calpe’s approach to foreign currency transactions and balances see the 2016
Financial Statements.
Translation to functional currency
For a background to Calpe’s approach to translation to functional currency see the 2016 Financial
Statements.
Deferred tax
Deferred tax balances (other than in respect of the carry forward of unused tax credits and unused tax
losses) are determined by reference to the difference between the Solvency II balance sheet and the
values ascribed for tax purposes.
A positive value is only ascribed to deferred tax assets where it is probable that future taxable profits will
lead to the realisation of that deferred tax asset. This assessment takes into account time limits that apply
to the carry forward of unused tax losses or credits.
Deferred tax balances are recognised and valued in relation to all assets and liabilities that are recognised
for solvency or tax purposes. Deferred tax balances are not discounted.
Deferred tax is recognised and valued on a basis consistent with treatment under IFRS. For example,
under IFRS:
all temporary differences between the assets and liabilities in the statement of financial position and
their tax base are included within the calculation; and
deferred tax assets or liabilities are accounted for using the balance sheet liability method and
assets are recognised to the extent that realising the related tax benefit through future taxable
profits is likely.
However for Solvency II purposes, the recognition and valuation of deferred tax assets or liabilities is
carried out by reference to the Solvency II balance sheet rather than the accounting basis.
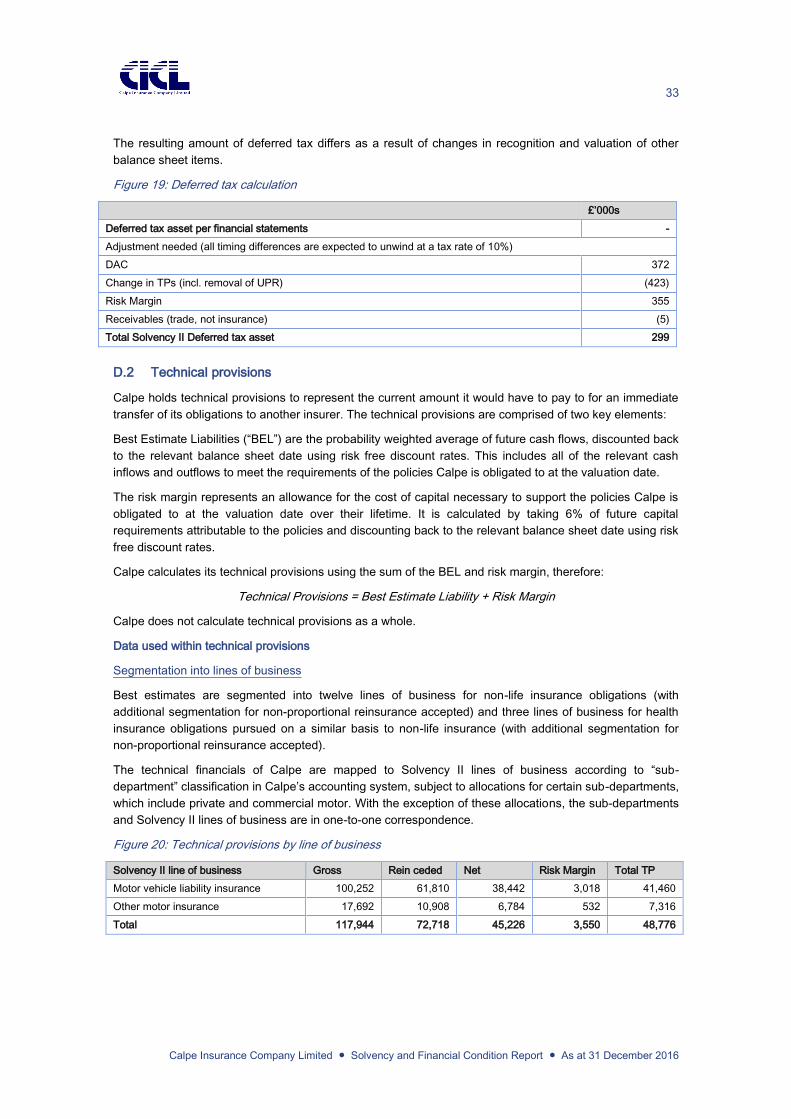
33
Calpe Insurance Company Limited ● Solvency and Financial Condition Report ● As at 31 December 2016
The resulting amount of deferred tax differs as a result of changes in recognition and valuation of other
balance sheet items.
Figure 19: Deferred tax calculation
£’000s
Deferred tax asset per financial statements -
Adjustment needed (all timing differences are expected to unwind at a tax rate of 10%)
DAC 372
Change in TPs (incl. removal of UPR) (423)
Risk Margin 355
Receivables (trade, not insurance) (5)
Total Solvency II Deferred tax asset 299
D.2 Technical provisions
Calpe holds technical provisions to represent the current amount it would have to pay to for an immediate
transfer of its obligations to another insurer. The technical provisions are comprised of two key elements:
Best Estimate Liabilities (“BEL”) are the probability weighted average of future cash flows, discounted back
to the relevant balance sheet date using risk free discount rates. This includes all of the relevant cash
inflows and outflows to meet the requirements of the policies Calpe is obligated to at the valuation date.
The risk margin represents an allowance for the cost of capital necessary to support the policies Calpe is
obligated to at the valuation date over their lifetime. It is calculated by taking 6% of future capital
requirements attributable to the policies and discounting back to the relevant balance sheet date using risk
free discount rates.
Calpe calculates its technical provisions using the sum of the BEL and risk margin, therefore:
Technical Provisions = Best Estimate Liability + Risk Margin
Calpe does not calculate technical provisions as a whole.
Data used within technical provisions
Segmentation into lines of business
Best estimates are segmented into twelve lines of business for non-life insurance obligations (with
additional segmentation for non-proportional reinsurance accepted) and three lines of business for health
insurance obligations pursued on a similar basis to non-life insurance (with additional segmentation for
non-proportional reinsurance accepted).
The technical financials of Calpe are mapped to Solvency II lines of business according to “sub-
department” classification in Calpe’s accounting system, subject to allocations for certain sub-departments,
which include private and commercial motor. With the exception of these allocations, the sub-departments
and Solvency II lines of business are in one-to-one correspondence.
Figure 20: Technical provisions by line of business
Solvency II line of business Gross Rein ceded Net Risk Margin Total TP
Motor vehicle liability insurance 100,252 61,810 38,442 3,018 41,460
Other motor insurance 17,692 10,908 6,784 532 7,316
Total 117,944 72,718 45,226 3,550 48,776

34
Calpe Insurance Company Limited ● Solvency and Financial Condition Report ● As at 31 December 2016
Technical provisions bases, methodologies and key assumptions
Basis
Calpe uses the IFRS financial reporting framework as the starting basis for determining the Solvency II
technical provisions.
The following sections outline the key methodologies and assumptions in determining the technical
provisions. Where relevant, adjustments to the IFRS basis to move to the Solvency II basis are highlighted.
Figure 21: IFRS to Solvency II reconciliation
Solvency II Line of Business Assumed Ceded Net
IFRS Technical Provisions 99,165 101 99,065
Deferred Acquisition Costs (927) - (927)
Contingent Commission Costs 110 - 110
Reserving Margins (5,897) (10) (5,886)
Future Premiums & Acquisition Costs (4,447) - (4,447)
Future Other Expenses 2,214 - 2,214
Legally Obliged Unincepted Business (7,525) (374) (7,151)
Discounting (540) (-) (540)
Counterparty Default - (-) -
Solvency II Best Estimate 82,154 (283) 82,438
Risk Margin 9,400 - 9,400
Solvency II Technical Provisions 91,554 (283) 91,838
Best estimate liability
The BEL is calculated as the sum of the following two components:
Claims provision
Calpe holds a claims provision that relates to claims events that already incurred, regardless of whether
these claims have been reported or not. The provision includes all cash flows associated with all future
benefits, expenses and premiums related to the claims events. Calpe considers the expected incidence
and cost of future claims, including infrequent, high severity claims and latent claims. The best estimate
claims provision is calculated as:
the best estimate of outstanding losses, and any expenses in loss-adjustment (Loss Adjustment
Expenses, or “LAE”),
plus the best estimate of incurred-but-not-reported claims (“IBNR”) based on earned premiums,
plus the best estimate of unpaid non-contingent acquisition costs that have been incurred,
plus the best estimate of unpaid contingent commission on earned premiums,
plus the best estimate of unpaid other expenses that have been incurred,
less the best estimate of unpaid premiums that have been earned.
Further information on the calculation of these items is discussed in the following sections.
Premiums provision
Calpe holds a premium provision for events which may happen in the future that fall within the contract
boundary. The provision includes all cash flows associated with all future premiums, claims and benefits
related to these events. Calpe considers the expected incidence and cost of future claims, including
infrequent, high severity claims and latent claims. The best estimate premium provision is calculated as:
35
Calpe Insurance Company Limited ● Solvency and Financial Condition Report ● As at 31 December 2016
the best estimate of IBNR claims based on unearned premiums,
plus the best estimate of unpaid non-contingent acquisition costs that are deferred,
plus the best estimate of unpaid contingent acquisition costs based on unearned premiums,
plus the best estimate of unpaid other expenses based on unearned premiums,
less the best estimate of unpaid premiums that are unearned.
Further information on the calculation of these items is discussed in the following sections.
Methodologies for loss reserves and IBNR
The methods employed to estimate loss reserves include the following:
Paid loss development, incurred loss development methods
In the loss development methods, paid and incurred losses are projected to the time period by which the
liabilities are extinguished (known as the ‘ultimate’ time period) by applying appropriate development
factors to the inception-to-date paid and incurred losses to date.
Paid Bornhuetter-Ferguson (“BF”) and incurred BF methods
In the Bornhuetter Ferguson methods, estimates of unpaid and unreported losses based on earned
premiums (on an ultimate basis) are calculated by multiplying earned or ultimate premiums for each
contract by an expected loss ratio (“ELR”) and an estimated percentage of unpaid or unreported losses.
The percentages of unpaid or unreported losses are derived from the loss development factors described
below.
In establishing reserves for IBNR losses, three key actuarial judgements are used to project losses:
Loss development factors (“LDF”) — these are used to arrive at the ultimate amount of losses
incurred for each underwriting year based on reported loss information. These factors, which are
calculated initially based on historical loss development patterns (i.e. the emergence of reported
losses over time relative to the ultimate losses to be paid), may then be adjusted for current trends.
Loss trend factors (“LTF”) — these typically focus on any underlying trends which may progress
through the projection into the future, such as provisions for inflation, including social inflation
(awards by judges and juries which increase progressively in size at a rate exceeding that of
general inflation), and trends in court interpretations of coverage; and
Expected loss ratios (“ELR”) — for the latest underwriting years generally reflect the ELRs from
prior underwriting years adjusted for LTFs, as well as the impact of changes in rating strength and
other quantifiable factors.
These methods yield an indication of the ultimate losses for each underwriting year. The IBNR reserve is
then determined by subtracting the reported losses from the indicated ultimate losses.
Estimates of reserves for IBNR claims take into account a number of assumptions with respect to factors
that will affect ultimate losses. The techniques Calpe uses (described above) are employed to estimate
ultimate losses, including the delay between the claim being reported to the (co)insurer, and the insurer
reporting the claim to Calpe. Expert judgement is employed to select the most appropriate method,
particularly when the delays previously identified within the data fluctuate between claims.
During the loss settlement period, additional facts regarding individual claims and trends will emerge. As
these facts and trends emerge it usually becomes necessary to refine and adjust the loss reserves upward
or downward; and even then the ultimate net liability calculated by Calpe may be materially different from
the original estimates. There is potential for significant variation in the development of loss reserves when
actual costs differ from those costs implied by the use of the assumptions employed in the process of
setting reserves.

36
Calpe Insurance Company Limited ● Solvency and Financial Condition Report ● As at 31 December 2016
Methodologies for expired and unexpired periods of coverage
With respect to expired periods of coverage, IBNR amounts calculated under IFRS are intended to reflect
undiscounted best estimates of unpaid and unreported obligations, without margins for prudence.
With respect to unexpired periods of coverage, the valuation of technical provisions under Solvency II
includes future cash flows with respect to premiums, losses (including claims management costs) and
acquisition costs. Consequently, differences arise between the valuation of technical provisions in the
IFRS financial statements of Calpe and the corresponding valuation of technical provisions for Solvency II.
The estimation of unpaid and unreported losses arising from unexpired periods of coverage is based on
the same principles underlying the corresponding calculations for expired periods of coverage. Calpe
estimates ultimate losses for each contract by multiplying:
ultimate premiums calculated for each contract; by
the expected loss ratio; and
an estimated percentage of unpaid or unreported losses.
The percentages of unpaid or unreported losses are derived from loss development factors and the
indicated IBNR reserve is then determined by subtracting the reported losses from the indicated ultimate
losses.
Future premiums & acquisition costs
Under IFRS, unpaid premiums and acquisition costs are shown separately on the balance sheet at the
accounting date as insurance and reinsurance receivables and payables.
Under Solvency II, the cash flows in respect of future claims are reduced by the amount of expected future
premium cash inflows and increased by the amount of expected future acquisition costs cash outflows.
Future other expenses
Under IFRS, unpaid other income or expenses are shown separately on the balance sheet at the
accounting date as other receivables or payables as appropriate.
Under Solvency II, technical provisions are increased by the amount of expected future cash outflows in
respect of other expenses. Calpe estimates the reserves for other expenses, as:
other acquisition costs;
claims management costs;
general administration costs;
overhead costs; and
investment management costs.
Undiscounted best estimates of unpaid other expenses are then allocated by contract and Solvency II line
of business and discounted back to the valuation date using the risk free rates.
The starting point for the calculation of the future other expense cashflows are historical data for the
payment of other expenses by calendar period. Calpe calculates paid claims management costs and
investment management costs, expressed as percentages of paid and incurred losses, and paid other
acquisition costs, general administration costs and overhead costs, expressed as percentages of linear
combinations of paid and written premiums. Best estimates of unreported claims management costs and
investment management costs are then calculated by multiplying the relevant percentages by linear
combinations of outstanding and IBNR losses. Best estimates of unreported other acquisition costs,
general administration costs and overhead costs are calculated by multiplying the relevant percentages by
linear combinations of accrued and unreported premiums.

37
Calpe Insurance Company Limited ● Solvency and Financial Condition Report ● As at 31 December 2016
Events not in data
Calpe accounts for events not in data (“ENIDs”) using a scenario approach, based on the business profile
and data available.
Calpe, TRL and the London Branch of TRC have more than 22 years of credible claims experience which
is used to derive assumptions. This historical claims experience contains many significant natural and
man-made catastrophe losses.
Natural and man-made catastrophe scenarios, with associated severities and return periods, are
established using expert judgement through discussions with underwriters and the catastrophe modelling
team.
These scenarios, along with the historic data, are used in the selection of actuarial assumptions underlying
the calculation of technical provisions for both solvency purposes and for the valuation in financial
statements. As a result, ENIDs are implicitly included in underlying reserving patterns.
The specific ENID claim and premium provisions are split out using calculated factors for each line of
business.
Discounting
The discounting of technical provisions is not required under IFRS.
Under Solvency II, Calpe calculates best estimates separately for obligations in different currencies using
the relevant risk-free term structures of interest rates prescribed by EIOPA. The set of currencies for which
spot discount curves are provided by EIOPA form a subset of the complete table of currencies defined in
the accounting system of Calpe. Where, for a given currency, spot discount curves are not provided by
EIOPA, the spot discount curve for US dollars is used by default or, if deemed material to the calculation of
fair values, the relevant term structure determined according to the methodology specified in the Solvency
II technical specifications. The allocation of unpaid cash flows to different currencies with respect to
premiums, losses, acquisition costs and other expenses is estimated for each contract based on
corresponding historical allocations of inception-to-date cash flows and accruals, and other relevant
information. Development factors of paid premiums, losses and acquisition costs are used to separate
expected future cash flows into incremental amounts in future calendar periods. Incremental expected
cash flows are then discounted at the risk-free discount rate applicable for the relevant maturity at the
accounting date. Discounting estimates of unpaid other expenses for the time value of money is based on
development patterns of paid premiums for other acquisition costs, general administration costs and
overheads; and paid losses for claims management costs and investment management costs.
Counterparty default
Calpe does not adjust the technical provisions calculated under IFRS for potential counterparty default.
Under Solvency II, the calculations of technical provisions are adjusted to reflect the potential for default
events, which are defined to occur whenever counterparties fail to meet all of their obligations in full,
whether arising from insolvency or dispute. The adjustment, which is given by the expected present value
of the change in cash flows underlying the amounts recoverable, is calculated by multiplying:
Probability of default x Loss given default
These are defined as follows:
Probability of default — cash flows are adjusted to reflect the likelihood of default at different time
periods, also considering that cumulatively, counterparties are more likely to default as time moves
on. The distribution of the time of default is assumed to have an exponential distribution, calibrated
according to credit quality and the corresponding probability of default over one year. The derivation
of credit quality is based on official credit ratings corresponding to those attributed by a commercial
rating agency such as A.M Best, S&P, Moody’s and Fitch, where such credit ratings are available.
38
Calpe Insurance Company Limited ● Solvency and Financial Condition Report ● As at 31 December 2016
Where more than one official credit rating is available for a counterparty, the second-highest credit
quality step is used.
Loss given default — this is the impact of the default. Unless reliable estimates of these losses are
available, the adjustment is calculated using an assumed loss of 50%. Calpe does not adjust the
amounts recoverable to allow for deposits or collateralisation arrangements.
Risk margin
The risk margin is calculated as the present value of future SCRs, multiplied by the prescribed rate for the
cost of capital of 6% per annum.
The following risks from the SCR are projected into the future:
insurance risk (both reserve and premium risk) with respect to obligated business, whether incepted
or not;
counterparty default risk;
operational risk; and
unhedgeable or unavoidable market risk.
The 6% cost of capital is determined by Solvency II regulation. The cost of capital at each time period is
discounted back to the valuation date using the risk free rate.
Reinsurance arrangements within the technical provisions
Under Solvency II, Calpe reflects the value of reinsurance agreements where risk is ceded to a third party
(which includes consideration of the counterparty default calculations above) within the technical
provisions. This allows Calpe to denote a technical provision figure net of reinsurance.
Existing reinsurance
Calpe employs both proportional and non-proportional ceded reinsurance.
With respect to proportional reinsurance, outwards reinsurance premiums and recoveries are calculated
and included on the basis of correspondence, i.e. future premiums are included only to the extent that any
associated liabilities are also included in the technical provisions. If a contractual liability does not exist,
then the associated future premium cash flows are not taken into account within the valuation of technical
provisions under Solvency II.
With respect to existing non-proportional retrocession, the calculation of reinsurance recoverables is based
on the principle of correspondence, but future premiums are subject to contractual minimums.
Future reinsurance purchases
To the extent that Calpe has a history of renewing outwards non-proportional reinsurance, the purchase of
future outwards reinsurance is assumed in the assessment of technical provisions under Solvency II. In
particular, expected cash flows arising from future reinsurance that will cover existing inwards contracts but
has not yet been purchased at the valuation date are included in the valuation of the best estimate
according to the principle of correspondence.
Uncertainty within the technical provisions
Calpe writes insurance coverages whose major risk factors materially impact the variability of the loss
reserves. Calpe’s portfolio has exposure to potentially long-tail motor liabilities (such as Payment
Protection Orders) which could identically have volatile results.
At the primary insurance level there are significant risk factors which contribute to the variability and
unpredictability of loss cost trends and loss emergence patterns. Calpe faces additional risk factors arising
from its dependence on the claims reserving and reporting practices of its co-insurers, which vary greatly
by size, specialisation, degree of sophistication, and country of operation, and are subject to change
without notice.

39
Calpe Insurance Company Limited ● Solvency and Financial Condition Report ● As at 31 December 2016
Given the composition of Calpe’s business, which includes exposure to a small number of motor portfolios,
the loss cost trends are difficult to assess.
The variability in the loss cost trends, the difficulty inherent in estimating loss development patterns and tail
factors for low frequency/high severity claims all contribute to the risk of adverse deviation in Calpe’s loss
reserves.
Calpe assesses continually the reserve adequacy of IBNR in light of the following factors:
current levels of reserves for reported claims and expectations with respect to reporting lags;;
catastrophe events;
historical data;
legal developments; and
economic conditions, including the effects of inflation.
The actuarial methodologies employed to calculate loss and IBNR development incorporates the inherent
lag from the time claims occur to when they are reported to an insurer and to when the insurer reports the
claims to their reinsurers. Certain actuarial methodologies may be more appropriate than others in
instances where this lag may not be consistent from period to period. Consequently, additional actuarial
judgement is employed in the selection of methodologies to best incorporate that potential impact.
Information gathered through underwriting and claims audits is also considered.
The estimation of Calpe's loss reserves is made more difficult and subjective in view of changing legal and
economic environments that impact the development of claims. Such factors, both internal and external,
which contribute to the variability and unpredictability of loss costs, include:
trends relating to jury awards;
social trends;
medical inflation;
worldwide economic conditions;
tort reforms;
court interpretations of coverages;
the regulatory environment;
underlying policy pricing;
terms and conditions; and
claims handling.
Consequently, quantitative techniques are frequently supplemented by subjective considerations and
expert judgement. In addition, Calpe is mindful that trends that have affected development of liabilities in
the past may not necessarily occur or affect liability development to the same degree in the future. Owing
to the inherent uncertainties in the process of establishing these liabilities, the actual ultimate loss from a
claim is likely to differ, perhaps materially, from the liability initially recorded.
The uncertainty inherent in estimating IBNR relating to unexpired periods of coverage is exacerbated by
the application of the same underlying valuation techniques to the calculation of technical provisions in
respect of unexpired periods of coverage.
With respect to unexpired periods of coverage, Calpe’s loss reserves include exposure to extreme or
exceptional events, both natural and man-made. Unexpired periods of coverage relating to the motor
contracts of Calpe cover unpredictable events, including exposures to natural catastrophes such as:
catastrophic hurricanes;
windstorms;
tornadoes;
earthquakes;
floods; and
other natural disasters;

40
Calpe Insurance Company Limited ● Solvency and Financial Condition Report ● As at 31 December 2016
and man-made catastrophes such as:
fires;
industrial explosions;
riots; and
other man-made disasters, including those that may result from terrorist activity.
Management expects that the loss experience of Calpe will include infrequent events of great severity from
time to time and the occurrence of losses from such events could cause some volatility in the financial
results of Calpe.
The frequency and severity of catastrophe losses are inherently unpredictable. Insured losses arising out
of a single occurrence have the potential to impact a wide range of lines of business.
The severity of catastrophe losses is subject to a high level of uncertainty arising out of extremely complex
causation and coverage issues, which can include:
attribution of losses to different perils;
potential legal and regulatory developments related to losses; and
inflation in repair costs owing to the limited availability of labour and materials after the occurrence
of catastrophic events.
With respect to discounting for the time value of money, the difficulty inherent in estimating the currency
and timing of future cash flows, including tail factors for long-tail classes of business, contribute to the risk
of adverse deviation in the technical provisions of Calpe.
Exclusions from technical provisions
There are a number of additional aspects of the Solvency II regime that firms can apply for.
Matching adjustment
Calpe does not use the matching adjustment within the calculation of technical provisions.
Volatility adjustment
The volatility adjustment to risk free rates is not used by Calpe in the calculation of technical provisions.
Transitional measures to technical provisions (TMTP)
Calpe does not apply any transitional arrangements to the Solvency II balance sheet.
D.3 Other liabilities
The material classes of other liabilities shown on Calpe’s Solvency II balance sheet, their Solvency II
values and corresponding values shown in the 2016 Financial Statements are summarised in the table
below.
Figure 22: Other liabilities – IFRS & Solvency II reconciliation (£000)
£’000s Solvency II Financial
Statements Difference
Insurance and intermediaries payables 981 981 -
Reinsurance payables 9,363 24,474 (15,111)
Payables (trade, not insurance) 130 300 (170)
Total other liabilities 10,474 25,755 (15,281)
Total technical provisions 121,493 145,893 (24,400)
Total liabilities 131,967 171,648 (39,681)
The following sections provide further details on the specific valuation policies that Calpe has applied to
produce its Solvency II balance sheet.

41
Calpe Insurance Company Limited ● Solvency and Financial Condition Report ● As at 31 December 2016
(Re)insurance and intermediaries payable
Please see Section D1 (Re)insurance and Intermediaries Receivable.
Other payables (trade not insurance)
Please see Section D1 Other Receivables (Trade not Insurance)
Provisions
At 31 December 2016, Calpe held no provisions in its financial statements or on its Solvency II balance
sheet.
Contingent liabilities
Calpe’s does not consider any contingent liabilities to exist as at 31 December 2016.
Employee benefits
Calpe does not consider any employee benefit liabilities to exist as at 31 December 2016.
Aggregation of liabilities
Calpe does not aggregate liabilities into material classes other than those reported in QRT 02.01.02.
Technical provisions
For a detailed description of the valuation differences for the technical provisions between IFRS and
Solvency II, please refer to Section D2.
D.4 Alternative methods for valuation
Calpe does not use any alternative valuation methodologies.
D.5 Any other information
Calpe does not consider there is any other material information to disclose on its valuation for solvency
purposes.
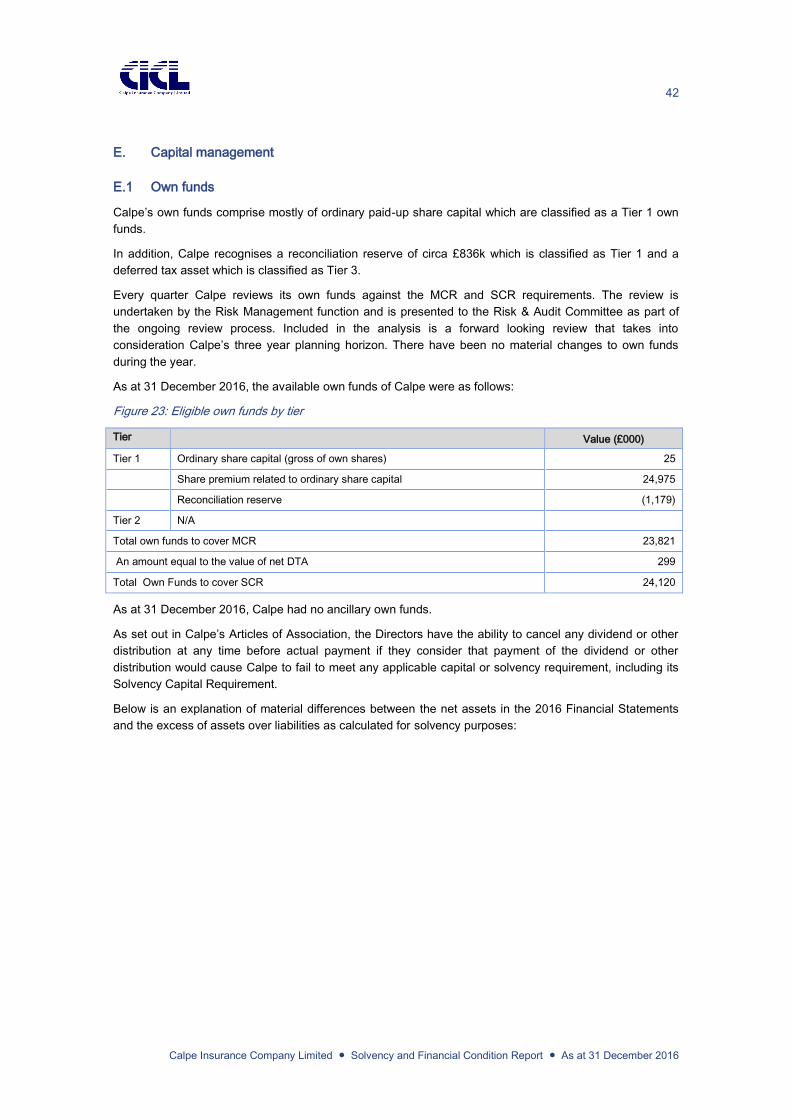
42
Calpe Insurance Company Limited ● Solvency and Financial Condition Report ● As at 31 December 2016
E. Capital management
E.1 Own funds
Calpe’s own funds comprise mostly of ordinary paid-up share capital which are classified as a Tier 1 own
funds.
In addition, Calpe recognises a reconciliation reserve of circa £836k which is classified as Tier 1 and a
deferred tax asset which is classified as Tier 3.
Every quarter Calpe reviews its own funds against the MCR and SCR requirements. The review is
undertaken by the Risk Management function and is presented to the Risk & Audit Committee as part of
the ongoing review process. Included in the analysis is a forward looking review that takes into
consideration Calpe’s three year planning horizon. There have been no material changes to own funds
during the year.
As at 31 December 2016, the available own funds of Calpe were as follows:
Figure 23: Eligible own funds by tier
Tier
Value (£000)
Tier 1 Ordinary share capital (gross of own shares) 25
Share premium related to ordinary share capital 24,975
Reconciliation reserve (1,179)
Tier 2 N/A
Total own funds to cover MCR 23,821
An amount equal to the value of net DTA 299
Total Own Funds to cover SCR 24,120
As at 31 December 2016, Calpe had no ancillary own funds.
As set out in Calpe’s Articles of Association, the Directors have the ability to cancel any dividend or other
distribution at any time before actual payment if they consider that payment of the dividend or other
distribution would cause Calpe to fail to meet any applicable capital or solvency requirement, including its
Solvency Capital Requirement.
Below is an explanation of material differences between the net assets in the 2016 Financial Statements
and the excess of assets over liabilities as calculated for solvency purposes:
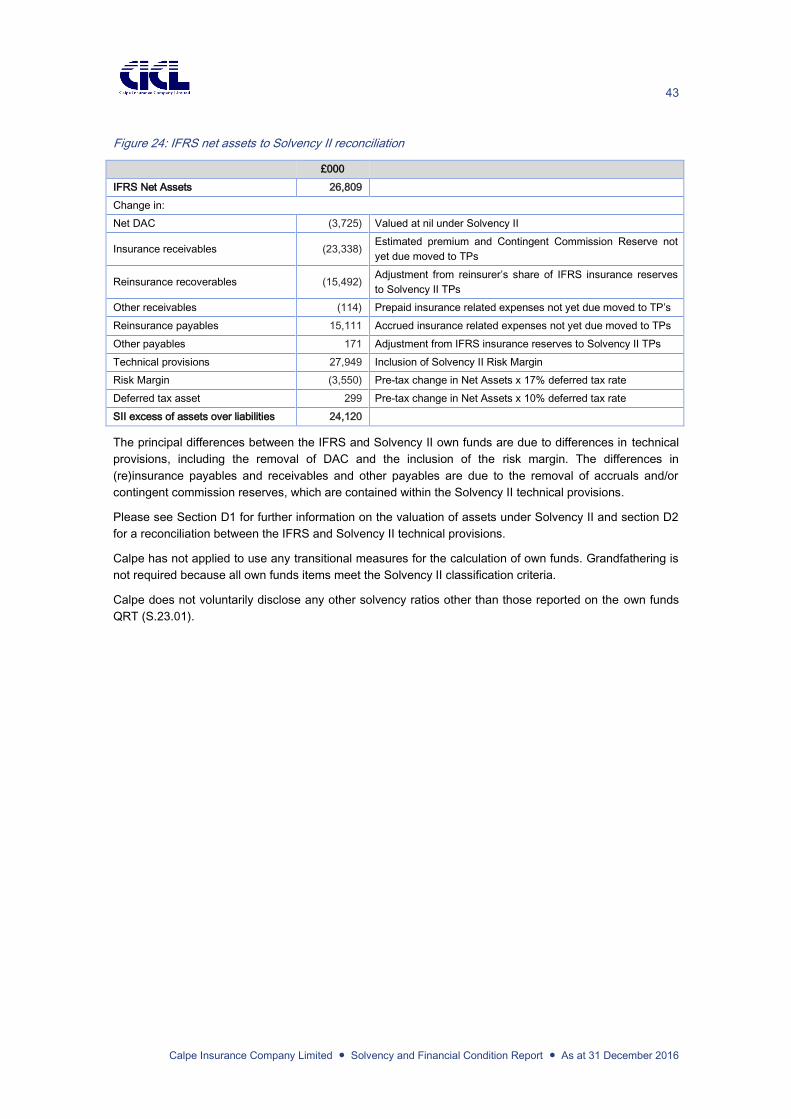
43
Calpe Insurance Company Limited ● Solvency and Financial Condition Report ● As at 31 December 2016
Figure 24: IFRS net assets to Solvency II reconciliation
£000
IFRS Net Assets 26,809
Change in:
Net DAC (3,725) Valued at nil under Solvency II
Insurance receivables (23,338) Estimated premium and Contingent Commission Reserve not
yet due moved to TPs
Reinsurance recoverables (15,492) Adjustment from reinsurer’s share of IFRS insurance reserves
to Solvency II TPs
Other receivables (114) Prepaid insurance related expenses not yet due moved to TP’s
Reinsurance payables 15,111 Accrued insurance related expenses not yet due moved to TPs
Other payables 171 Adjustment from IFRS insurance reserves to Solvency II TPs
Technical provisions 27,949 Inclusion of Solvency II Risk Margin
Risk Margin (3,550) Pre-tax change in Net Assets x 17% deferred tax rate
Deferred tax asset 299 Pre-tax change in Net Assets x 10% deferred tax rate
SII excess of assets over liabilities 24,120
The principal differences between the IFRS and Solvency II own funds are due to differences in technical
provisions, including the removal of DAC and the inclusion of the risk margin. The differences in
(re)insurance payables and receivables and other payables are due to the removal of accruals and/or
contingent commission reserves, which are contained within the Solvency II technical provisions.
Please see Section D1 for further information on the valuation of assets under Solvency II and section D2
for a reconciliation between the IFRS and Solvency II technical provisions.
Calpe has not applied to use any transitional measures for the calculation of own funds. Grandfathering is
not required because all own funds items meet the Solvency II classification criteria.
Calpe does not voluntarily disclose any other solvency ratios other than those reported on the own funds
QRT (S.23.01).

44
Calpe Insurance Company Limited ● Solvency and Financial Condition Report ● As at 31 December 2016
E.2 SCR and MCR
Based on the business plan and strategic initiatives outlined above, and using the Solvency II Standard
Formula to calculate its SCR, Calpe’s Solvency II capital requirements are outlined below.
Figure 25: Solvency II capital requirements (adjusted for Ogden rate impact)
Valuation Date £’000 2016 Q4
Eligible Own Funds to cover SCR 24,120
Eligible Own Funds to cover MCR 23,821
Minimum Capital Requirement 7,390
Solvency Capital Requirement 24,223
Operational risk 3,538
Basic Solvency Capital Requirement 20,685
Market risk 2,656
Counterparty default risk 4,013
Health underwriting risk -
Non-life underwriting risk 17,491
less Diversification (3,476)
Non-life underwriting risk 17,491
Non-life catastrophe risk 600
Non-life premium & reserve risk 17,330
Non-life lapse risk 252
less Diversification (691)
Calpe does not use any undertaking specific parameters in the calculation of the SCR.
Simplifications have been used only where specified in the Solvency II Delegated Acts. The simplifications
used by Calpe are listed below:
Article 107: simplified calculation of the risk mitigating effect for reinsurance arrangements or
securitisation.
Article 111: simplified calculation of the risk mitigating effect.
Article 112: simplified calculation of the risk adjusted value of collateral to take into account the
economic effect of the collateral.
No other simplifications are used by Calpe in the calculation of the SCR.
Calculation of the MCR
In order to calculate its MCR, Calpe uses written premiums on an IFRS basis split by Solvency II line of
business.
The inputs applied to the calculation of the MCR are made up of the technical provisions (excluding the
risk margin) and net written premiums over the last year (for line of business), together with the prescribed
minimum (or “absolute floor”) and the most recently calculated SCR.
During the year, there have been no changes to Calpe’s business or operations which would have resulted
in a material change to the MCR or SCR calculation.
45
Calpe Insurance Company Limited ● Solvency and Financial Condition Report ● As at 31 December 2016
E.3 Use of the duration-based equity risk sub-module in the calculation of the SCR
Calpe does not use the duration-based equity risk sub module to calculate the SCR.
E.4 Differences between the standard formula and any internal model used
Calpe does not use an internal model to calculate the SCR.
E.5 Non-compliance with the MCR and non-compliance with the SCR
There were no instances of non compliance with the MCR and SCR by Calpe during 2016.
However, in February 2017, following the change in the Ogden rate referred to in Section A5, Calpe
adjusted its reserves as at 31 December 2016 and recalculated its SCR. Under that recalculation, Calpe’s
SCR ratio would have been 97%. Calpe immediately notified the GFSC and requested additional funds
from its parent, TRC. On receipt of this request, TRC arranged for additional funds to be made available to
Calpe (in the form of a direct cash injection). Allowing for that capital injection, Calpe’s SCR ratio is 123%.
E.6 Any other information
There is no other material information for Calpe to report regarding capital management.
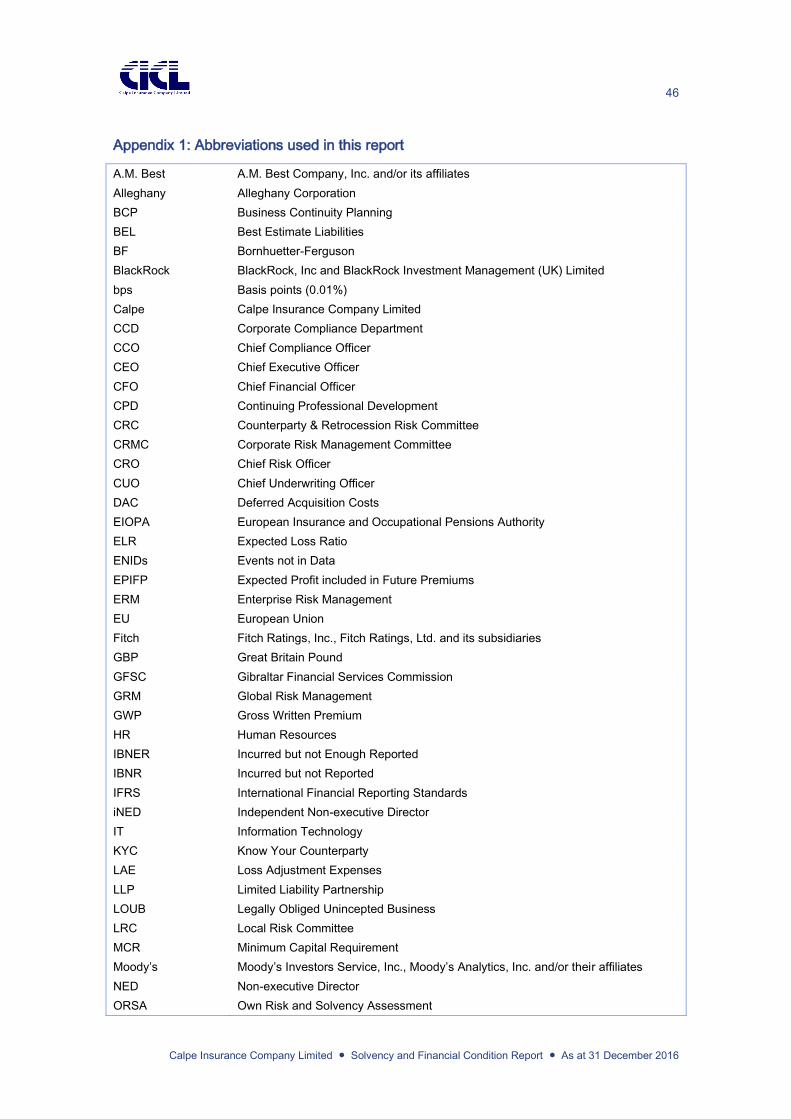
46
Calpe Insurance Company Limited ● Solvency and Financial Condition Report ● As at 31 December 2016
Appendix 1: Abbreviations used in this report
A.M. Best A.M. Best Company, Inc. and/or its affiliates
Alleghany Alleghany Corporation
BCP Business Continuity Planning
BEL Best Estimate Liabilities
BF Bornhuetter-Ferguson
BlackRock BlackRock, Inc and BlackRock Investment Management (UK) Limited
bps Basis points (0.01%)
Calpe Calpe Insurance Company Limited
CCD Corporate Compliance Department
CCO Chief Compliance Officer
CEO Chief Executive Officer
CFO Chief Financial Officer
CPD Continuing Professional Development
CRC Counterparty & Retrocession Risk Committee
CRMC Corporate Risk Management Committee
CRO Chief Risk Officer
CUO Chief Underwriting Officer
DAC Deferred Acquisition Costs
EIOPA European Insurance and Occupational Pensions Authority
ELR Expected Loss Ratio
ENIDs Events not in Data
EPIFP Expected Profit included in Future Premiums
ERM Enterprise Risk Management
EU European Union
Fitch Fitch Ratings, Inc., Fitch Ratings, Ltd. and its subsidiaries
GBP Great Britain Pound
GFSC Gibraltar Financial Services Commission
GRM Global Risk Management
GWP Gross Written Premium
HR Human Resources
IBNER Incurred but not Enough Reported
IBNR Incurred but not Reported
IFRS International Financial Reporting Standards
iNED Independent Non-executive Director
IT Information Technology
KYC Know Your Counterparty
LAE Loss Adjustment Expenses
LLP Limited Liability Partnership
LOUB Legally Obliged Unincepted Business
LRC Local Risk Committee
MCR Minimum Capital Requirement
Moody’s Moody’s Investors Service, Inc., Moody’s Analytics, Inc. and/or their affiliates
NED Non-executive Director
ORSA Own Risk and Solvency Assessment
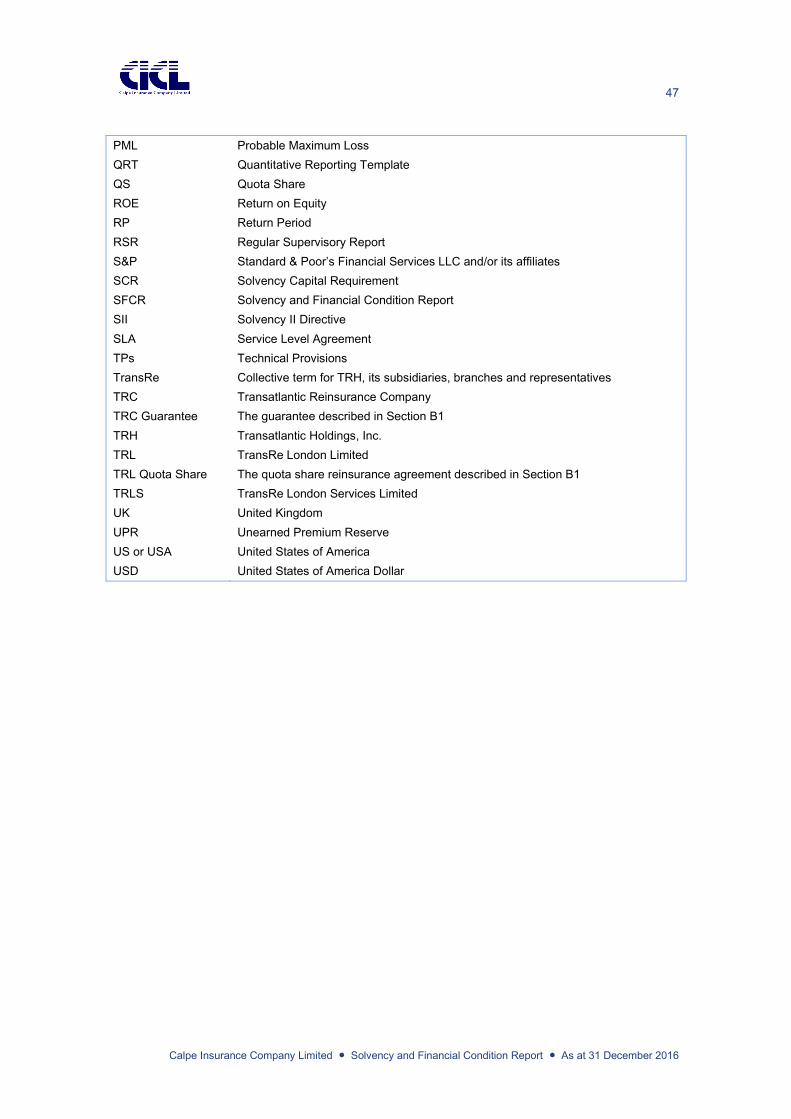
47
Calpe Insurance Company Limited ● Solvency and Financial Condition Report ● As at 31 December 2016
PML Probable Maximum Loss
QRT Quantitative Reporting Template
QS Quota Share
ROE Return on Equity
RP Return Period
RSR Regular Supervisory Report
S&P Standard & Poor’s Financial Services LLC and/or its affiliates
SCR Solvency Capital Requirement
SFCR Solvency and Financial Condition Report
SII Solvency II Directive
SLA Service Level Agreement
TPs Technical Provisions
TransRe Collective term for TRH, its subsidiaries, branches and representatives
TRC Transatlantic Reinsurance Company
TRC Guarantee The guarantee described in Section B1
TRH Transatlantic Holdings, Inc.
TRL TransRe London Limited
TRL Quota Share The quota share reinsurance agreement described in Section B1
TRLS TransRe London Services Limited
UK United Kingdom
UPR Unearned Premium Reserve
US or USA United States of America
USD United States of America Dollar
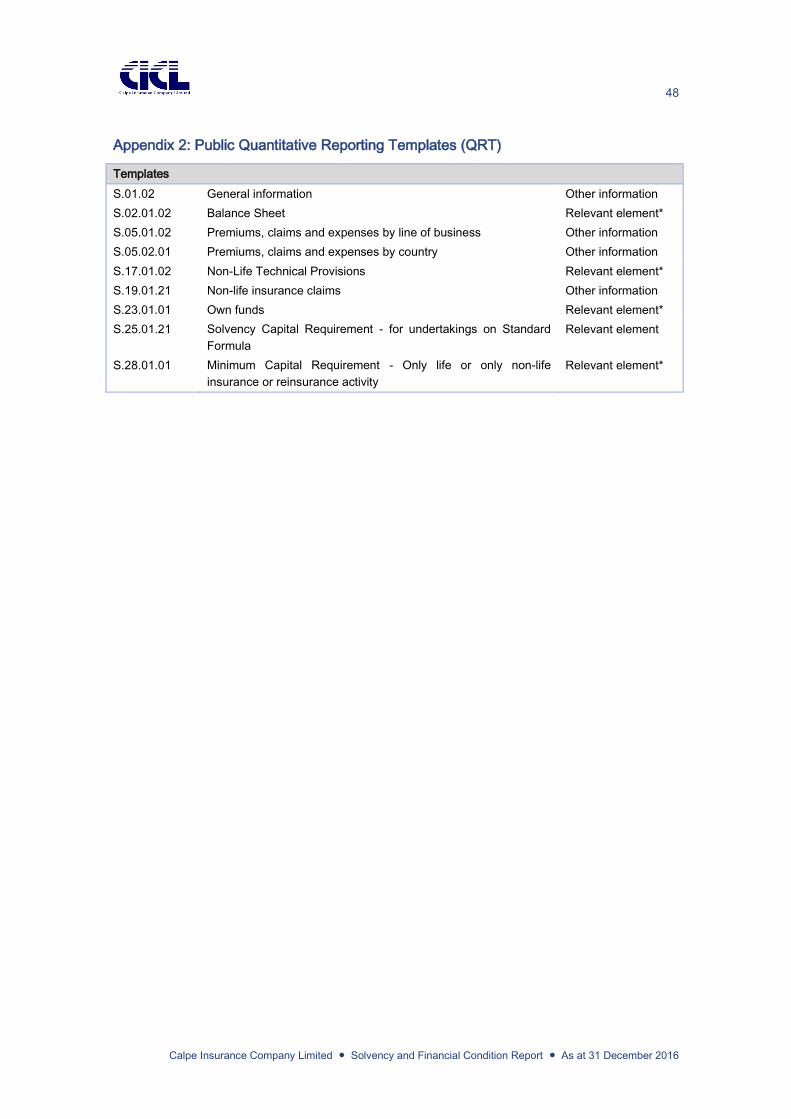
48
Calpe Insurance Company Limited ● Solvency and Financial Condition Report ● As at 31 December 2016
Appendix 2: Public Quantitative Reporting Templates (QRT)
Templates
S.01.02 General information Other information
S.02.01.02 Balance Sheet Relevant element*
S.05.01.02 Premiums, claims and expenses by line of business Other information
S.05.02.01 Premiums, claims and expenses by country Other information
S.17.01.02 Non-Life Technical Provisions Relevant element*
S.19.01.21 Non-life insurance claims Other information
S.23.01.01 Own funds Relevant element*
S.25.01.21 Solvency Capital Requirement - for undertakings on Standard
Formula
Relevant element
S.28.01.01 Minimum Capital Requirement - Only life or only non-life
insurance or reinsurance activity
Relevant element*

S.02.01.02
Balance sheet
Solvency II
value
Assets C0010
R0030 Intangible assets 0
R0040 Deferred tax assets 299
R0050 Pension benefit surplus 0
R0060 Property, plant & equipment held for own use 0
R0070 Investments (other than assets held for index-linked and unit-linked contracts) 61,317
R0080 Property (other than for own use) 0
R0090 Holdings in related undertakings, including participations 0
R0100 Equities 0
R0110 Equities - listed 0
R0120 Equities - unlisted 0
R0130 Bonds 61,317
R0140 Government Bonds 23,904
R0150 Corporate Bonds 37,413
R0160 Structured notes 0
R0170 Collateralised securities 0
R0180 Collective Investments Undertakings 0
R0190 Derivatives 0
R0200 Deposits other than cash equivalents 0
R0210 Other investments 0
R0220 Assets held for index-linked and unit-linked contracts 0
R0230 Loans and mortgages 0
R0240 Loans on policies 0
R0250 Loans and mortgages to individuals 0
R0260 Other loans and mortgages 0
R0270 Reinsurance recoverables from: 72,718
R0280 Non-life and health similar to non-life 72,718
R0290 Non-life excluding health 72,718
R0300 Health similar to non-life 0
R0310 Life and health similar to life, excluding index-linked and unit-linked 0
R0320 Health similar to life 0
R0330 Life excluding health and index-linked and unit-linked 0
R0340 Life index-linked and unit-linked 0
R0350 Deposits to cedants 0
R0360 Insurance and intermediaries receivables 3,126
R0370 Reinsurance receivables 8,659
R0380 Receivables (trade, not insurance) 87
R0390 Own shares (held directly) 0
R0400 Amounts due in respect of own fund items or initial fund called up but not yet paid in 0
R0410 Cash and cash equivalents 9,882
R0420 Any other assets, not elsewhere shown 0
R0500 Total assets 156,086
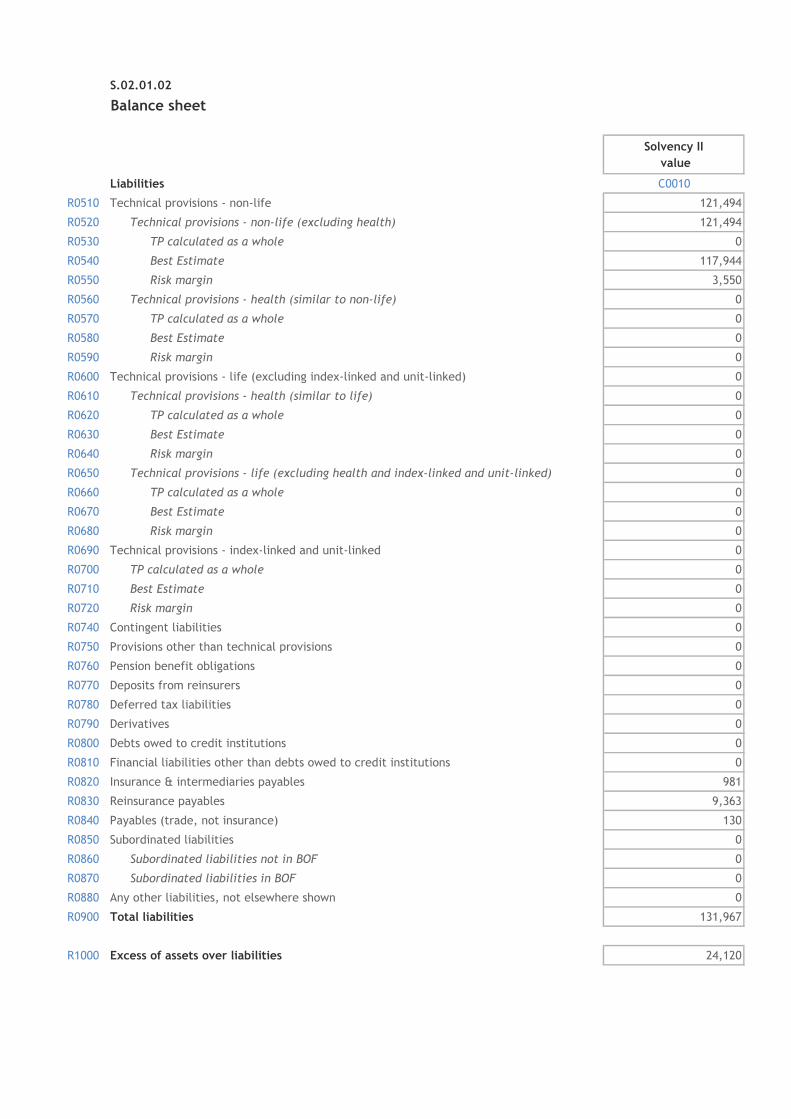
S.02.01.02
Balance sheet
Solvency II
value
Liabilities C0010
R0510 Technical provisions - non-life 121,494
R0520 Technical provisions - non-life (excluding health) 121,494
R0530 TP calculated as a whole 0
R0540 Best Estimate 117,944
R0550 Risk margin 3,550
R0560 Technical provisions - health (similar to non-life) 0
R0570 TP calculated as a whole 0
R0580 Best Estimate 0
R0590 Risk margin 0
R0600 Technical provisions - life (excluding index-linked and unit-linked) 0
R0610 Technical provisions - health (similar to life) 0
R0620 TP calculated as a whole 0
R0630 Best Estimate 0
R0640 Risk margin 0
R0650 Technical provisions - life (excluding health and index-linked and unit-linked) 0
R0660 TP calculated as a whole 0
R0670 Best Estimate 0
R0680 Risk margin 0
R0690 Technical provisions - index-linked and unit-linked 0
R0700 TP calculated as a whole 0
R0710 Best Estimate 0
R0720 Risk margin 0
R0740 Contingent liabilities 0
R0750 Provisions other than technical provisions 0
R0760 Pension benefit obligations 0
R0770 Deposits from reinsurers 0
R0780 Deferred tax liabilities 0
R0790 Derivatives 0
R0800 Debts owed to credit institutions 0
R0810 Financial liabilities other than debts owed to credit institutions 0
R0820 Insurance & intermediaries payables 981
R0830 Reinsurance payables 9,363
R0840 Payables (trade, not insurance) 130
R0850 Subordinated liabilities 0
R0860 Subordinated liabilities not in BOF 0
R0870 Subordinated liabilities in BOF 0
R0880 Any other liabilities, not elsewhere shown 0
R0900 Total liabilities 131,967
R1000 Excess of assets over liabilities 24,120

S.0
5.0
1.0
2
Non-l
ife
Medic
al
expense
insu
rance
Incom
e
pro
tecti
on
insu
rance
Work
ers
'
com
pensa
tion
insu
rance
Moto
r veh
icle
liabilit
y
insu
rance
Oth
er
moto
r
insu
rance
Mari
ne,
avia
tion a
nd
transp
ort
insu
rance
Fir
e a
nd
oth
er
dam
age
to p
ropert
y
insu
rance
Genera
l
liabilit
y
insu
rance
Cre
dit
and
sure
tysh
ip
insu
rance
Legal
expense
s
insu
rance
Ass
ista
nce
Mis
c.
financia
l
loss
Healt
hC
asu
alt
y
Mari
ne,
avia
tion a
nd
transp
ort
Pro
pert
y
C0010
C0020
C0030
C0040
C0050
C0060
C0070
C0080
C0090
C0100
C0110
C0120
C0130
C0140
C0150
C0160
C0200
Pre
miu
ms
wri
tten
R0110
Gro
ss -
Dir
ect
Busi
ness
65,4
25
24,0
48
89,4
73
R0120
Gro
ss -
Pro
port
ional re
insu
rance a
ccepte
d
00
0
R0130
Gro
ss -
Non-p
roport
ional re
insu
rance a
ccepte
d
0
R0140
Rein
sure
rs' s
hare
36,2
12
12,4
84
48,6
97
R0200
Net
29,2
13
11,5
63
40,7
76
Pre
miu
ms
earn
ed
R0210
Gro
ss -
Dir
ect
Busi
ness
60,3
92
22,4
09
82,8
01
R0220
Gro
ss -
Pro
port
ional re
insu
rance a
ccepte
d
00
0
R0230
Gro
ss -
Non-p
roport
ional re
insu
rance a
ccepte
d
0
R0240
Rein
sure
rs' s
hare
32,8
83
11,6
16
44,4
99
R0300
Net
27,5
10
10,7
93
38,3
02
Cla
ims
incurr
ed
R0310
Gro
ss -
Dir
ect
Busi
ness
61,5
18
20,2
07
81,7
25
R0320
Gro
ss -
Pro
port
ional re
insu
rance a
ccepte
d
00
0
R0330
Gro
ss -
Non-p
roport
ional re
insu
rance a
ccepte
d
0
R0340
Rein
sure
rs' s
hare
39,0
89
11,7
49
50,8
38
R0400
Net
22,4
29
8,4
58
30,8
87
Changes
in o
ther
technic
al pro
vis
ions
R0410
Gro
ss -
Dir
ect
Busi
ness
00
0
R0420
Gro
ss -
Pro
port
ional re
insu
rance a
ccepte
d
00
0
R0430
Gro
ss -
Non-p
roport
ional re
insu
rance a
ccepte
d
0
R0440
Rein
sure
rs' s
hare
00
0
R0500
Net
00
0
R0550
Expense
s in
curr
ed
6,0
31
2,4
21
8,4
52
R1200
Oth
er
expense
s0
R1300
Tota
l expense
s8,4
52
Pre
miu
ms,
cla
ims
and e
xpense
s by lin
e o
f busi
ness
Lin
e o
f Busi
ness
for:
non-l
ife insu
rance a
nd r
ein
sura
nce o
bligati
ons
(dir
ect
busi
ness
and a
ccepte
d p
roport
ional re
insu
rance)
Lin
e o
f busi
ness
for:
accepte
d n
on-p
roport
ional
rein
sura
nce
Tota
l

S.0
5.0
2.0
1
Pre
miu
ms,
cla
ims
and e
xpense
s by c
ountr
y
Non-l
ife
C0010
C0020
C0030
C0040
C0050
C0060
C0070
R0010
C0080
C0090
C0100
C0110
C0120
C0130
C0140
Pre
miu
ms
wri
tten
R0110
Gro
ss -
Dir
ect
Busi
ness
088,4
56
00
00
88,4
56
R0120
Gro
ss -
Pro
port
ional re
insu
rance a
ccepte
d
00
00
00
0
R0130
Gro
ss -
Non-p
roport
ional re
insu
rance a
ccepte
d
00
00
00
0
R0140
Rein
sure
rs' s
hare
048,1
27
00
00
48,1
27
R0200
Net
040,3
29
00
00
40,3
29
Pre
miu
ms
earn
ed
R0210
Gro
ss -
Dir
ect
Busi
ness
082,5
35
00
00
82,5
35
R0220
Gro
ss -
Pro
port
ional re
insu
rance a
ccepte
d
00
00
00
0
R0230
Gro
ss -
Non-p
roport
ional re
insu
rance a
ccepte
d
00
00
00
0
R0240
Rein
sure
rs' s
hare
044,3
50
00
00
44,3
50
R0300
Net
038,1
85
00
00
38,1
85
Cla
ims
incurr
ed
R0310
Gro
ss -
Dir
ect
Busi
ness
081,5
16
00
00
81,5
16
R0320
Gro
ss -
Pro
port
ional re
insu
rance a
ccepte
d
00
00
00
0
R0330
Gro
ss -
Non-p
roport
ional re
insu
rance a
ccepte
d
00
00
00
0
R0340
Rein
sure
rs' s
hare
050,7
15
00
00
50,7
15
R0400
Net
030,8
01
00
00
30,8
01
Changes
in o
ther
technic
al pro
vis
ions
R0410
Gro
ss -
Dir
ect
Busi
ness
00
00
00
0
R0420
Gro
ss -
Pro
port
ional re
insu
rance a
ccepte
d
00
00
00
0
R0430
Gro
ss -
Non-p
roport
ional re
insu
rance a
ccepte
d
00
00
00
0
R0440
Rein
sure
rs' s
hare
00
00
00
0
R0500
Net
00
00
00
0
R0550
Expense
s in
curr
ed
08,4
21
00
00
8,4
21
R1200
Oth
er
expense
s0
R1300
Tota
l expense
s8,4
21
Hom
e C
ountr
y
Top 5
countr
ies
(by a
mount
of
gro
ss p
rem
ium
s w
ritt
en)
-
non-l
ife o
bligati
ons
Top 5
countr
ies
(by a
mount
of
gro
ss
pre
miu
ms
wri
tten)
- non-l
ife
obligati
ons
Tota
l T
op 5
and
hom
e c
ountr
y

S.1
7.0
1.0
2
Non-L
ife T
echnic
al Pro
vis
ions
Medic
al
expense
insu
rance
Incom
e
pro
tecti
on
insu
rance
Work
ers
'
com
pensa
tion
insu
rance
Moto
r vehic
le
liabilit
y
insu
rance
Oth
er
moto
r
insu
rance
Mari
ne,
avia
tion a
nd
transp
ort
insu
rance
Fir
e a
nd o
ther
dam
age t
o
pro
pert
y
insu
rance
Genera
l
liabilit
y
insu
rance
Cre
dit
and
sure
tysh
ip
insu
rance
Legal expense
s
insu
rance
Ass
ista
nce
Mis
cellaneous
financia
l lo
ss
Non-
pro
port
ional
healt
h
rein
sura
nce
Non-
pro
port
ional
casu
alt
y
rein
sura
nce
Non-
pro
port
ional
mari
ne,
avia
tion a
nd
transp
ort
rein
sura
nce
Non-
pro
port
ional
pro
pert
y
rein
sura
nce
C0020
C0030
C0040
C0050
C0060
C0070
C0080
C0090
C0100
C0110
C0120
C0130
C0140
C0150
C0160
C0170
C0180
R0010
Technic
al pro
vis
ions
calc
ula
ted a
s a w
hole
00
0
R0050
Tota
l Recovera
ble
s fr
om
rein
sura
nce/SPV a
nd F
init
e R
e a
fter
the
adju
stm
ent
for
expecte
d loss
es
due t
o c
ounte
rpart
y d
efa
ult
ass
ocia
ted t
o T
P c
alc
ula
ted a
s a w
hole
0
Technic
al pro
vis
ions
calc
ula
ted a
s a s
um
of
BE a
nd R
M
Best
est
imate
Pre
miu
m p
rovis
ions
R0060
Gro
ss29,7
79
5,2
55
35,0
34
R0140
Tota
l re
covera
ble
fro
m r
ein
sura
nce/SPV a
nd F
init
e
Re a
fter
the a
dju
stm
ent
for
expecte
d loss
es
due t
o
counte
rpart
y d
efa
ult
17,6
78
3,1
20
20,7
97
R0150
Net
Best
Est
imate
of
Pre
miu
m P
rovis
ions
12,1
01
2,1
35
14,2
37
Cla
ims
pro
vis
ions
R0160
Gro
ss70,4
73
12,4
36
82,9
10
R0240
Tota
l re
covera
ble
fro
m r
ein
sura
nce/SPV a
nd F
init
e
Re a
fter
the a
dju
stm
ent
for
expecte
d loss
es
due t
o
counte
rpart
y d
efa
ult
44,1
32
7,7
88
51,9
20
R0250
Net
Best
Est
imate
of
Cla
ims
Pro
vis
ions
26,3
41
4,6
48
30,9
90
R0260
Tota
l best
est
imate
- g
ross
100,2
52
17,6
92
117,9
44
R0270
Tota
l best
est
imate
- n
et
38,4
42
6,7
84
45,2
26
R0280
Ris
k m
arg
in3,0
18
532
3,5
50
Am
ount
of
the t
ransi
tional on T
echnic
al Pro
vis
ions
R0290
Technic
al Pro
vis
ions
calc
ula
ted a
s a w
hole
0
R0300
Best
est
imate
0
R0310
Ris
k m
arg
in0
R0320
Technic
al pro
vis
ions
- to
tal
103,2
70
18,2
24
121,4
94
R0330
Recovera
ble
fro
m r
ein
sura
nce c
ontr
act/
SPV
and
Fin
ite R
e a
fter
the a
dju
stm
ent
for
expecte
d loss
es
due t
o
counte
rpart
y d
efa
ult
- t
ota
l
61,8
10
10,9
08
72,7
18
R0340
Technic
al pro
vis
ions
min
us
recovera
ble
s fr
om
rein
sura
nce/S
PV
and F
init
e R
e -
tota
l41,4
60
7,3
16
48,7
76
Dir
ect
busi
ness
and a
ccepte
d p
roport
ional re
insu
rance
Accepte
d n
on-p
roport
ional re
insu
rance
Tota
l N
on-L
ife
obligati
on
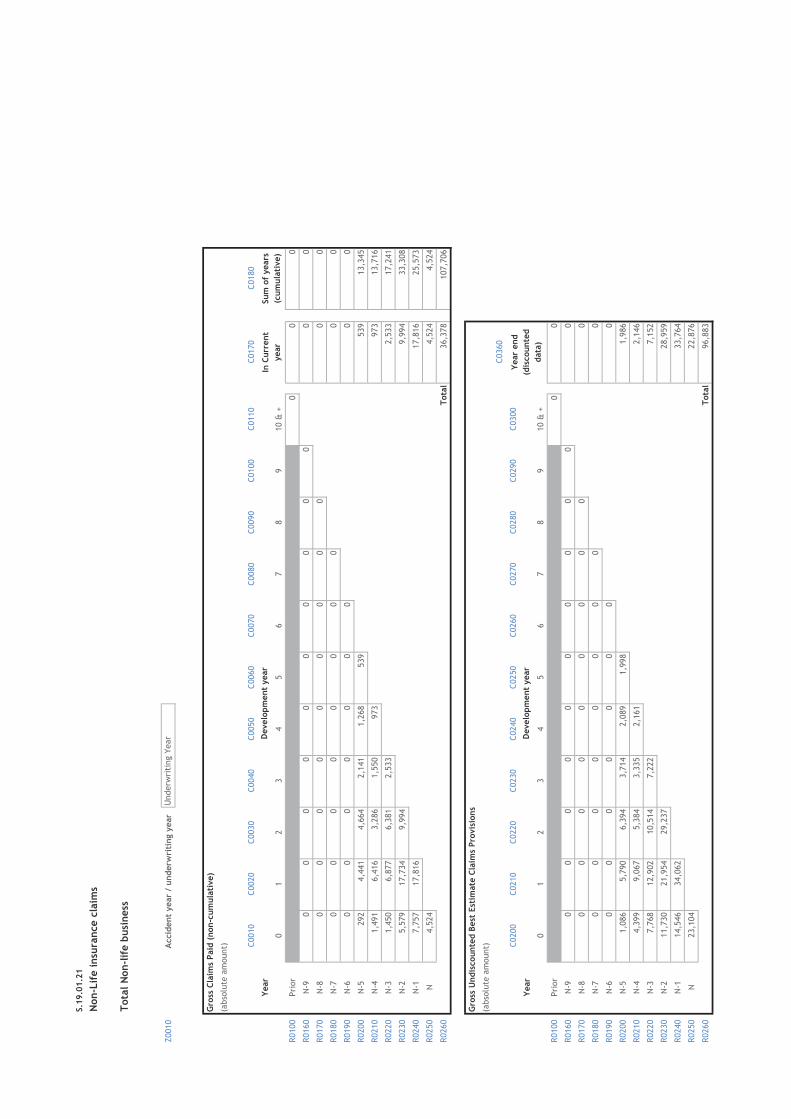
S.1
9.0
1.2
1
Non-L
ife insu
rance c
laim
s
Tota
l N
on-l
ife b
usi
ness
Z0010
Accid
ent
year
/ underw
riti
ng y
ear
Gro
ss C
laim
s Paid
(non-c
um
ula
tive)
(abso
lute
am
ount) C
0010
C0020
C0030
C0040
C0050
C0060
C0070
C0080
C0090
C0100
C0110
C0170
C0180
Year
01
23
45
67
89
10 &
+
R0100
Pri
or
00
0
R0160
N-9
00
00
00
00
00
00
R0170
N-8
00
00
00
00
00
0
R0180
N-7
00
00
00
00
00
R0190
N-6
00
00
00
00
0
R0200
N-5
292
4,4
41
4,6
64
2,1
41
1,2
68
539
539
13,3
45
R0210
N-4
1,4
91
6,4
16
3,2
86
1,5
50
973
973
13,7
16
R0220
N-3
1,4
50
6,8
77
6,3
81
2,5
33
2,5
33
17,2
41
R0230
N-2
5,5
79
17,7
34
9,9
94
9,9
94
33,3
08
R0240
N-1
7,7
57
17,8
16
17,8
16
25,5
73
R0250
N4,5
24
4,5
24
4,5
24
R0260
Tota
l36,3
78
107,7
06
Gro
ss U
ndis
counte
d B
est
Est
imate
Cla
ims
Pro
vis
ions
(abso
lute
am
ount)
C0360
C0200
C0210
C0220
C0230
C0240
C0250
C0260
C0270
C0280
C0290
C0300
Year
01
23
45
67
89
10 &
+
R0100
Pri
or
00
R0160
N-9
00
00
00
00
00
0
R0170
N-8
00
00
00
00
00
R0180
N-7
00
00
00
00
0
R0190
N-6
00
00
00
00
R0200
N-5
1,0
86
5,7
90
6,3
94
3,7
14
2,0
89
1,9
98
1,9
86
R0210
N-4
4,3
99
9,0
67
5,3
84
3,3
35
2,1
61
2,1
46
R0220
N-3
7,7
68
12,9
02
10,5
14
7,2
22
7,1
52
R0230
N-2
11,7
30
21,9
54
29,2
37
28,9
59
R0240
N-1
14,5
46
34,0
62
33,7
64
R0250
N23,1
04
22,8
76
R0260
Tota
l96,8
83
Underw
riti
ng Y
ear D
evelo
pm
ent
year
In C
urr
ent
year
Sum
of
years
(cum
ula
tive)
Year
end
(dis
counte
d
data
)
Develo
pm
ent
year
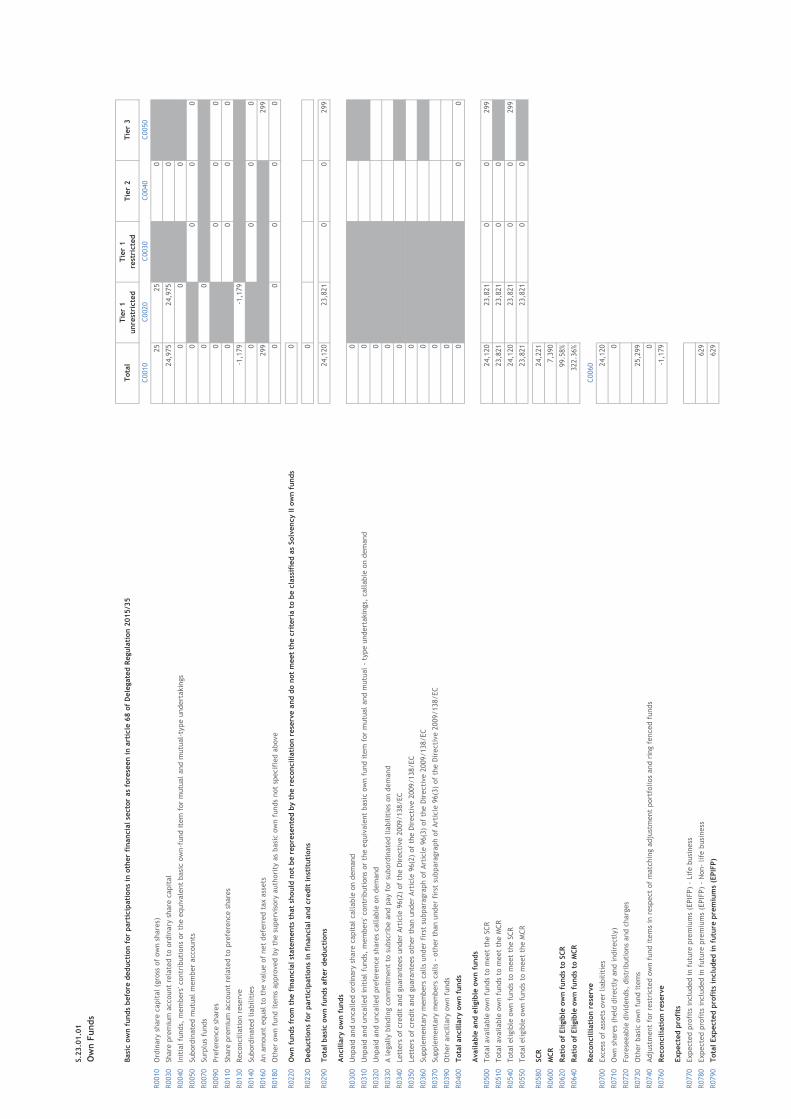
S.2
3.0
1.0
1
Ow
n F
unds
Basi
c o
wn f
unds
befo
re d
educti
on f
or
part
icip
ati
ons
in o
ther
financia
l se
cto
r as
fore
seen i
n a
rtic
le 6
8 o
f D
ele
gate
d R
egula
tion 2
015/3
5T
ota
lT
ier
1
unre
stri
cte
d
Tie
r 1
rest
ricte
dT
ier
2T
ier
3
C0010
C0020
C0030
C0040
C0050
R0010
Ord
inary
share
capit
al
(gro
ss o
f ow
n s
hare
s)25
25
0
R0030
Share
pre
miu
m a
ccount
rela
ted t
o o
rdin
ary
share
capit
al
24,9
75
24,9
75
0
R0040
Init
ial
funds,
mem
bers
' contr
ibuti
ons
or
the e
quiv
ale
nt
basi
c o
wn-f
und ite
m f
or
mutu
al
and m
utu
al-
type u
ndert
akin
gs
00
0
R0050
Subord
inate
d m
utu
al
mem
ber
accounts
00
00
R0070
Surp
lus
funds
00
R0090
Pre
fere
nce s
hare
s0
00
0
R0110
Share
pre
miu
m a
ccount
rela
ted t
o p
refe
rence s
hare
s0
00
0
R0130
Reconcilia
tion r
ese
rve
-1,1
79
-1,1
79
R0140
Subord
inate
d l
iabilit
ies
00
00
R0160
An a
mount
equal
to t
he v
alu
e o
f net
defe
rred t
ax a
ssets
299
299
R0180
Oth
er
ow
n f
und ite
ms
appro
ved b
y t
he s
uperv
isory
auth
ori
ty a
s basi
c o
wn f
unds
not
specif
ied a
bove
00
00
0
R0220
Ow
n f
unds
from
the f
inancia
l st
ate
ments
that
should
not
be r
epre
sente
d b
y t
he r
econcil
iati
on r
ese
rve a
nd d
o n
ot
meet
the c
rite
ria t
o b
e c
lass
ifie
d a
s Solv
ency II ow
n f
unds
0
R0230
Deducti
ons
for
part
icip
ati
ons
in f
inancia
l and c
redit
inst
ituti
ons
0
R0290
Tota
l basi
c o
wn f
unds
aft
er
deducti
ons
24,1
20
23,8
21
00
299
Ancil
lary
ow
n f
unds
R0300
Unpaid
and u
ncall
ed o
rdin
ary
share
capit
al
call
able
on d
em
and
0
R0310
Unpaid
and u
ncall
ed init
ial
funds,
mem
bers
' contr
ibuti
ons
or
the e
quiv
ale
nt
basi
c o
wn f
und ite
m f
or
mutu
al
and m
utu
al
- ty
pe u
ndert
akin
gs,
call
able
on d
em
and
0
R0320
Unpaid
and u
ncall
ed p
refe
rence s
hare
s call
able
on d
em
and
0
R0330
A l
egall
y b
indin
g c
om
mit
ment
to s
ubsc
ribe a
nd p
ay f
or
subord
inate
d l
iabilit
ies
on d
em
and
0
R0340
Lett
ers
of
cre
dit
and g
uara
nte
es
under
Art
icle
96(2
) of
the D
irecti
ve 2
009/138/EC
0
R0350
Lett
ers
of
cre
dit
and g
uara
nte
es
oth
er
than u
nder
Art
icle
96(2
) of
the D
irecti
ve 2
009/138/EC
0
R0360
Supple
menta
ry m
em
bers
call
s under
firs
t su
bpara
gra
ph o
f Art
icle
96(3
) of
the D
irecti
ve 2
009/138/EC
0
R0370
Supple
menta
ry m
em
bers
call
s -
oth
er
than u
nder
firs
t su
bpara
gra
ph o
f Art
icle
96(3
) of
the D
irecti
ve 2
009/138/EC
0
R0390
Oth
er
ancilla
ry o
wn f
unds
0
R0400
Tota
l ancil
lary
ow
n f
unds
00
0
Avail
able
and e
ligib
le o
wn f
unds
R0500
Tota
l available
ow
n f
unds
to m
eet
the S
CR
24,1
20
23,8
21
00
299
R0510
Tota
l available
ow
n f
unds
to m
eet
the M
CR
23,8
21
23,8
21
00
R0540
Tota
l eligib
le o
wn f
unds
to m
eet
the S
CR
24,1
20
23,8
21
00
299
R0550
Tota
l eligib
le o
wn f
unds
to m
eet
the M
CR
23,8
21
23,8
21
00
R0580
SC
R24,2
21
R0600
MC
R7,3
90
R0620
Rati
o o
f Eli
gib
le o
wn f
unds
to S
CR
99.5
8%
R0640
Rati
o o
f Eli
gib
le o
wn f
unds
to M
CR
322.3
6%
Reconcil
liati
on r
ese
rve
C0060
R0700
Excess
of
ass
ets
over
liabilit
ies
24,1
20
R0710
Ow
n s
hare
s (h
eld
dir
ectl
y a
nd indir
ectl
y)
0
R0720
Fore
seeable
div
idends,
dis
trib
uti
ons
and c
harg
es
R0730
Oth
er
basi
c o
wn f
und ite
ms
25,2
99
R0740
Adju
stm
ent
for
rest
ricte
d o
wn f
und ite
ms
in r
esp
ect
of
matc
hin
g a
dju
stm
ent
port
folios
and r
ing f
enced f
unds
0
R0760
Reconcil
iati
on r
ese
rve
-1,1
79
Expecte
d p
rofi
ts
R0770
Expecte
d p
rofi
ts inclu
ded in f
utu
re p
rem
ium
s (E
PIF
P)
- Lif
e b
usi
ness
R0780
Expecte
d p
rofi
ts inclu
ded in f
utu
re p
rem
ium
s (E
PIF
P)
- N
on-
life
busi
ness
629
R0790
Tota
l Expecte
d p
rofi
ts i
nclu
ded i
n f
utu
re p
rem
ium
s (E
PIF
P)
629

S.2
5.0
1.2
1
Solv
ency C
apit
al R
equir
em
ent
- fo
r undert
akin
gs
on S
tandard
Form
ula
Gro
ss s
olv
ency c
apit
al
requir
em
ent
USP
Sim
plifi
cati
ons
C0110
C0080
C0090
R0010
Mark
et
risk
2,6
50
R0020
Counte
rpart
y d
efa
ult
ris
k4,0
13
R0030
Lif
e u
nderw
riti
ng r
isk
R0040
Healt
h u
nderw
riti
ng r
isk
R0050
Non-l
ife u
nderw
riti
ng r
isk
17,4
91
R0060
Div
ers
ific
ati
on
-3,4
72
R0070
Inta
ngib
le a
sset
risk
0
R0100
Basi
c S
olv
ency C
apit
al R
equir
em
ent
20,6
82
Calc
ula
tion o
f Solv
ency C
apit
al R
equir
em
ent
C0100
R0130
Opera
tional ri
sk3,5
38
R0140
Loss
-abso
rbin
g c
apacit
y o
f te
chnic
al pro
vis
ions
0
R0150
Loss
-abso
rbin
g c
apacit
y o
f defe
rred t
axes
0
R0160
Capit
al re
quir
em
ent
for
busi
ness
opera
ted in a
ccord
ance w
ith A
rt.
4 o
f D
irecti
ve 2
003/41/EC
R0200
Solv
ency C
apit
al R
equir
em
ent
exclu
din
g c
apit
al add-o
n24,2
21
R0210
Capit
al add-o
ns
alr
eady s
et
R0220
Solv
ency c
apit
al re
quir
em
ent
24,2
21
Oth
er
info
rmati
on o
n S
CR
R0400
Capit
al re
quir
em
ent
for
dura
tion-b
ase
d e
quit
y r
isk s
ub-m
odule
R0410
Tota
l am
ount
of
Noti
onal Solv
ency C
apit
al Requir
em
ents
for
rem
ain
ing p
art
R0420
Tota
l am
ount
of
Noti
onal Solv
ency C
apit
al Requir
em
ents
for
ring f
enced f
unds
R0430
Tota
l am
ount
of
Noti
onal Solv
ency C
apit
al Requir
em
ents
for
matc
hin
g a
dju
stm
ent
port
folios
R0440
Div
ers
ific
ati
on e
ffects
due t
o R
FF n
SC
R a
ggre
gati
on f
or
art
icle
304
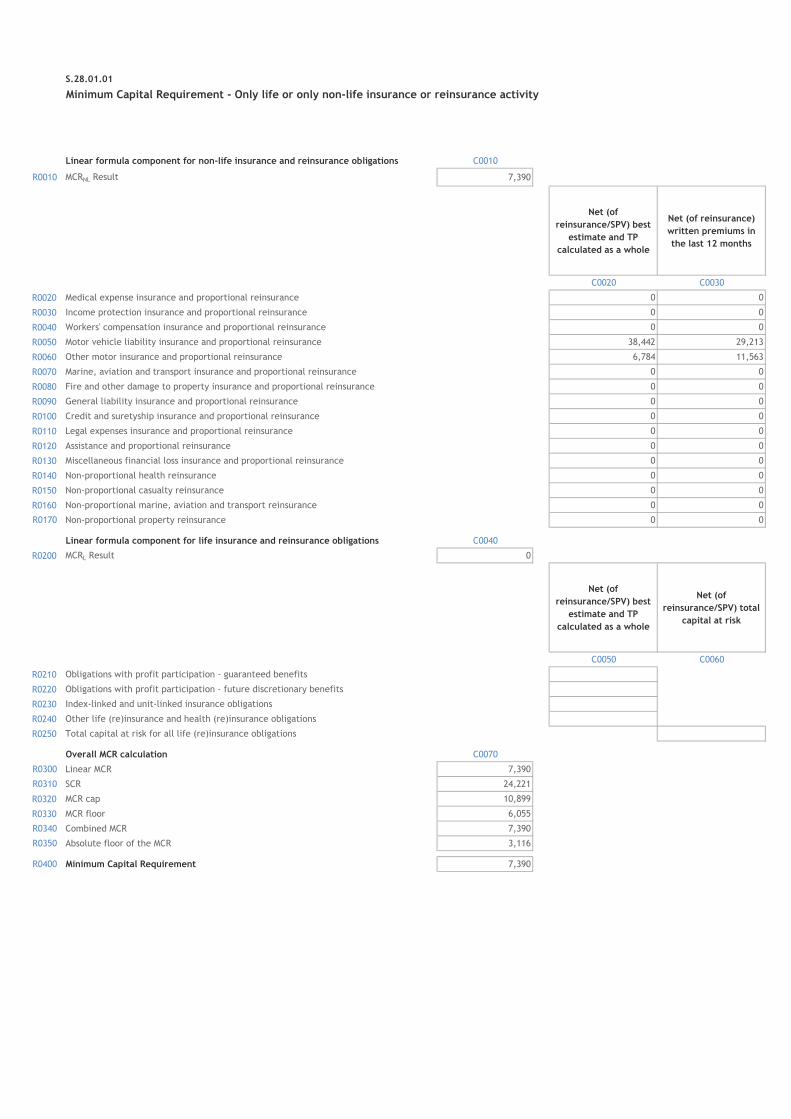
S.28.01.01
Minimum Capital Requirement - Only life or only non-life insurance or reinsurance activity
Linear formula component for non-life insurance and reinsurance obligations C0010
R0010 MCRNL Result 7,390
Net (of
reinsurance/SPV) best
estimate and TP
calculated as a whole
Net (of reinsurance)
written premiums in
the last 12 months
C0020 C0030
R0020 Medical expense insurance and proportional reinsurance 0 0
R0030 Income protection insurance and proportional reinsurance 0 0
R0040 Workers' compensation insurance and proportional reinsurance 0 0
R0050 Motor vehicle liability insurance and proportional reinsurance 38,442 29,213
R0060 Other motor insurance and proportional reinsurance 6,784 11,563
R0070 Marine, aviation and transport insurance and proportional reinsurance 0 0
R0080 Fire and other damage to property insurance and proportional reinsurance 0 0
R0090 General liability insurance and proportional reinsurance 0 0
R0100 Credit and suretyship insurance and proportional reinsurance 0 0
R0110 Legal expenses insurance and proportional reinsurance 0 0
R0120 Assistance and proportional reinsurance 0 0
R0130 Miscellaneous financial loss insurance and proportional reinsurance 0 0
R0140 Non-proportional health reinsurance 0 0
R0150 Non-proportional casualty reinsurance 0 0
R0160 Non-proportional marine, aviation and transport reinsurance 0 0
R0170 Non-proportional property reinsurance 0 0
Linear formula component for life insurance and reinsurance obligations C0040
R0200 MCRL Result 0
Net (of
reinsurance/SPV) best
estimate and TP
calculated as a whole
Net (of
reinsurance/SPV) total
capital at risk
C0050 C0060
R0210 Obligations with profit participation - guaranteed benefits
R0220 Obligations with profit participation - future discretionary benefits
R0230 Index-linked and unit-linked insurance obligations
R0240 Other life (re)insurance and health (re)insurance obligations
R0250 Total capital at risk for all life (re)insurance obligations
Overall MCR calculation C0070
R0300 Linear MCR 7,390
R0310 SCR 24,221
R0320 MCR cap 10,899
R0330 MCR floor 6,055
R0340 Combined MCR 7,390
R0350 Absolute floor of the MCR 3,116
R0400 Minimum Capital Requirement 7,390