Calorimetry of Ferromagnetic Heuslers in Magnetic Fields ......Calorimetry of Ferromagnetic Heuslers...
40
Calorimetry of Ferromagnetic Heuslers in Magnetic Fields: Observation of a Pseudo-gap in a Ni 2 MnGa Single Crystal C. P. Opeil 1 , J. C. Lashley 2 , R. A. Fisher 3 , R. K. Schulze 2 ,B. Mihaila 2 , J. L. Smith 2 , L. Hults 2 , P. Riseborough 4 , L. Mañosa 5 and A. Planes 5 1 Boston College, Physics Department, Chestnut Hill, MA, USA 2 Los Alamos National Laboratory, Los Alamos, NM, USA 3 Univ. of California, Berkeley-Lawrence/Berkeley Laboratory, CA, USA 4 Temple University, Physics Department, Philadelphia, PA, USA 5 Universitat de Barcelona, Departament d’Estructura i Constituents de la Matèria, Facultat de Física, Diagonal 647, E-08028 Barcelona, Catalonia, Spain Work sponsored by: Dept. of Energy and Boston College
Transcript of Calorimetry of Ferromagnetic Heuslers in Magnetic Fields ......Calorimetry of Ferromagnetic Heuslers...

Calorimetry of Ferromagnetic Heuslers in Magnetic Fields: Observation of a Pseudo-gap in a Ni2MnGa
Single Crystal C. P. Opeil1, J. C. Lashley2, R. A. Fisher3, R. K. Schulze2,B. Mihaila2, J. L. Smith2, L. Hults2, P. Riseborough4, L. Mañosa5 and A. Planes5
1Boston College, Physics Department, Chestnut Hill, MA, USA 2Los Alamos National Laboratory, Los Alamos, NM, USA 3Univ. of California, Berkeley-Lawrence/Berkeley Laboratory, CA, USA 4Temple University, Physics Department, Philadelphia, PA, USA 5 Universitat de Barcelona, Departament d’Estructura i Constituents de la Matèria, Facultat de Física, Diagonal 647, E-08028 Barcelona, Catalonia, Spain
Work sponsored by: Dept. of Energy and Boston College

Back Scatter Laue, T = 293K
Low Energy Electron Diffraction (LEED) at T=293 K
Ni2MnGa (100) Cubic Fm-3m a = 5.825 Ang. Vol = 192.34 Ang.3 Ni (0.25,0.25,0.25) Mn (0.5,0.5,0.5) Ga (0, 0, 0)
Ni2MnGa Single Crystal
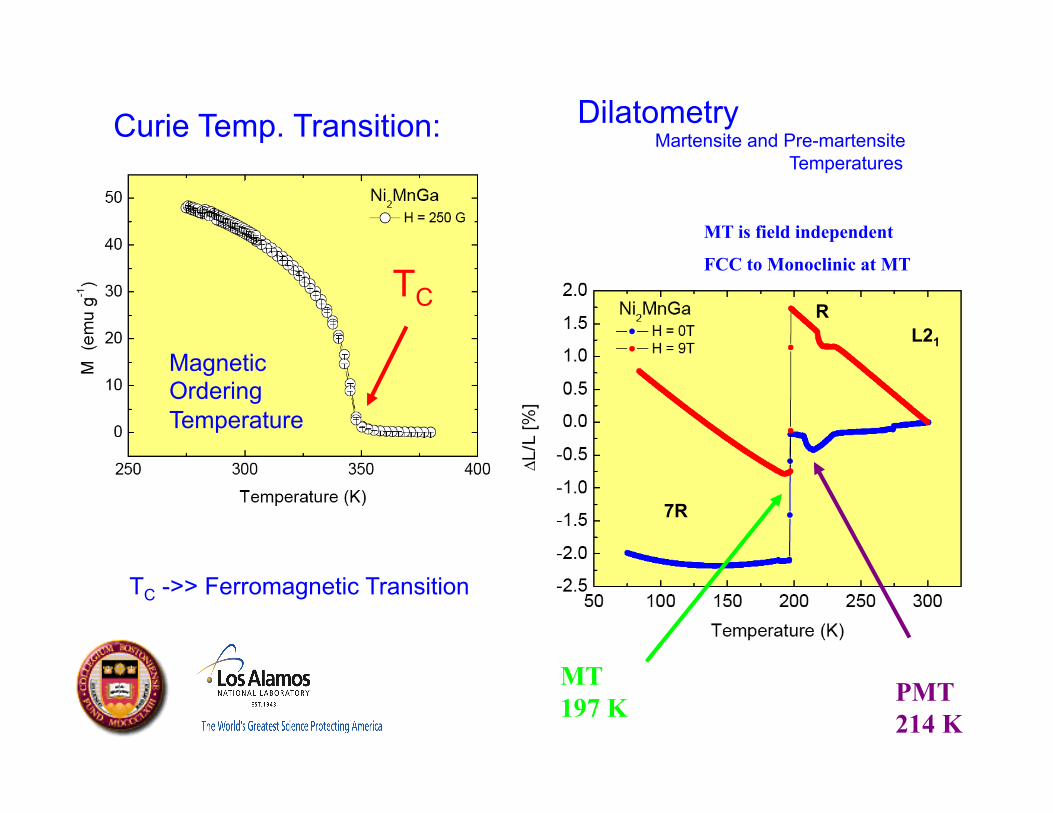
Curie Temp. Transition:
TC
TC ->> Ferromagnetic Transition
Dilatometry Martensite and Pre-martensite Temperatures
MT 197 K PMT
214 K
MT is field independent
FCC to Monoclinic at MT
Magnetic Ordering Temperature
L21 R
7R

Specific Heat (H = 0 g) H =
0
100
250
500
1,000
5,000
7,500
10,000
90,000 (g)
C/T = γ + B3T2
Trange = 2 - 30 K
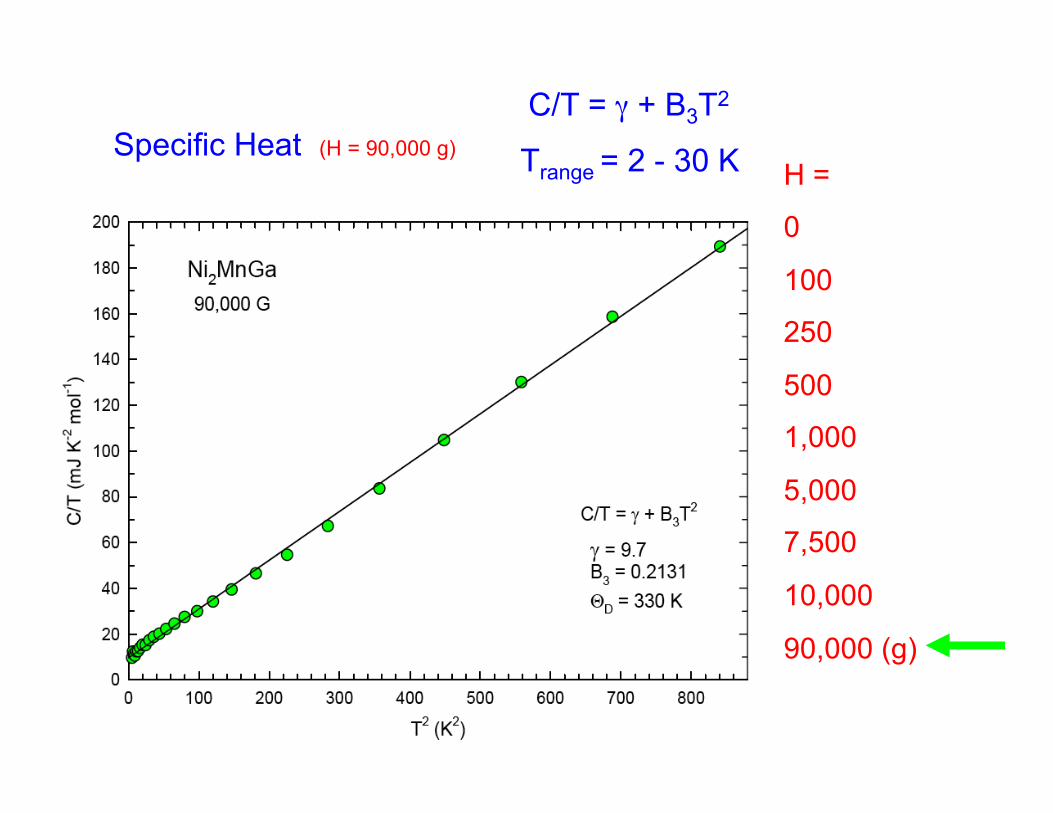
Specific Heat (H = 90,000 g) H =
0
100
250
500
1,000
5,000
7,500
10,000
90,000 (g)
Trange = 2 - 30 K
C/T = γ + B3T2
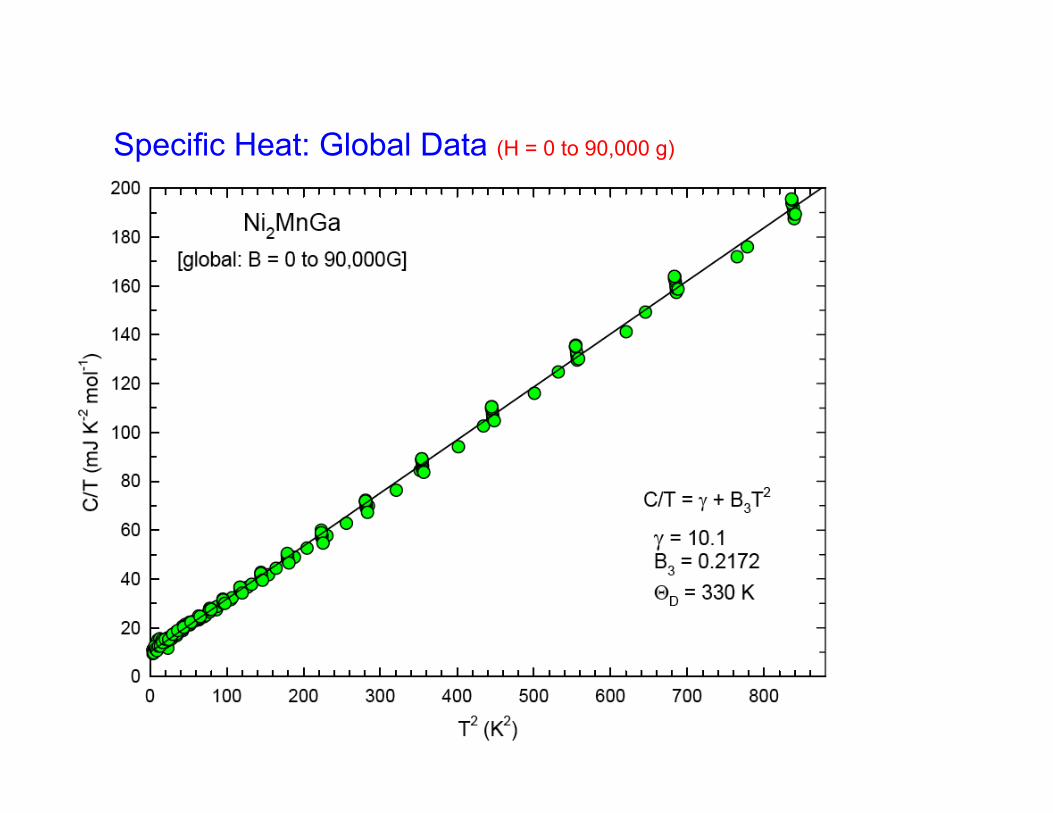
Specific Heat: Global Data (H = 0 to 90,000 g)

Specific Heat Analysis of Ni2MnGa:
C/T = γ + B3T2 Trange = 2 - 30 K
global
Comparable to Cu
Normative for Magnetic Materials
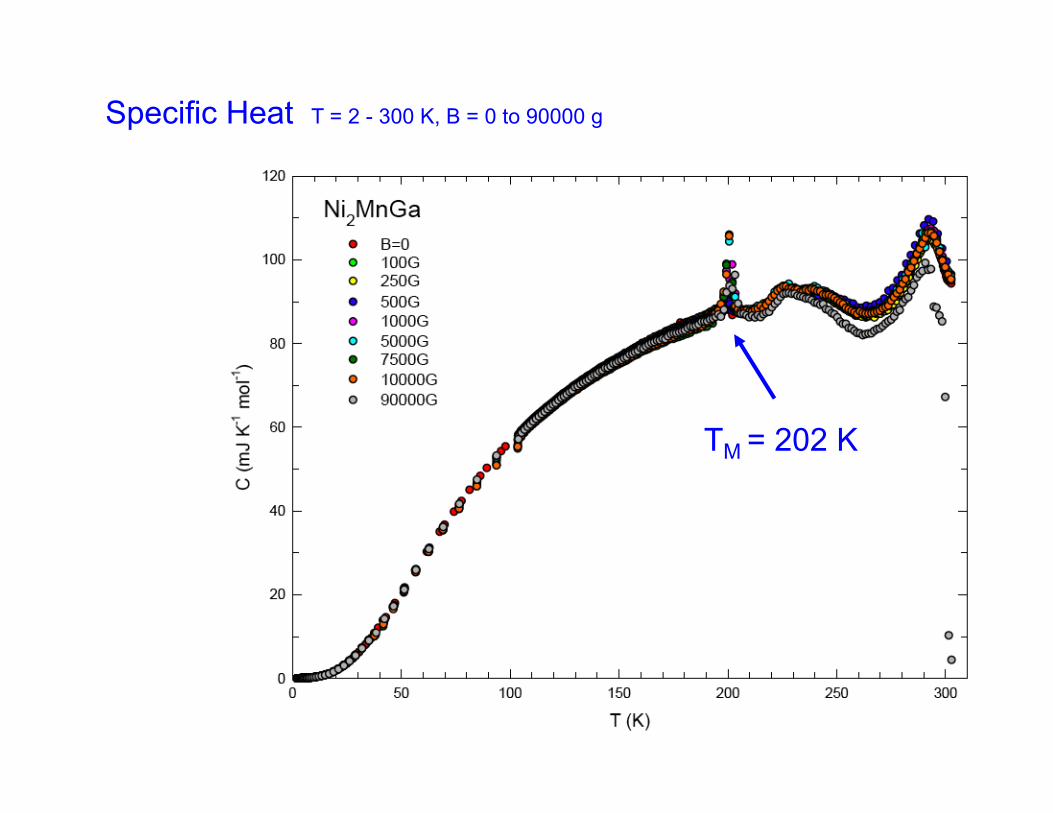
TM = 202 K
Specific Heat T = 2 - 300 K, B = 0 to 90000 g

Specific Heat T = 2 - 300 K, B = 0 g
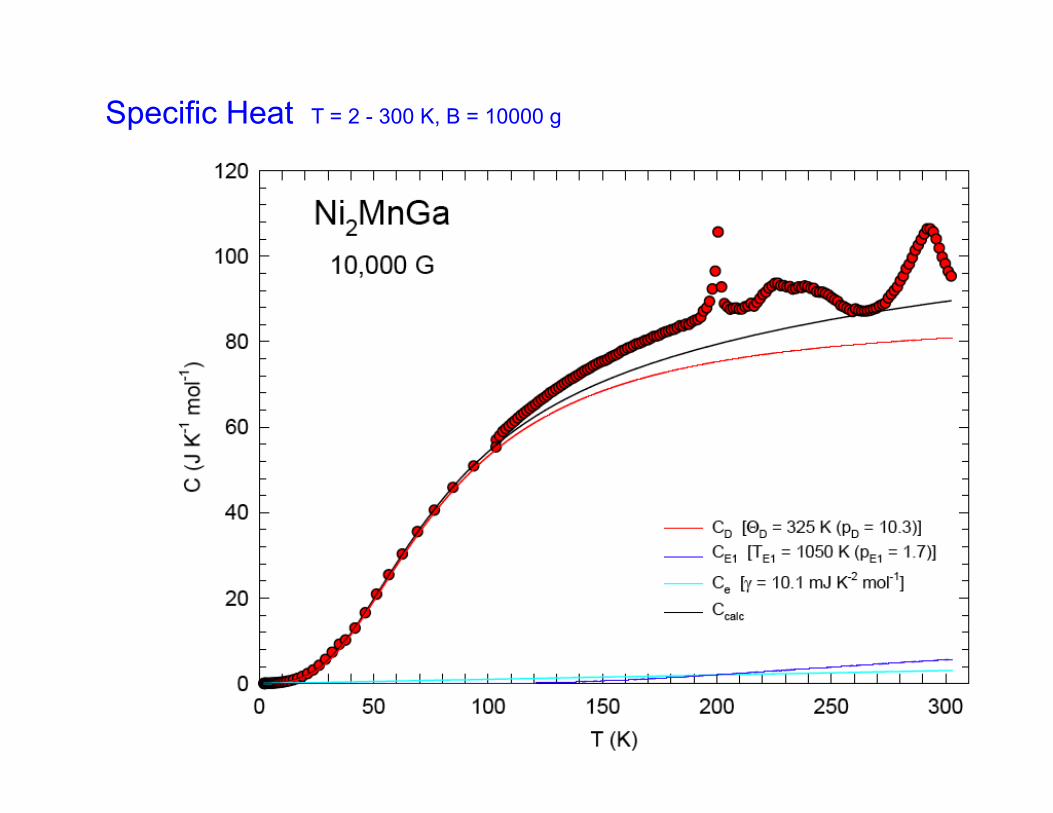
Specific Heat T = 2 - 300 K, B = 10000 g
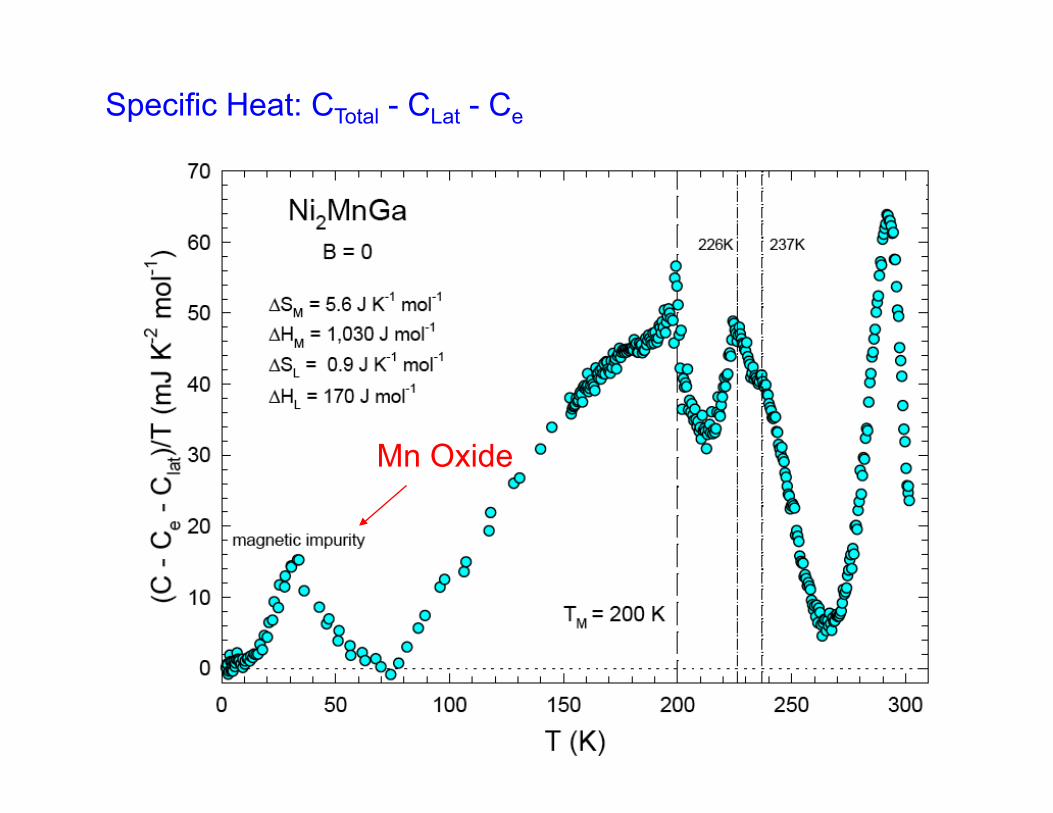
Mn Oxide
Specific Heat: CTotal - CLat - Ce
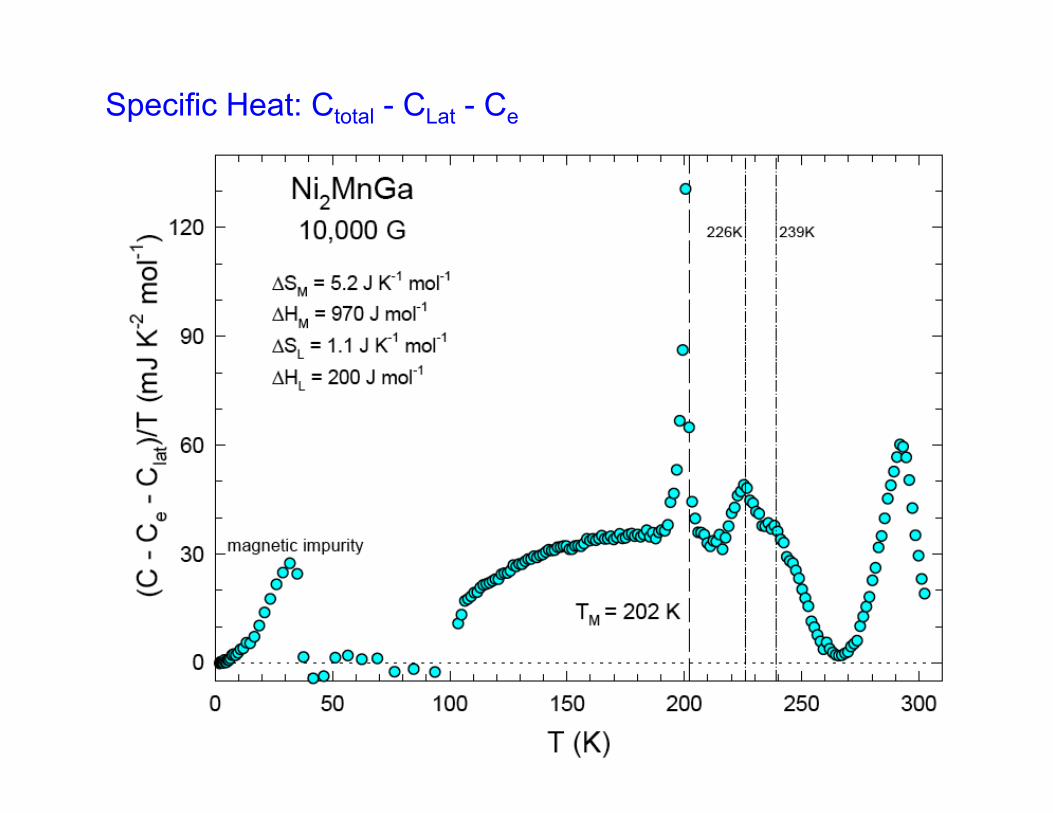
Specific Heat: Ctotal - CLat - Ce
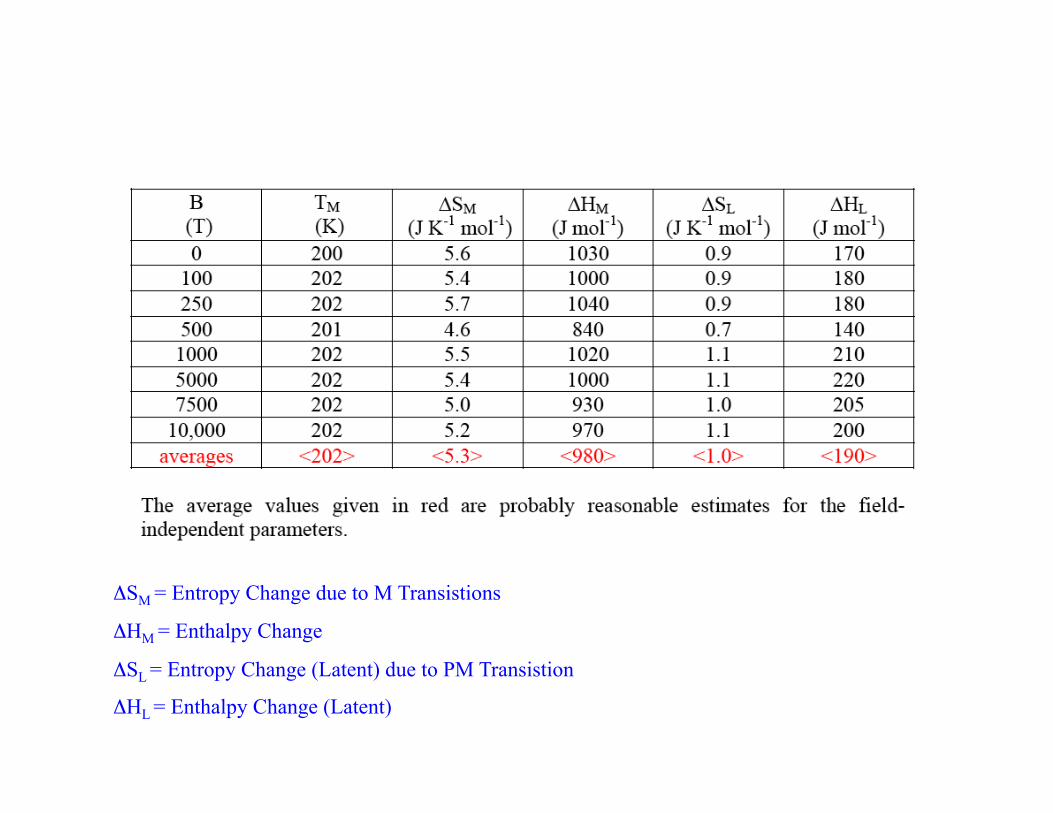
ΔSM = Entropy Change due to M Transistions
ΔHM = Enthalpy Change
ΔSL = Entropy Change (Latent) due to PM Transistion
ΔHL = Enthalpy Change (Latent)

Resistivity (AC Transport)
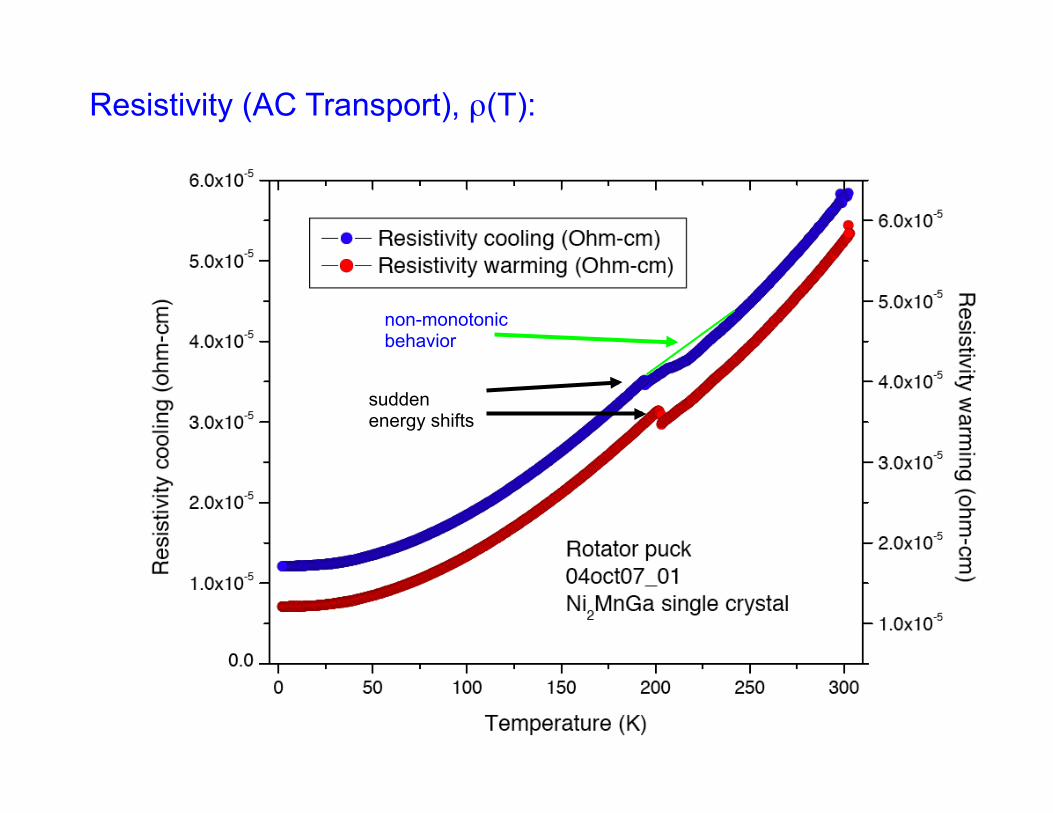
Resistivity (AC Transport), ρ(T):
non-monotonic behavior
sudden energy shifts
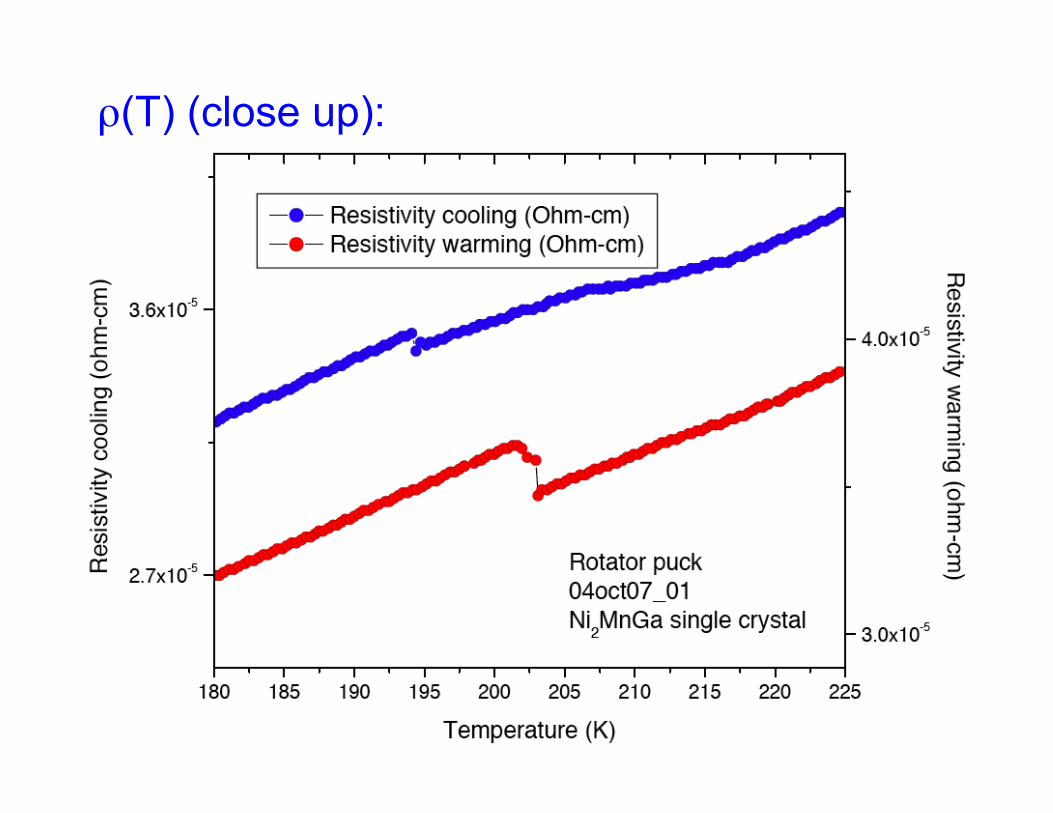
ρ(T) (close up):

ρ(T):
m-a crystallographic changes

Magneto-Resistivity, ρ(H,T), where HMAX = 9 T:
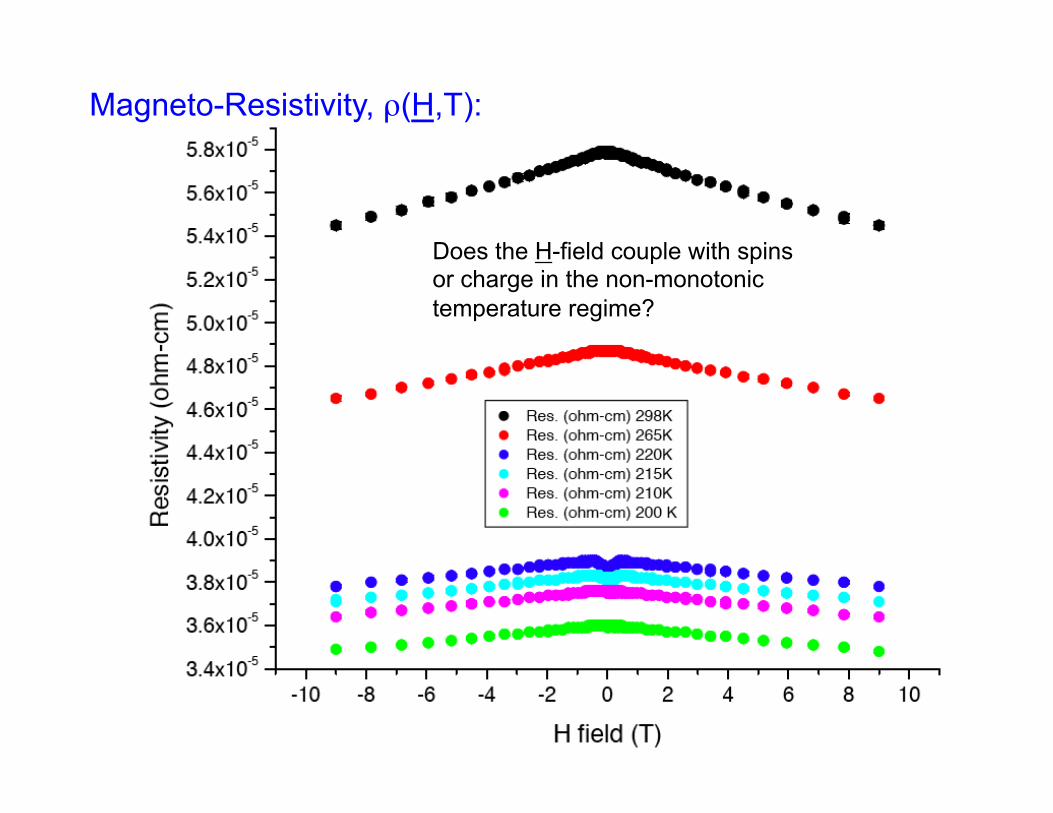
Magneto-Resistivity, ρ(H,T):
Does the H-field couple with spins or charge in the non-monotonic temperature regime?
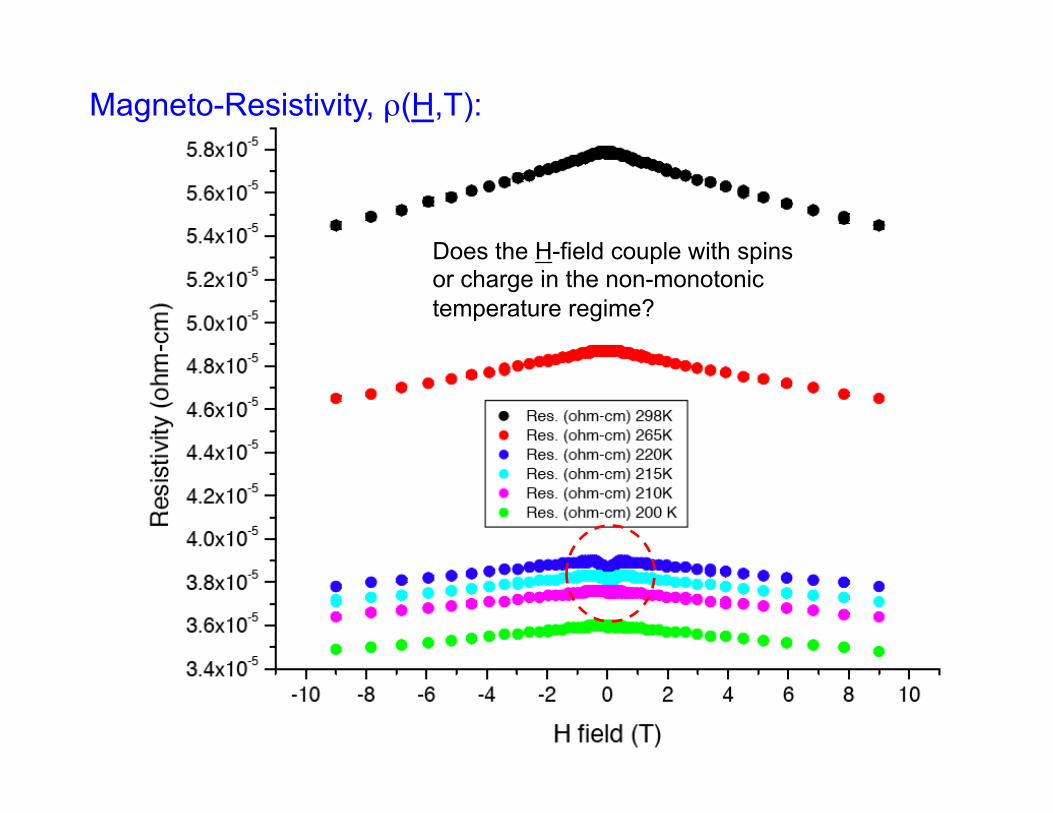
Magneto-Resistivity, ρ(H,T):
Does the H-field couple with spins or charge in the non-monotonic temperature regime?
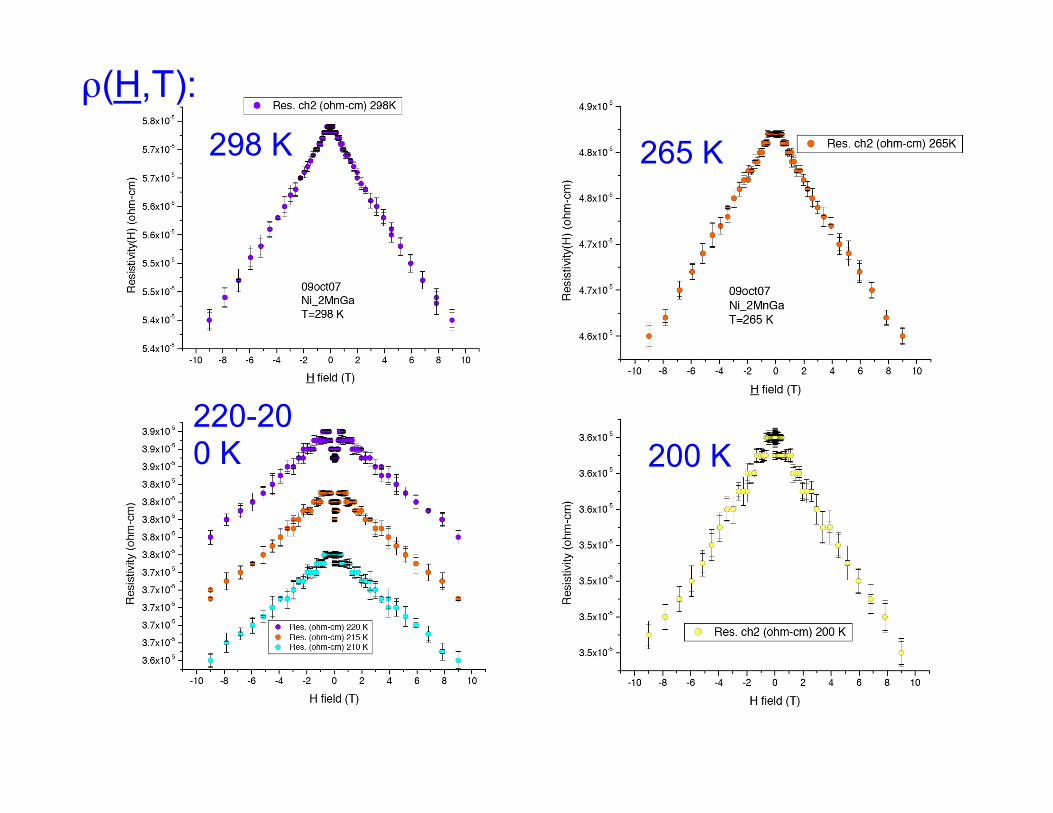
ρ(H,T): 298 K 265 K
200 K 220-200 K

ρ(H,T):
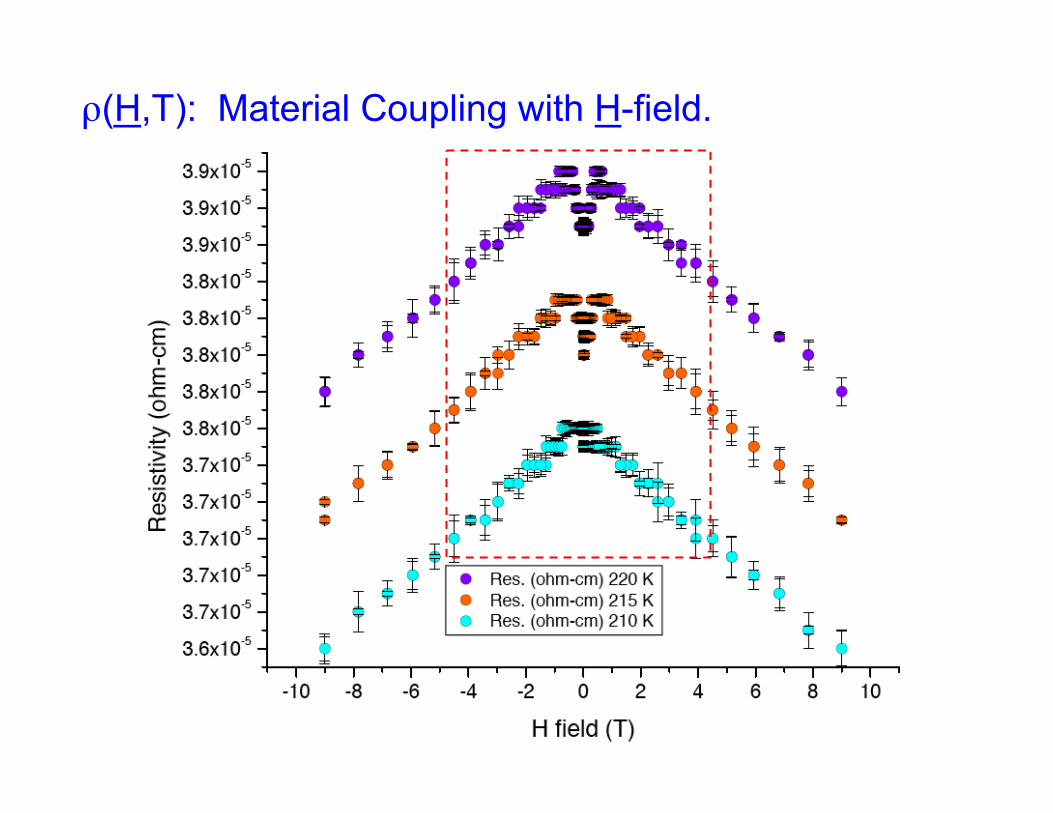
ρ(H,T): Material Coupling with H-field.
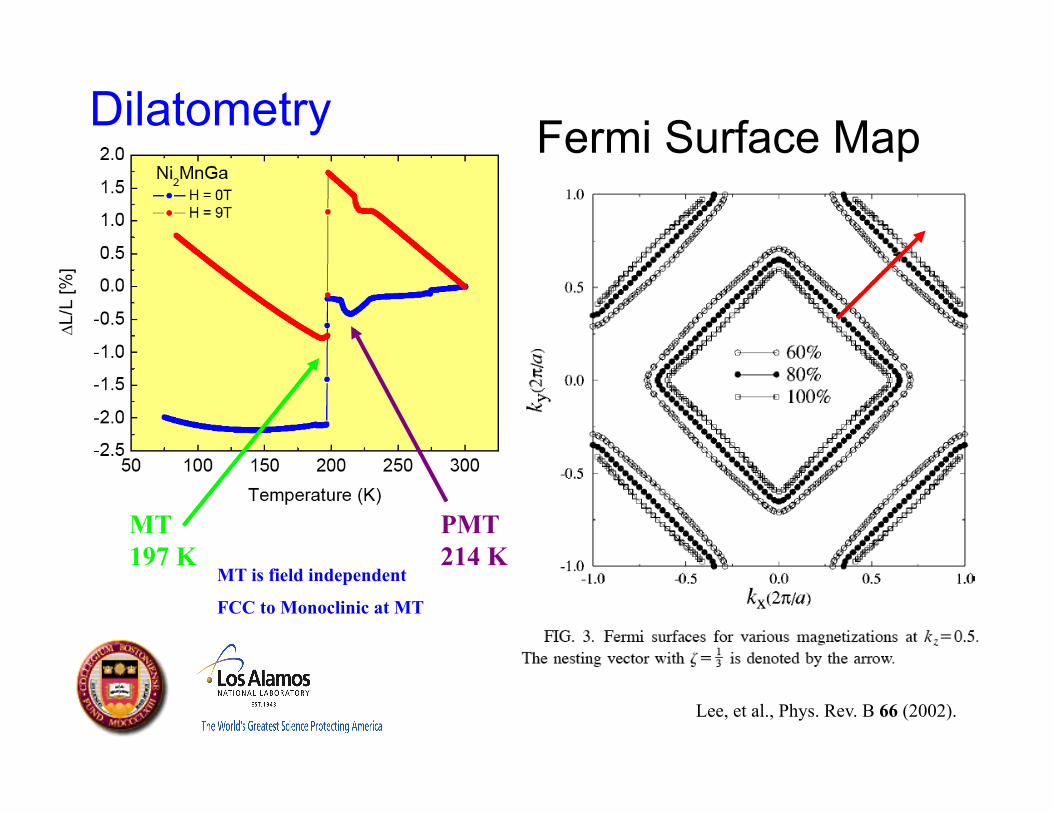
Dilatometry
MT 197 K
PMT 214 K
MT is field independent
FCC to Monoclinic at MT
Lee, et al., Phys. Rev. B 66 (2002).
Fermi Surface Map
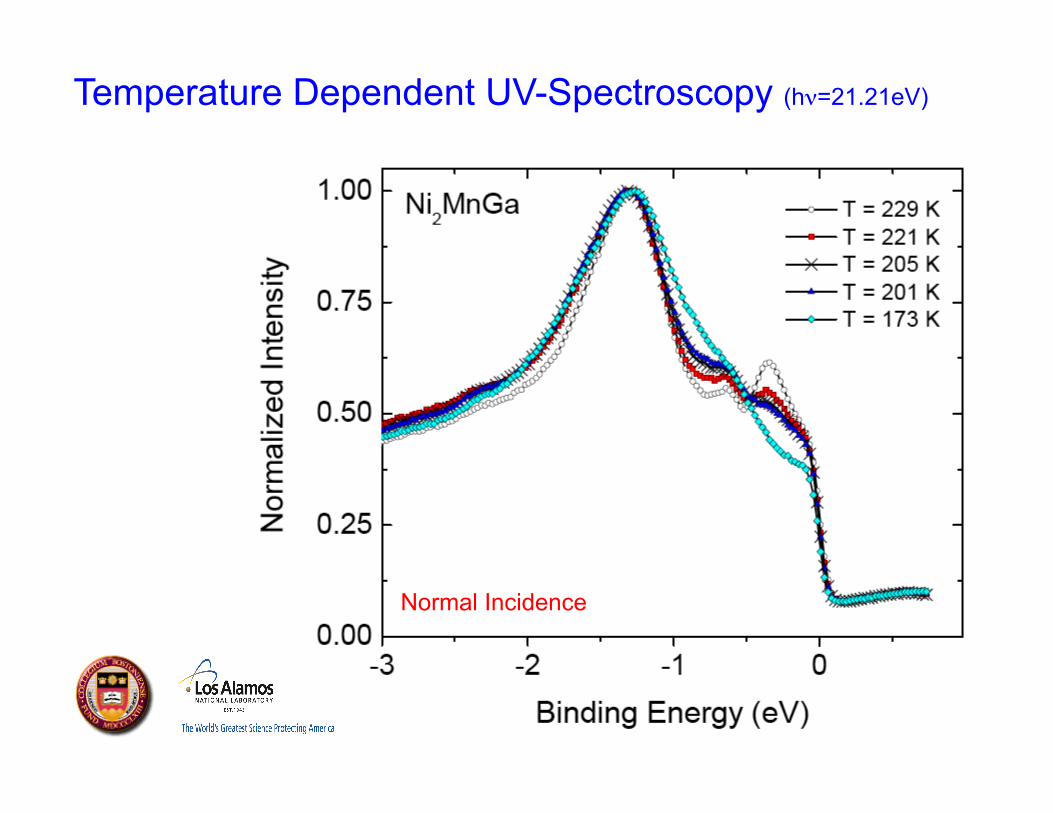
Temperature Dependent UV-Spectroscopy (hν=21.21eV)
Normal Incidence

Temperature Dependent UV-Spectroscopy (hν=21.21eV)
Normal Incidence

α-U(001) surface
surface normal e-
analyzer
(100) plane
φ
θ
ARPES - choose azimuthal θ to specify k-vector to probe, and then vary polar φ to collect DOS at various kII and observe dispersion of bands along k-vector
!
kII =2meEkinetic
2h
"sin#
!
Ekinetic = h" # e$#Ebinding
[100]
kX kY
kZ Z [001]
[010]
Brillouin zone orientation
ARPES: Angle Resolved Photoemission Spectroscopy
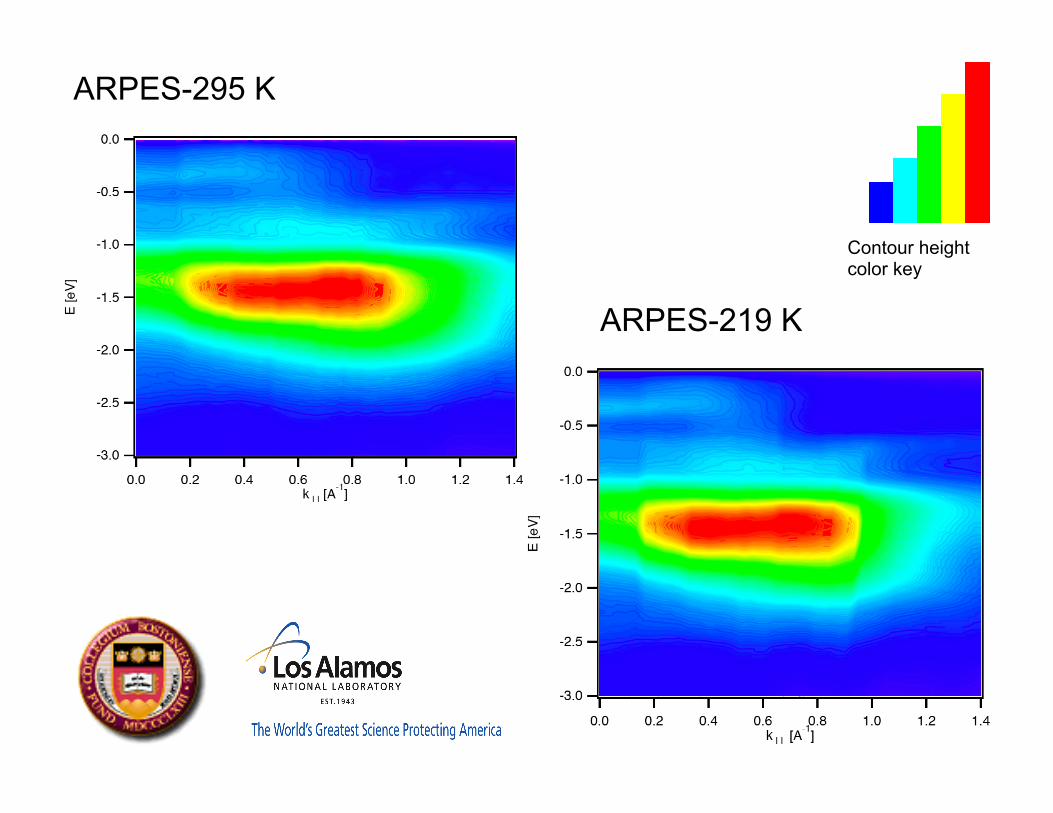
ARPES-295 K
ARPES-219 K
Contour height color key
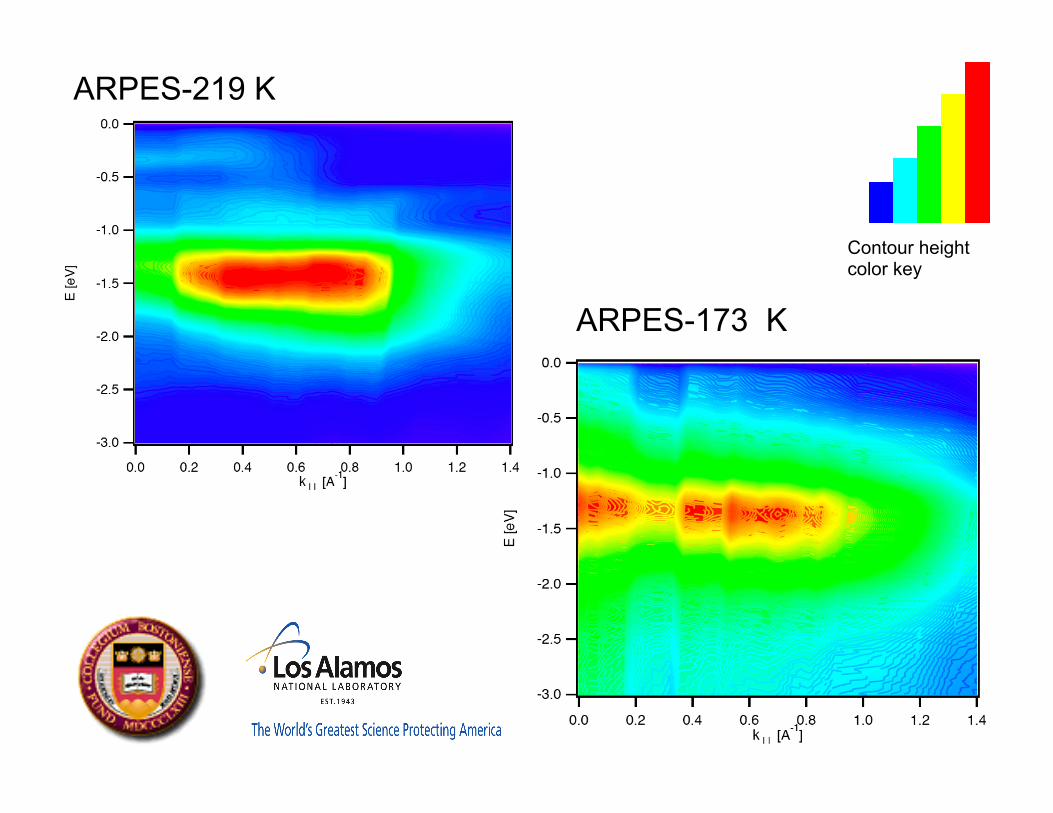
ARPES-219 K
ARPES-173 K
Contour height color key
-2.5 -2.0 -1.5 -1.0 -0.5 0.0 0.5
Eb [eV]
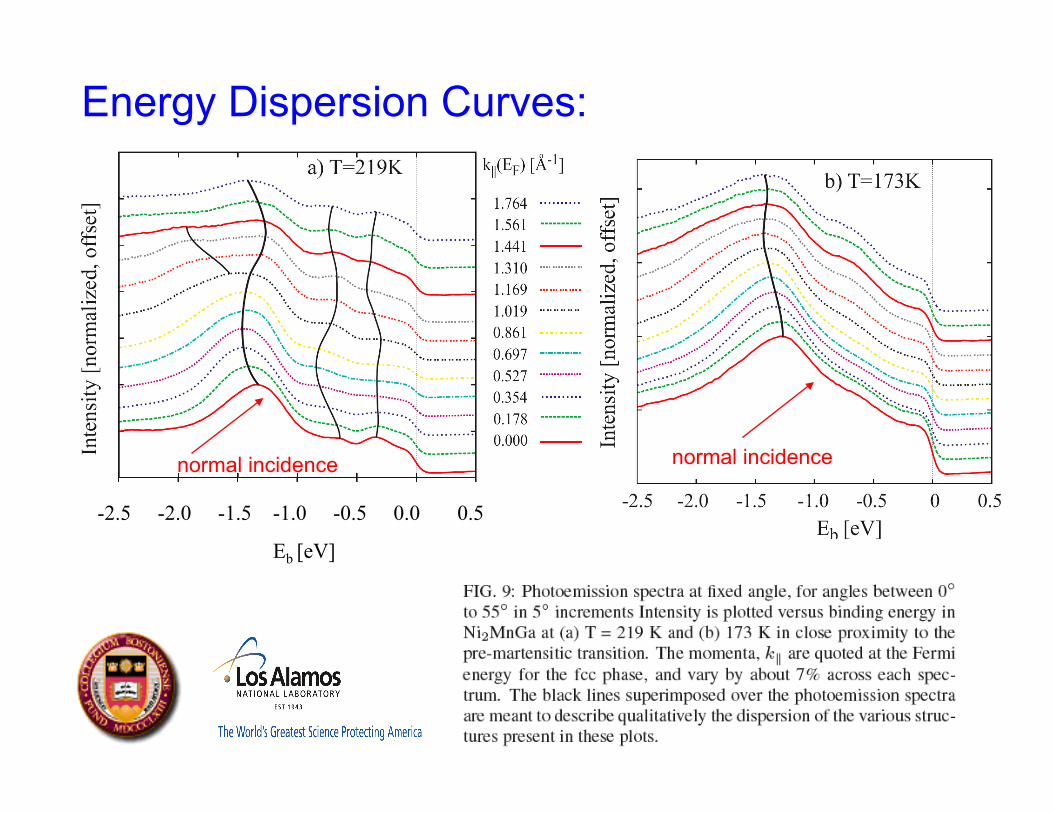
Energy Dispersion Curves:
normal incidence normal incidence
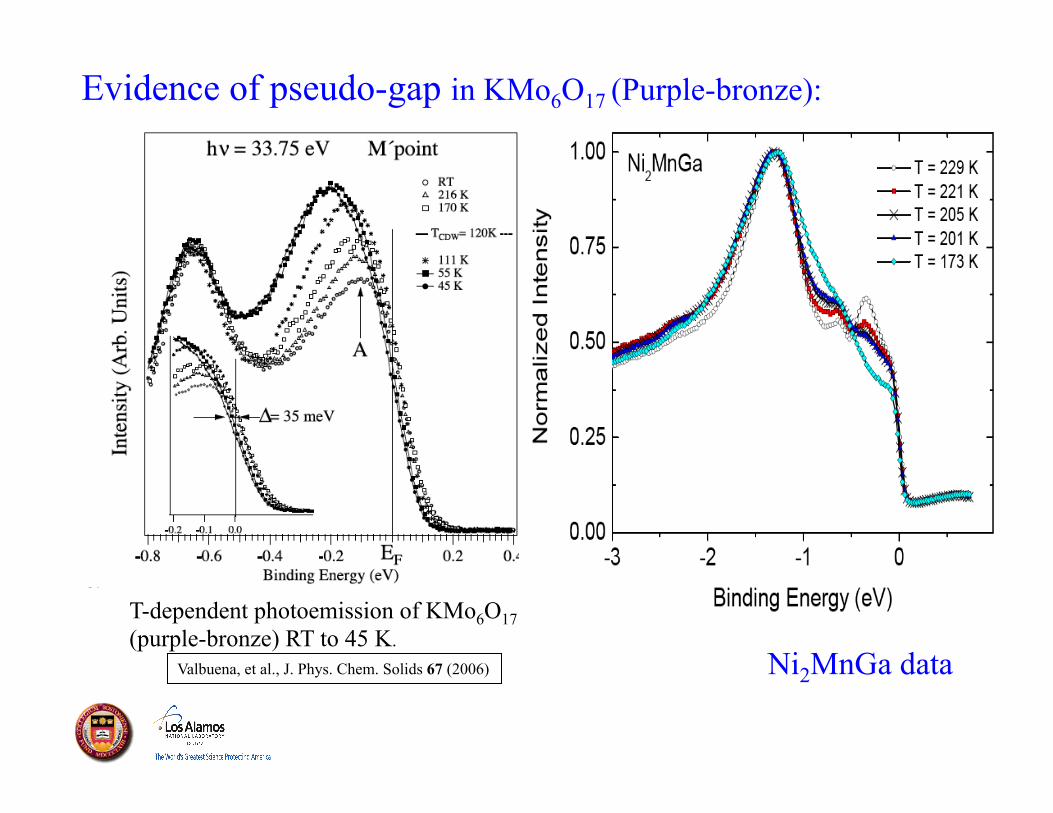
Evidence of pseudo-gap in KMo6O17 (Purple-bronze):
T-dependent photoemission of KMo6O17 (purple-bronze) RT to 45 K.
Valbuena, et al., J. Phys. Chem. Solids 67 (2006) Ni2MnGa data
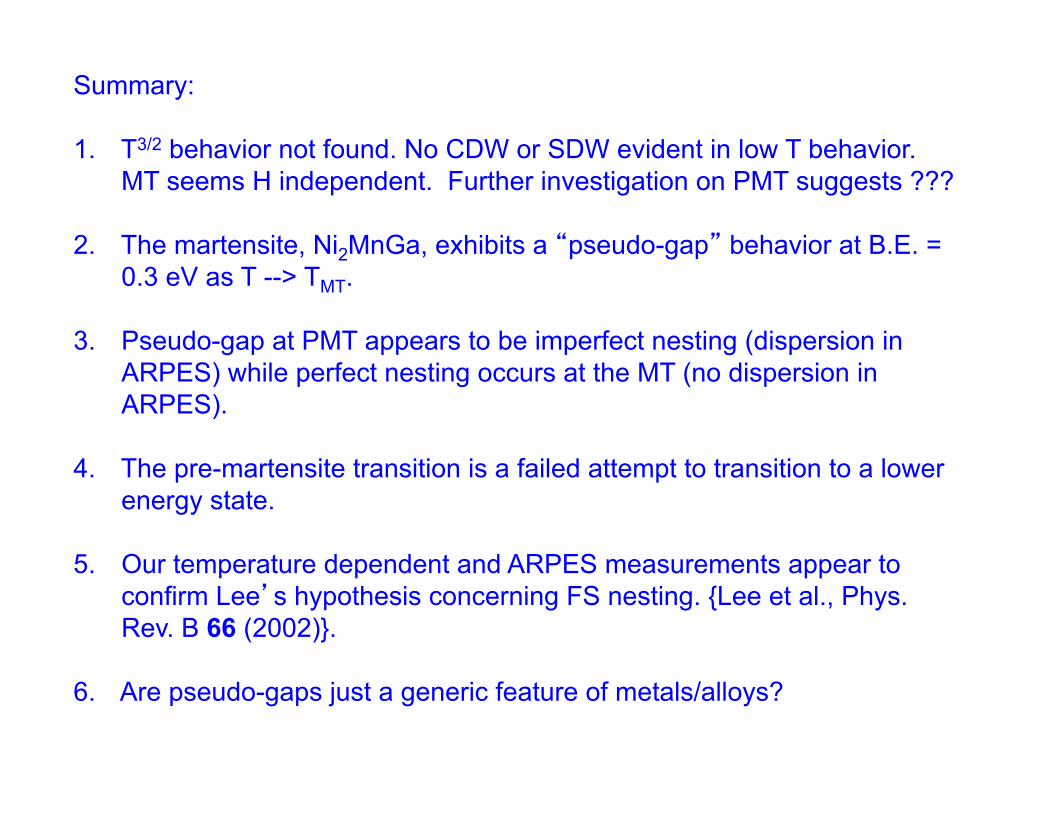
Summary: 1. T3/2 behavior not found. No CDW or SDW evident in low T behavior.
MT seems H independent. Further investigation on PMT suggests ??? 2. The martensite, Ni2MnGa, exhibits a “pseudo-gap” behavior at B.E. =
0.3 eV as T --> TMT.
3. Pseudo-gap at PMT appears to be imperfect nesting (dispersion in ARPES) while perfect nesting occurs at the MT (no dispersion in ARPES).
4. The pre-martensite transition is a failed attempt to transition to a lower energy state.
5. Our temperature dependent and ARPES measurements appear to confirm Lee’s hypothesis concerning FS nesting. {Lee et al., Phys. Rev. B 66 (2002)}.
6. Are pseudo-gaps just a generic feature of metals/alloys?


ARPES at (pi,0) for u-doped Bi2212, 90K Pseudo-gap state, 30K-SC state.
Norman et al., Adv. in Physics, 54 (2005)
Evidence of pseudo-gaps in other materials:
T-dependent photoemission of KMo6O17 (purple-bronze) RT to 45 K.
Valbuena, et al., J. Phys. Chem. Solids 67 (2006)
(b)

ARPES at (pi,0) for u-doped Bi2212, 90K Pseudo-gap state, 30K-SC state.
Norman et al., Adv. in Physics, 54 (2005)
Evidence of pseudo-gap in Bi2212:
Ni2MnGa data


Notes:
Above the MT temperature the bands appear to move and accommodate shifts in energy as it is removed from the system.
At the below the MT temperature the energy dispersion bands change little across k//, which suggests that the FS bands are flat and FS nesting is possible. Nesting of the FS bands allows the system to be reduced in energy, by a reduction of the number of states. This reduction in the allowed density of states is indicated by UV-photoemission as a pseudo-gap forming close (EB=0.3 eV) to the FE.
Comments: Slide 1. Thank you for coming to this talk this afternoon. My name is Cyril Opeil and I am from Boston College Discuss our observation of a pseudo-gap in the Heusler alloy, Ni2MnGa and what this means. Define pseudo-gap: a shift or change in the density of states in proximity to the Fermi edge. Many people have worked on this martensite material because they have industrial applications in actuators and magnetic memories. The rationale for this work is to better understand the martensite transition and the pre-martensite transition. The experimental method to probe this material is photoemission I want to begin by acknowledging my collegues Jason Lashley….. The work is sponsored by DOE and BC We see the crystal specimen used in the experiments. Because I am a Jesuit and priest, I want to put in a word for my other sponsor. There is some danger in doing photoemission on ferromagnetic materials. Often people have questions related to spin polarized data on these materials. We are looking all the density of states. spin polarized experiments on this material is the subject of another talk. Slide 2. In order to do photoemission we need to have a good crystal, here is the room temperature LEED picture indicating long range order of the crystal surface. The surface was prepared by polishing , and then in the spectrometer, Ar sputtering and annealing. To show that the bulk and surface are both well ordered cubic structures we show the Laue performed on our sample. We note that at room temperature it is cubic material. at the Martensite transition it goes from cubic to monoclinic in crystal structure. Here at the bottom right is the atomic stacking of Ni, Mn and Ga Slide 3. This material is well characterized, here we show the magnetic transition from paramagnetic to ferromagnetic ordering. The ordering for our sample starts at 370-380 K and is fully developed at about 275 K. Heat capacity measurements reveal the first order martensite transiton at a little less than 200, the PMT is a bit above 200. From the data we can calculate the debye temperature at about 325 K and the Einstein temperature is about 1500 K. Slide 4. To further characterize the sample we did dilatometry. we see clearly the PMT, a broad feature of about 15 degrees, centered at 214 K and the field independent MT at about 194 K. The reason we chose to do photoemission on this martensite is because of a hypothesis raised by Lee in 2002, physicsal review B. There thought was that the material at the MT undergoes Fermi surface nesting to lower the energy states. The red arrow denotes the direction along nesting may occur. We thought we might be able to see if this was true is we did temperature dependent photoemission. We took samples of the density of states as temperature is decreased., from room temperature down to 173 K. to check if a pseudo-gap develops.
5. Looking at temperature dependent UV photoemission from 229 to 173 K we see that over this 56 degree interval we note that we have a large density of states change. We note also that not much happens as the temperature is lowered through the PMT. The PMT is a failed attempted at nesting. the conditions of phonon softening, energy and crystal structure are not adequate for nesting to occur. One might think of the PMT as a breather mode that tries to nest but it can not. 6. Let's look at an enlarged version of this slide. We see energy versus intensity of the temperature dependent data. The red trace shows a large density of states at 0.3 eV which shifts significantly as we move through the martensite transition.to the black trace. pulling away from the Fermi edge. To confirm our evidence that we are looking at nesting we have to do ARPES and see how the energy dispersion curves as the angle is changed. 7. For those who are not familiar with ARPES. Here is the oriented crystal surface where the analyzer is fixed. We change the angle of the crystal surface, phi. 8. We show our results across the change in phi, which is the tilt angle of the crystal. Energy is along the vertical axis and K// is along the bottom of both graphs. k// is proportional to the tilt angle. We see that across the temperature range 295-219 K, over the 76 k interval, not much is happening. note the contour height (intensity) color key at the top, red is the highest, dark blue is lowest intensity 9. ARPES from 219 to 173K we note a dramatic change is the density of states over K// binding Energy is along the vertical axis, k// is along the horizontal axis. 10. Finally we see the energy dispersion curves at 219 K and 173 K We see at the left that there is a great deal of dispersion in the bands as we sweep over phi. This indicates that the Fermi surface fails to nest at the PMT. At the right we see ARPES at 173 K. it exhibits almost no dispersion while scanning phi form 0 to 55 degrees. This confirms that nesting occurs upon the Martensite transition. 11. other materials exhibit pseudo gaps whose origins are different. I have here examples of Bico 2212 and purple bronze. The reason I compare these data is to show how large the pseudo gap is in the case of the Ni2MnGa. 12. compare the energy axis for Bisco and Ni2MnGa 13. same as 12 comment. 14. summarize