
Service Desk Peer Group Sample Benchmark from MetricNet v2.1

Call Center Best PracticesThe Road to World Class Performance!
MetricNet Best Practices Series
1© MetricNet, LLC, www.metricnet.com
27 Years of Call Center Benchmarking Data
More than 3,700 Call Center Benchmarks
Global Database
30 Key Performance Indicators
Nearly 80 Industry Best Practices

2© MetricNet, LLC, www.metricnet.com
Growing importance of customer contact!
Every
Company
Faces
Increasing
Pressure
from
Numerous
Sources
Industry Consolidation
Increased Regulatory Scrutiny (e.g. SOX)
The emergence of virtual business
One-Stop Shopping
Shareholder pressure
Budgetary constraints
Increasingly demanding customers
Greater customer choice and leverage
An Industry in Transition
•
•
•
•
•
•

3© MetricNet, LLC, www.metricnet.com
Customer expectation is that you are available 24 X 7, and provide flawless service, on demand!
Yet most companies have minimal direct contact with their customers
JAN FEB MAR APR MAY JUN JUL AUG SEP OCT NOV DEC
8760 Hours
Customer Contact
7 - 22 minutes/yr.Moment of Truth Opportunity!
Customer Contact: A Critical Interface!

4© MetricNet, LLC, www.metricnet.com
Call center is a source of value creation
Customer contact is a company and product differentiator
Replacement for traditional brick & mortar facilities
Stay ahead of customer needs and expectations –proactive!
Goal is customer enthusiasm, and product differentiation
NEW PARADIGM
A Fundamental Shift
Call center is a support function
Customer contact is a necessary evil
Supplement to traditional bricks & mortar facilities
Play catch up with customer needs and expectations – reactive!
Goal is customer satisfaction
OLD PARADIGM
Building a Service-Based Competitive Advantage!

5© MetricNet, LLC, www.metricnet.com 5

6© MetricNet, LLC, www.metricnet.com
Call Centers Must Evolve to Survive
Progression along this dimension is critical to success Call centers that stay in one place too long risk
obsolescence The most effective call centers continually strive to add
more value by moving to the right along this axis World-class call centers also have specific plans for how
they will continuously improve the quality of contact with their customers
Customer needs
and
requirements
are evolving too
quickly
Continuously
differentiate the
underlying
products
supported
Staying ahead of
customer needs
and expectations
Competitors can exploit any
complacency marked by a call center’s failure to
evolve
Support Stage Transitional Stage Strategic Stage

7© MetricNet, LLC, www.metricnet.com
65%
30%5%
Support Stage Transitional Stage Strategic Stage
Traditional customer
contact paradigmThe call center makes a shift
from following the customer to
leading the customer
The call center operates in a non-traditional customer contact paradigm – every transaction adds value!
How Far Has Your Call Center Evolved?

8© MetricNet, LLC, www.metricnet.com
Data Comes from a Variety of Call Centers
More than 3,700 call centers worldwide From MetricNet’s Call Center Benchmarks
Industries include Banks and financial services
Telecommunications
Health Care
Hospitality
Insurance
Manufacturing
Retail
Transportation
Utilities
Best practices are relatively independent of industry At least 80% commonality from industry to industry

9© MetricNet, LLC, www.metricnet.com
Characteristics of a World-Class Call Center Call center consistently exceeds customer expectations – regardless of the
transaction type Result is high levels of customer satisfaction Call quality is consistently high
Business value is managed at or above industry average levels Cost per contact is below industry average levels Revenue generated is above industry average levels
Telemarketing and Telesales Debt collections
Call Center follows industry best practices Industry best practices are defined and documented Call Center follows industry best practices
Every transaction adds value A positive customer experience Improves customer loyalty Creates positive brand awareness and switching costs

10© MetricNet, LLC, www.metricnet.com
Cost per Contact
Qua
lity
HigherLower
Higher A World-Class Call Center
An “Average” Call Center
BEST-IN-CLASS PERFORMANCE CURVE
AVERAGE PERFORMANCE CURVE
The World-Class Call Center Defined
A Model for Best Practices:Measure, Diagnose, Prescribe, Implement!
11

12© MetricNet, LLC, www.metricnet.com
4
3
2
1
Customer
Enthusiasm
A Simple Model for Call Center Excellence
Measure
Diagnose
Prescribe
Implement
Model Component Description
1. MeasureMeasure performance on an ongoing basis
2. DiagnoseBenchmark performance and conduct gap analysis
3. PrescribeDefine actions to close the gap
4. ImplementImplement your action plan and improve performance

13© MetricNet, LLC, www.metricnet.com
Measure Your Performance!
Model Component Description
1. MeasureMeasure performance on an ongoing basis
2. DiagnoseBenchmark performance and conduct gap analysis
3. PrescribeDefine actions to close the gap
4. ImplementImplement your action plan and improve performance
4
3
2
1
Customer
Enthusiasm
Measure
Diagnose
Prescribe
Implement

14© MetricNet, LLC, www.metricnet.com
Two Types of Call Center Metrics
Measures operational efficiency and effectiveness of the call center
Internally focused Metrics include:
Cost per contact Customer satisfaction Speed of answer Agent utilization etc.
Operational Metrics
Business Effectiveness
Measures the call center’s effectiveness in supporting the company’s business mission Typically P&L or revenue
related Externally focused Metrics include:
Sales $ per call center FTE Collections $ per call
center FTE Call Center operating
expense as a % of Call Center revenue generated
Measure

15© MetricNet, LLC, www.metricnet.com
Some Common Operational Metrics
Cost per Contact Cost per Minute of Handle
Time
Cost Productivity
Service Level
Quality
Call HandlingAgent Average Speed of Answer
(ASA) Call Abandonment Rate % Answered in 30 Seconds
Agent Utilization Contacts per Agent per
Month Agents as a % of Total
Headcount
Customer Satisfaction Call Quality First Contact Resolution
Rate
Agent Occupancy Agent Turnover Daily Absenteeism New Agent Training Hours Annual Training Hours Schedule Adherence Agent Tenure Agent Job Satisfaction
Call Handle Time IVR completion rate
Measure
And there are hundreds more!!

16© MetricNet, LLC, www.metricnet.com
Two Paradigms for Call Center KPI’s
The Historical Approach The Holistic Approach
Measurement(75%)
Analysis(15%)
Prescription(7.5%)
Action(2.5%)
Measurement(5%)
Analysis(20%)
Prescription(30%)
Action(45%)
Incr
easi
ng V
alue
!
Measure

17© MetricNet, LLC, www.metricnet.com
Operational Metrics: Which Ones Really Matter?
Measure
Read MetricNet’s whitepaper on Call Center Performance Metrics. Go to www.metricnet.com to get your copy!
Cost per ContactCost
Productivity
Quality
Call Handling
Agent Utilization
Customer Satisfaction
First Contact Resolution Rate
Agent Agent Job Satisfaction
Aggregate Cost vs. Quality Balanced Scorecard

18© MetricNet, LLC, www.metricnet.com
Foundation Metrics: Cost vs. Quality
Measure
Lower CostCost (Efficiency)
Qua
lity
(Effe
ctiv
enes
s)
Top QuartileEfficient and Effective
Lower Quartile
Middle QuartilesEffective but not Efficient
Middle QuartilesEfficient but not Effective
Your Call CenterPeer Group
Higher Cost
Lower Quality
Higher Quality

Measure
The Balanced Scorecard
Step 1Five critical performance metrics have been selected for the scorecard
Step 2Each metric has been weighted according to its relative importance
Step 3For each performance metric, the highest and lowest performance levels in the benchmark are recorded
Step 4Your actual performance for each metric is recorded in this column
Step 5Your score for each metric is then calculated: (worst case – actual performance) / (worst case – best case) X 100
Step 6Your balanced score for each metric is calculated: metric score X weighting
19
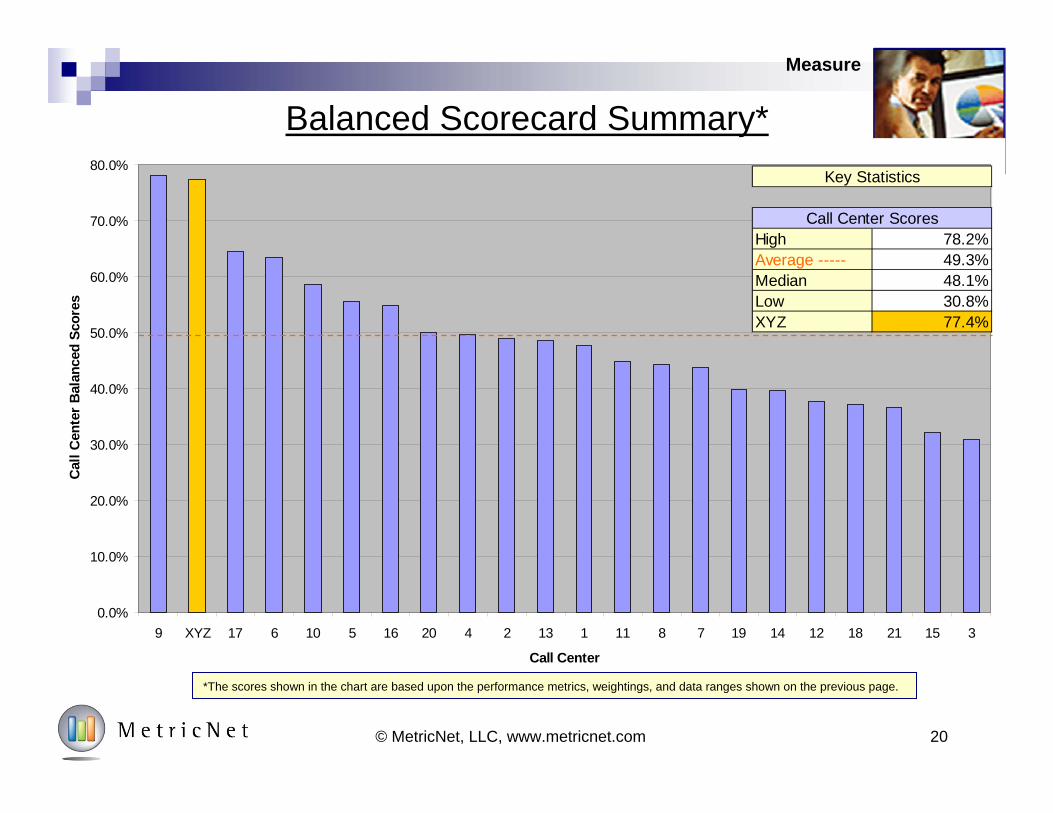
Worst Case Best CaseCost per Inbound Contact 25.0% $7.55 $3.33 $3.67 91.8% 23.0%Customer Satisfaction 30.0% 75.7% 91.2% 89.0% 85.8% 25.7%Agent Utilization 20.0% 47.5% 70.9% 66.1% 79.3% 15.9%Agent Job Satisfaction 15.0% 53.0% 93.3% 76.8% 59.1% 8.9%% of Calls Answered in 20 Seconds 10.0% 23.7% 75.3% 44.1% 39.5% 3.9%
Total 100.0% N/A N/A N/A N/A 77.4%
Balanced Score
Your Actual Performance
Metric Score
Performance RangeMetric WeightingPerformance Metric
0.0%
10.0%
20.0%
30.0%
40.0%
50.0%
60.0%
70.0%
80.0%
9 XYZ 17 6 10 5 16 20 4 2 13 1 11 8 7 19 14 12 18 21 15 3
Call Center
Cal
l Cen
ter
Bal
ance
d Sc
ores
20© MetricNet, LLC, www.metricnet.com
Balanced Scorecard Summary*
*The scores shown in the chart are based upon the performance metrics, weightings, and data ranges shown on the previous page.
High 78.2%Average ----- 49.3%Median 48.1%Low 30.8%XYZ 77.4%
Call Center Scores
Key Statistics
Measure

*Sample Only
40%
45%
50%
55%
60%
65%
70%
75%
80%
85%
Jan Feb Mar Apr May Jun Jul Aug Sep Oct Nov Dec
Cal
l Cen
ter B
alan
ced
Scor
e
12 Month Average Monthly Score
21© MetricNet, LLC, www.metricnet.com
Track and Trend Performance Using the Scorecard
Measure

22© MetricNet, LLC, www.metricnet.com
Business Effectiveness Metrics
Business effectiveness metrics are highly dependent upon the services you are offering No “standard” set of measures
Generally related to product sales, customer retention, and revenue production and/or recovery
Lots of room for creativity
Business effectiveness often trumps operational effectiveness Reflects a focus on revenue growth and recovery
Allows some “sloppiness” on the operational side if the call center
“Crossover Metrics” Cover both operational and business effectiveness
Operating cost as a % of revenue generated is common
Measure

23© MetricNet, LLC, www.metricnet.com
Some Common Business Effectiveness Metrics Cross-sell/upsell conversion rate (%) Number of Payment plans establishedCredit Card
Lending
CableTelevision
TelecomServices
Number of loans originated Average loan size and duration
Number of Appointments scheduled Product count for new accounts
Percent of billing inquiries resolved Customer cross-sell/upsell percentage
Retirement Products
Rollover IRA conversion rate (%) Number of Variable annuity accounts opened
Measure
Collections Average Balance Saved (ABS) Promises kept (%)

24© MetricNet, LLC, www.metricnet.com
Benchmark Your Performance!
Model Component Description
1. MeasureMeasure performance on an ongoing basis
2. DiagnoseBenchmark performance and conduct gap analysis
3. PrescribeDefine actions to close the gap
4. ImplementImplement your action plan and improve performance
4
3
2
1
Customer
Enthusiasm
Measure
Diagnose
Prescribe
Implement

25© MetricNet, LLC, www.metricnet.com
Your Call Center Performance
Performance of Benchmarking Peer
Group
Determine How Best in Class
Achieve Superiority
Adopt Selected Practices of
Best in Class
Build a Sustainable Competitive Advantage
The ultimate objective of
benchmarking
COMPARE
Diagnose
The Benchmarking Methodology
Read MetricNet’s whitepaper on Call Center Benchmarking. Go to www.metricnet.com to receive your copy!

26© MetricNet, LLC, www.metricnet.com
Cost per Contact
Qua
lity
HigherLower
Higher AFTER BENCHMARKING
STARTING POINT: BEFORE BENCHMARKING
BEST-IN-CLASS PERFORMANCE CURVE
AVERAGE PERFORMANCE CURVE
The Goal of Benchmarking
Diagnose

Benchmarking Performance Summary
Read MetricNet’s whitepaper on Benchmarking Peer Group Selection. Go to www.metricnet.com to get your copy!
Sample Data Only! Not Intended for Benchmarking Purposes!
Diagnose
Average Min Median MaxCost/Contact $28.17 $22.96 $6.59 $22.56 $38.44First Level Resolution Rate 59.0% 81.0% 59.0% 83.0% 88.0%Contacts/Agent-Month 429 504 373 487 699Agent Utilization 46.7% 53.1% 25.9% 53.9% 71.1%Average Speed of Answer (ASA) in seconds 18 45 12 34 187Percent Answered in 30 Seconds or Less 86.6% 72.1% 36.5% 71.3% 100.0%Call Abandonment Rate 2.9% 8.1% 1.4% 7.6% 25.2%Call Quality 68.4% 79.9% 43.8% 75.8% 94.5%Customer Satisfaction 63.0% 79.0% 41.9% 75.5% 96.6%Annual Agent Turnover 29.5% 31.7% 1.7% 26.4% 94.0%Daily Absenteeism 19.2% 13.2% 0.1% 13.0% 29.8%New Agent Training Hours 36 79 20 69 241Ongoing Agent Annual Training Hours 12 34 0 20 130Agent Satisfaction (% satisfied or very satisfied) 71.0% 75.4% 33.8% 70.1% 94.5%Agents as a Percent of Total FTE's 77.9% 70.5% 57.1% 69.3% 88.4%Contact Handle Time (min:sec) 12:41 11:18 2:47 9:34 19:55First Contct Resolution Rate 51.3% 71.2% 45.4% 67.8% 94.1%IVR Completion Rate 6.7% 22.0% 0.0% 18.9% 44.8%
Agent
Call Handling
Cost
Productivity
Service Level
Quality
Metric Type Key Performance Indicator (KPI)
Your Score
Peer Group
27© MetricNet, LLC, www.metricnet.com

28© MetricNet, LLC, www.metricnet.com
The Foundation Metrics: Cost and Quality
Cost/Contact(Efficiency)
Customer Satisfaction(Effectiveness)
Diagnose
29© MetricNet, LLC, www.metricnet.com
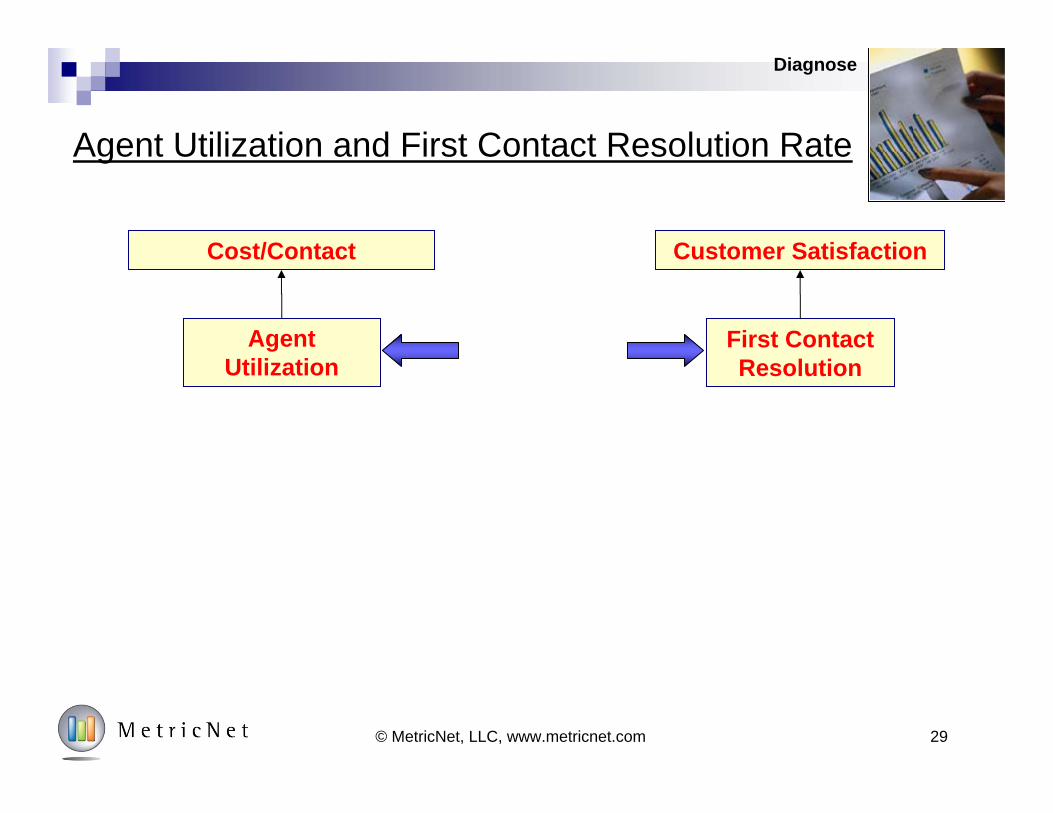
Agent Utilization and First Contact Resolution Rate
Cost/Contact Customer Satisfaction
Agent Utilization
First Contact Resolution
Diagnose

30© MetricNet, LLC, www.metricnet.com
Agent Utilization Drives Cost per Contact
$0
$5
$10
$15
$20
$25
$30
$35
$40
$45
20% 30% 40% 50% 60% 70% 80%
Agent Utilization
Cos
t per
Con
tact
Diagnose

31© MetricNet, LLC, www.metricnet.com
Agent Utilization Defined
Agent Utilization
((Average number of inbound calls handled by an agent in a month) X (Average inbound handle time in minutes) +
(Average number of outbound calls handled by an agent in a month) X (Average outbound handle time in minutes))
(Average number of days worked in a month) X (Number of work hours in a day) X (60 minutes/hr)
Agent Utilization is a measure of actual time worked by agents in a month, divided by total time at work during the month
It takes into account both inbound and outbound contacts handled by the agents But it does not make adjustments for sick days, holidays, training time, project
time, or idle time
=
Diagnose

Example: Call Center Agent Utilization
Inbound Contacts per Agent per Month = 375
Outbound Contacts per Agent per Month = 225
Average Inbound Contact Handle Time = 10 minutes
Average Outbound Contact Handle Time = 5 minutes
Agent Utilization
((375 Inbound Contacts per Month) X (10 minutes) + (225 Outbound Contacts per Month) X (5 minutes)
(21.5 working days per month) X (7.5 work hours per day) X (60 minutes/hr)= =
50.4% Agent
Utilization
Agent Utilization
((Average number of inbound Contacts handled by an Agent in a month) X (Average inbound handle time in minutes) +
(Average number of outbound Contacts handled by an Agent in a month) X (Average outbound handle time in minutes))
(Average number of days worked in a month) X (Number of work hours in a day) X (60 minutes/hr)=
32© MetricNet, LLC, www.metricnet.com
Diagnose

33© MetricNet, LLC, www.metricnet.com
First Contact Resolution Drives Customer Satisfaction
20%
40%
60%
80%
100%
20% 40% 60% 80% 100%
First Contact Resolution
Cus
tom
er S
atis
fact
ion
Diagnose
34© MetricNet, LLC, www.metricnet.com
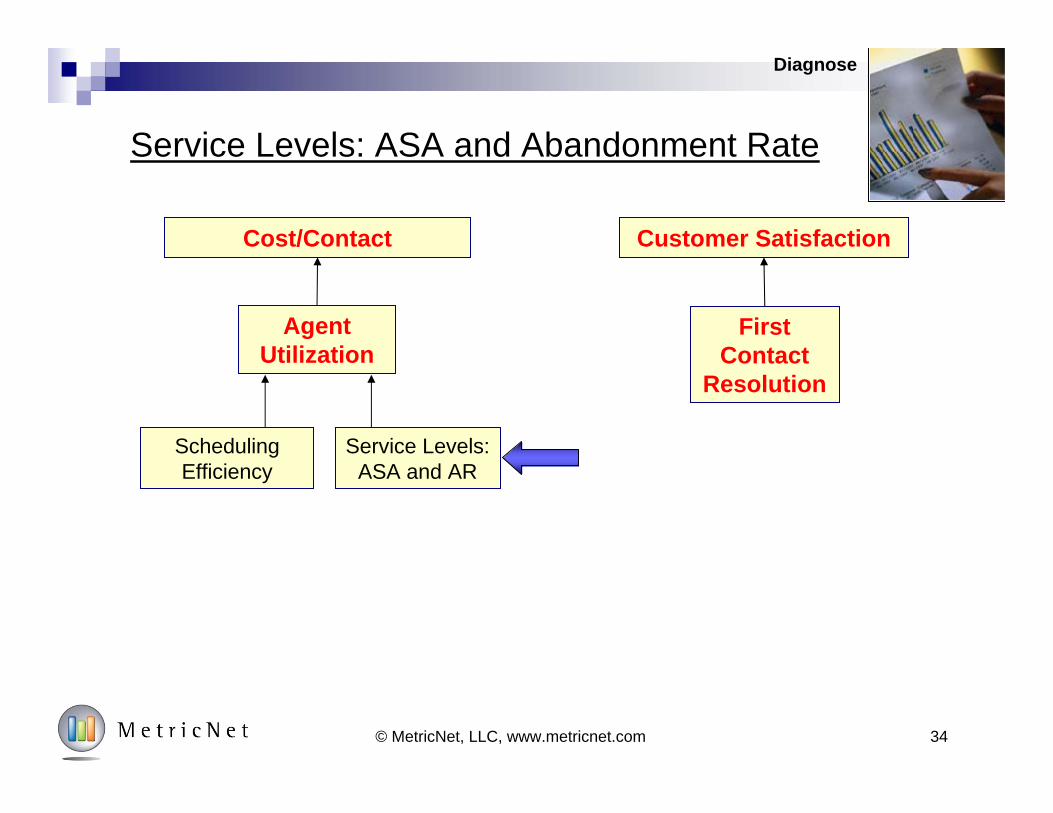
Service Levels: ASA and Abandonment Rate
Cost/Contact Customer Satisfaction
Agent Utilization
First Contact
Resolution
Scheduling Efficiency
Service Levels: ASA and AR
Diagnose

35© MetricNet, LLC, www.metricnet.com
ASA Drives Cost per Contact
$0.00
$5.00
$10.00
$15.00
$20.00
$25.00
$30.00
$35.00
$40.00
0 50 100 150 200 250
Average Speed of Answer (sec)
Cos
t per
Con
tact
Diagnose

36© MetricNet, LLC, www.metricnet.com
Call Abandonment Rate Also Drives Cost per Contact
$0.00$5.00
$10.00$15.00$20.00$25.00$30.00$35.00$40.00$45.00
0.0% 5.0% 10.0% 15.0% 20.0% 25.0% 30.0%
Call Abandonment Rate
Cos
t per
Con
tact
Diagnose

37© MetricNet, LLC, www.metricnet.com
ASA vs. Customer Satisfaction
0.0%
20.0%
40.0%
60.0%
80.0%
100.0%
0 5% 10% 15% 20%
ASA as a % of Total Handle Time
Cus
tom
er S
atis
fact
ion
Diagnose

38© MetricNet, LLC, www.metricnet.com
Call Abandonment Rate vs. Customer Sat
0.0%
20.0%
40.0%
60.0%
80.0%
100.0%
0.0% 5.0% 10.0% 15.0% 20.0% 25.0%
Call Abandonment Rate
Cus
tom
er S
atis
fact
ion
Diagnose

39© MetricNet, LLC, www.metricnet.com
Training Hours Impact First Contact Resolution Rate
Cost/Contact Customer Satisfaction
Agent Utilization
First Contact
Resolution
Training HoursScheduling Efficiency
Service Levels: ASA and AR
Diagnose

40© MetricNet, LLC, www.metricnet.com
New Agent Training Hours vs. First Contact Resolution
0%
10%
20%
30%
40%
50%60%
70%
80%
90%
100%
0 50 100 150 200 250 300 350
New Agent Training Hours
Firs
t Con
tact
Res
olut
ion
Rat
eDiagnose

41© MetricNet, LLC, www.metricnet.com
Annual Agent Training vs. First Contact Resolution
0%
10%
20%
30%
40%
50%60%
70%
80%
90%
100%
0 20 40 60 80 100 120 140
Annual Agent Training Hours
Firs
t Con
tact
Res
olut
ion
Rat
eDiagnose

42© MetricNet, LLC, www.metricnet.com
Agent Satisfaction
Cost/Contact Customer Satisfaction
Agent Utilization
First Contact
Resolution
Agent Satisfaction
Absenteeism/Turnover
Scheduling Efficiency
Service Levels: ASA and AR
Diagnose

43© MetricNet, LLC, www.metricnet.com
Agent Satisfaction Impacts Customer Satisfaction
20%
30%
40%
50%
60%
70%
80%
90%
100%
50% 55% 60% 65% 70% 75% 80% 85% 90% 95% 100%
Agent Satisfaction
Cus
tom
er S
atis
fact
ion
Diagnose
44© MetricNet, LLC, www.metricnet.com
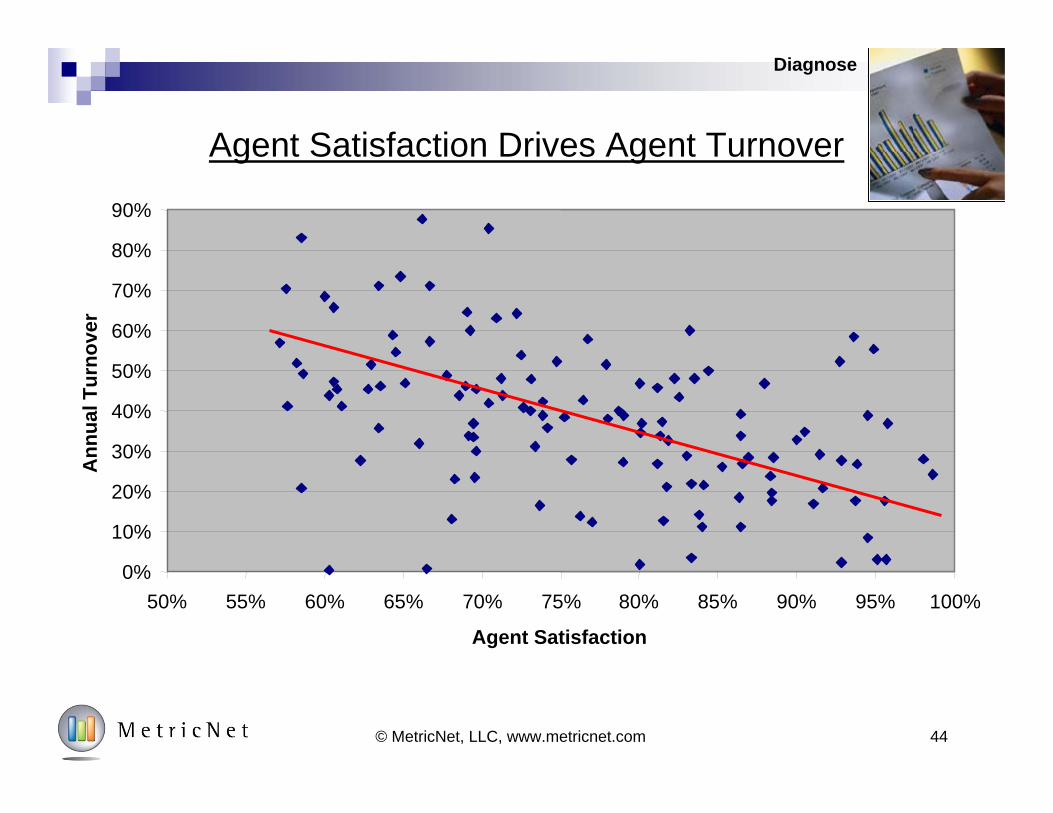
Agent Satisfaction Drives Agent Turnover
0%
10%
20%
30%
40%
50%
60%
70%
80%
90%
50% 55% 60% 65% 70% 75% 80% 85% 90% 95% 100%
Agent Satisfaction
Ann
ual T
urno
ver
Diagnose
45© MetricNet, LLC, www.metricnet.com
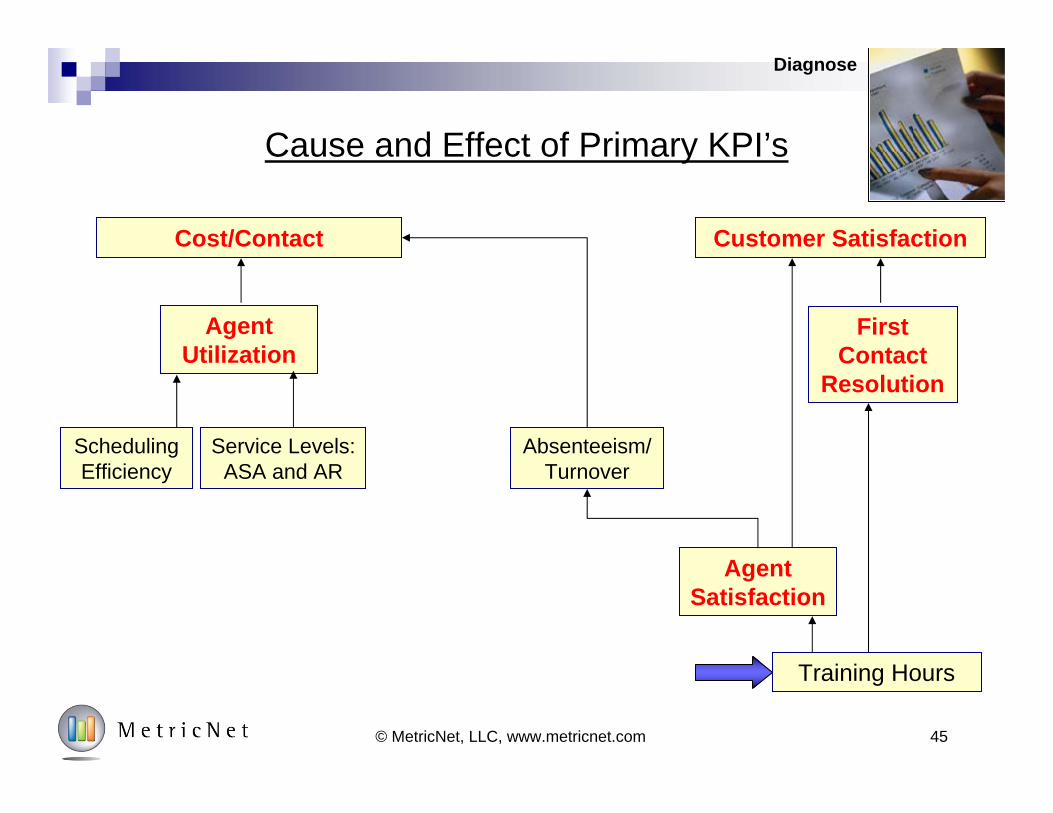
Cause and Effect of Primary KPI’s
Cost/Contact Customer Satisfaction
Agent Utilization
First Contact
Resolution
Agent Satisfaction
Training Hours
Absenteeism/Turnover
Scheduling Efficiency
Service Levels: ASA and AR
Diagnose
46© MetricNet, LLC, www.metricnet.com
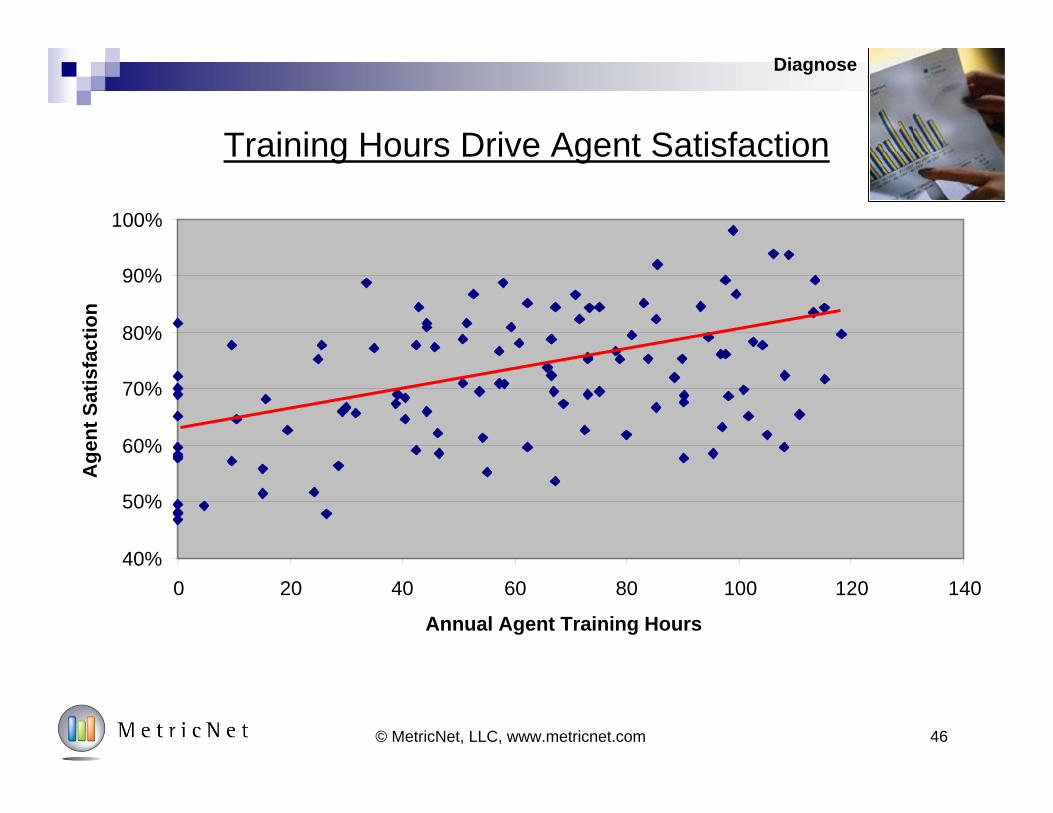
Training Hours Drive Agent Satisfaction
40%
50%
60%
70%
80%
90%
100%
0 20 40 60 80 100 120 140
Annual Agent Training Hours
Age
nt S
atis
fact
ion
Diagnose
47© MetricNet, LLC, www.metricnet.com
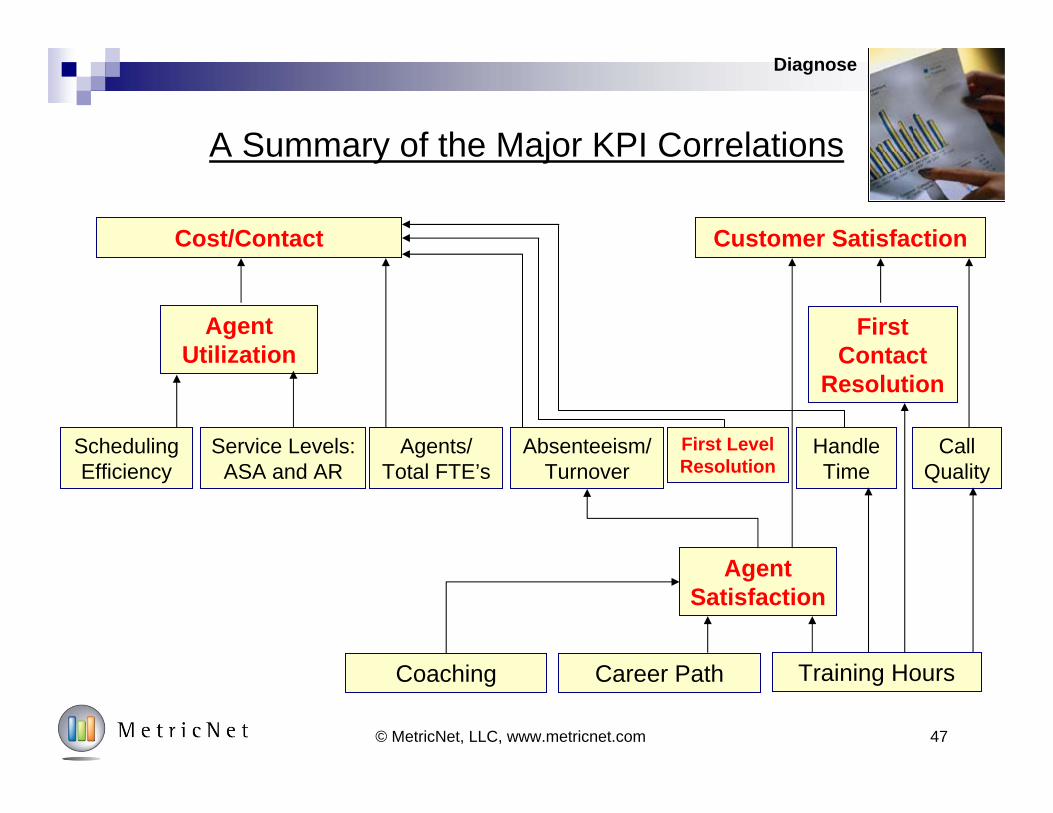
A Summary of the Major KPI Correlations
Cost/Contact Customer Satisfaction
Agent Utilization
First Contact
Resolution
Agent Satisfaction
Coaching Career Path Training Hours
Call Quality
HandleTime
Agents/Total FTE’s
Absenteeism/Turnover
First Level Resolution
Scheduling Efficiency
Service Levels: ASA and AR
Diagnose

Benchmarking Performance SummarySample Data Only! Not Intended for Benchmarking Purposes!
Diagnose
Average Min Median MaxCost/Contact $28.17 $22.96 $6.59 $22.56 $38.44First Level Resolution Rate 59.0% 81.0% 59.0% 83.0% 88.0%Contacts/Agent-Month 429 504 373 487 699Agent Utilization 46.7% 53.1% 25.9% 53.9% 71.1%Average Speed of Answer (ASA) in seconds 18 45 12 34 187Percent Answered in 30 Seconds or Less 86.6% 72.1% 36.5% 71.3% 100.0%Call Abandonment Rate 2.9% 8.1% 1.4% 7.6% 25.2%Call Quality 68.4% 79.9% 43.8% 75.8% 94.5%Customer Satisfaction 63.0% 79.0% 41.9% 75.5% 96.6%Annual Agent Turnover 29.5% 31.7% 1.7% 26.4% 94.0%Daily Absenteeism 19.2% 13.2% 0.1% 13.0% 29.8%New Agent Training Hours 36 79 20 69 241Ongoing Agent Annual Training Hours 12 34 0 20 130Agent Satisfaction (% satisfied or very satisfied) 71.0% 75.4% 33.8% 70.1% 94.5%Agents as a Percent of Total FTE's 77.9% 70.5% 57.1% 69.3% 88.4%Contact Handle Time (min:sec) 12:41 11:18 2:47 9:34 19:55First Contct Resolution Rate 51.3% 71.2% 45.4% 67.8% 94.1%IVR Completion Rate 6.7% 22.0% 0.0% 18.9% 44.8%
Agent
Call Handling
Cost
Productivity
Service Level
Quality
Metric Type Key Performance Indicator (KPI)
Your Score
Peer Group
48© MetricNet, LLC, www.metricnet.com
Read MetricNet’s whitepaper on Benchmarking Peer Group Selection. Go to www.metricnet.com to get your copy!

49© MetricNet, LLC, www.metricnet.com
Prescribe Actions to Close the Gap!
Model Component Description
1. MeasureMeasure performance on an ongoing basis
2. DiagnoseBenchmark performance and conduct gap analysis
3. PrescribeDefine actions to close the gap and improve performance
4. ImplementImplement your action plan
4
3
2
1
Customer
Enthusiasm
Measure
Diagnose
Prescribe
Implement

50© MetricNet, LLC, www.metricnet.com
Best Practices: Performance Measurement
Prescribe
Performance Measurement:Best Demonstrated Practices
Affected KPI’s
Cost/C
all
Custom
er Sat
Utilization
First Call R
es
Call Q
uality
Handle Tim
e
Turnover
Business Effectiveness
Metrics, goals, diagnosis and accountability
Performance metrics and goals drive individual accountability and facilitate diagnosis of performance strengths, issues, gaps and call quality improvements.
Cost and customer
satisfaction
Cost and customer satisfaction results measure efficiency and effectiveness, and are two critical indicators for call center operations.
Formal measurements & performance
compliance
Performance measurement is a rigorous discipline assigned to a particular individual or individuals in the call center to ensure service level compliance and consistency in the delivery of customer service .
Balanced scorecard
A balanced scorecard provides an aggregate measure of call center performance.
Management Reporting
Reporting is targeted and timed to have maximum impact on key individuals and stakeholder groups in the company.

51© MetricNet, LLC, www.metricnet.com
Human Resources:Best Demonstrated Practices
Affected KPI’s
Cost/C
all
Custom
er Sat
Utilization
First Call R
es
Call Q
uality
Handle Tim
e
Turnover
Business Effectiveness
Recruit-ment
Recruiting is a rigorous and holistic process that measures specific agent competencies, and matches those competencies to the needs of the call center.
Training
Rigorous and formalized training is available for both new and seasoned agents. Training is customized to meet the needs of each agent, and is designed to meet the strategic goals of the call center.
Career Pathing
Career paths have been formalized and documented, and often include vertical as well as lateral promotion opportunities. Performance levels required for advancement are clearly articulated. Agents are encouraged to take charge of their own career and skills development.
Retention
Formal strategies are employed to maximize employee retention. These strategies are designed to improve employee job satisfaction and loyalty, thereby maximizing agent morale and minimizing turnover.
Coaching and
Feedback
Call center management demonstrates commitment to continuous improvement by conducting frequent, one-on-one coaching to each agent, and by providing specific suggestions for improvement andsetting attainable goals.
Perform-ance
Standards
Call center agents are held accountable for minimum performance standards with incentives for surpassing, and disincentives for falling short of the standard. Performance goals cover both quality andproductivity.
Best Practices: Human Resources
Prescribe
51

52© MetricNet, LLC, www.metricnet.com
Best Practices: Call Handling Practices
Prescribe
Call Handling Practices:Best Demonstrated Practices
Affected KPI’s
Cost/C
all
Custom
er Sat
Utilization
First Call R
es
Call Q
uality
Handle Tim
e
Turnover
Business Effectiveness
StandardizationCall handling processes are repeatable and standardized, while still allowing for agent judgment and experience.
Call Volume Management
Call handling strategies, such as call reduction through “Load Shedding,” call “Channeling,” forecasting and aggressive staffing strategies are utilized to predict and proactively handle the variance in call volumes.
Measurement Management
Call centers must aggressively pursue and identify meaningful performance indicators, measure and report against them and analyze the results for significant trend analysis.
Continuous Improvement
Call center has a true culture of excellence through continuous improvement in the delivery of customer services.
Customer-Centricity
Improved customer satisfaction, accessibility and usability are the primary design drivers in the call center.
53© MetricNet, LLC, www.metricnet.com
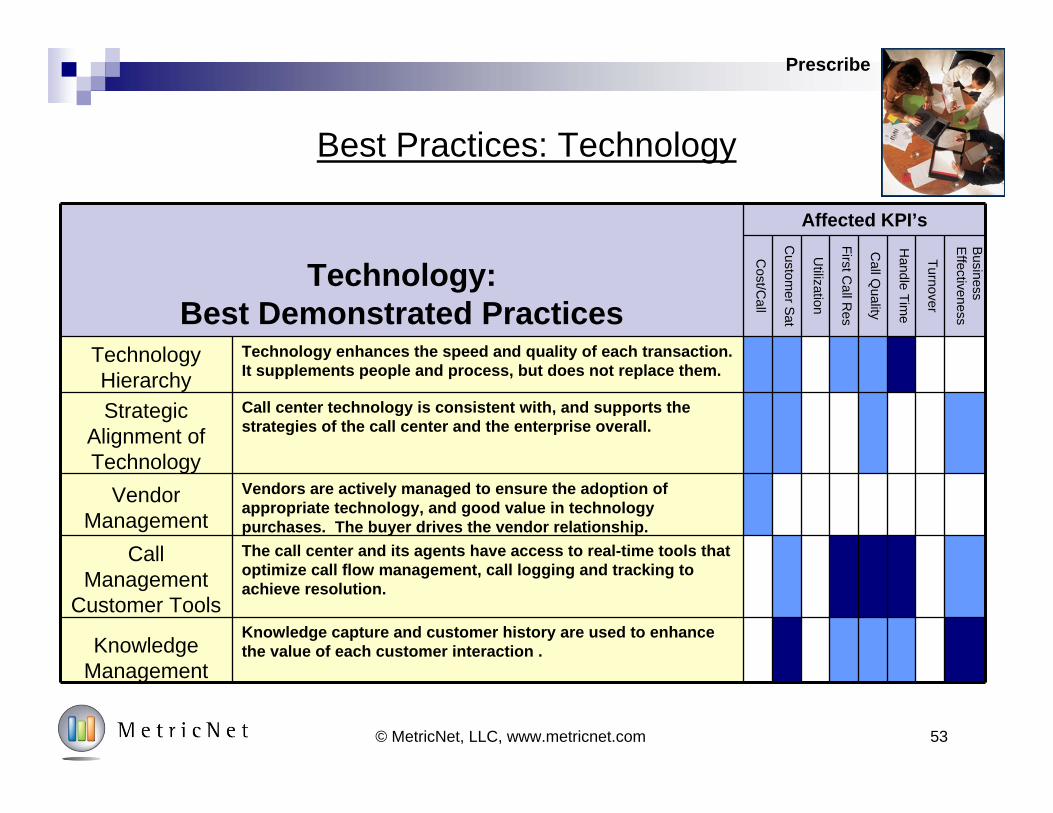
Best Practices: Technology
Prescribe
Technology:Best Demonstrated Practices
Affected KPI’s
Cost/C
all
Custom
er Sat
Utilization
First Call R
es
Call Q
uality
Handle Tim
e
Turnover
Business Effectiveness
Technology Hierarchy
Technology enhances the speed and quality of each transaction. It supplements people and process, but does not replace them.
Strategic Alignment of Technology
Call center technology is consistent with, and supports the strategies of the call center and the enterprise overall.
Vendor Management
Vendors are actively managed to ensure the adoption of appropriate technology, and good value in technology purchases. The buyer drives the vendor relationship.
Call Management
Customer Tools
The call center and its agents have access to real-time tools that optimize call flow management, call logging and tracking to achieve resolution.
Knowledge Management
Knowledge capture and customer history are used to enhance the value of each customer interaction .

54© MetricNet, LLC, www.metricnet.com
Implement Your Action Plan!
Model Component Description
1. MeasureMeasure performance on an ongoing basis
2. DiagnoseBenchmark performance and conduct gap analysis
3. PrescribeDefine actions to close the gap
4. ImplementImplement your action plan and improve performance
4
3
1
Customer
Enthusiasm
Measure
Diagnose
Prescribe
Implement
2

55© MetricNet, LLC, www.metricnet.com
The Key to Improvement is to Take Action!
Call Center Best Practices is a Holistic Discipline
Near Term Goal Improved Performance
Ultimate Goal World-Class Performance
The Key to Getting Results is to Take Action!
Implement

56© MetricNet, LLC, www.metricnet.com
Create a balanced scorecard
Document agent career path options
Define agent performance standards
Implement call monitoring
Now Implement Your Action Plan!
Implement
JAN FEB MAR APR MAY JUN JUL AUG SEP OCT NOV DEC
Document call handling standards
Begin customer sat surveys
Establish root cause anal-ysis program
Rewrite IVR menus
Support Stage Transitional Stage Strategic Stage

High
Med
Low
URGENCY
RELA
T IVE
CO
ST
RELATIVE IMPACT HigherLower
Higher
10 1
68
94
Prioritizing Your Action Plan
Implement
2
5
3
7
57© MetricNet, LLC, www.metricnet.com

58
And Establish Performance Goals
© MetricNet, LLC, www.metricnet.com
Define KPIs to track and trend
Measure baseline performance
Establish "stretch" goals for each KPI
Measure performance at least monthly
Post performance trends and periodically reset goals
Implement
DOMAIN PERFORMANCE METRIC
CURRENTPERFORMANCE
PERFORMANCEGOAL
Cost per Contact $27.90 $21.00
Customer Satisfaction 71% 80%
Agent Utilization 49% 60%
First Contact Resolution 61% 70%
Agent Satisfaction 56% 75%
Balanced Score 52% 70%
Customer Satisfaction By Individual 85%
Number of Contacts Handled per Month By Individual 650
Call Quality By Individual 90 out of 100
First Contact Resolution By Individual 75%
Call Center
Agent

59© MetricNet, LLC, www.metricnet.com
Implement
The CSR Scorecard
Worst Case Best CaseInbound Contacts Handled 25.0% 350 550 447 48.7% 12.2%Customer Satisfaction 20.0% 60.0% 95.0% 90.0% 85.7% 17.1%Technician Utilization 15.0% 30.0% 60.0% 41.5% 38.4% 5.8%First Contact Resolution Rate 15.0% 60.0% 90.0% 85.0% 83.3% 12.5%Teamwork 10.0% 1 5 4 75.0% 7.5%Initiative 10.0% 1 5 3 50.0% 5.0%Mentoring 5.0% 1 5 5 100.0% 5.0%
Total 100.0% N/A N/A N/A N/A 65.1%
Metric Score
Balanced ScorePerformance Metric
Metric Weighting
Benchmark Performance Range Your Actual
Performance
59© MetricNet, LLC, www.metricnet.com
Step 1Seven critical performance metrics have been selected for the scorecard
Step 3For each performance metric, the highest and lowest performance levels in the benchmark are recorded
Step 4The technician’s actual performance for each metric is recorded in this column
Step 5The technician’s score for each metric is then calculated: (worst case – actual performance) / (worst case –best case) X 100
Step 6The technician’s balanced score for each metric is calculated: metric score X weighting
Step 2Each metric has been weighted according to its relative importance
59

Monthly Agent Performance PostingsSep Aug Jul Jun May Apr
11 1 95.8% 98.0% 97.1% 95.7% 98.3% 97.3% 97.0%32 2 92.8% 92.1% 90.3% 89.3% 84.6% 92.2% 90.2%21 3 91.5% 88.5% 83.2% 94.0% 93.7% 93.5% 90.7%35 4 91.0% 86.8% 85.2% 78.5% 80.5% 68.2% 81.7%14 5 89.5% 89.1% 90.0% 90.1% 92.3% 92.1% 90.5%26 6 83.8% 84.4% 90.2% 86.5% 77.8% 63.9% 81.1%25 7 83.0% 73.6% 81.9% 72.1% 84.8% 87.9% 80.5%15 8 70.4% 66.6% 53.3% 56.3% 56.6% 39.0% 57.0%20 9 64.9% 66.5% 70.1% 56.9% 40.9% 72.7% 62.0%31 10 62.3% 47.4% 22.7% 38.4% 26.0% 93.0% 48.3%16 11 61.0% 62.8% 54.5% 45.9% 41.7% 62.7% 54.8%17 12 57.9% 42.1% 32.3% 71.6% 60.3% 60.3% 54.1%33 13 56.8% 75.5% 64.8% 80.3% 79.7% 73.5% 71.8%13 14 52.2% 34.9% 61.0% 52.8% 58.9% 48.7% 51.4%24 15 48.9% 66.7% 86.9% 87.7% 83.6% 74.5% 74.7%28 16 46.4% 45.5% 19.3% 40.3% 28.8% 32.4% 35.4%27 17 43.7% 26.5% 31.5% 24.3% 22.2% 17.2% 27.6%19 18 41.5% 28.4% 50.1% 48.1% 71.1% 81.0% 53.4%23 19 39.1% 52.3% 57.1% 86.4% 87.7% 88.9% 68.6%22 20 36.8% 18.7% 19.3% 52.9% 66.4% 64.3% 43.1%12 21 36.6% 43.2% 33.1% 65.7% 69.0% 86.0% 55.6%30 22 36.3% 22.6% 23.5% 85.8% 81.5% 70.3% 53.3%29 23 34.1% 44.9% 50.2% 28.3% 48.9% 36.9% 40.5%34 24 33.4% 37.9% 23.1% 21.7% 29.7% 22.6% 28.0%18 25 32.6% 68.4% 80.4% 88.4% 83.8% 91.6% 74.2%
59.3% 58.5% 58.0% 65.5% 66.0% 68.4% 62.6%
Monthly Ranking
Monthly Average
Technician Number
Monthly Scorecard Performance Six Month Average
Implement
Agent
60© MetricNet, LLC, www.metricnet.com
61© MetricNet, LLC, www.metricnet.com
4
3
2
1
Customer
Enthusiasm
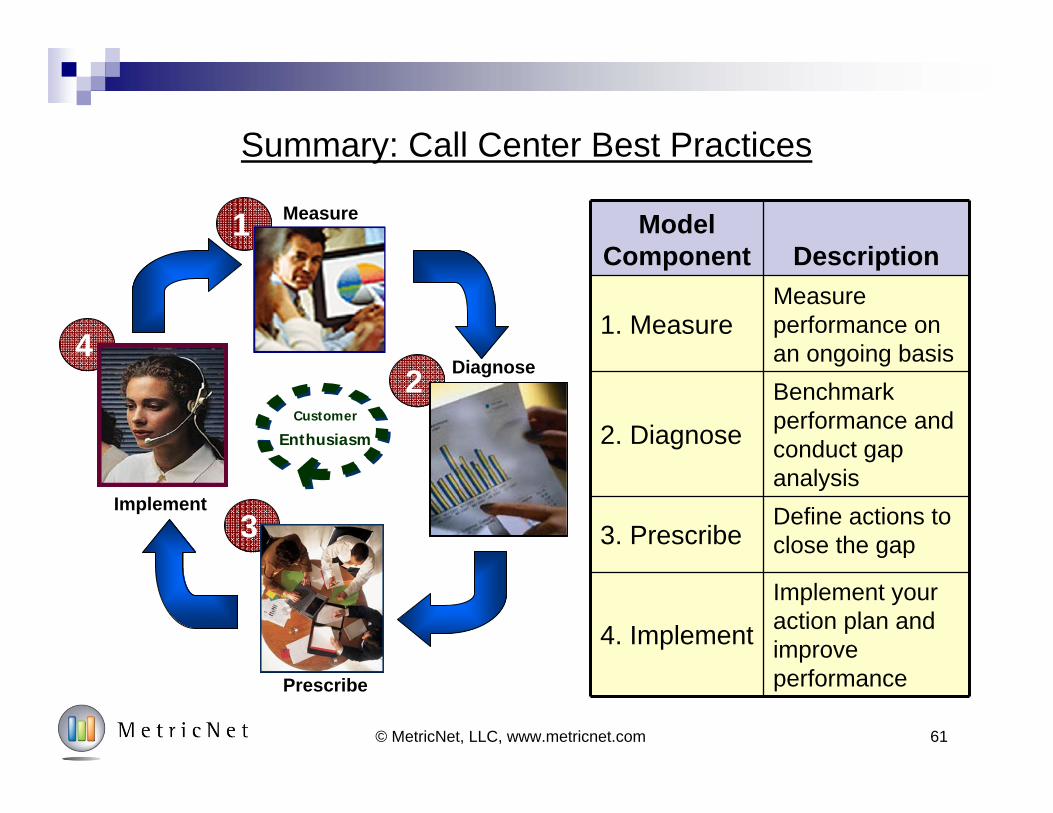
Summary: Call Center Best Practices
Measure
Diagnose
Prescribe
Implement
Model Component Description
1. MeasureMeasure performance on an ongoing basis
2. DiagnoseBenchmark performance and conduct gap analysis
3. PrescribeDefine actions to close the gap
4. ImplementImplement your action plan and improve performance

The Traditional Paradigm for Call Centers
PEOPLE
PROCESS
TECH
62© MetricNet, LLC, www.metricnet.com
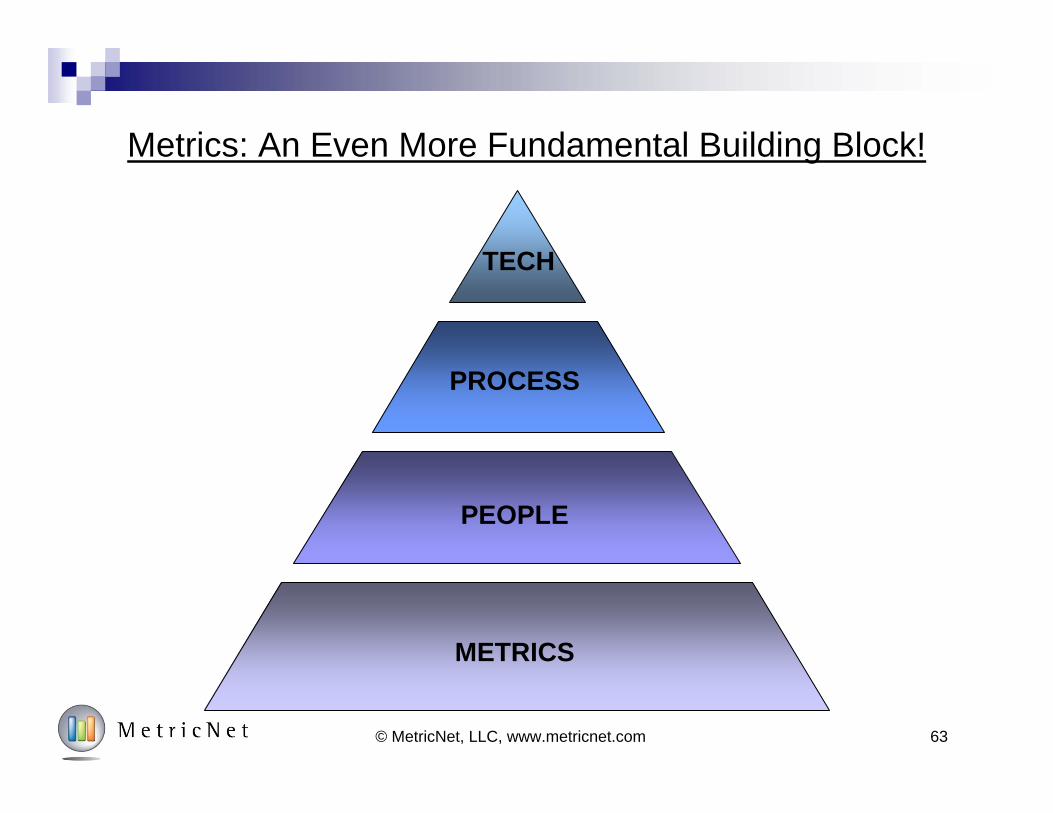
Metrics: An Even More Fundamental Building Block!
METRICS
PEOPLE
PROCESS
TECH
63© MetricNet, LLC, www.metricnet.com

n = 143
64© MetricNet, LLC, www.metricnet.com
10%
20%
30%
40%
50%
60%
70%
80%
90%
100%
1 2 3 4 5
Metrics Maturity Ranking
Cal
l Cen
ter B
alan
ced
Scor
e
The Evidence for Metrics as a Foundation Block

Questions?

Visit MetricNet at the Annual HDI Conference in Orlando, FL!
More info at metricnet.com/hdiconf16
Visit MetricNet at the Annual HDI Conference in Orlando, FL!
More info at metricnet.com/hdiconf16
Session 105: The Future of Desktop Support: What the KPIs Are Telling Us
Wednesday, April 13 at 10:15 AM
Session 407: The Diagnostic Power of MetricsThursday, April 14 at 10:00 AM

Questions?

Thank You!

About MetricNetYour Benchmarking Partner
69

Your Speaker: Jeff Rumburg
© MetricNet, LLC, www.metricnet.com
Co Founder and Managing Partner,
MetricNet, LLC
Winner of the 2014 Ron Muns
Lifetime Achievement Award
Former CEO, The Verity Group
Former Vice President, Gartner
Founder of the Service Desk
Benchmarking Consortium
Author of A Hands-On Guide to
Competitive Benchmarking
Harvard MBA, Stanford MS
70

Benchmarking is MetricNet’s Core Business
Call Centers
Telecom
Information Technology
Satisfaction
Customer Service Technical Support Telemarketing/Telesales Collections
Service Desk Desktop Support Field Support
Price Benchmarking
Customer Satisfaction Employee Satisfaction
71© MetricNet, LLC, www.metricnet.com

72© MetricNet, LLC, www.metricnet.com
27 Years of Call Center Benchmarking Data
More than 3,700 Call Center Benchmarks
Global Database
30 Key Performance Indicators
Nearly 80 Industry Best Practices

Meet a Sampling of Our ClientsMetricNet Conducts benchmarking for call centers worldwide,
and across virtually every industry sector.
© MetricNet, LLC, www.metricnet.com 73

Thank You!