California Transportation of Petroleum - CalEPA · California Transportation of Petroleum Second...
44
California Transportation of Petroleum Second Northern California Refinery Safety Forum Crockett, CA March 26, 2015 Gordon Schremp Energy Assessments Division California Energy Commission [email protected]
Transcript of California Transportation of Petroleum - CalEPA · California Transportation of Petroleum Second...

California Transportation of Petroleum
Second Northern California Refinery Safety Forum
Crockett, CA
March 26, 2015
Gordon Schremp
Energy Assessments Division
California Energy Commission

California On-road Transportation Fuels
• 14.54 billion gallons of gasoline consumed in 2013
• Base gasoline demand down 13.4 percent between 2003 and 2013
• Ethanol use increasing due to Renewable Fuel Standard
• Ethanol use up to 1.46 billion gallons during 2013
• 148 percent increase since 2003
• Ethanol accounted for 10 percent of total gasoline gallon during 2013
3/26/2015
0
2,000,000,000
4,000,000,000
6,000,000,000
8,000,000,000
10,000,000,000
12,000,000,000
14,000,000,000
16,000,000,000
18,000,000,000
2003 2004 2005 2006 2007 2008 2009 2010 2011 2012 2013
Gal
lon
s
California Gasoline & Ethanol Demand2003 - 2013
Base Gasoline Ethanol
2

California On-road Transportation Fuels
• 3.48 billion gallons diesel consumed during 2013
• Base diesel fuel demand unchanged between 2003 and 2013
• Biodiesel use increasing due to Renewable Fuel Standard and the Low Carbon Fuel Standard (LCFS)
• 49 MM gallons during 2013
• Renewable diesel fuel use up to 136 MM gallons during 2013 due to LCFS
• Combined renewable component accounted for 5.3 percent of total diesel gallon
3/26/2015
0
500,000,000
1,000,000,000
1,500,000,000
2,000,000,000
2,500,000,000
3,000,000,000
3,500,000,000
4,000,000,000
2003 2004 2005 2006 2007 2008 2009 2010 2011 2012 2013
Gal
lon
s
California Diesel, Biodiesel & Renewable Diesel Demand 2003 - 2013
Diesel Fuel Renewable Diesel Biodiesel
3

Transportation Fuel Infrastructure Overview
3/26/2015 4

Fuel Infrastructure – Key Elements
• The California transportation fuel “infrastructure” consists of several interconnected assets operated by a combination of refiner and third-party companies
• Refineries
• Pipelines
• Marine terminals
• Storage tanks
• Rail
• Crude oil and petroleum product infrastructure assets are separate and distinct from one another – not interchangeable
• Unlike with the electricity distribution system, Northern California is not directly connected to Southern California
3/26/2015 5

Western States More Isolated than Rest of U.S.
3/26/2015 6
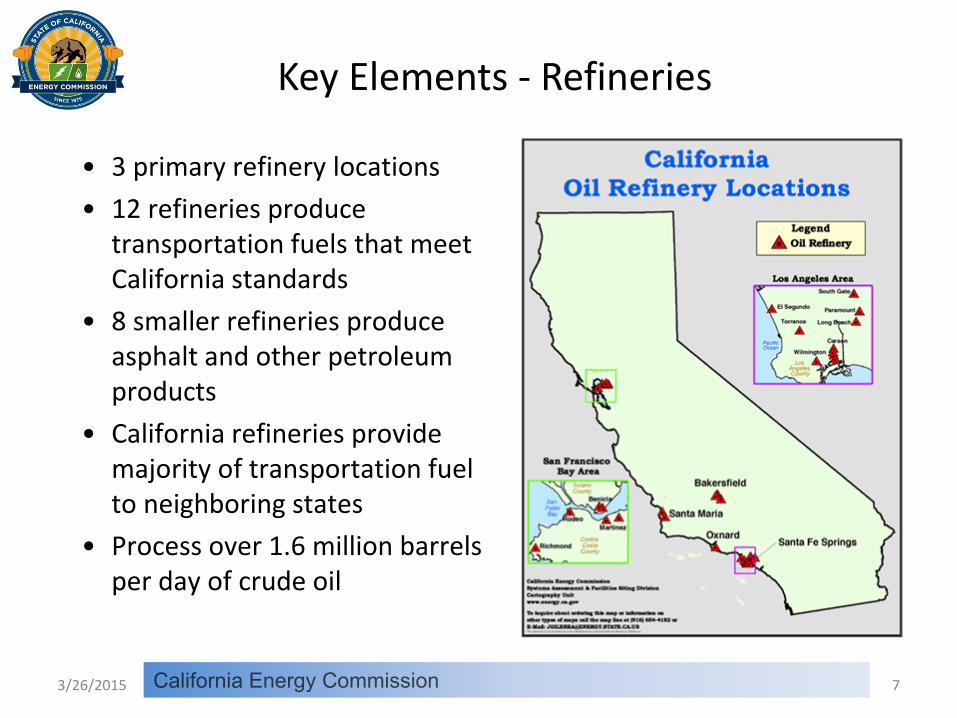
Key Elements - Refineries
• 3 primary refinery locations
• 12 refineries produce transportation fuels that meet California standards
• 8 smaller refineries produce asphalt and other petroleum products
• California refineries provide majority of transportation fuel to neighboring states
• Process over 1.6 million barrels per day of crude oil
3/26/2015 7

Key Elements - Refineries
• Refineries are a primary hub of logistical activity
• Raw materials imported & finished products shipped
• Crude oil receipts during 2014 received by • Marine vessels (foreign) - 787.1 TBD
• Marine vessels (Alaska) – 190.5 TBD
• California source via pipelines – 664.8 TBD
• Rail/truck – 15.7 TBD
• Process units operate continuously at or near maximum capacity, except during periods of planned maintenance or unplanned outages
3/26/2015 8

Supply in Northern California
• The minority of transportation fuels used in California are produced in Northern California
• California share • CARB Gasoline 39.9 % • CARB Diesel 48.7 % • Jet Fuel 34.4 % • Export Fuel 45.2 %
• Crude oil processing • 754.8 TBD
• Crude marine imports • Foreign – 415.4 TBD • Alaska – 70.9 TBD • North Dakota – 3.4 TBD
• Crude rail imports • Domestic – 3.5 TBD
• Pipeline receipts • San Joaquin Valley – 261.6 TBD
3/26/2015 9
355.3
50.0
118.2
52.8
94.3
Northern California Refinery ProductionThousands of Barrels Per Day
CARB Gasoline
Export Gasoline
CARB Diesel Fuel
EPA Diesel Fuel
Commercial Jet FuelSource: California Energy Commission - Weekly Refinery Reports

Key Elements – Refineries (cont)
• Output from the refineries is usually placed in intermediate tanks prior to blending the finished products
• The majority of gasoline, diesel and jet fuel is shipped from the refinery by pipeline to over 60 distribution terminals
• Tanker trucks then transport fuel to retail & non-retail stations
• Several truck trips during 2013 • Gasoline – 39.84 MM gal/day
• 4,980 tanker deliveries/day
• Diesel fuel – 9.53 MM gal/day
• 1,191 tanker deliveries/day
3/26/2015 10
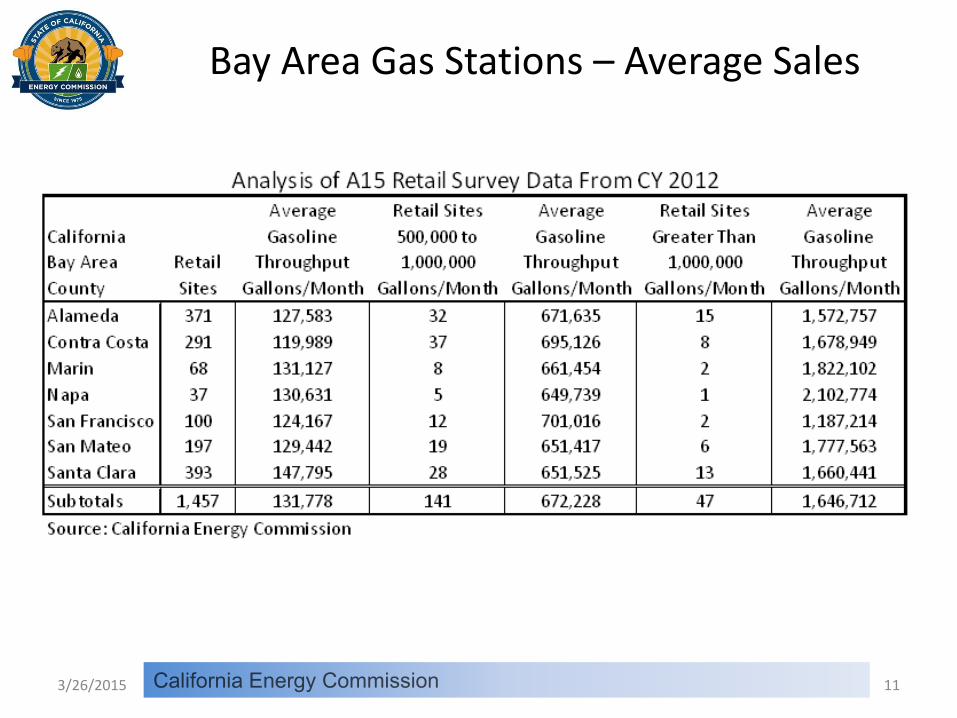
Bay Area Gas Stations – Average Sales
3/26/2015 11

Key Elements – Pipelines
• Pipelines are used throughout the distribution infrastructure to interconnect key elements
• Intra-state pipelines are used to convey petroleum products within California’s borders
• Interstate pipelines are used to export transportation fuels to Arizona and Nevada
• NV – Over 90% of supply
• AZ – Over 50% of supply
• As is the case with refineries, pipeline systems normally operate on a continuous basis
• Pipelines can only operate if transportation fuels are available to push liquid through the system
3/26/2015 12
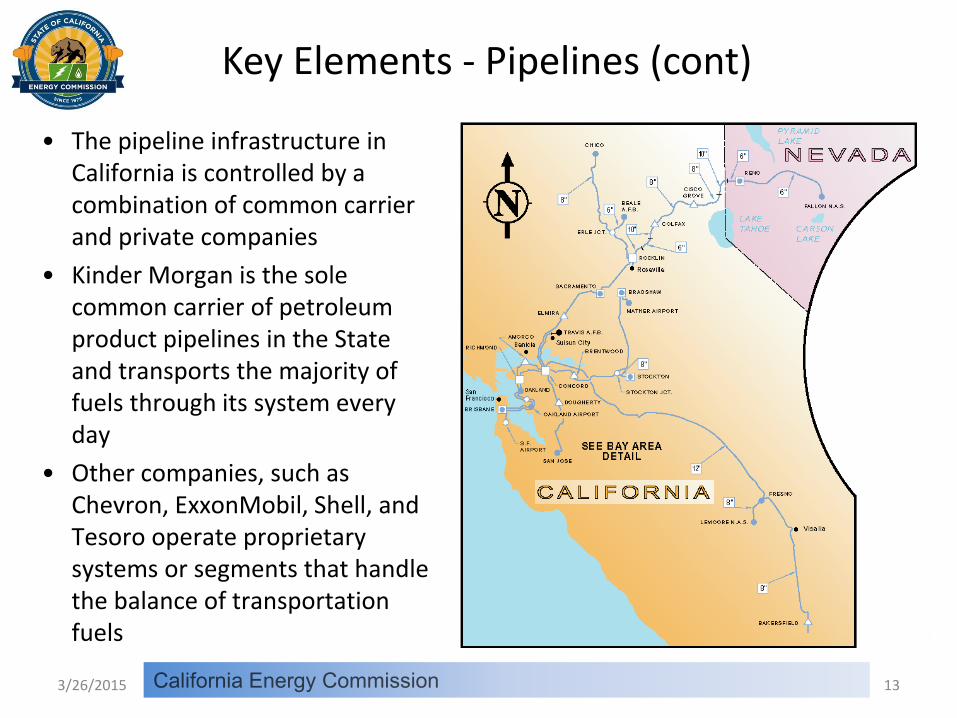
Key Elements - Pipelines (cont)
• The pipeline infrastructure in California is controlled by a combination of common carrier and private companies
• Kinder Morgan is the sole common carrier of petroleum product pipelines in the State and transports the majority of fuels through its system every day
• Other companies, such as Chevron, ExxonMobil, Shell, and Tesoro operate proprietary systems or segments that handle the balance of transportation fuels
3/26/2015 13

Bay Area – Kinder Morgan Lines
• The sole source of fuels for Bay Area airports
• Trans-bay crossing to Brisbane and SFO
• Distribution to Brisbane and San Jose terminals augments supply from truck racks linked to Bay Area refineries
• 75 to 85 percent of gasoline and diesel fuel is distributed through pipelines from refineries to distribution terminals
3/26/2015 14

Bay Area – Kinder Morgan North Lines
• The Chico terminal is the northernmost extent of petroleum product pipeline system in California
• Pipeline continues to Reno (Sparks), Nevada
• Deliveries to Roseville for railroad use
• Separate pipeline delivers military jet fuel to Travis AFB (not shown on map) from Concord pump station
• Separate spur line to Beale AFB
• Sacramento Airport now receives commercial jet fuel via pipeline connection
3/26/2015 15

Bay Area – Kinder Morgan Fresno Line
• The Fresno terminal is the southernmost extent of the petroleum product pipeline system originating from the Concord pump station
• Lemoore naval air station receives military jet fuel on a separate extension originating from the Fresno terminal (line segment not shown on this map)
• Fresno terminal can also receive fuel from pipeline segment originating from the ALON USA refinery in Bakersfield that is currently idle
3/26/2015 16

Key Elements – Marine Facilities
• Marine facilities are located in sheltered harbors with adequate draught to accommodate typical sizes of petroleum product tankers and crude oil vessels
• Wharves usually have adjacent storage tanks that are used to temporarily hold petroleum products prior to transfer to a subsequent location
• Most refiners operate a proprietary dock • Third party storage provides access to majors and independents
• Kinder Morgan • Pacific Atlantic • NuStar • Petro-Diamond
3/26/2015 17

Rail Logistics - Ethanol
• State receives ethanol via rail unit trains at two locations • Lomita Rail Terminal in Carson
• West Colton Rail Terminal
• Ethanol is then trucked to gasoline distribution terminals • – 4.0 MM gal/day during 2013 or 500 tanker truck deliveries/day
3/26/2015 18

Rail Logistics – Other Uses
• Refiners use rail cars to routinely ship propane and seasonally send out and receive butane
• Rail cars are also used to deliver refinery feedstock such as gas oils and sulfuric acid for alkylation units
• More recently, California refiners have started using rail cars to import crude oil from Canada and domestic sources outside the state due to changing trends of increasing oil production and discounted prices
3/26/2015 19

6,296,754
26,415,608
521,948
1,156,898
660,553
122,898 1,460,108 455,410
2013 California Rail Imports (Barrels)
Crude Oil
Ethanol
Biodiesel
Propane
Refinery Feedstocks
Gasoline, Diesel & Jet Fuel
Gasoline Blending Components
Other Unidentified Petroleum Products
Source: California Energy Commission
3/26/2015 20
Ethanol accounted for 71.2
percent of volume during
2013, crude oil 17.0 percent.

3/26/2015 21

3/26/2015 22

Crude Oil Sources – Northern Calif. Refineries
3/26/2015 23
• Northern California refineries processed 754.8 thousand barrels per day of crude oil during 2014
• 261.6 TBD pipeline shipments
• 35 percent of crude oil received
• Northern California refineries processed 45.5 percent of total crude oil
• Increased crude-by-rail likely to back out marine receipts of similar quality
• Rail capability increases flexibility to enhance supply options & reduces risk of crude oil receipt curtailment

California Refineries – Crude Oil Sources
3/26/2015 24
Declining CA & Alaska sources replaced by additional foreign imports.

3/26/2015 25

0
1,000
2,000
3,000
4,000
5,000
6,000
7,000
8,000
9,000
10,000
Jan
-19
81
De
c-1
98
1
No
v-1
98
2
Oct
-19
83
Sep
-19
84
Au
g-1
98
5
Jul-
19
86
Jun
-19
87
May
-19
88
Ap
r-1
98
9
Mar
-19
90
Feb
-19
91
Jan
-19
92
De
c-1
99
2
No
v-1
99
3
Oct
-19
94
Sep
-19
95
Au
g-1
99
6
Jul-
19
97
Jun
-19
98
May
-19
99
Ap
r-2
00
0
Mar
-20
01
Feb
-20
02
Jan
-20
03
De
c-2
00
3
No
v-2
00
4
Oct
-20
05
Sep
-20
06
Au
g-2
00
7
Jul-
20
08
Jun
-20
09
May
-20
10
Ap
r-2
01
1
Mar
-20
12
Feb
-20
13
Jan
-20
14
De
c-2
01
4
Tho
usa
nd
s o
f B
arre
ls P
er
Day
US Crude Oil Production Alaska
North Dakota Texas
California + OCS Rest of US
Source: Energy Information Administration (EIA)
9.226 million barrels per dayHighest since May of 1973
3.447 million barrels per dayHighest since 1972 annual average
Chart peak of 9.173 million barrels per day - Feb. 1986All-time peak of 10.044 million barrels per day - Nov. 1970
1.187 million barrels per day
U.S. Crude Oil Production – Jan. ‘81-Dec. ‘14
3/26/2015 26
2,349
991
608
-5 -120
-500
0
500
1,000
1,500
2,000
2,500
Texas North Dakota Rest of U.S. California Alaska
Tho
usa
nd
s o
f B
arre
ls P
er
Day
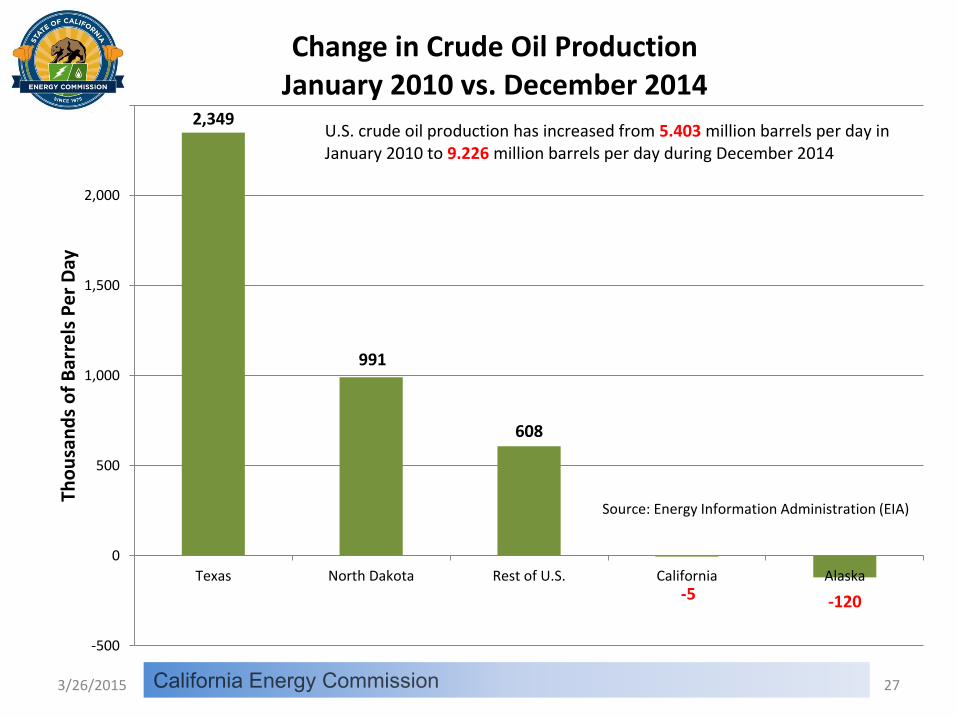
Change in Crude Oil ProductionJanuary 2010 vs. December 2014
Source: Energy Information Administration (EIA)
U.S. crude oil production has increased from 5.403 million barrels per day in January 2010 to 9.226 million barrels per day during December 2014
3/26/2015 27

1,314,727
1,715,878
1,929,450
0
500,000
1,000,000
1,500,000
2,000,000
2,500,000
Jan
-07
May
-07
Sep
-07
Jan
-08
May
-08
Sep
-08
Jan
-09
May
-09
Sep
-09
Jan
-10
May
-10
Sep
-10
Jan
-11
May
-11
Sep
-11
Jan
-12
May
-12
Sep
-12
Jan
-13
May
-13
Sep
-13
Jan
-14
May
-14
Sep
-14
Jan
-15
Bar
rels
Per
Day
Bakken Eagle Ford
PermianSource: EIA Drilling Productivity Report
U.S. Tight Oil Production – Jan. ’07-Feb. ‘15
3/26/2015 28
Ghawar (Saudi Arabia) – Peak 5.0 MM BPD in 2005, now 4.5 MM BPD
Samotlor (Russia) – Peak 3.0 MM BPD in 1980, now 0.84 MM BPD
Burgan (Kuwait) – Peak 2.4 MM BPD in 1972, now 1.7 MM BPD
Cantarell (Mexico) – Peak 2.1 MM BPD in 2003, now 0.41 MM BPD
Rumaila (Iraq) – Peak 1.6 MM BPD in 1980, now 1.3 MM BPD
Safaniya (Saudi Arabia) – Peak 1.5 MM BPD in 1990s, now 1.2 MM BPD
Kirkuk (Iraq) – Peak 1.2 MM BPD in 1980, now 0.23 MM BPD
Daqing (China) – Peak 1.1 MM BPD in 1997, now 0.75 MM BPD
3 U.S. fields each exceed 1 MM barrels per day
Combined 4.960 MM BPD

863 838
3,220
-838
366
-599
741
-291
621
341
-629
713
209
-395 -100
219
-832-689
259
546
-123
-1,500
-1,000
-500
0
500
1,000
1,500
2,000
2,500
3,000
3,500
Saud
i Ara
bia
Ru
ssia
n F
ed
era
tio
n
US
Ira
n
Ch
ina
Ven
ezue
la
Can
ada
Mex
ico
Uni
ted
Ara
b Em
irat
es
Kuw
ait
Nor
way
Iraq
Nig
eria
Alg
eria
An
go
la
Bra
zil
Liby
a
Uni
ted
Kin
gdom
Ka
zakh
sta
n
Qat
ar
Indo
nesi
a
Tho
usa
nd
s o
f B
arre
ls P
er D
ay
Sources: 2014 BP Statistical Review and Energy Commission Analysis
Global Crude Oil Production 2013 vs. 2008
3/26/2015 29
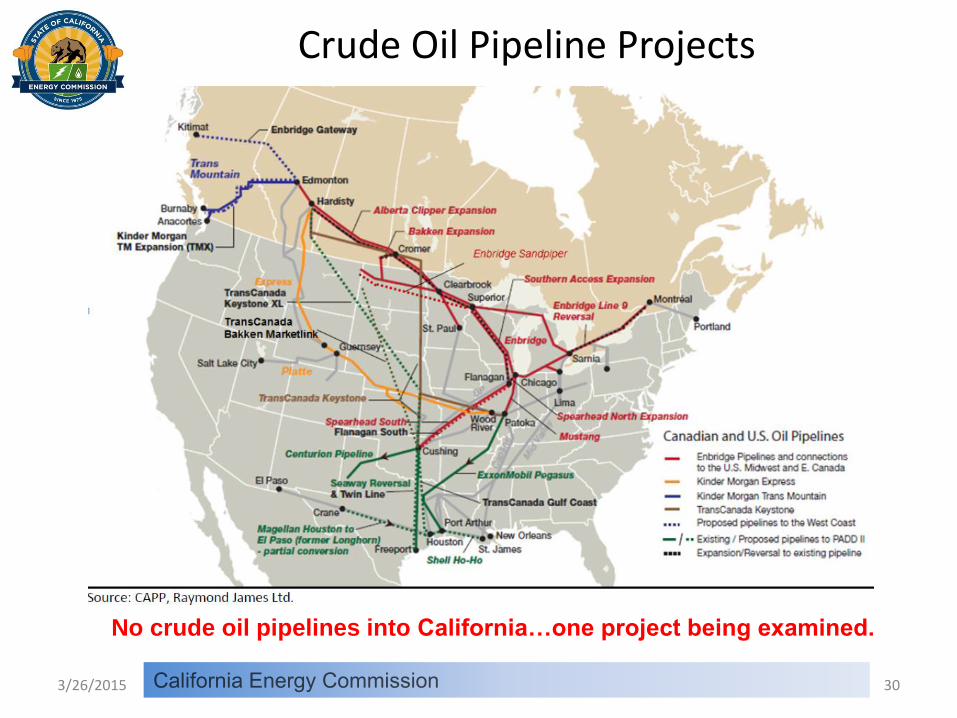
Crude Oil Pipeline Projects
3/26/2015 30
No crude oil pipelines into California…one project being examined.

Crude Oil – Export Restrictions
3/26/2015 31
• Domestically‐produced crude oil exports to foreign destinations are allowed under specific "license exceptions" identified under federal statute. Those primary exceptions include:
• Alaska crude oil shipped on the Trans‐Alaska Pipeline System (TAPS) and exported via a Jones Act vessel directly from Valdez Harbor
• California heavy crude oil production with API gravity of 20.0 degrees or lower, limit of no more than 25,000 barrels per day
• First export license for California heavy crude oil was granted on December 9, 1991 – no heavy crude oil exports for several years
• Exports of domestic crude oil to Canada for processing by Canadian refineries
• Exports in connection with refining or exchange of Strategic Petroleum Reserve crude oil
• Companies can also apply to the federal Bureau of Industry and Security (BIS) for an export license that basically requires Presidential approval
Recent export licenses for “processed” condensate approved.

11.03%
0%
2%
4%
6%
8%
10%
12%
0
200
400
600
800
1,000
1,200
1,400
20
03
20
04
20
05
20
06
20
07
20
08
1Q
09
2Q
09
3Q
09
4Q
09
1Q
10
2Q
10
3Q
10
4Q
10
1Q
11
2Q
11
3Q
11
4Q
11
1Q
12
2Q
12
3Q
12
4Q
12
1Q
13
2Q
13
3Q
13
4Q
13
1Q
14
2Q
14
Perc
enta
ge o
f U
.S. C
rud
e O
il P
rod
uct
ion
Qu
arte
rly
Cru
de
Oil
Rai
l Act
ivit
y O
rigi
nat
ing
in U
.S.
Carloads Per Day
Percentage of U.S. Crude Production
Each rail car assumed to carry approximately 714 barrels of crude oil.
Source: Energy Commission analysis of data from the Energy Information Administration and the Association of American Railroads.
U.S. Crude-by-Rail Movements
3/26/2015 32

Crude Oil Discounts Enable Rail Shipment
3/26/2015 33
Source: Simmons Energy Conference, Tesoro, February 27, 2014

California Energy Commission 2014 2014
Country or State of Origin
for Railcars
California Totals
Canada 1,520,288 26.50%
Colorado 147,488 2.57%
New Mexico 1,159,712 20.21%
North Dakota 1,191,758 20.77%
Utah 933,632 16.27%
Wyoming 694,101 12.10%
Other States 90,699 1.58%
Subtotals 5,737,678 100.00%
Northern California
Canada 0 0.00%
Colorado 74,937 5.83%
New Mexico 15,268 1.19%
North Dakota 1,191,758 92.75%
Utah 0 0.00%
Wyoming 0 0.00%
Other States 2,891 0.23%
Subtotals 1,284,854 100.00%
Bakersfield & Southern California
Canada 1,520,288 34.14%
Colorado 72,552 1.63%
New Mexico 1,144,444 25.70%
North Dakota 0 0.00%
Utah 933,632 20.97%
Wyoming 694,101 15.59%
Other States 87,807 1.97%
Subtotals 4,452,824 100.00%
Other States include Illinois, Louisiana, Missouri, Nebraska, Arkansas.
Total Barrels
2014 Crude-By-Rail Imports (January - December)
Percentage
California Crude-by-Rail Imports
• 2013 CBR imports – 6.3 MM Barrels
• 2014 CBR imports – 5.7 MM Barrels
• Average of 15,720 barrels/day
• Approximately 8,700 rail tank cars
• Average of 660 barrels/rail tank car
3/26/2015 34

Northern California – CBR Activity
3/26/2015 35
• One location currently receiving CBR deliveries
• Kinder Morgan – Richmond Rail Facility
• Facility is permitted to receive an average maximum of 16,000 barrels per day of crude oil via rail tank car
• Crude oil transferred to trucks
• Kinder Morgan facility can receive crude oil unit trains
• SAV Patriot in McClellan had permit rescinded and operations ceased in early November 2014
Source: Patriot Rail

Rail Routes Into and Within California
3/26/2015 36
CBR Routing Information - California Energy Commission does not track
routes of CBR deliveries – only source states/provinces, destinations within California, and volumes
Counties transited by trains carrying more than 1 MM gallons of Bakken crude oil are reported by Class 1 railroads to OES
Crude oil from Canada, North Dakota and Wyoming will likely traverse the state from north to south
Crude oil from Colorado, New Mexico and Texas will likely traverse the state from east to west

0
200,000
400,000
600,000
800,000
1,000,000
1,200,000
1,400,000
Jan
uar
y-1
3
Feb
ruar
y-1
3
Mar
ch-1
3
Ap
ril-
13
May
-13
Jun
e-1
3
July
-13
Au
gust
-13
Sep
tem
ber
-13
Oct
ob
er-1
3
No
vem
ber
-13
Dec
emb
er-1
3
Jan
uar
y-14
Feb
ruar
y-1
4
Mar
ch-1
4
Ap
ril-
14
May
-14
Jun
e-1
4
July
-14
Au
gust
-14
Sep
tem
ber
-14
Oct
ob
er-1
4
No
vem
ber
-14
Dec
emb
er-1
4
Bar
rels
Per
Mo
nth
California Crude Oil ImportsVia Rail Tank Cars
Canada
Colorado
New Mexico
North Dakota
Utah
Wyoming
Other Lower 48 States
Source: California Energy Commission
3/26/2015 37
Why have CBR imports been declining?

0
10
20
30
40
50
60
$0
$5
$10
$15
$20
$25
$30
$35
$40
$45
Jul-
13
Au
g-1
3
Sep
-13
Oct
-13
No
v-1
3
Dec
-13
Jan
-14
Feb
-14
Mar
-14
Ap
r-1
4
May
-14
Jun
-14
Jul-
14
Au
g-1
4
Sep
-14
Oct
-14
No
v-1
4
Dec
-14
Jan
-15
Tho
usa
nd
s o
f B
arre
ls P
er
Day
Cru
de
Oil
Pri
ce D
isco
un
t V
ers
us
Bre
nt
Eagle Ford/New Mexico
Utah
North Dakota Sweet
North Dakota Sour
Colorado Average
California CBR Imports
Canada Sweet
Canada Heavy
Sources: Plains All American crude oil price bulletins & CEC crude-by-rail data from Class 1 railroads.
3/26/2015 38
CBR Imports Vary by Size of Oil Discount
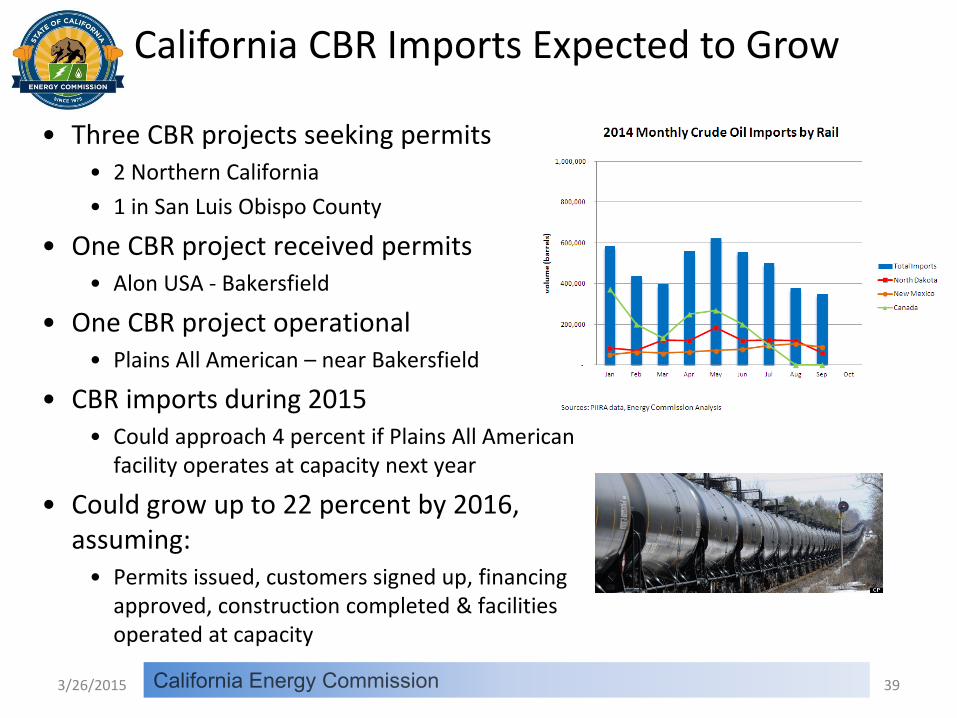
California CBR Imports Expected to Grow
• Three CBR projects seeking permits • 2 Northern California
• 1 in San Luis Obispo County
• One CBR project received permits • Alon USA - Bakersfield
• One CBR project operational • Plains All American – near Bakersfield
• CBR imports during 2015 • Could approach 4 percent if Plains All American
facility operates at capacity next year
• Could grow up to 22 percent by 2016, assuming:
• Permits issued, customers signed up, financing approved, construction completed & facilities operated at capacity
3/26/2015 39

Crude-by-Rail Projects – Northern California
3/26/2015 40
• Valero – Benicia Crude Oil By Rail Project – Permit Review
• Benicia refinery
• Up to 70,000 BPD
• Construction will take 6 months
• Could be operational by 2015
• Draft EIR released June 17, 2014
• Comments closed Sept. 15
• Lead agency – City of Benicia
• http://www.ci.benicia.ca.us/index.asp?Type=B_BASIC&SEC=FDE9A332-542E-44C1-BBD0-A94C288675FD
Crude-by-Rail Projects – Northern California
3/26/2015 41
WesPac Energy Project – Pittsburg – Permit Review Rail receipt average capability of 50,000 barrels per day (BPD) Includes marine terminal for receipt and loading – average of 192,000 BPD Combined average receipt capability of 242,000 BPD Connection to KLM pipeline – access to Valero, Shell, Tesoro & Phillips 66 refineries Connection to idle San Pablo Bay Pipeline – access to Shell, Tesoro & Phillips 66
refineries Construction of the first phase for the rail facility and associated storage tanks could
be completed within 12 to 15 months of receiving all permits Could be operational by 2016 A recirculated draft environmental impact report (RDEIR) will be developed and a
new comment period set for those applicable sections There is currently no scheduled release date for the RDEIR Lead agency – City of Pittsburg http://www.ci.pittsburg.ca.us/index.aspx?page=700

WesPac Project – Refinery Connections
3/26/2015 42

Crude-by-Rail Projects – Bakersfield
3/26/2015 43
Source: KernGoldenEmpire.com
Alon Crude Flexibility Project - Approved Alon – Bakersfield Refinery 2 unit trains per day 150,000 BPD offloading capacity Will be able to receive heavy crude oil Oil tankage connected to main crude
oil trunk lines – transfer to other refineries
Kern County Board of Supervisors approved permits for the project on September 9, 2014
Construction will take 9 months, could be complete by 2015 assuming customers sign long-term agreements and financing is approved
Plains All American – Bakersfield Crude Terminal – Operational Up to 65,000 BPD Connection to additional crude oil line via
new six-mile pipeline Initial delivery during November 2014

Questions?
3/26/2015 44
C & H sugar refinery in Crockett, CA – April 1,1958 - Charles W. Cushman Photograph Collection