California Spanish Assessment 2018–2019 Technical Report
125
California Department of Education Assessment Development & Administration Division California Assessment of Student Performance and Progress California Spanish Assessment 2018–2019 Technical Report Submitted August 18, 2020 Prepared for the California Department of Education by Educational Testing Service Contract No. CN150012
Transcript of California Spanish Assessment 2018–2019 Technical Report

California Department of Education Assessment Development &
Administration Division
California Assessment of Student Performance and Progress
California Spanish Assessment 2018–2019 Technical Report
Submitted August 18, 2020 Prepared for the California Department of Education by
Educational Testing Service
Contract No. CN150012
CAASPP System
– ii –
Table of Contents Chapter 1: Introduction ......................................................................................................... 1
1.1. Background .................................................................................................................. 1 1.2. Purpose of the Operational Assessment ...................................................................... 2 1.3. Intended Population ...................................................................................................... 2 1.4. Intended Use and Purpose of Test Scores ................................................................... 2 1.5. Testing Window and Times .......................................................................................... 3 1.6. Groups and Organizations Involved with the CSA ........................................................ 3
1.6.1. State Board of Education (SBE) .............................................................................. 3 1.6.2. California Department of Education (CDE).............................................................. 4 1.6.3. California Educators ................................................................................................ 4 1.6.4. Contractors .............................................................................................................. 4
1.7. Systems Overview and Functionality ............................................................................ 5 1.7.1. Test Operations Management System (TOMS) ...................................................... 5 1.7.2. Test Delivery System (TDS) .................................................................................... 6 1.7.3. Practice and Training Tests..................................................................................... 6 1.7.4. California Educator Reporting System (CERS) ....................................................... 6
1.8. Overview of the Technical Report ................................................................................. 7 References .......................................................................................................................... 8
Chapter 2: An Overview of the Operational Assessment Process .................................... 9 2.1. Item Development ........................................................................................................ 9
2.1.1. Item Format ............................................................................................................. 9 2.1.2. Item Specifications .................................................................................................. 9 2.1.3. Item Banking ......................................................................................................... 10
2.2. Test Assembly ............................................................................................................ 10 2.3. Test Administration ..................................................................................................... 11
2.3.1. Test Security and Confidentiality ........................................................................... 11 2.3.2. Procedures to Maintain Standardization ............................................................... 11
2.4. Fairness and Accessibility .......................................................................................... 12 2.4.1. Universal Tools, Designated Supports, and Accommodations .............................. 12 2.4.2. Differential Item Functioning (DIF) ........................................................................ 14
2.5. Scoring and Reporting ................................................................................................ 14 2.5.1. Estimating Ability Scores ....................................................................................... 15 2.5.2. Score Reporting .................................................................................................... 15 2.5.3. Aggregation Procedures ....................................................................................... 15
2.6. Analyses ..................................................................................................................... 16 2.7. Standard Setting ......................................................................................................... 16 References ........................................................................................................................ 17
Chapter 3: Item Development and Test Assembly ........................................................... 18 3.1. Overview ..................................................................................................................... 18 3.2. Test Blueprint ............................................................................................................. 18 3.3. Item Development ...................................................................................................... 19
3.3.1. Item Specifications ................................................................................................ 19 3.3.2. Item Format ........................................................................................................... 20

CAASPP System
– iii –
3.3.3. Item Types and Features ...................................................................................... 20 3.4. Item Development Process ......................................................................................... 22
3.4.1. Item Development Plan ......................................................................................... 22 3.4.2. Item Development Process ................................................................................... 23 3.4.3. Item Specifications ................................................................................................ 23 3.4.4. Selection of Item Writers ....................................................................................... 23 3.4.5. Item Writer Training ............................................................................................... 24
3.5. Item Review Process .................................................................................................. 24 3.5.1. ETS Content Review ............................................................................................. 25 3.5.2. ETS Editorial Review ............................................................................................ 25 3.5.3. ETS Sensitivity and Fairness Review .................................................................... 25
3.6. Content Expert Review ............................................................................................... 26 3.6.1. California Educator Review ................................................................................... 26 3.6.2. Data Review .......................................................................................................... 28
3.7. Test Assembly and Length ......................................................................................... 28 3.8. Test Production Process ............................................................................................. 29
3.8.1. Psychometric Criteria and Identification of Eligible Items ...................................... 29 3.8.2. Selection of Items .................................................................................................. 30 3.8.3. Verification of Statistics ......................................................................................... 30 3.8.4. Content Review of Forms ...................................................................................... 30 3.8.5. CDE Review of Forms ........................................................................................... 30 3.8.6. Configuration of the Test Delivery System (TDS) .................................................. 31
References ........................................................................................................................ 32 Chapter 4: Test Administration .......................................................................................... 33
4.1. Test Administration ..................................................................................................... 33 4.2. Demographic Summaries ........................................................................................... 33 4.3. Test-Taking Rates ...................................................................................................... 34 4.4. Procedures to Maintain Standardization ..................................................................... 36
4.4.1. LEA CAASPP Coordinator .................................................................................... 36 4.4.2. CAASPP Test Site Coordinator ............................................................................. 36 4.4.3. Test Administrators ............................................................................................... 37 4.4.4. Instructions for Test Administrators ....................................................................... 37
4.5. LEA Training ............................................................................................................... 39 4.5.1. In-person Training ................................................................................................. 39 4.5.2. Webcasts .............................................................................................................. 39 4.5.3. Videos and Narrated PowerPoint Presentations ................................................... 39
4.6. Universal Tools, Designated Supports, and Accommodations for Students with Disabilities ..................................................................................................................... 40
4.6.1. Identification .......................................................................................................... 40 4.6.2. Assignment ........................................................................................................... 40 4.6.3. Available Resources ............................................................................................. 41
4.7. Practice and Training Tests ........................................................................................ 43 4.8. Test Security and Confidentiality ................................................................................ 43
4.8.1. ETS’ Office of Testing Integrity (OTI) .................................................................... 44 4.8.2. Procedures to Maintain Standardization of Test Security ...................................... 44

CAASPP System
– iv –
4.8.3. Security of Electronic Files Using a Firewall.......................................................... 45 4.8.4. Transfer of Scores via Secure Data Exchange ..................................................... 45 4.8.5. Data Management in the Secure Database .......................................................... 45 4.8.6. Statistical Analysis on Secure Servers .................................................................. 46 4.8.7. Student Confidentiality .......................................................................................... 46 4.8.8. Student Test Results ............................................................................................. 46 4.8.9. Security and Test Administration Incident Reporting System (STAIRS) Process .. 47 4.8.10. Appeals ............................................................................................................... 48
References ........................................................................................................................ 50 Chapter 5: Standard Setting ............................................................................................... 51
5.1. Background ................................................................................................................ 51 5.2. Achievement Level Descriptors (ALDs) ...................................................................... 51 5.3. Standard Setting Methodology ................................................................................... 52
5.3.1. Bookmark Method ................................................................................................. 52 5.4. Standard Setting Procedures ...................................................................................... 52
5.4.1. Panelists................................................................................................................ 52 5.4.2. Materials................................................................................................................ 53 5.4.3. Process (Including Articulation) ............................................................................. 53
5.5. Results of the Standard Setting .................................................................................. 54 References ........................................................................................................................ 56
Chapter 6: Scoring and Reporting ..................................................................................... 57 6.1. Student Test Scores ................................................................................................... 57
6.1.1. Incomplete and Complete Cases .......................................................................... 57 6.1.2. Theta Scores ......................................................................................................... 58 6.1.3. Scale Scores for the Total Assessment ................................................................ 59 6.1.4. Score Reporting Ranges ....................................................................................... 60
6.2. Overview of Score Aggregation Procedures ............................................................... 60 6.2.1. Individual Student Score Distributions and Summary Statistics ............................ 60 6.2.2. Group Scores ........................................................................................................ 61
6.3. Reports Produced and Scores for Each Report .......................................................... 62 6.3.1. Online Reporting ................................................................................................... 62 6.3.2. Special Cases ....................................................................................................... 62 6.3.3. Types of Score Reports......................................................................................... 63 6.3.4. Score Report Applications ..................................................................................... 64 6.3.5. Criteria for Interpreting Test Scores ...................................................................... 64 6.3.6. Criteria for Interpreting Group Score Reports........................................................ 64
References ........................................................................................................................ 65 Chapter 7: Analyses ............................................................................................................ 66
7.1. Overview ..................................................................................................................... 66 7.1.1. Summary of the Analyses ..................................................................................... 66 7.1.2. Sample Used for the Analyses .............................................................................. 67
7.2. Classical Item Analyses .............................................................................................. 68 7.2.1. Classical Item Difficulty Indices (p-value and Average Item Score) ...................... 68 7.2.2. Item-Total Score Correlation ................................................................................. 69 7.2.3. Distractor Analyses ............................................................................................... 70

CAASPP System
– v –
7.2.4. Omission and Completion Rates ........................................................................... 70 7.2.5. Distribution of Item Scores .................................................................................... 70 7.2.6. Summary of Classical Item Analyses Flagging Criteria ......................................... 71 7.2.7. Classical Item Analyses Results Summary ........................................................... 71
7.3. Differential Item Functioning (DIF) Analyses .............................................................. 74 7.3.1. DIF Procedure for Dichotomous Items .................................................................. 74 7.3.2. DIF Procedure for Polytomous Items .................................................................... 75 7.3.3. DIF Categories and Definitions ............................................................................. 76 7.3.4. Items Exhibiting Significant DIF ............................................................................. 77
7.4. IRT Analyses .............................................................................................................. 77 7.4.1. Item Response Theory Models ............................................................................. 77 7.4.2. Calibration, Linking, and Scaling ........................................................................... 78 7.4.3. Summary of IRT Parameters ................................................................................. 86
7.5. Response Time Analyses ........................................................................................... 87 7.6. Reliability Analyses ..................................................................................................... 87
7.6.1. Internal Consistency Reliability ............................................................................. 88 7.6.2. Standard Error of Measurement (SEM) for Raw Scores ....................................... 88 7.6.3. Student Group Reliabilities and SEMs .................................................................. 89 7.6.4. Standard Error of Measurement (SEM) for Theta Scores ..................................... 90 7.6.5. Conditional Standard Error of Measurement (CSEM) for Scale Scores ................ 91 7.6.6. Decision Classification Analyses ........................................................................... 92
7.7. Validity Evidence ........................................................................................................ 94 7.7.1. Evidence in the design of the CSA ........................................................................ 94 7.7.2. Evidence Based on Test Content .......................................................................... 96 7.7.3. Evidence Based on Response Processes ............................................................ 97 7.7.4. Evidence Based on Internal Structure ................................................................... 98 7.7.5. Evidence Based on Relations to Other Variables .................................................. 99
References ...................................................................................................................... 101 Accessibility Information .................................................................................................. 104
7.7.6. Alternative Text for Equation 7.1 ......................................................................... 104 7.7.7. Alternative Text for Equation 7.2 ......................................................................... 104 7.7.8. Alternative Text for Equation 7.3 ......................................................................... 104 7.7.9. Alternative Text for Equation 7.4 ......................................................................... 104 7.7.10. Alternative Text for Equation 7.5 ....................................................................... 104 7.7.11. Alternative Text for Equation 7.6 ....................................................................... 104 7.7.12. Alternative Text for Equation 7.7 ....................................................................... 104 7.7.13. Alternative Text for Equation 7.8 ....................................................................... 105 7.7.14. Alternative Text for Equation 7.9 ....................................................................... 105 7.7.15. Alternative Text for Equation 7.10 ..................................................................... 105 7.7.16. Alternative Text for Equation 7.11 ..................................................................... 105 7.7.17. Alternative Text for Equation 7.12 ..................................................................... 105 7.7.18. Alternative Text for Equation 7.13 ..................................................................... 105 7.7.19. Alternative Text for Equation 7.14 ..................................................................... 105 7.7.20. Alternative Text for Equation 7.15 ..................................................................... 105 7.7.21. Alternative Text for Equation 7.16 ..................................................................... 105

CAASPP System
– vi –
7.7.22. Alternative Text for Equation 7.17 ..................................................................... 105 7.7.23. Alternative Text for Equation 7.18 ..................................................................... 105 7.7.24. Alternative Text for Equation 7.19 ..................................................................... 105
Chapter 8: Quality Control ................................................................................................ 106 8.1. Quality Control of Item Development ........................................................................ 106 8.2. Quality Control of Test Assembly ............................................................................. 106 8.3. Quality Control of Test Materials .............................................................................. 107
8.3.1. Developing Test Administration Instructions ....................................................... 107 8.3.2. Processing Test Materials ................................................................................... 107
8.4. Quality Control of Test Administration ...................................................................... 107 8.5. Quality Control of Scoring ......................................................................................... 108
8.5.1. Development of Scoring Specifications ............................................................... 108 8.5.2. Quality Control of Machine-Scoring Procedures ................................................. 108 8.5.3. Enterprise Score Key Management System (eSKM) Processing ........................ 109 8.5.4. Psychometric Processing .................................................................................... 109
8.6. Quality Control of Psychometric Specifications ........................................................ 109 8.6.1. Development of Psychometric Specifications ...................................................... 109 8.6.2. Quality Control of Psychometric Analyses .......................................................... 109
8.7. Quality Control of Reporting ..................................................................................... 110 8.7.1. Exclusion of Student Scores from Summary Reports ......................................... 111 8.7.2. End-to-End Testing for Operational Administration ............................................. 111
Reference ........................................................................................................................ 112 Chapter 9: Continuous Improvement .............................................................................. 113
9.1. Administration and Test Delivery .............................................................................. 113 9.1.1. Survey Results .................................................................................................... 113 9.1.2. Training and Communication .............................................................................. 113
9.2. Accessibility .............................................................................................................. 114 Reference ........................................................................................................................ 115

CAASPP System
– vii –
List of Appendices Chapter 3 Appendix
Appendix 3.A: CSA Blueprint Overview—Operational Forms Chapter 4 Appendix
Appendix 4.A: Demographic Summaries Chapter 5 Appendix
Appendix 5.A: CSA Range Achievement Level Descriptors (ALDs) Description Chapter 6 Appendices
Appendix 6.A: Theta Scores (Estimated Ability Values) of Students Taking Each Test Appendix 6.B: Raw Score and Scale Score Distributions of Students Taking Each Test Appendix 6.C: Demographic Summary of Students in Each Score Reporting Range
Chapter 7 Appendices Appendix 7.A: Classical Item Analyses Appendix 7.B: DIF Analyses Appendix 7.C: IRT Analyses Results Appendix 7.D: Item Parameters for the Linking Set for High School Appendix 7.E: Response Time Analysis Appendix 7.F: Reliability Analyses

CAASPP System
– viii –
List of Tables Acronyms and Initialisms Used in the California Spanish Assessment Technical Report ....... ix Table 3.1 Number of Operational Assessment Items to Administer per Form ...................... 18 Table 3.2 Item Types for the Operational CSA ..................................................................... 21 Table 3.3 Number of Items Developed per Grade Level for the Operational CSA................ 22 Table 3.4 CSA Item Review Qualifications ........................................................................... 27 Table 3.5 ETS Operational Assessment Forms Review Process ......................................... 29 Table 4.1 Demographic Student Groups to Be Reported ..................................................... 34 Table 4.2 Test-Taking Rates by California Region ............................................................... 35 Table 4.3 CSA Test-Taking Rates by Grade Level ............................................................... 35 Table 4.4 Types of Appeals .................................................................................................. 49 Table 5.1 SSPI’s Recommendations for the Proposed Thresholds for Three Levels
on the CSA .......................................................................................................................... 55 Table 6.1 Rules for Incomplete Tests ................................................................................... 58 Table 6.2 CSA Score Reporting Ranges by Grade Level ..................................................... 60 Table 6.3 Mean and Standard Deviation of Theta Scores and Scale Scores ....................... 60 Table 6.4 Numbers and Percentages of Students in Score Reporting Ranges .................... 61 Table 7.1 Sample Size by Form ........................................................................................... 67 Table 7.2 Item Difficulty Distributions by Grade Level .......................................................... 72 Table 7.3 Item-Total Correlation Distributions by Grade Level ............................................. 72 Table 7.4 Flagged Items Summary in Each Form by Grade Level ....................................... 73 Table 7.4 Flagged Items Summary in Each Form by Grade Level (Continued).................... 73 Table 7.5 DIF Categories for Dichotomous Items ................................................................. 76 Table 7.6 DIF Categories for Polytomous Items ................................................................... 76 Table 7.7 Final Linking Summary for the CSA for High School ............................................ 83 Table 7.8 Linked Item Parameter Results for the CSA for High School ................................. 83 Table 7.9 Evaluation of Anchor Set Between 2018–2019 Operational and 2018 Fall Field
Test for High School ............................................................................................................ 84 Table 7.10 Convert Theta Score to Reporting Scores by Grade Level ................................. 86 Table 7.11 IRT Summary b-value Estimates for All CSA Operational Items ........................ 86 Table 7.12 Test Reliability of the Total Scores ..................................................................... 89 Table 7.13 Scale Score CSEM at Score Reporting Range Threshold .................................. 92 Table 7.14 Decision Accuracy for Reaching a Score Reporting Range Threshold ............... 93 Table 7.15 Decision Consistency for Reaching a Score Reporting Range Threshold .......... 93 Table 7.16 Correlations Between CSA Scale Scores and CAASPP Smarter Balanced
ELA Scale Scores ............................................................................................................. 100
CAASPP System
– ix –
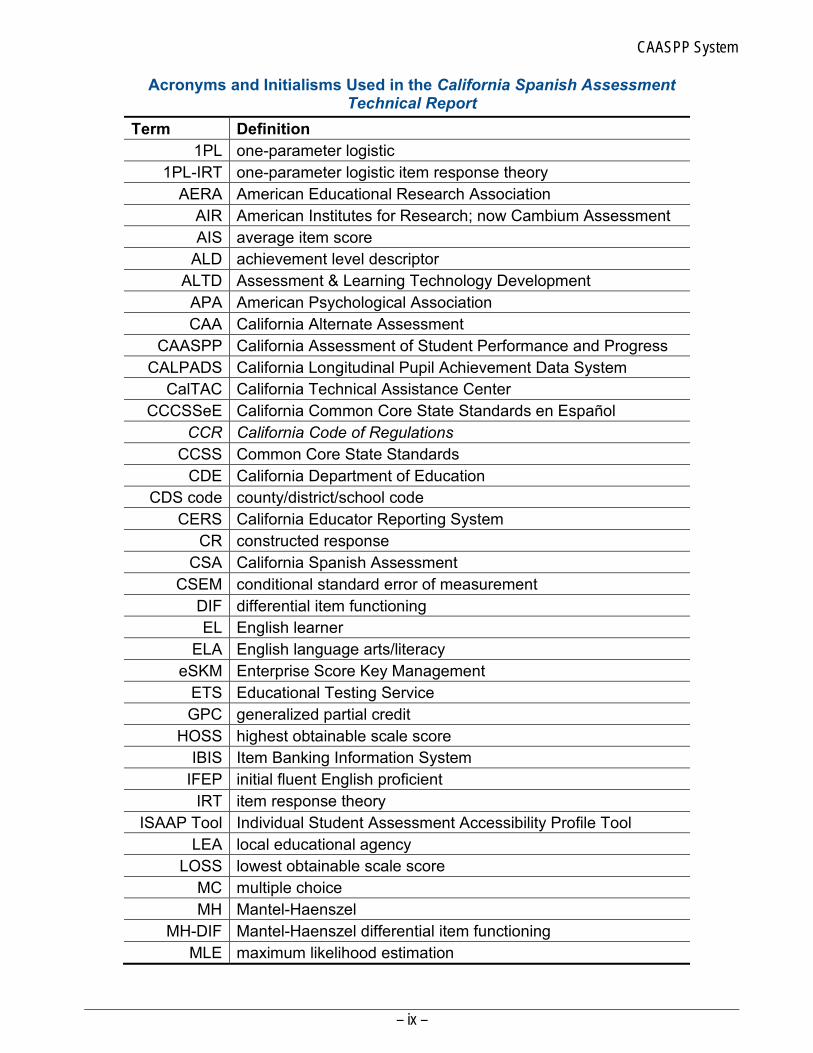
Acronyms and Initialisms Used in the California Spanish Assessment Technical Report
Term Definition 1PL one-parameter logistic
1PL-IRT one-parameter logistic item response theory AERA American Educational Research Association
AIR American Institutes for Research; now Cambium Assessment AIS average item score
ALD achievement level descriptor ALTD Assessment & Learning Technology Development
APA American Psychological Association CAA California Alternate Assessment
CAASPP California Assessment of Student Performance and Progress CALPADS California Longitudinal Pupil Achievement Data System
CalTAC California Technical Assistance Center CCCSSeE California Common Core State Standards en Español
CCR California Code of Regulations CCSS Common Core State Standards
CDE California Department of Education CDS code county/district/school code
CERS California Educator Reporting System CR constructed response
CSA California Spanish Assessment CSEM conditional standard error of measurement
DIF differential item functioning EL English learner
ELA English language arts/literacy eSKM Enterprise Score Key Management
ETS Educational Testing Service GPC generalized partial credit
HOSS highest obtainable scale score IBIS Item Banking Information System
IFEP initial fluent English proficient IRT item response theory
ISAAP Tool Individual Student Assessment Accessibility Profile Tool LEA local educational agency
LOSS lowest obtainable scale score MC multiple choice MH Mantel-Haenszel
MH-DIF Mantel-Haenszel differential item functioning MLE maximum likelihood estimation
CAASPP System
– x –
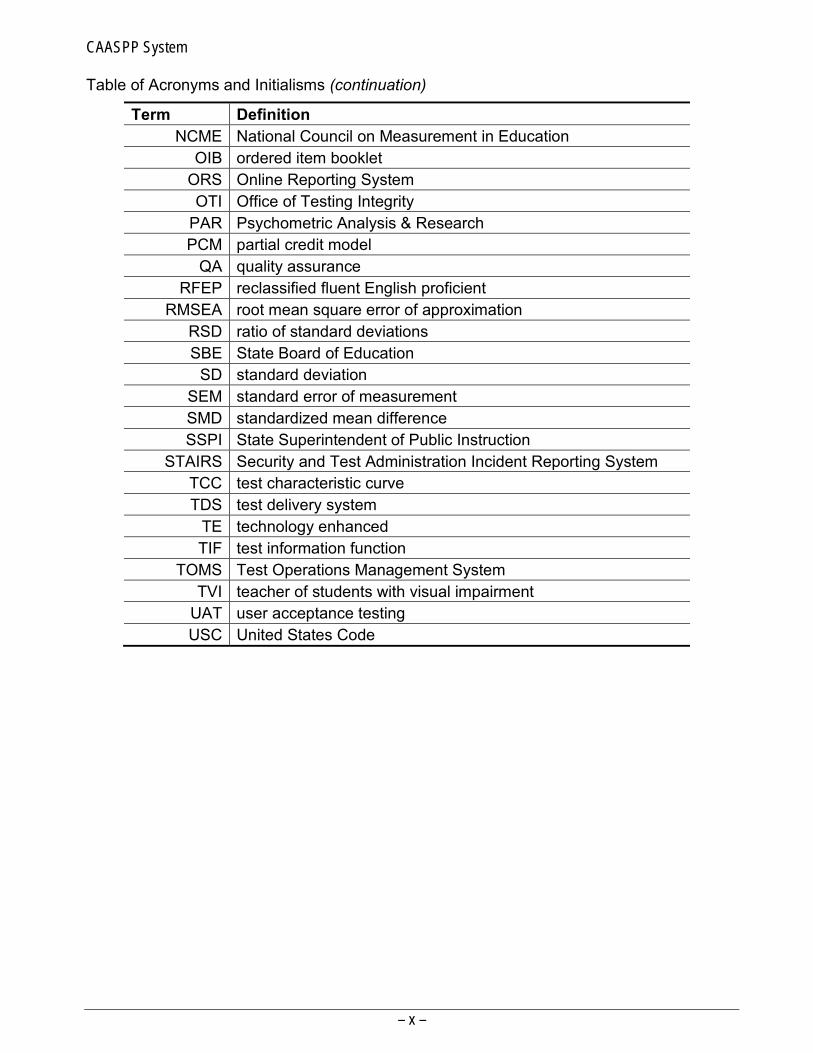
Table of Acronyms and Initialisms (continuation)
Term Definition NCME National Council on Measurement in Education
OIB ordered item booklet ORS Online Reporting System OTI Office of Testing Integrity
PAR Psychometric Analysis & Research PCM partial credit model
QA quality assurance RFEP reclassified fluent English proficient
RMSEA root mean square error of approximation RSD ratio of standard deviations SBE State Board of Education
SD standard deviation SEM standard error of measurement SMD standardized mean difference SSPI State Superintendent of Public Instruction
STAIRS Security and Test Administration Incident Reporting System TCC test characteristic curve TDS test delivery system
TE technology enhanced TIF test information function
TOMS Test Operations Management System TVI teacher of students with visual impairment
UAT user acceptance testing USC United States Code
Introduction | Background
August 2020 CAASPP CSA Technical Report | 2018–2019 Administration Page 1
Chapter 1: Introduction This chapter provides an overview of the California Spanish Assessment (CSA), including background information, purpose of the test, intended population, testing window, organizations and systems involved, and an overview of the operational test technical report.
1.1. Background In October 2013, Assembly Bill 484 established the California Assessment of Student Performance and Progress (CAASPP) as the new student assessment system that replaced the Standardized Testing and Reporting program. The primary purpose of the CAASPP System of assessments is to assist teachers, administrators, and students and their parents/guardians by promoting high-quality teaching and learning through the use of a variety of item types and assessment approaches. These tests provide the foundation for the state’s school accountability system. During the 2018–2019 administration, the CAASPP System comprised the following assessments:
• Smarter Balanced assessment system: – Summative Assessments—Online assessments for English language arts/literacy
(ELA) and mathematics in grades three through eight and grade eleven – Interim Assessments—Optional resources developed for grades three through
eight and grade eleven designed to inform and promote teaching and learning by providing information that can be used to monitor student progress toward mastery of the Common Core State Standards that may be administered to students at any grade level
– Digital Library—Professional development materials and instructional resources designed to help teachers use formative assessment processes for improved teaching and learning in all grades
• California Alternate Assessments (CAAs) for ELA and mathematics in grades three through eight and grade eleven
• Science assessments in grades five, eight, and high school (grade ten, eleven, or twelve; these are the California Science Test and the CAA for Science)
• The CSA, optional for eligible students in grades three through eight and high school (grades nine through twelve) and designed to measure a student’s Spanish competency in reading, writing mechanics, and listening
As part of the CAASPP System of assessments, the CSA was developed as an optional assessment that replaced the Standards-based Tests in Spanish. This computer-based assessment for students in grades three through eight and high school was designed to measure a student’s Spanish skills in reading, writing mechanics, and listening for the purposes of providing
• student-level data in Spanish competency,
• aggregate data that may be used for evaluating the implementation of Spanish language arts programs at the local level, and
Introduction | Purpose of the Operational Assessment
CAASPP CSA Technical Report | 2018–2019 Administration August 2020 Page 2
• a high school measure suitable to be used, in part, for the California State Seal of Biliteracy. Currently, the CSA does not meet the requirements identified in California Education Code, Section 51460(a) for the State Seal of Biliteracy.
Development of the CSA started in September 2016 with the State Board of Education’s (SBE’s) approval of the high-level test design. Following the 2018 fall CSA field test, the first CSA operational test was administered optionally to students seeking a measure of their Spanish language arts skills during spring 2019. More background information about the CAASPP System can be found on the CAASPP Description – CalEdFacts web page at http://www.cde.ca.gov/ta/tg/ai/cefcaaspp.asp.
1.2. Purpose of the Operational Assessment As a voluntary assessment to measure a student’s Spanish skills in reading, writing mechanics, and listening, the CSA is aligned with the translated and linguistically augmented version of the Common Core English language arts/literacy standards (i.e., California Common Core State Standards en Español). CSA preliminary score reporting ranges were used first for the 2018–2019 CSA administration and will be used also for future administrations.
1.3. Intended Population The population for the CSA comprises all students in grades three through twelve who receive instruction in Spanish in California and who seek a measure that recognizes their Spanish-specific reading, writing mechanics, and listening skills. The number of students taking the CSA varied significantly across different grade levels, from approximately 10,000 in grade three to fewer than 1,500 in grade twelve during the 2018–2019 CAASPP administration.
1.4. Intended Use and Purpose of Test Scores The results of tests within the CAASPP System, including the CSA, are used for two primary purposes as described in EC sections 60602.5(a) and (a)(4). (Excerpted from the EC Section 60602 web page at http://leginfo.legislature.ca.gov/faces/codes_displayText.xhtml?lawCode=EDC&division=4.&title=2.&part=33.&chapter=5.&article=1 [outside source].)
“60602.5(a) It is the intent of the Legislature in enacting this chapter to provide a system of assessments of pupils that has the primary purposes of assisting teachers, administrators, and pupils and their parents; improving teaching and learning; and promoting high-quality teaching and learning using a variety of assessment approaches and item types. The assessments, where applicable and valid, will produce scores that can be aggregated and disaggregated for the purpose of holding schools and local educational agencies accountable for the achievement of all their pupils in learning the California academic content standards.” “60602.5(a)(4) Provide information to pupils, parents and guardians, teachers, schools, and local educational agencies on a timely basis so that the information can be used to further the development of the pupil and to improve the educational program.”

Introduction | Testing Window and Times
August 2020 CAASPP CSA Technical Report | 2018–2019 Administration Page 3
In other words, results for tests within the CAASPP System are used for two primary purposes:
1. To communicate students’ progress in achieving the state’s academic standards to students, parents and guardians, and teachers
2. To inform decisions that teachers and administrators make about improving the educational program
Sections 60602.5(c) and (d) provide additional information regarding use and purpose of test scores for the system of assessments:
“60602.5(c) It is the intent of the Legislature that parents, classroom teachers, other educators, pupil representatives, institutions of higher education, business community members, and the public be involved, in an active and ongoing basis, in the design and implementation of the statewide pupil assessment system and the development of assessment instruments.” “60602.5(d) It is the intent of the Legislature, insofar as is practically feasible and following the completion of annual testing, that the content, test structure, and test items in the assessments that are part of the statewide pupil assessment system become open and transparent to teachers, parents, and pupils, to assist stakeholders in working together to demonstrate improvement in pupil academic achievement. A planned change in annual test content, format, or design should be made available to educators and the public well before the beginning of the school year in which the change will be implemented.”
1.5. Testing Window and Times The CSA for grades three through twelve was administered online within a testing window from April 1 through July 15, 2019. Similar to other CAASPP assessments, the CSA was untimed for test takers. A student could take the CSA within the testing window over as many days as required to meet a student’s needs (California Code of Regulations, Title 5, Education, Division 1, Chapter 2, Subchapter 3.75, Article 2, Section 855[a]).
1.6. Groups and Organizations Involved with the CSA 1.6.1. State Board of Education (SBE)
The SBE is the state agency that establishes educational policy for kindergarten through grade twelve in the areas of standards, instructional materials, assessment, and accountability. The SBE adopts textbooks for kindergarten through grade eight, adopts regulations to implement legislation, and has the authority to grant waivers of the Education Code. In addition to adopting the rules and regulations for itself, its appointees, and California’s public schools, the SBE is also the state educational agency responsible for overseeing California’s compliance with programs that meet the requirements of the federal Every Student Succeeds Act and the state’s Public School Accountability Act, which measure the academic performance and progress of schools on a variety of academic metrics (California Department of Education [CDE], 2020a).
Introduction | Groups and Organizations Involved with the CSA
CAASPP CSA Technical Report | 2018–2019 Administration August 2020 Page 4
1.6.2. California Department of Education (CDE) The CDE oversees California’s public school system, which is responsible for the education of more than 6,200,000 children and young adults in more than 10,500 schools.1 California aims to provide a world-class education for all students, from early childhood to adulthood. The CDE serves the state by innovating and collaborating with educators, school staff, parents/guardians, and community partners which together, as a team, prepares students to live, work, and thrive in a highly connected world. Within the CDE, it is the Instruction & Measurement Branch that oversees programs promoting improved student achievement. Programs include oversight of statewide assessments and the collection and reporting of educational data (CDE, 2020b).
1.6.3. California Educators A variety of California educators and content experts, including teachers and school administrators—who were selected based on their qualifications, experiences, demographics, and geographic locations—were invited to participate in the various aspects of the assessment process prior to the current administration. This included defining the purpose and scope of the assessment, assessment design, item development, and standard setting.
1.6.4. Contractors 1.6.4.1. Educational Testing Service The CDE and the SBE contract with Educational Testing Service (ETS) to develop, administer, and report CSA results. As the prime contractor, ETS has the overall responsibility for working with the CDE to implement and maintain an effective assessment system and to coordinate the work of ETS with its subcontractors. Activities directly conducted by ETS include, but are not limited to, the following:
• Providing management of the program activities
• Supporting and training counties, local educational agencies (LEAs), and direct funded charter schools
• Providing tiered help desk support to LEAs
• Developing all CSA items
• Constructing, producing, and controlling the quality of CSA forms and related test materials, including Directions for Administration
• Hosting and maintaining a website with resources for LEA CAASPP coordinators
• Developing, hosting, and providing support for the Test Operations Management System (TOMS)
• Processing student test assignments
1 Retrieved from the CDE Fingertip Facts on Education in California – CalEdFacts web page at https://www.cde.ca.gov/ds/sd/cb/ceffingertipfacts.asp

Introduction | Systems Overview and Functionality
August 2020 CAASPP CSA Technical Report | 2018–2019 Administration Page 5
• Producing and distributing score reports
• Developing a score reporting website that can be viewed by the public
• Completing all psychometric procedures 1.6.4.2. American Institutes for Research (AIR) ETS also monitors and manages the work of AIR (now Cambium Assessment), subcontractor to ETS for the CAASPP System of online assessments. Activities conducted by AIR include
• providing the AIR proprietary test delivery system (TDS), including the Student Testing Interface, Test Administrator Interface, secure browser, and practice and training tests;
• hosting and providing support for its TDS and Online Reporting System (ORS), a component of the overall CAASPP Assessment Delivery System;
• scoring machine-scorable items; and
• providing Level 3 technology help desk support to LEAs.
1.7. Systems Overview and Functionality 1.7.1. Test Operations Management System (TOMS)
TOMS is the password-protected, web-based system used by LEAs to manage all aspects of CAASPP testing. TOMS serves various functions, which, for the operational CSA, included but were not limited to the following:
• Managing test administration windows
• Assigning and managing the CSA test administrator user role
• Managing student test assignments and accessibility resources
• Viewing and downloading reports
• Providing a platform for authorized user access to secure materials such as student data and results, CAASPP user information, and access to the CAASPP Security and Test Administration Incident Reporting System form and the Appeals module
TOMS receives student enrollment data and LEA and school hierarchy data from the California Longitudinal Pupil Achievement Data System (CALPADS) via a daily feed. CALPADS is “a longitudinal data system used to maintain individual-level data including student demographics, course data, discipline, assessments, staff assignments, and other data for state and federal reporting.”2 LEA staff involved in the administration of the CAASPP, such as LEA CAASPP coordinators, test site coordinators, test administrators, and test examiners, are assigned varying levels of access to TOMS. For example, only an LEA CAASPP coordinator is given permission to set up the LEA’s test administration window; a test administrator cannot download student reports. A description of user roles is
2 From the CDE California Longitudinal Pupil Achievement Data System (CALPADS) web page at http://www.cde.ca.gov/ds/sp/cl/.
Introduction | Systems Overview and Functionality
CAASPP CSA Technical Report | 2018–2019 Administration August 2020 Page 6
explained more extensively in the 2018–19 CAASPP Online Test Administration Manual (CDE, 2019).
1.7.2. Test Delivery System (TDS) The TDS is the means by which the statewide online assessments are delivered to students. Components of TDS include
• the Test Administrator Interface, the web browser–based application that allows test administrators to activate student tests and monitor student testing;
• the Student Testing Interface, on which students take the test using the secure browser; and
• the secure browser, the online application through which the Student Testing Interface may be accessed. The secure browser prevents students from accessing other applications during testing.
1.7.3. Practice and Training Tests The practice and training tests, offered by grade band (grades three through five, grades six through eight, and high school), were provided to LEAs to prepare students and LEA staff for the summative assessment. These tests simulate the experience of the CSA online assessments. Unlike the summative assessments, the practice and training tests do not assess standards, gauge student success on the operational test, or produce scores. Students, teachers, and the public may access them using a web browser. Both the practice and training tests are offered in standard versions and accommodated versions for students with visual impairment. The purposes of the training tests are to allow students and administrators to quickly become familiar with the user interface and components of the TDS as well as with the process of starting and completing a testing session. The purpose of the practice tests is to allow students and administrators to experience a grade-level assessment, grade-specific items and difficulty levels, and the format and structure of an operational assessment.
1.7.4. California Educator Reporting System (CERS) Currently, there are two California online reporting systems: the Online Reporting System (ORS), which does not report CSA results; and the CERS. Over the next two years, the CERS will replace the ORS as the single resource where LEA staff access student results from the summative and interim CAASPP assessments, including the CSA, as well as results from the English Language Proficiency Assessments for California. The CERS allows educators to view their students’ assessment results using grouping and other new features. For example, educators can create customized groups from assigned student groups; for interim assessments, specific assessment items can be viewed with student responses; and a distractor analysis feature can be used to identify student strengths and needs.
Introduction | Overview of the Technical Report
August 2020 CAASPP CSA Technical Report | 2018–2019 Administration Page 7
1.8. Overview of the Technical Report This technical report addresses the characteristics of the CSA administered in spring 2019 and contains eight additional chapters as follows:
• Chapter 2 presents an overview of the processes involved in a testing cycle for the CSA. This chapter includes item development, test assembly, test administration, scoring, reporting, psychometric analyses, and standard setting. The details on each stage in the testing process will be presented in the subsequent chapters.
• Chapter 3 discusses the test blueprint, item development, and detailed procedures of test assembly for the 2018–2019 administration.
• Chapter 4 details the processes involved in the administration of the CSA. It also describes the procedures followed by ETS to maintain test security throughout the test administration process.
• Chapter 5 summarizes the standard setting process that established the base-year score reporting ranges. Details include the achievement level descriptors, an overview of the standard setting methodology, and the process to establish the threshold scores that define the score reporting ranges for the CSA. These standard setting processes were based on student testing results from the 2018–2019 administration.
• Chapter 6 summarizes the types of scores and score reports that are produced at the end of each administration of the CSA.
• Chapter 7 summarizes the results of the psychometric analyses for the CSA 2018–2019 operational assessment, including classical item analyses, response time analyses, test completion analyses, differential item functioning analyses, and item response theory calibration and scaling. Test reliability and reliability analysis results are also reported.
• Chapter 8 highlights the quality control processes used at various stages of administration of the CSA.
• Chapter 9 discusses the various procedures used to gather information to improve the CSA as well as strategies to implement possible improvements.
Introduction | References
CAASPP CSA Technical Report | 2018–2019 Administration August 2020 Page 8
References California Code of Regulations, Title 5, Education, Division 1, Chapter 2, Subchapter 3.75,
Article 2, Section 855. Retrieved from https://govt.westlaw.com/calregs/Document/I2DB6A0BAA54F41B69BAF5553FABBE5EF?viewType=FullText&originationContext=documenttoc&transitionType=CategoryPageItem&contextData=(sc.Default)
California Department of Education. (2019). CAASPP online test administration manual, 2018–19 administration. Sacramento, CA: California Department of Education. Retrieved from https://ca-toms-help.ets.org/caaspp-otam/
California Department of Education. (2020b, August). Organization. Retrieved from http://www.cde.ca.gov/re/di/or/
California Department of Education. (2020a, October). State Board of Education responsibilities. Retrieved from http://www.cde.ca.gov/be/ms/po/sberesponsibilities.asp
An Overview of the Operational Assessment Process | Item Development
August 2020 CAASPP CSA Technical Report | 2018–2019 Administration Page 9
Chapter 2: An Overview of the Operational Assessment Process
This chapter provides an overview of the processes implemented by Educational Testing Service (ETS) during the full testing cycle for the 2018–2019 California Spanish Assessment (CSA), including item development, test administration, scoring, reporting, psychometric analyses, and standard setting. The details on each step in the process will be presented in the subsequent chapters.
2.1. Item Development ETS developed 757 field test items across the seven grade levels (i.e., grades three through eight and high school) for the 2018 fall field test and delivered them to the California Department of Education (CDE) via the ETS Item Banking Information System (IBIS). The total number of machine-scorable items developed and field-tested (757) was greater than the number to be administered operationally (364) in the 2018–2019 administration because overage was built in. The developed items were designed to be engaging to the student population and represented a wide variety of item types. All items for the CSA field tests were developed in accordance with the ETS Standards for Quality and Fairness (ETS, 2014) across all phases of item and test development. While under initial development, the assessment materials, including items, passages, constructed-response (CR) prompts, and listening stimuli, were stored on password-protected ETS computers and secure internal network drives. Audio recordings were produced as electronic audio files and delivered securely to the CDE for review. All secure documents needed for CDE review that were not available in IBIS were delivered to the CDE via the Tumbleweed secure file transfer protocol server.
2.1.1. Item Format The CSA includes the following primary online item formats:
• Selected-response (SR) items—Students are instructed to select one or more choices. Most CSA items have two or three options; a few items have four options.
• Technology-enhanced items (TEIs)—Technology beyond simple option selection is incorporated in some items.
Detailed information on item format is included in subsection 3.3.3 Item Types and Features in Chapter 3: Item Development and Test Assembly. All items included in the CSA 2018–2019 forms were machine-scorable.
2.1.2. Item Specifications The CSA item specifications provide descriptions of item characteristics that are intended to measure each content standard consistently. They were developed based on the California Common Core State Standard en Español guidelines. During item development, assessment specialists were provided CSA item specifications and a CSA style guide that contained detailed information about the consistency in item development and item review processes. Refer to subsection 3.3.1 Item Specifications in chapter 3 for detailed information about item specifications.
An Overview of the Operational Assessment Process | Test Assembly
CAASPP CSA Technical Report | 2018–2019 Administration August 2020 Page 10
2.1.3. Item Banking Following the first operational administration of the CSA, the operational forms across all grades will be refreshed for future administrations. To support the proposed refresh rates of 20 percent for grades three through eight and 35–50 percent for high school, it is necessary to build an item bank where content and statistical attributes of each item are included. All the items in the item bank need to be calibrated and linked onto common scales. Following the 2018 fall CSA field test administration, the test forms used to assemble the forms for the 2018–2019 CSA administration included operational items only. After the 2018–2019 CSA administration, initial item analyses were implemented, and the results were reviewed by ETS Psychometric Analysis & Research (PAR) and Assessment & Learning Technology Development (ALTD) staff, who provided recommendations to the CDE on whether the items should be included or excluded from the calibrations. Decisions were made in consultation with the CDE; details of this process are in section 7.2 Classical Item Analyses. Next, the operational items were calibrated to establish the baseline scales that define the score reporting range. The scales used the 2018–2019 administration student response data. Refer to section 7.4 IRT Analyses for calibration and linking. Final item analyses were conducted following the calibration and linking step after the testing window was closed. Content experts from ETS and the CDE, as well as selected California educators, reviewed the associated item statistics and evaluated the performance of items during the annual data review meeting. They also reviewed the flagged items—those whose statistics fell beyond expected ranges—and worked to provide plausible explanations for these particular items based on their knowledge of the student population. With the CDE’s approval, the operational items and field test items, together with their statistical information, were entered into the item bank for form assembly in future administrations. It is expected that more new items will be developed, field-tested, and entered into the item bank for future administrations. In this way, the item bank will expand gradually to support the rate of refresh.
2.2. Test Assembly The ETS ALTD team built operational 2018–2019 test forms using items administered during the 2018 fall field test. The CDE reviewed operational 2018–2019 forms in IBIS before they were configured by AIR. No new field test items were embedded into the operational 2018–2019 forms, so each grade level’s test form was composed of the 52 items needed to comply with the CSA blueprint. Additional information about the test assembly of the CSA can be found in Chapter 3: Item Development and Test Assembly. Psychometric criteria were specified for the test form review before the test administration. The psychometric guidelines of item selection and form building were developed during the preliminary review of the assembled test forms for the CSA 2018–2019 operational administration. Prior to the 2018–2019 administration, ETS content staff and PAR staff reviewed the assembled forms thoroughly in regard to the following aspects of the operational forms:
• Coverage of blueprints • Overall test design and statistical properties • Statistical properties of individual items

An Overview of the Operational Assessment Process | Test Administration
August 2020 CAASPP CSA Technical Report | 2018–2019 Administration Page 11
Details of the psychometric criteria of form review are included in section 3.8 Test Production Process.
2.3. Test Administration It was of the utmost priority to administer the CSA in a secure, confidential, standardized, consistent, and appropriate manner. The CSA is administered online using the secure browser and test delivery system (TDS), ensuring a secure, confidential, standardized, consistent, and appropriate administration for students. Additional information about the administration of the CSA can be found in Chapter 4: Test Administration.
2.3.1. Test Security and Confidentiality All tests within the California Assessment of Student Performance and Progress (CAASPP) System are secure. For the CSA, every person with access to test materials maintained the security and confidentiality of the tests. ETS’ internal Code of Ethics requires that all test information, including tangible materials (e.g., test questions and test results), confidential files, processes, and activities are kept secure. To ensure security for all tests that ETS develops or handles, ETS maintains an Office of Testing Integrity (OTI). A detailed description of the OTI and its mission is presented in subsection 4.8.1 ETS’ Office of Testing Integrity (OTI). In the pursuit of enforcing secure practices, ETS strives to safeguard the various processes involved in a test development and administration cycle. The practices related to each of the following security processes are listed below and discussed in detail in section 4.8 Test Security and Confidentiality:
• Standardization of test security • Security of electronic files using a firewall • Transfer of scores via secure data exchange • Data management • Statistical analysis • Student confidentiality • Student test results
2.3.2. Procedures to Maintain Standardization ETS takes all necessary measures to ensure the standardization of CSA administration. The measures for standardization include, but are not limited to, the aspects described in these subsections. 2.3.2.1. Test Administrators The CSA grade-level assessments are administered in conjunction with the other assessments that compose the CAASPP System. ETS employs processes to ensure the standardization of an administration cycle; these processes are discussed in more detail in subsection 4.4 Procedures to Maintain Standardization. Staff at local educational agencies (LEAs) involved in CSA administration include LEA CAASPP coordinators, CAASPP test site coordinators, and test administrators. The responsibilities of each of the staff members are described in the CAASPP Online Test Administration Manual (CDE, 2019a).

An Overview of the Operational Assessment Process | Fairness and Accessibility
CAASPP CSA Technical Report | 2018–2019 Administration August 2020 Page 12
2.3.2.2. Test Directions Several series of instructions regarding the CAASPP administration are compiled in detailed manuals and provided to the LEA staff. Such documents include, but are not limited to, the following:
• CAASPP Online Test Administration Manual—This is a manual that provides test administration procedures and guidelines for LEA CAASPP coordinators, and CAASPP test site coordinators, as well as the script and directions for administration to be followed exactly by test administrators during a testing session (CDE, 2019a). (Refer to 4.4.4.2 CAASPP Online Test Administration Manual in chapter 4 for more information.)
• Test Operations Management System (TOMS) Pre-Administration Guide for CAASPP Testing—This is a manual that provides instructions for TOMS allowing LEA staff, including LEA CAASPP coordinators and CAASPP test site coordinators, to perform a number of tasks including setting up test administrations, adding and managing users, assigning tests, and configuring online student test settings (CDE, 2019b). (Refer to 4.4.4.3 TOMS Pre-Administration Guide for CAASPP Testing in chapter 4 for more information.)
2.4. Fairness and Accessibility There are several procedures in place to ensure that the CSA is fair and accessible to all test takers. This section provides information on the available accessibility resources to use with the CSA. Additionally, the differential item functioning analysis used to identify items that may function differently across groups of examinees (e.g., gender) is also discussed briefly.
2.4.1. Universal Tools, Designated Supports, and Accommodations California public school students in grades three through twelve participate in the CAASPP System of assessments, including students with disabilities and English learners. Additional resources are sometimes needed for these students. The CDE provides a full range of assessment resources for all students. There are four different categories of student accessibility resources in the California assessment accessibility system, including universal tools, designated supports, accommodations, and unlisted resources that are permitted for use in CAASPP online assessments. These are listed in the CDE web document “Matrix One: Universal Tools, Designated Supports, and Accommodations for the CAASPP System” (CDE, 2019c). 3 Universal tools are available to all. These resources may be turned on and off when embedded as part of the technology platform for the online CSA assessments on the basis of student preference and selection. Designated supports are available when determined as needed by an educator or team of educators, with parent/guardian and student input as appropriate, or when specified in the student’s individualized education program (IEP) or Section 504 plan.
3 This technical report is based on the version of Matrix One that was available during the 2018–2019 CAASPP administration.

An Overview of the Operational Assessment Process | Fairness and Accessibility
August 2020 CAASPP CSA Technical Report | 2018–2019 Administration Page 13
Accommodations must be permitted on the CAASPP assessments for all eligible students when specified in the student’s IEP or Section 504 plan. Unlisted resources are non-embedded and made available if specified in the eligible student’s IEP or Section 504 plan and only on approval by the CDE. Assignment of designated supports and accommodations to individual students based on student need is made in TOMS by the LEA CAASPP coordinator or CAASPP test site coordinator, either through individual assignment through the student’s profile in TOMS; by uploading of settings for multiple students that were either selected and entered into a macro-enabled template called the Individual Student Assessment Accessibility Profile (ISAAP) Tool that created an upload file; or entered into a template without macros. These designated supports and accommodations were delivered to the student through the test delivery system at the time of testing. Refer to section 1.7 Systems Overview and Functionality in Chapter 1: Introduction for more details regarding this system. 2.4.1.1. Resources for Selection of Accessibility Resources The full list of the universal tools, designated supports, and accommodations that are used in CAASPP online assessments are documented in Matrix One (CDE, 2019c). Most embedded universal tools, designated supports, and accommodations listed in parts 1 and 2 of Matrix One are available for the CSA through the online testing interface. Part 1 of Matrix One lists the embedded resources. Parts 2 and 3 of Matrix One include the non-embedded resources. School-level personnel, IEP teams, and Section 504 teams use Matrix One when deciding how best to support a student’s or students’ test-taking experience. In the selection of universal tools, designated supports, and accommodations deemed necessary for individual students, the CDE follows the guidelines outlined in the Smarter Balanced Assessment Consortium’s Usability, Accessibility, and Accommodations Guidelines (“Guidelines”) (Smarter Balanced, 2019).4 The Guidelines apply to all students and promote an individualized approach to the implementation of assessment best practices. The Guidelines are intended to provide policy regarding universal tools, designated supports, and accommodations. Another manual, the Smarter Balanced Usability, Accessibility, and Accommodations Implementation Guide (Smarter Balanced, 2014), provides suggestions for implementation of these resources. In addition to assigning accessibility resources individually and via file upload in TOMS, LEAs had the option of using the ISAAP Tool to assign resources to students, which was adapted to include the CSA, to facilitate selection of the accessibility resources that match student access needs for the CSA. The CAASPP ISAAP Tool was used by LEAs in conjunction with the Guidelines as well as with state regulations and policies (such as Matrix One) related to assessment accessibility as a part of the ISAAP process. LEA personnel, including IEP and Section 504 plan teams, used the CAASPP 2018–2019 ISAAP Tool to facilitate the selection of designated supports and accommodations for students.
4 This technical report is based on the version of the Usability, Accessibility, and Accommodations Guidelines that was available during the 2018–2019 CAASPP administration.

An Overview of the Operational Assessment Process | Scoring and Reporting
CAASPP CSA Technical Report | 2018–2019 Administration August 2020 Page 14
2.4.1.2. Delivery of Accessibility Resources Universal tools, designated supports, and accommodations can be delivered as either embedded or non-embedded resources. Embedded resources are digitally delivered features or settings available as part of the technology platform for the online CAASPP assessments. Examples of embedded resources include the braille language resource, color contrast, and closed-captioning for listening items. Non-embedded resources are not part of the technology platform for the computer-administered CAASPP tests. Examples of non-embedded resources include magnification, noise buffers, and the use of a scribe. Refer to section 4.6 Universal Tools, Designated Supports, and Accommodations for Students with Disabilities for a detailed description of the accessibility resources available to students taking the CSA. 2.4.1.3. Unlisted Resources An unlisted resource is an instructional support a student regularly uses in daily instruction, assessment, or both, and has not been previously identified as a universal tool, designated support, or accommodation. Matrix One includes an inventory of unlisted resources that have already been identified and preapproved (CDE, 2019c). During the 2018–2019 CAASPP administration, an LEA CAASPP coordinator or a CAASPP test site coordinator had the option to submit a web form available in TOMS to request such a resource for an eligible student. The resource was required to be specified in the eligible student’s IEP or Section 504 plan and only assigned with the CDE’s approval. For an unlisted resource to be approved, it must not change the construct of what is being tested. If it did, test results for a student using an unlisted resource that was approved but changed the construct of what was being tested was considered valid for accountability purposes. The student received a score with a footnote that the test was administered under conditions that resulted in a score that may not be an accurate representation of the student’s achievement.
2.4.2. Differential Item Functioning (DIF) DIF analyses are conducted to detect possible test bias by locating items for which one group of students performs significantly better than another group. DIF is a collection of statistical methods used to recognize if performance varies across different groups of examinees (e.g., male vs. female). If an item performs differentially across student groups when students are matched on ability, the item may be measuring something other than the intended construct. Therefore, it is important to identify items flagged for DIF. Content experts and bias and sensitivity experts from diverse backgrounds review these DIF-flagged items and determine the sources and meanings of performance differences. Refer to section 7.3 Differential Item Functioning (DIF) Analyses and appendix 7.B for DIF analysis results.
2.5. Scoring and Reporting The CSA contained traditional multiple choice (MC) items and TEIs. The MC items and TEIs were machine-scored through the TDS. The CSA total test raw scores equal the sum of students’ scores on the operational test items. Total test raw scores on each CSA are converted to three-digit scale scores using the scaling process described in Chapter 7: Analyses. Individual student scores were reported
An Overview of the Operational Assessment Process | Scoring and Reporting
August 2020 CAASPP CSA Technical Report | 2018–2019 Administration Page 15
through the use of these scale scores for the 2018–2019 CSA. In addition, student test scores were aggregated to produce summary reports for schools and LEAs.
2.5.1. Estimating Ability Scores The item response theory (IRT) inverse test characteristic curve method (Stocking, 1996)—where the student’s ability value is estimated to be the value for which the expected number-correct score is equal to the student’s number-correct score—is used to estimate students’ overall ability parameters. For the purpose of reporting, students’ ability estimates (theta scores) are then expressed in three-digit scale scores by applying the appropriate linear transformation for each grade level. Student performance on the reporting scale is designated into one of three score reporting ranges. For information regarding score specifications and the establishment of score-reporting scales, refer to Chapter 6: Scoring and Reporting. For information regarding CSA score reporting ranges, refer to Chapter 5: Standard Setting for a description of the process used to set achievement level standards.
2.5.2. Score Reporting TOMS is a secure website hosted by ETS that permits LEA users to manage aspects of CAASPP test administration such as test assignment and the assignment of test settings. It also provides a secure means for LEA CAASPP coordinators to download Student Score Reports as PDF files. CSA scores could also be viewed through the California Educator Reporting System (CERS), a secure website that provides authorized users with interactive and cumulative online reports for the CSA at the student, school, and LEA levels. The CERS provides three types of score reports: an individual student score report, a school report, and an LEA report. Refer to 6.3.1 Online Reporting for details about TOMS and the CERS; and subsection 6.3.3 Types of Score Reports for the content of each type of score report.
2.5.3. Aggregation Procedures To provide meaningful results to the stakeholders, CSA scores for a given grade are aggregated and generated at the school, LEA or direct funded charter school, county, and state levels. State-level results are available on the Test Results for California’s Assessments website at https://caaspp-elpac.cde.ca.gov/caaspp/. The aggregated scores are presented for all students or selected demographic student groups. Aggregate scores are generated by combining student scores. They can be created by combining results at the state, LEA or direct funded charter school, or school level; combining for all students; or by combining results for students who represent selected demographic student groups. The aggregation procedures used to present CSA results are described in section 6.2 Overview of Score Aggregation Procedures. Aggregated scores that summarize student performance by grade for selected groups of students are provided in table 6.C.1 through table 6.C.11 of appendix 6.C. The tables show the numbers of students with valid scores in each group, scale score means and standard deviations, and percentage in the score reporting ranges. Students are grouped by demographic characteristics, including gender, ethnicity, English language fluency, economic status (disadvantaged or not), special education services status, length of enrollment in U.S. schools reported in the California Longitudinal Pupil
An Overview of the Operational Assessment Process | Analyses
CAASPP CSA Technical Report | 2018–2019 Administration August 2020 Page 16
Achievement Data System, self-reported Spanish-language program type, and self-reported percentage of instruction in Spanish. Definitions for the demographic groups included in these tables are provided in table 4.1.
2.6. Analyses Psychometric analyses were conducted on the data from the CSA, including classical item analyses, differential item functioning analyses, IRT calibration and linking, response time analyses, and reliability analyses. The results of these analyses support understanding of item performances and internal structure and provide validity evidence for both response processes and scoring. Detailed descriptions of these analyses are presented in Chapter 7: Analyses.
2.7. Standard Setting Standard setting is required to allow threshold scores and achievement levels to be available for the fall 2019 release of CSA score reports. The achievement level descriptors (ALDs) describe expectations of what students can do at each level. The general, or policy, ALDs were approved by the California State Board of Education (SBE) in November 2017 (CDE, 2017). To develop threshold-score recommendations aligned to the score-reporting hierarchy (CDE, 2017), ETS conducted standard setting workshops using the data from the 2018–2019 administration to collect recommendations for the CSA threshold scores for the CDE to review and submit for final approval by the SBE. The SBE approved score reporting ranges that were included on the CSA score reports. Detailed descriptions of the standard setting methods implemented, descriptions of the panels and materials used in the workshop, and the results including summary data from the panel judgments and evaluations by the panelists are presented in Chapter 5: Standard Setting.

An Overview of the Operational Assessment Process | References
August 2020 CAASPP CSA Technical Report | 2018–2019 Administration Page 17
References California Department of Education. (2017, November 8). California State Board of
Education: Final minutes: November 8–9, 2017. Retrieved from https://www.cde.ca.gov/be/mt/ms/documents/finalminutes0809nov2017.docx
California Department of Education. (2019a). CAASPP online test administration manual, 2018–19 administration. Sacramento, CA: California Department of Education. Retrieved from https://ca-toms-help.ets.org/caaspp-otam/.
California Department of Education. (2019c). Matrix one: Universal tools, designated supports, and accommodations for the California Assessment of Student Performance and Progress for 2018–19. Sacramento, CA: California Department of Education. Retrieved from https://www.cde.ca.gov/ta/tg/ai/caasppmatrix1.asp
California Department of Education. (2019b). TOMS pre-administration guide for CAASPP testing. Sacramento, CA: California Department of Education. Retrieved from http://www.caaspp.org/rsc/pdfs/CAASPP.TOMS-pre-admin-guide.2018-19.pdf
Educational Testing Service. (2014). ETS standards for quality and fairness. Princeton, NJ: Educational Testing Service. Retrieved from https://www.ets.org/s/about/pdf/standards.pdf
Smarter Balanced Assessment Consortium. (2014). Smarter Balanced Assessment Consortium: Usability, accessibility, and accommodations implementation guide. Los Angeles, CA: Smarter Balanced Assessment Consortium and National Center on Educational Outcomes. Retrieved from https://portal.smarterbalanced.org/library/en/usability-accessibility-and-accommodations-implementation-guide.pdf
Smarter Balanced Assessment Consortium. (2019). Smarter Balanced Assessment Consortium: Usability, accessibility, and accommodations guidelines. Los Angeles, CA: Smarter Balanced Assessment Consortium. Retrieved from https://portal.smarterbalanced.org/library/en/usability-accessibility-and-accommodations-guidelines.pdf
Stocking, M. L. (1996). An alternative method for scoring adaptive tests. Journal of Educational and Behavioral Statistics, 21, 365–89.

Item Development and Test Assembly | Overview
CAASPP CSA Technical Report | 2018–2019 Administration August 2020 Page 18
Chapter 3: Item Development and Test Assembly This chapter provides an overview of the processes implemented by Educational Testing Service (ETS) to develop items for use on the California Spanish Assessment (CSA). These processes include those that are entirely internal to ETS and those that are conducted in coordination with the California Department of Education (CDE), the American Institutes for Research (AIR) (now Cambium Assessment), or both. This chapter describes the detailed procedures of item development and test forms assembly for the operational CSA. In particular, new item types and features that differ from traditional item types are described.
3.1. Overview ETS chose 364 previously field-tested items for use on operational assessments across the seven grade levels—52 items on each general form for grades three through eight and high school—to the CDE via the ETS Item Banking Information System (IBIS). The developed items were designed to be engaging to the student population and represented a wide variety of item types. All items for the operational CSA were developed in accordance with the ETS Standards for Quality and Fairness (ETS, 2014) across all phases of item and test development. While under initial development, the assessment materials, including items, passages, and listening stimuli, were stored on password-protected ETS computers and secure internal network drives. Audio recordings were produced as electronic audio files and delivered securely to the CDE for review. All secure documents needed for CDE review that were not available in IBIS were delivered to the CDE via the Tumbleweed secure file transfer protocol server.
3.2. Test Blueprint Each operational assessment form contained items that approximate the proportions in the test blueprint. The test blueprint for the CSA provides the proposed numbers of items to be included in an operational assessment for each language arts domain assessed in grades three through eight and high school (CDE, 2017). Table 3.1 shows the distribution of the operational assessment items by domain and grade level. Appendix 3.A presents the overview of the CSA blueprint by grade span.
Table 3.1 Number of Operational Assessment Items to Administer per Form
Domain Grade
3 Grade
4 Grade
5 Grade
6 Grade
7 Grade
8 High
School Listening 12 12 12 12 12 12 12 Reading 24 24 24 24 24 24 24 Writing Mechanics 16 16 16 16 16 16 16 Total Number of Items 52 52 52 52 52 52 52

Item Development and Test Assembly | Item Development
August 2020 CAASPP CSA Technical Report | 2018–2019 Administration Page 19
3.3. Item Development Each item for the CSA was developed through a comprehensive cycle and designed to conform to principles of item writing defined by ETS. Each item in the CSA operational item bank was developed to measure a specific California Common Core State Standard en Español (CCCSSeE). In addition, guidelines for style, fairness, and bias and sensitivity help item developers and reviewers ensured consistency across the item development process.
3.3.1. Item Specifications ETS maintains item development specifications for the CSA. These specifications describe the characteristics of the items that should be written to measure each content standard and help ensure that all items developed for the CSA measure the content standards consistently. The content-standard alignment of new items is planned in consultation with the CDE. The specifications include
• a full statement of each CCCSSeE;
• a description of the item guidelines expected for each standard;
• sample item stems for some standards;
• a general list of elements to avoid;
• a description of the kinds of item stems, formats, or both stems and formats appropriate to assess each standard;
• a description of appropriate data representations (such as charts, tables, graphs, or other illustrations);
• the content limits of the standard;
• a description of appropriate reading passages, if applicable; and
• guidelines for passages used to assess reading comprehension, including – a list of topics to avoid, – the acceptable ranges for the number of words on a stimulus card, – expected use of artwork, and – the target number of tasks attached to each reading stimulus card.

Item Development and Test Assembly | Item Development
CAASPP CSA Technical Report | 2018–2019 Administration August 2020 Page 20
3.3.2. Item Format CSA items are developed with the understanding that students who are able may select responses using a mouse, touchscreen, or other supported input device. The majority of items are presented in a split-screen format, with a “stimulus” on the left side of the screen and the item to be answered on the right. The stimulus is usually a passage or vocabulary set. This is shown in figure 3.1.
Figure 3.1 Sample CSA practice test item
A selected number of items have a multimedia stimulus, either a short audio file, a video, an animation, or, for students with visual impairment, alternative text. Items developed for the CSA may be scored as being worth one point or two points.
3.3.3. Item Types and Features The following item types were included in the CSA 2018–2019 operational assessment:
• Multiple choice (MC) (single select and multiple select) • Zone (single select and multiple select) • Inline choice list (single select and multiple select) • Text choices (single select and multiple select) • Numeric • Grid (multiple select) • Match (single select and multiple select) • Composite
ETS developed a variety of technology-enhanced item (TEI) types that required the student to respond to a question in different ways from typical selected-response items. Items may contain a stimulus (e.g., a passage, audio, or image). Students responded to TEIs by typing an answer, completing a graph, dragging a response to a designated area, using a drop-down list selection, or selecting multiple areas in a graphic (also known as “hot spots”). All TEIs were designed to be machine-scorable.
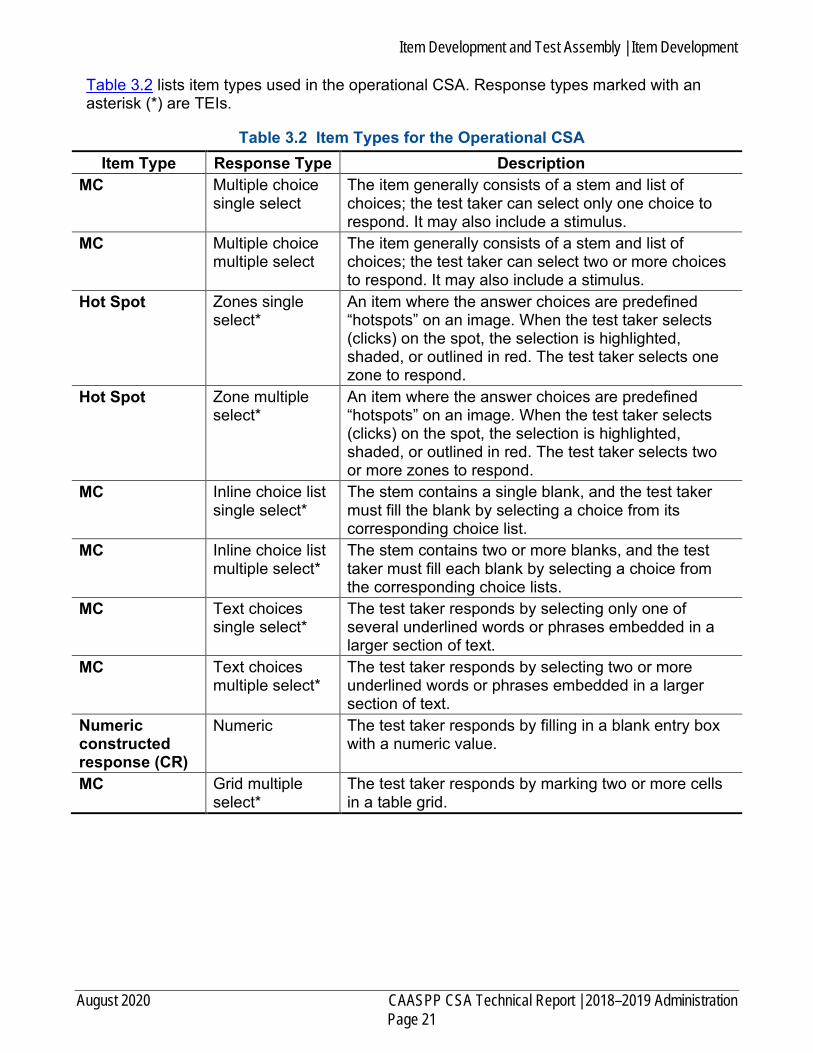
Item Development and Test Assembly | Item Development
August 2020 CAASPP CSA Technical Report | 2018–2019 Administration Page 21
Table 3.2 lists item types used in the operational CSA. Response types marked with an asterisk (*) are TEIs.
Table 3.2 Item Types for the Operational CSA Item Type Response Type Description
MC Multiple choice single select
The item generally consists of a stem and list of choices; the test taker can select only one choice to respond. It may also include a stimulus.
MC Multiple choice multiple select
The item generally consists of a stem and list of choices; the test taker can select two or more choices to respond. It may also include a stimulus.
Hot Spot Zones single select*
An item where the answer choices are predefined “hotspots” on an image. When the test taker selects (clicks) on the spot, the selection is highlighted, shaded, or outlined in red. The test taker selects one zone to respond.
Hot Spot Zone multiple select*
An item where the answer choices are predefined “hotspots” on an image. When the test taker selects (clicks) on the spot, the selection is highlighted, shaded, or outlined in red. The test taker selects two or more zones to respond.
MC Inline choice list single select*
The stem contains a single blank, and the test taker must fill the blank by selecting a choice from its corresponding choice list.
MC Inline choice list multiple select*
The stem contains two or more blanks, and the test taker must fill each blank by selecting a choice from the corresponding choice lists.
MC Text choices single select*
The test taker responds by selecting only one of several underlined words or phrases embedded in a larger section of text.
MC Text choices multiple select*
The test taker responds by selecting two or more underlined words or phrases embedded in a larger section of text.
Numeric constructed response (CR)
Numeric The test taker responds by filling in a blank entry box with a numeric value.
MC Grid multiple select*
The test taker responds by marking two or more cells in a table grid.

Item Development and Test Assembly | Item Development Process
CAASPP CSA Technical Report | 2018–2019 Administration August 2020 Page 22
Table 3.2 (continuation)
Item Type Response Type Description Drag & Drop Match single
select* The test taker responds by dragging and dropping a single choice (“source”) into the appropriate location (“target”).
Drag & Drop Match multiple select*
The test taker responds by dragging and dropping one or more choices (“sources”) into the appropriate locations (“targets”).
All item types except CR
Composite* The test taker completes multiple tasks based on a combination of machine-scored items.
3.4. Item Development Process 3.4.1. Item Development Plan
The items developed for the operational CSA and field-tested in the CSA 2018 fall field test closely reflected the distribution of domains in the blueprint. The total number of machine-scorable items developed and field-tested (757) in the CSA 2018 fall field test was greater than the number to be administered operationally (364) because overage was built in. ETS developed overage to account for the potential rejection of items during item review and data review meetings. If item reviewers at the item review meeting determined that certain items were not appropriate for operational testing, the overage ensured that the minimum item counts for the operational assessment forms would be satisfied. Similarly, if item reviewers at the data review meeting determined that certain items were not performing well enough for operational use, the overage ensured that the blueprint for the operational test forms would still be satisfied. For the general forms in the operational assessment, there was substantial overage built in. However, for the accommodated forms in the operational assessment, there was little overage when accommodations were applied to some of the items. In the future, more items will be developed for the accommodated forms. Table 3.3 shows the number of items developed and field tested in each of the domains of reading, writing mechanics, and listening for the operational CSA.
Table 3.3 Number of Items Developed per Grade Level for the Operational CSA Domain Number
Listening 16–17 Reading 37–43 Writing Mechanics 46–54 Number of Items Developed per Grade Level 106–110
All items created for the CSA adhere to the ETS Standards for Quality and Fairness (2014) across all phases of item and test development. Each CSA item was developed through a comprehensive development cycle and designed to conform to the principles of quality item writing as defined by ETS.

Item Development and Test Assembly | Item Development Process
August 2020 CAASPP CSA Technical Report | 2018–2019 Administration Page 23
3.4.2. Item Development Process Throughout the item writing process, ETS adhered to its foundational guidelines for quality item writing. According to these guidelines, item developers conformed to the following list of attributes for each item:
1. The question is clearly and concisely presented. 2. There is an absence of clueing in the item stem and supporting stimuli. 3. The supporting stimulus or stimuli is presented clearly and is construct-relevant. 4. There is a single correct answer (for selected-response items only). 5. Distractors are plausible, but incorrect (for selected-response only). 6. The answer key is correct. 7. The scoring rubric and annotations are accurate, precise, and complete. 8. Item format and content adhere to the principles of universal design.
3.4.3. Item Specifications ETS maintained item specifications for the CSA that describe the characteristics of items written to measure the CCCSSeE that, in turn, provide evidence for the CSA’s reading, writing mechanics, and listening domains. Using the item specifications helped ensure that all items developed for the CSA measured standards consistently. Item writing assignments were guided by the CSA blueprints, developed in consultation with the CDE. The specifications included
• a description of best practices for item writing: – universal design, – bias and sensitivity avoidance, – cognitive level, – anatomy of an item, – item types and characteristics, – a general list of elements to avoid, and – stand-alone items;
• information about passages used to assess CSA domains;
• a description of standards used for items associated with reading passages, writing mechanics passages, and listening passages;
• a full statement of each standard featured on the CSA blueprint; and
• sample item stems at each grade level for some standards.
3.4.4. Selection of Item Writers Senior ETS content staff screened applications for item writers for the operational CSA, and ETS approved only those with strong content and teaching backgrounds for the item writing training program. ETS selected item writers after the training, but not all recipients of the training became an item writer. Because some of the participants were current or former California educators, they were particularly knowledgeable about the standards assessed by the CSA. All item writers met the following minimum qualifications:

Item Development and Test Assembly | Item Review Process
CAASPP CSA Technical Report | 2018–2019 Administration August 2020 Page 24
• Possession of a bachelor’s degree in a relevant field of education; an advanced degree in the relevant content was desirable
• Previous experience or training in writing items for standards-based assessments, including knowledge of the many considerations that are important when developing items for special student populations
3.4.5. Item Writer Training ETS assessment specialists provided item-writer training to California educators and ETS contractors. The in-person meeting trained California educators on how to write items for the computer-based CSA. ETS led educators through the CCCSSeE, detailed how to write a strong item, and described the functionality of the internet-delivered item types used on this new assessment. ETS held item-writer training workshops to provide prospective item writers with professional development in several areas. A review of the general assessment development process gave trainees a sense of the total life cycle of an item. Participants learned best practices in item writing to provide clarity within the item and avoid bias or sensitivity concerns, learned how to review a passage for item opportunities, and were introduced to how the new, innovative item types work. Given that the trainees were California educators and educational leaders, ETS also emphasized incorporation of current effective teaching practices and instructional activities. Small-group and individual work generated sample items that the ETS facilitators then used in a large-group discussion to analyze and ascertain overall item quality. The ETS team also provided post hoc feedback via email and phone calls to train item writers on further item samples and ideas submitted ahead of contractual item submissions. The primary goals for the training were to
1. provide teachers with knowledge, via professional development on writing items, that they can use to help develop or refine their own classroom teaching and assessments;
2. ensure that teachers who successfully completed the training were ready to develop high-quality items for the operational CSA; and
3. leverage the experiences, perspectives, and expertise of the teachers in writing items for the operational CSA.
3.5. Item Review Process After items were drafted, ETS placed items developed for the CSA through an extensive internal item review process. This section summarizes the item review process that confirmed the quality of CSA items. Once an item was accepted for authoring, ETS employed a series of internal reviews. These reviews used established criteria to judge the quality of item content and to ensure that each item measures what it was intended to measure. These internal reviews also examined the overall quality of the test items before presentation to the CDE and item review meetings, which are described in more detail in section 3.6 Content Expert Review. All items were entered into IBIS with corresponding artwork and metadata. Within IBIS, items received ETS internal content, fairness, and editorial reviews.

Item Development and Test Assembly | Item Review Process
August 2020 CAASPP CSA Technical Report | 2018–2019 Administration Page 25
The CDE reviewed proposed changes to items in response to reviews by the participants of the Item and Passage Review meetings to ensure the quality of the item pool. The CDE then gained access to operational CSA items and conducted reviews in IBIS. ETS revised items in response to comments from the CDE prior to using them in the operational assessment forms. The ETS review process for the CSA includes the following; these tasks are described in the next subsections:
1. Content review 2. Editorial review 3. Fairness review
Throughout this multistep item review process, the lead content-area assessment specialists and development team members at ETS continually evaluated the activities and items for adherence to the rules for item development.
3.5.1. ETS Content Review On all items ETS developed, content-area assessment specialists conducted three reviews on items and stimuli. These assessment specialists verified that the items and stimuli were in compliance with ETS’s written guidelines for clarity, style, accuracy, and appropriateness for California students and were also in compliance with the approved item specifications. Assessment specialists reviewed each item in terms of the following characteristics:
• Relevance of each item to the purpose of the test • Match of each item to the item specifications, including the tier of item complexity • Match of each item to the principles of quality item writing • Match of each item to the identified standard or standards • Difficulty of the item • Accuracy of the content of the item • Readability of the item or passage • Grade-level appropriateness of the item • Appropriateness of any illustrations, graphs, or figures
Assessment specialists checked each item against its classification codes, both to evaluate the correctness of the classification and to confirm that the task posed by the item was relevant to the outcome it was intended to measure. The reviewers could accept the item and classification as written, suggest revisions, or recommend that the item be discarded. These steps occurred prior to the CDE’s review.
3.5.2. ETS Editorial Review After content-area assessment specialists and researchers reviewed each item, a group of specially trained editors also reviewed each item in preparation for consideration by the CDE and the item review panelists. The editors checked items for clarity, correctness of language, appropriateness of language for the grade level assessed, adherence to the style guidelines, and conformity with accepted item-writing practices.
3.5.3. ETS Sensitivity and Fairness Review ETS assessment specialists who were specially trained to identify and eliminate questions that contained content or wording that could be construed to be offensive to or biased against members of specific ethnic, racial, or gender groups conducted the next level of

Item Development and Test Assembly | Content Expert Review
CAASPP CSA Technical Report | 2018–2019 Administration August 2020 Page 26
review (ETS, 2014, 2016). These trained staff members reviewed every item before the CDE and item review meetings. The review process promoted a general awareness of and responsiveness to the following:
• Cultural diversity
• Diversity of background, cultural tradition, and viewpoints to be found in the test-taking populations
• Changing roles and attitudes toward various groups
• Role of language in setting and changing attitudes toward various groups
• Contributions of diverse groups (including ethnic and minority groups, individuals with disabilities, and women) to the history and culture of the United States and the achievements of individuals within these groups
• Item accessibility for English learners
3.6. Content Expert Review 3.6.1. California Educator Review
ETS convened the meeting with California educators in Sacramento, California, to
• review Spanish passages and items for the 2018–2019 operational assessment for grade-level appropriateness, content, bias and sensitivity, readability, and overall interest for the test taker; and
• obtain feedback from California educators about the passages and items to inform ETS on the appropriateness of their use on future test forms for the CSA.
The meeting with California educators was held at the end of the item review process as the final content expert review that items must undergo before being placed on an operational assessment. The California educators filled an advisory role to the CDE and ETS and provided guidance on matters related to item development for the CSA. These educators were responsible for reviewing all newly developed items for alignment to the CCCSSeE. Meeting participants also reviewed the items for accuracy of content, clarity of phrasing, and quality. In their examination of test items, participants could raise concerns related to age or grade appropriateness and gender, racial, ethnic, or socioeconomic bias. 3.6.1.1. Composition of Item Review Panels The panelists for the CSA item review meeting current and former teachers, resource specialists, administrators, curriculum experts, and other education professionals. To qualify to participate in the item review meeting, educators had to self-assess their written and spoken Spanish as fluent. Preferred qualifications included
• currently being assigned to teach Spanish language arts;
• currently working in Advanced Placement Spanish Language and Culture, on an International Baccalaureate in Spanish, or both;
• currently working in dual immersion or bilingual programs,
• currently serving heritage speakers;
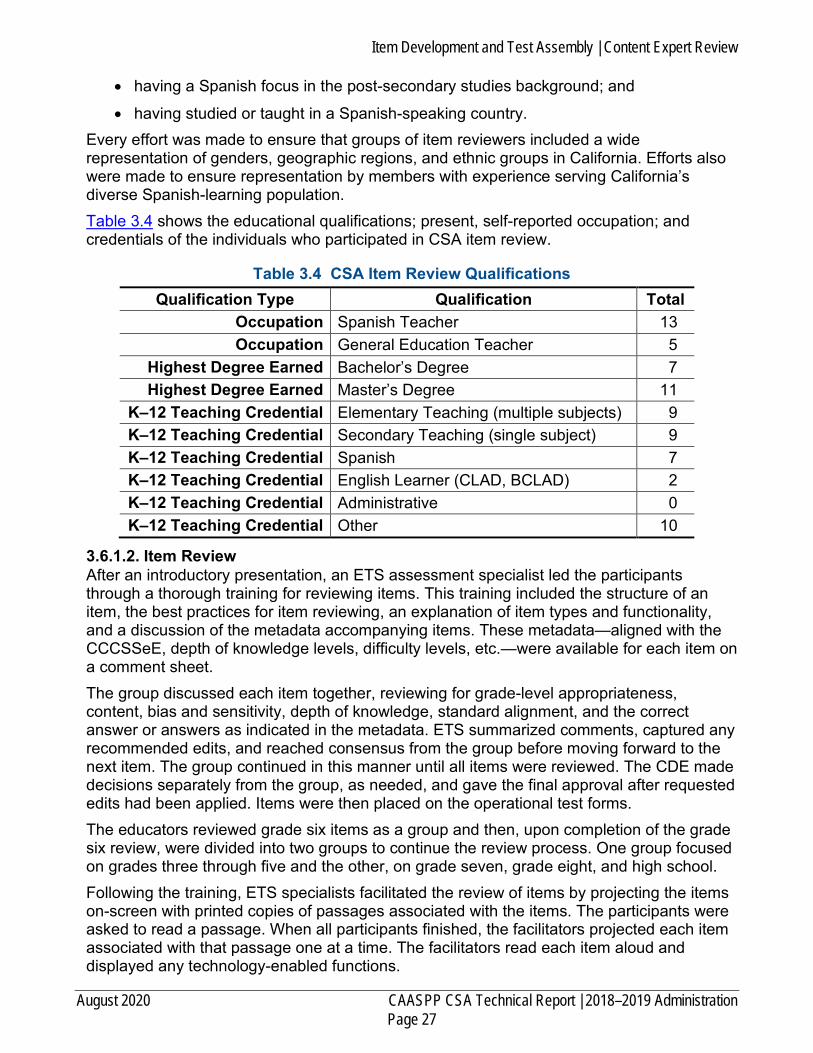
Item Development and Test Assembly | Content Expert Review
August 2020 CAASPP CSA Technical Report | 2018–2019 Administration Page 27
• having a Spanish focus in the post-secondary studies background; and
• having studied or taught in a Spanish-speaking country. Every effort was made to ensure that groups of item reviewers included a wide representation of genders, geographic regions, and ethnic groups in California. Efforts also were made to ensure representation by members with experience serving California’s diverse Spanish-learning population. Table 3.4 shows the educational qualifications; present, self-reported occupation; and credentials of the individuals who participated in CSA item review.
Table 3.4 CSA Item Review Qualifications Qualification Type Qualification Total
Occupation Spanish Teacher 13 Occupation General Education Teacher 5
Highest Degree Earned Bachelor’s Degree 7 Highest Degree Earned Master’s Degree 11
K–12 Teaching Credential Elementary Teaching (multiple subjects) 9 K–12 Teaching Credential Secondary Teaching (single subject) 9 K–12 Teaching Credential Spanish 7 K–12 Teaching Credential English Learner (CLAD, BCLAD) 2 K–12 Teaching Credential Administrative 0 K–12 Teaching Credential Other 10
3.6.1.2. Item Review After an introductory presentation, an ETS assessment specialist led the participants through a thorough training for reviewing items. This training included the structure of an item, the best practices for item reviewing, an explanation of item types and functionality, and a discussion of the metadata accompanying items. These metadata—aligned with the CCCSSeE, depth of knowledge levels, difficulty levels, etc.—were available for each item on a comment sheet. The group discussed each item together, reviewing for grade-level appropriateness, content, bias and sensitivity, depth of knowledge, standard alignment, and the correct answer or answers as indicated in the metadata. ETS summarized comments, captured any recommended edits, and reached consensus from the group before moving forward to the next item. The group continued in this manner until all items were reviewed. The CDE made decisions separately from the group, as needed, and gave the final approval after requested edits had been applied. Items were then placed on the operational test forms. The educators reviewed grade six items as a group and then, upon completion of the grade six review, were divided into two groups to continue the review process. One group focused on grades three through five and the other, on grade seven, grade eight, and high school. Following the training, ETS specialists facilitated the review of items by projecting the items on-screen with printed copies of passages associated with the items. The participants were asked to read a passage. When all participants finished, the facilitators projected each item associated with that passage one at a time. The facilitators read each item aloud and displayed any technology-enabled functions.
Item Development and Test Assembly | Test Assembly and Length
CAASPP CSA Technical Report | 2018–2019 Administration August 2020 Page 28
3.6.1.3. Passage Review Participants were similarly trained to review passages. An ETS assessment specialist led the participants through a training that highlighted what to look for in a strong passage and how to present more detailed information on content and bias and sensitivity issues. Each participant received a grade-level comment sheet, a bias and sensitivity reference document, and a binder containing the passages for review. Educators began by reviewing grade six passages. Grade six was chosen as a starting point to train participants because it is a grade in the middle of the range of grades and it requires neither the extra training in foundational reading for grades three through five nor the secondary consideration of the State Seal of Biliteracy. Once complete, the ETS specialists brought the full group together to discuss each grade six passage for grade-level appropriateness, content, bias and sensitivity, readability, and overall interest for the test taker. The CDE made decisions separate from the group, as needed, and gave the final approval after requested edits had been applied. Upon completion of the grade six review, ETS divided the participants into two groups: one group focused on grades three through five and the other, on grade seven, grade eight, and high school.
3.6.2. Data Review After items were included in the CSA 2018 fall field test and administered to students, ETS conducted data review meetings with California teachers and the CDE after the data analysis was complete. Reviewers examined items that were flagged for item difficulty, item-total correlation, item response distribution, and differential item functioning (DIF) according to predefined criteria. The ETS facilitator led discussions about each flagged item and reviewed the content of the item to reach consensus on whether items should be accepted as is, accepted with revision, or rejected.
3.7. Test Assembly and Length Following the item review process, ETS assessment specialists worked closely with the CDE to select items and assemble operational test forms. The operational test forms were assembled to cover a variety of item types, item difficulties, cognitive levels, and key distributions. ETS developed two operational test forms per grade. Each grade level had one general form with 52 items per form. Each grade level also had one form with accessibility features. It included 52 items that were identical to, or close variants of, selected items on the general operational test form; this form was assigned to students with an individualized education program or Section 504 plan. The estimated duration for the operational assessment was approximately two hours, depending on the student’s grade level.
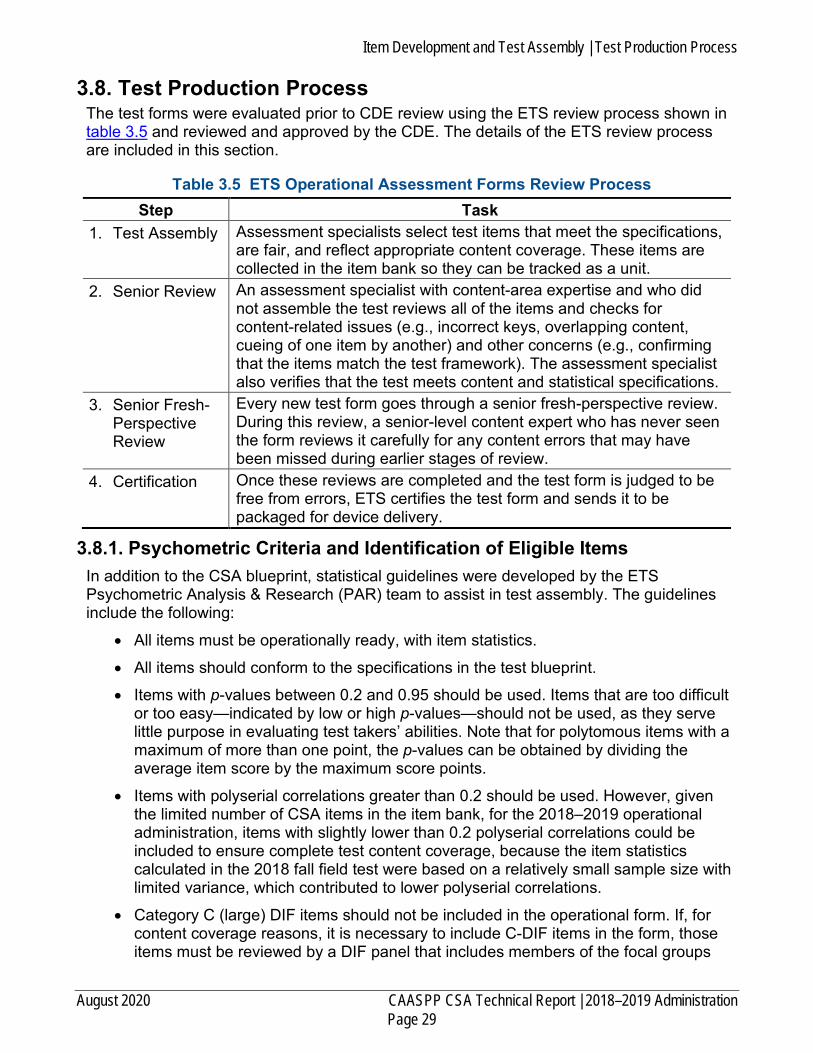
Item Development and Test Assembly | Test Production Process
August 2020 CAASPP CSA Technical Report | 2018–2019 Administration Page 29
3.8. Test Production Process The test forms were evaluated prior to CDE review using the ETS review process shown in table 3.5 and reviewed and approved by the CDE. The details of the ETS review process are included in this section.
Table 3.5 ETS Operational Assessment Forms Review Process Step Task
1. Test Assembly Assessment specialists select test items that meet the specifications, are fair, and reflect appropriate content coverage. These items are collected in the item bank so they can be tracked as a unit.
2. Senior Review An assessment specialist with content-area expertise and who did not assemble the test reviews all of the items and checks for content-related issues (e.g., incorrect keys, overlapping content, cueing of one item by another) and other concerns (e.g., confirming that the items match the test framework). The assessment specialist also verifies that the test meets content and statistical specifications.
3. Senior Fresh-Perspective Review
Every new test form goes through a senior fresh-perspective review. During this review, a senior-level content expert who has never seen the form reviews it carefully for any content errors that may have been missed during earlier stages of review.
4. Certification Once these reviews are completed and the test form is judged to be free from errors, ETS certifies the test form and sends it to be packaged for device delivery.
3.8.1. Psychometric Criteria and Identification of Eligible Items In addition to the CSA blueprint, statistical guidelines were developed by the ETS Psychometric Analysis & Research (PAR) team to assist in test assembly. The guidelines include the following:
• All items must be operationally ready, with item statistics.
• All items should conform to the specifications in the test blueprint.
• Items with p-values between 0.2 and 0.95 should be used. Items that are too difficult or too easy—indicated by low or high p-values—should not be used, as they serve little purpose in evaluating test takers’ abilities. Note that for polytomous items with a maximum of more than one point, the p-values can be obtained by dividing the average item score by the maximum score points.
• Items with polyserial correlations greater than 0.2 should be used. However, given the limited number of CSA items in the item bank, for the 2018–2019 operational administration, items with slightly lower than 0.2 polyserial correlations could be included to ensure complete test content coverage, because the item statistics calculated in the 2018 fall field test were based on a relatively small sample size with limited variance, which contributed to lower polyserial correlations.
• Category C (large) DIF items should not be included in the operational form. If, for content coverage reasons, it is necessary to include C-DIF items in the form, those items must be reviewed by a DIF panel that includes members of the focal groups
Item Development and Test Assembly | Test Production Process
CAASPP CSA Technical Report | 2018–2019 Administration August 2020 Page 30
that were affected. The members of the panel must confirm that the items are not biased. The panelists should not have a vested interest in the outcome of the decision. Additionally, if C-DIF items must be selected, then a balance with regard to the direction of the C-DIF items should be considered; that is, not all C-DIF items should be C- or C+ items. The CDE also needs to sign off on any C-DIF items before they appear on a test. Refer to section 7.3 Differential Item Functioning (DIF) Analyses for additional information about this criterion.
3.8.2. Selection of Items From the eligible item pool, assessment specialists selected items that, as a whole
• met the coverage specifications of the test blueprint, • met the form-building guidelines developed by the ETS PAR team, • represented a wide variety of item types, and • provided a wide variety of item context.
3.8.3. Verification of Statistics ETS assessment specialists sent the proposed assessment to the ETS PAR team for approval. The proposed assessment was reviewed to ensure that all statistical guidelines were met for both individual items and the assessment as a whole.
3.8.4. Content Review of Forms After psychometric approval, the proposed assessment underwent two additional content reviews and one editorial review. The form reviewers are content specialists who work on testing programs other than the CSA for ETS and who are able to bring a fresh perspective to the review. They were given the appropriate materials to complete the following tasks:
• Verification of item keys • Identification of possible clueing across the items • Verification that individual items meet the standard • Verification of coverage of the standards • Identification of any possible grammatical or production errors
3.8.5. CDE Review of Forms Following the ETS content review, all proposed assessments were sent to the CDE for review to ensure the proposed assessments met CSA blueprint requirements and to verify there was no clueing between items or statistical issues. The CDE was provided with the following materials:
• Hardcopies of the proposed forms • Modified form planners • Comment sheets
Comments from the CDE were resolved during a virtual meeting with the ETS test development team.
Item Development and Test Assembly | Test Production Process
August 2020 CAASPP CSA Technical Report | 2018–2019 Administration Page 31
3.8.6. Configuration of the Test Delivery System (TDS) Once all the test reviews were completed and concerns, if any, had been resolved, the official ordered item sequence of the proposed forms was sent to AIR for configuration of the TDS. AIR’s TDS supports a variety of item layouts. Most of the item layouts had the stimulus and item response options and response area displayed side by side. In each of these item layouts, the stimulus and the response options had independent scroll bars. Each item underwent an extensive platform review on different operating systems such as Windows, Linux, and iOS, to ensure that the item looked consistent across all platforms. The platform review was conducted by a team at AIR consisting of a team leader and several team members. The team leader presented the item as it was approved in ETS and AIR item banks. Each team member was assigned a different platform—hardware device and operating system—and reviewed the item to verify that it rendered as expected. This platform review meeting ensured that all items were presented consistently to all students regardless of testing device or operating system for standardization of the test administration. Prior to operational deployment, the testing system and content were deployed to a staging server where they were subject to user acceptance testing (UAT) by both ETS and AIR staff. The TDS UAT served to function as both software evaluation and content approval. The UAT procedures followed by ETS staff included reviewing all items for the CSA. Following the UAT by ETS and AIR staff, separate UAT cycles were conducted by the CDE. The UAT review provided the CDE with an opportunity to interact with the exact test that would be administered to the students. The CDE had to approve the CSA UAT before the test could be released for administration to students.
Item Development and Test Assembly | References
CAASPP CSA Technical Report | 2018–2019 Administration August 2020 Page 32
References California Department of Education. (2017). California Spanish Assessment blueprint.
Sacramento, CA: California Department of Education. Retrieved from https://www.cde.ca.gov/be/ag/ag/yr17/documents/nov17item07a3.pdf
Educational Testing Service. (2014). ETS standards for quality and fairness. Princeton, NJ: Educational Testing Service. Retrieved from https://www.ets.org/s/about/pdf/standards.pdf
Educational Testing Service. (2016). ETS guidelines for fair tests and communications. Princeton, NJ: Educational Testing Service. Retrieved from https://www.ets.org/s/about/pdf/ets_guidelines_for_fair_tests_and_communications.pdf
Test Administration | Test Administration
August 2020 CAASPP CSA Technical Report | 2018–2019 Administration Page 33
Chapter 4: Test Administration This chapter provides an overview of the operational California Spanish Assessment (CSA) test administration, as well as local educational agency (LEA) test taking and demographic summaries. It includes a system functionality overview, descriptions of the efforts and measures to ensure test security, and procedures for implementation of test accommodations based on the Standards for Educational and Psychological Testing (American Educational Research Association [AERA], American Psychological Association [APA], & National Council on Measurement in Education [NCME], 2014, Chapter 6).
4.1. Test Administration The operational CSA was administered to all eligible students in grades three through twelve in spring 2019 in conjunction with the other tests that comprise the CAASPP System. In accordance with the procedures for all online California Assessment of Student Performance and Progress (CAASPP) assessments, LEAs identified test administrators to administer the operational CSA and entered them into the Test Operations Management System (TOMS). Educational Testing Service (ETS) provided LEA staff with the appropriate training materials, such as test administration manuals, videos, and webcasts, to ensure that the LEA staff and test administrators understood how to administer the computer-based CSA. The window for the spring 2019 administration of the operational CSA was April 1 through July 15, 2019. Once the operational assessment administration window opened, each participating LEA and school determined administration dates locally. Students reported to the testing classroom or center and were provided a computer or testing device on which to test. The operational assessment used the same secure browser and online testing platform as all the CAASPP assessments. The students received initial directions in Spanish from the test administrator as well as item-level directions, as needed. At the beginning of each operational assessment, there were three additional questions, administered to collect information on whether the student received instruction in Spanish, the Spanish-language program type, and the percentage of instruction in Spanish.
4.2. Demographic Summaries The number and the percent of students for selected groups with test completion and valid test scores are provided for grades three through eight and high school in table 4.A.1 through table 4.A.11 of appendix 4.A. Grade levels reflect students’ enrolled grade levels during the 2018–2019 school year. In the tables, students are grouped by demographic characteristics, including gender, ethnicity, English language fluency, economic status (disadvantaged or not), special education services status, length of enrollment in U.S. schools, self-reported Spanish-language program type, and percentage of daily instruction in Spanish, as shown in table 4.1. Note that data collected for program types and percentage of the school day instruction comes from the student demographic survey that was part of the operational assessment. Note, too, that Spanish as a foreign language programs are available only for students in grades six through eight and high school.
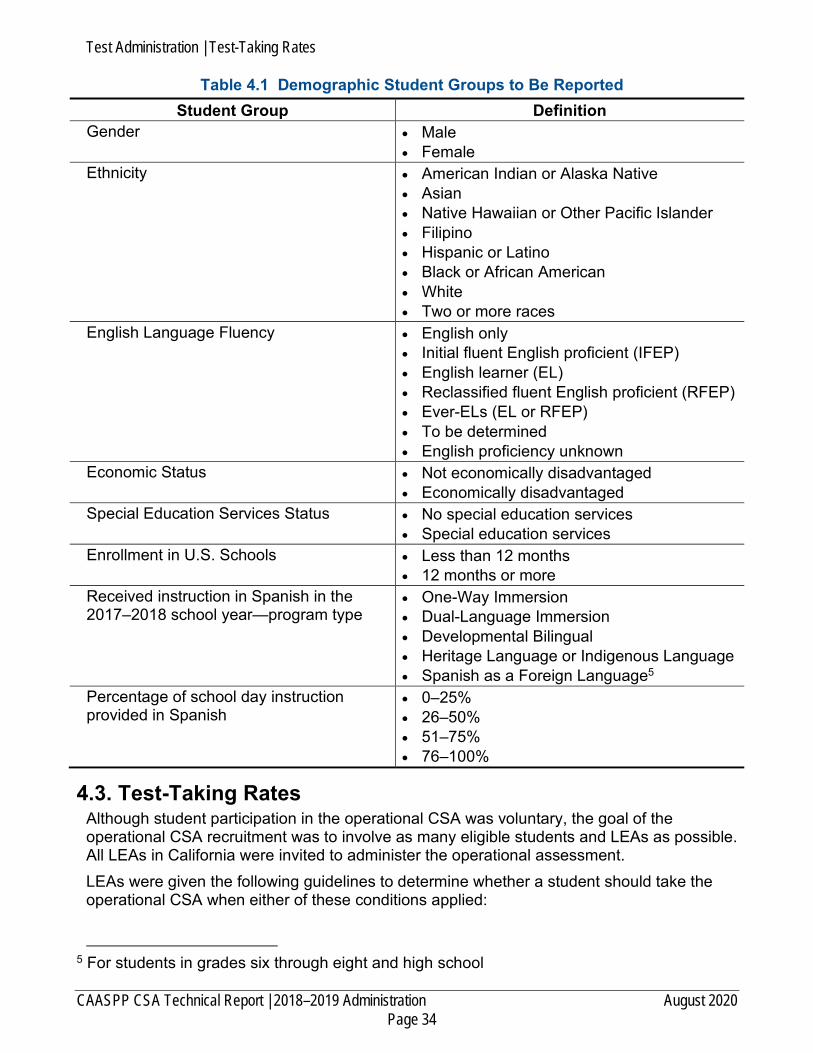
Test Administration | Test-Taking Rates
CAASPP CSA Technical Report | 2018–2019 Administration August 2020 Page 34
Table 4.1 Demographic Student Groups to Be Reported Student Group Definition
Gender • Male • Female
Ethnicity • American Indian or Alaska Native • Asian • Native Hawaiian or Other Pacific Islander • Filipino • Hispanic or Latino • Black or African American • White • Two or more races
English Language Fluency • English only • Initial fluent English proficient (IFEP) • English learner (EL) • Reclassified fluent English proficient (RFEP) • Ever-ELs (EL or RFEP) • To be determined • English proficiency unknown
Economic Status • Not economically disadvantaged • Economically disadvantaged
Special Education Services Status • No special education services • Special education services
Enrollment in U.S. Schools • Less than 12 months • 12 months or more
Received instruction in Spanish in the 2017–2018 school year—program type
• One-Way Immersion • Dual-Language Immersion • Developmental Bilingual • Heritage Language or Indigenous Language • Spanish as a Foreign Language5
Percentage of school day instruction provided in Spanish
• 0–25% • 26–50% • 51–75% • 76–100%
4.3. Test-Taking Rates Although student participation in the operational CSA was voluntary, the goal of the operational CSA recruitment was to involve as many eligible students and LEAs as possible. All LEAs in California were invited to administer the operational assessment. LEAs were given the following guidelines to determine whether a student should take the operational CSA when either of these conditions applied:
5 For students in grades six through eight and high school

Test Administration | Test-Taking Rates
August 2020 CAASPP CSA Technical Report | 2018–2019 Administration Page 35
• The student is receiving instruction in Spanish in the state of California.
• The student is seeking a measure that recognizes the student’s Spanish reading, writing mechanics, and listening language arts skills (CDE, 2019a).
A total of 151 LEAs participated in the operational CSA. Table 4.2 presents the test-taking rates of each region in California. More than one half of the total number of LEAs—81 out of the 151—from the southern region registered students for the test. More than two-thirds of students who completed the CSA were from the southern region (26,289). The highest completion rate was from the central region with 85 percent, while the southern region was the second highest, with 81 percent.
Table 4.2 Test-Taking Rates by California Region
Region # of
LEAs
Total Students
Registered
Total Students
Completed
Mean Completion
Rate
Minimum Completion
Rate
Maximum Completion
Rate North 24 2,530 2,052 57.05 0 100
Central 46 11,535 10,729 85.35 0 100 South 81 46,533 26,289 81.23 0 100
Table 4.3 CSA Test-Taking Rates by Grade Level presents the test-taking rates by grade level. The data reveals that the majority of students in grades three through eight who were registered for the test actually took it. Grade three had the highest test-taking rate, at 89.83 percent. The test-taking rates were above 85 percent for grades three through grade five and decreased in the middle school grades. High school grades had the lowest test-taking rate, at 24.53 percent.
Table 4.3 CSA Test-Taking Rates by Grade Level
Grade or Grade Level
Number of Registered Students
Number of Students Tested
Percent of Students Tested
Grade 3 10,320 9,270 89.83 Grade 4 9,174 8,174 89.10 Grade 5 7,972 6,869 86.16 Grade 6 6,247 4,794 76.74 Grade 7 5,563 3,404 61.19 Grade 8 5,246 2,672 50.93 High school—Grade 9 6,389 1,573 24.62 High school—Grade 10 5,101 1,012 19.84 High school—Grade 11 3,164 983 31.07 High school—Grade 12 1,422 376 26.44 High school—All grades 16,076 3,944 24.53
Test Administration | Procedures to Maintain Standardization
CAASPP CSA Technical Report | 2018–2019 Administration August 2020 Page 36
4.4. Procedures to Maintain Standardization The test administration procedures are designed so that the tests are administered in a standardized manner. ETS takes all necessary measures to ensure the standardization of test administration, as described in this section.
4.4.1. LEA CAASPP Coordinator An LEA CAASPP coordinator was designated by the district superintendent at the beginning of the 2018–2019 school year. LEAs include public school districts, statewide benefit charter schools, State Board of Education–authorized charter schools, county office of education programs, and direct funded charter schools. LEA CAASPP coordinators are responsible for ensuring the proper and consistent administration of the CAASPP assessments. In addition to the responsibilities set forth in 5 CCR Section 857, their responsibilities include
• adding CAASPP test site coordinators and test administrators into TOMS;
• training CAASPP test site coordinators and test administrators regarding the state and CAASPP assessment administration as well as security policies and procedures;
• reporting test security incidents (including testing irregularities) to the CDE;
• overseeing test administration activities;
• printing out checklists for CAASPP test site coordinators and test administrators to review in preparation for administering the summative assessments;
• distributing and collecting scorable and nonscorable materials for students who take paper-pencil tests;
• filing a report of a testing incident in STAIRS; and
• requesting an Appeal (if indicated by TOMS prompts while reporting an incident using the STAIRS/Appeal process).
4.4.2. CAASPP Test Site Coordinator A CAASPP test site coordinator is trained by the LEA CAASPP coordinator for each test site (5 CCR Section 857[f]). A test site coordinator must be an employee of the LEA and must sign a security agreement (5 CCR Section 859[a]). A test site coordinator is responsible for identifying test administrators and ensuring that they have signed CAASPP Test Security Affidavits (5 CCR Section 859[d]). CAASPP test site coordinators’ duties may include
• adding test administrators into TOMS;
• entering test settings for students;
• creating testing schedules and procedures for a school consistent with state and LEA policies;
• working with technology staff to ensure secure browsers are installed and any technical issues are resolved;
• monitoring testing progress during the testing window and ensuring all students take the test, as appropriate;

Test Administration | Procedures to Maintain Standardization
August 2020 CAASPP CSA Technical Report | 2018–2019 Administration Page 37
• coordinating and verifying the correction of student data errors in the California Longitudinal Pupil Achievement Data System;
• ensuring a student’s test session is rescheduled, if necessary;
• addressing testing problems;
• reporting security incidents;
• overseeing administration activities at a school site;
• filing a report of a testing incident in STAIRS; and
• requesting an Appeal (if indicated by TOMS prompts while reporting an incident using the STAIRS/Appeal process).
4.4.3. Test Administrators Test administrators are identified by CAASPP test site coordinators as individuals who will administer the CSA. A test administrator must sign a security affidavit (5 CCR Section 850[ae]). A test administrator’s duties may include
• ensuring the physical conditions of the testing room meet the criteria for a secure test environment;
• administering the CAASPP assessments, including the CSA;
• reporting all test security incidents to the test site coordinator and LEA CAASPP coordinator in a manner consistent with state and LEA policies;
• viewing student information prior to testing to ensure that the correct student receives the proper test with appropriate resources and reporting potential data errors to test site coordinators and LEA CAASPP coordinators;
• monitoring student progress throughout the test session using the Test Administrator Interface; and
• fully complying with all directions provided in the CAASPP directions for administration (CDE, 2019a).
4.4.4. Instructions for Test Administrators 4.4.4.1. Test Administrator Directions for Administration The directions for administration of the CSA used by test administrators to administer the CSA to students are included in a special section of the CAASPP Online Test Administration Manual (CDE, 2019a). Test administrators must follow all directions and guidelines and read, word-for-word, the instructions to students in the “SAY” boxes to ensure standardization of test administration. Instructions for the CSA are written in Spanish and must be read to students in Spanish. Additionally, the CAASPP Online Test Administration Manual provides information to test administrators regarding the systems involved in testing, including sections on the test delivery system (TDS), so they may become familiar with the testing application used by their students (CDE, 2019a).
Test Administration | Procedures to Maintain Standardization
CAASPP CSA Technical Report | 2018–2019 Administration August 2020 Page 38
4.4.4.2. CAASPP Online Test Administration Manual The CAASPP Online Test Administration Manual (CDE, 2019a) contains information and instructions on overall procedures and guidelines for all LEA and test site staff involved in the administration of online assessments. Sections include the following topics:
• Roles and responsibilities of those involved with CAASPP testing • Test administration resources • Test security • Administration preparation and planning • General test administration • Test administration directions and scripts for test administrators • Overview of the student testing application • Instructions for steps to take before, during, and after testing
Appendices include definitions of common terms, descriptions of different aspects of the test and systems associated with the test, and checklists of activities for LEA CAASPP coordinators, CAASPP test site coordinators, and test administrators. 4.4.4.3. TOMS Pre-Administration Guide for CAASPP Testing TOMS is a web-based application that allows LEA CAASPP coordinators to set up test administrations, add and manage users, submit online student test settings, and order paper-pencil tests. TOMS modules include the following (CDE, 2018a):
• Test Administration Setup—This module allows LEAs to determine and calculate dates for the LEA’s 2018–2019 administration of the CAASPP.
• Adding and Managing Users—This module allows LEA CAASPP coordinators to add CAASPP test site coordinators and test administrators to TOMS so that the designated user can administer, monitor, and manage the CAASPP online assessments.
• Student Test Assignment—This module allows LEA CAASPP coordinators to designate students to take the CSA.
• Online Student Test Settings—This module allows LEA CAASPP coordinators and CAASPP test site coordinators to configure online test settings so students receive the assigned accessibility resources for the online assessments.
4.4.4.4. Other System Manuals Other manuals were created to assist LEA CAASPP coordinators and others with the technological components of the CAASPP System and are listed next.
• Technical Specifications and Configuration Guide for CAASPP Online Testing—This manual provides information, tools, and recommended configuration details to help technology staff prepare computers and install the secure browser to be used for the online CAASPP assessments (CDE, 2018b).
• Security Incidents and Appeals Procedure Guide—This manual provides information on how to report a testing incident and submit an Appeal to reset, reopen, invalidate, or restore individual online student assessments (CDE, 2019b).
Test Administration | LEA Training
August 2020 CAASPP CSA Technical Report | 2018–2019 Administration Page 39
• Accessibility Guide for CAASPP Online Testing—This manual provides descriptions of the accessibility features for online tests as well as information about supported hardware and software requirements for administering tests to students using accessibility resources, including those with a braille accommodation using Job Access With Speech (JAWS®) (software) or a braille embosser (hardware) (CDE, 2019c).
4.5. LEA Training ETS established and implemented a training plan for LEA assessment staff on all aspects of the assessment program. The CDE and ETS, in collaboration with other stakeholders, as needed, determined the audience, topics, frequency, and mode (in-person, webcast, videos, modules, etc.) of the training, including such elements as format, participants, and logistics. ETS conducted eight in-person pretest workshops and a pretest webcast for the 2018–2019 administration. Following approval by the CDE, the ancillary materials were posted for each webcast on the CAASPP website at http://www.caaspp.org/training/caaspp/ so the LEAs could download the training materials.
4.5.1. In-person Training ETS also provided a series of in-person trainings. Beginning in January 2019, the first in-person trainings provided were the pretest CAASPP workshops, which focused on training LEA CAASPP coordinators on how to prepare for administering the CAASPP online assessments. Training was also provided to focus on interpreting and using results. Eight in-person post-test workshops and one webcast were offered in May and June 2019. The post-test workshop and webcast were titled “2018–19 CAASPP Results Are In—Now What?” An additional, stand-alone webcast, “CAASPP Principles of Scoring and Reporting Webcast,” was presented on July 24, 2019.
4.5.2. Webcasts ETS provided a series of live webcasts throughout the school year that were archived and made available for training LEA and test site staff as well as test administrators. Webcast viewers were provided with a method of electronically submitting questions to the presenters during the webcast. The webcasts were recorded and archived for on-demand viewing on the CAASPP Summative Assessments Videos and Archived Webcasts web page at http://www.caaspp.org/training/caaspp/. CAASPP webcasts were available to everyone and required neither preregistration nor a logon account.
4.5.3. Videos and Narrated PowerPoint Presentations To supplement the live webcasts and in-person workshops, ETS also produced short “how to” videos and narrated PowerPoint presentations that were available on the CAASPP Summative Assessments Videos and Archived Webcasts web page. In total, 20 recorded webcasts and tutorials were available, of which 10 were recorded in Spanish.
Test Administration | Universal Tools, Designated Supports, and Accommodations for Students with Disabilities
CAASPP CSA Technical Report | 2018–2019 Administration August 2020 Page 40
4.6. Universal Tools, Designated Supports, and Accommodations for Students with Disabilities
The purpose of universal tools, designated supports, and accommodations in testing is to provide all students with the opportunity to demonstrate what they know and what they are able to do. Universal tools, designated supports, and accommodations minimize or remove barriers that could otherwise prevent students from demonstrating their knowledge, skills, and achievement in a specific content area. The CSA 2018–2019 operational assessment offered commonly used accessibility resources available through the CAASPP online testing platform, where applicable for the tested construct. Some of these features could include a highlighter, the ability to mark an item for future review, and the ability to visually zoom the computer display in (making the display larger) or out (making the display smaller).
4.6.1. Identification All public school students participate in the CAASPP System, including students with disabilities and English learners. The Smarter Balanced Assessment Consortium’s Usability, Accessibility, and Accommodations Guidelines (Smarter Balanced, 2019) and the CDE web document, Universal Tools, Designated Supports, and Accommodations for the CAASPP System (Matrix One) (CDE, 2019d) are intended for school-level personnel and individualized education program (IEP) and Section 504 plan teams to select and administer the appropriate universal tools, designated supports, and accommodations as deemed necessary for individual students. The CSA follows the Smarter Balanced recommendations for use (Smarter Balanced, 2018). The Guidelines apply to all students and promote an individualized approach to the implementation of assessment practices. Another web document, the Smarter Balanced Resources and Practices Comparison Crosswalk (Smarter Balanced, 2018), connects the assessment resources described in the Guidelines with associated classroom practices. Another manual, the Smarter Balanced Usability, Accessibility, and Accommodations Implementation Guide (Smarter Balanced, 2014), provides suggestions for implementation of these resources. Test administrators are given the opportunity to participate in the CSA practice and training tests so that students have the opportunity to familiarize themselves with a designated support or accommodation prior to testing.
4.6.2. Assignment Once a student’s IEP or Section 504 plan team decided which accessibility resource(s) the student should use, LEA CAASPP coordinators and CAASPP test site coordinators used TOMS to assign designated supports and accommodations to students prior to the start of a test session. There are three ways a student’s accessibility resource(s) could be assigned:

Test Administration | Universal Tools, Designated Supports, and Accommodations for Students with Disabilities
August 2020 CAASPP CSA Technical Report | 2018–2019 Administration Page 41
1. Using the Individual Student Assessment Accessibility Profile Tool to identify the accessibility resource(s) and then uploading the spreadsheet it creates into TOMS (This process is discussed in more detail in subsection 2.4.1.1 Resources for Selection of Accessibility Resources.)
2. Using the Online Student Test Settings template to enter students’ assignments and then uploading the spreadsheet into TOMS
3. Entering assignments for each student individually in TOMS If a student’s IEP or Section 504 plan team identified and designated a resource not identified in Matrix One, the LEA CAASPP coordinator or CAASPP test site coordinator needed to submit a request for an unlisted resource to be approved by the CDE. The CDE then determined whether the requested unlisted resource changed the construct being measured after all testing was completed.
4.6.3. Available Resources 4.6.3.1. Universal Tools Universal tools are available to all students by default, although they can be disabled if a student finds them distracting. Each universal tool falls into one of two categories: embedded and non-embedded. Embedded universal tools are provided through the student testing interface (through the CAASPP secure browser), although they can be turned off by a test administrator. The following embedded universal tools were available to students during the CSA 2018–2019 operational assessment:
• Breaks • Digital notepad • Expandable items • Expandable passages • Highlighter • Keyboard navigation • Line reader • Mark for review • Spanish glossary (for specific items) • Strikethrough • Writing tools (e.g., bold, italic, bullets, undo or redo) (full-write items) • Zoom (in or out)
The following non-embedded universal tools were available for testing:
• Breaks • Scratch paper
4.6.3.2. Designated Supports Designated supports are available to all students through the test settings in TOMS. The designated supports each fall into one of two categories: embedded and non-embedded. Embedded designated supports are provided through the student testing interface (through the CAASPP secure browser). The following embedded designated supports were available during the CSA 2018–2019 operational assessment:

Test Administration | Universal Tools, Designated Supports, and Accommodations for Students with Disabilities
CAASPP CSA Technical Report | 2018–2019 Administration August 2020 Page 42
• Color contrast • Masking • Mouse pointer (size and color) • Permissive mode • Streamline • Text-to-speech (items) • Turn off any universal tool(s)
The following non-embedded designated supports were available during the CSA 2018–2019 operational assessment:
• Amplification • Color contrast • Color overlay • Magnification • Medical device • Noise buffers • Read aloud (items) • Scribe (nonwriting items) • Separate setting (special lighting or acoustics, adaptive furniture, time of day) • Simplified test directions
4.6.3.3. Accommodations Accommodations are changes in procedures or materials that increase equitable access during the CAASPP assessments. Assessment accommodations generate valid assessment results for students who need them; they allow these students to show what they know and can do. Accommodations do not compromise the learning expectations, construct, grade-level standard, or intended outcome of the assessments. The following embedded accommodations were available during the CSA 2018–2019 operational assessment:
• Audio transcript • Braille (embossed and refreshable) • Closed-captioning • Text-to-speech (reading passages)
The following non-embedded accommodations were available during the CSA 2018–2019 operational assessment:
• Alternate response options • Print on demand • Read aloud (reading passages) • Scribe (writing items)

Test Administration | Practice and Training Tests
August 2020 CAASPP CSA Technical Report | 2018–2019 Administration Page 43
4.7. Practice and Training Tests Practice and training tests are available publicly for the CSA. These tests simulate the experience of the CSA online assessment. During the 2018–2019 school year the, CSA practice and training tests did not include braille, closed captioning, text-to-speech, and audio transcripts, which were available on the operational assessment. Ahead of the 2019–2020 school year, accommodated versions of CSA practice and training tests were developed to include all accessibility resources available on the operational assessment. Students can access practice and training tests using a web browser. They allow students and administrators to familiarize themselves with the user interface and components of the TDS and help maintain the standardization of test administration. Practice and training tests are available through the Practice and Training Test website linked on the Online Practice and Training Tests Portal web page at http://www.caaspp.org/practice-and-training/. The publicly available practice tests, offered at each grade level for grades three through eight with one test for high school, were released in January 2019 to prepare students for the CSA. These tests more closely simulate the CSA’s length and complexity. The purpose of the practice tests is to allow students to familiarize themselves with the test content as the practice test is aligned to the CSA blueprint. The publicly available training tests, offered by grade band (grades three through five, grades six through eight, and high school), were released in April 2018 to prepare students for the CSA. As with the practice tests, students may access them using a web browser. The grade-level-specific training tests can be taken by students in all tested grades. All unique item types available on the operational test are covered in the training tests. The scoring guides for the practice and training tests are available on the Practice and Training Test Resources web page on http://www.caaspp.org/ta-resources/practice-training.html.
4.8. Test Security and Confidentiality For the operational CSA, every person who worked with the assessments, communicated test results, or received testing information was responsible for maintaining the security and confidentiality of the tests, including CDE staff, ETS staff, ETS subcontractors, LEA assessment coordinators, school assessment coordinators, students, teachers, and cooperative LEA staff. ETS’ Code of Ethics requires that all test information, including tangible materials (e.g., test items), confidential files (e.g., those containing personally identifiable student information), and processes related to test administration (e.g., the configurations of secure servers) be kept secure. ETS has systems in place that maintained tight security for test items and test results, as well as for student data. To ensure security for all tests that ETS develops or handles, ETS maintains an Office of Testing Integrity (OTI), which is described in the next subsection. All tests within the CAASPP System, as well as the confidentiality of student information, should be protected to ensure the validity, reliability, and fairness of the results. As stated in Standard 7.9 (AERA, APA, & NCME, 2014), “The documentation should explain the steps necessary to protect test materials and to prevent inappropriate exchange of information during the test administration session” (p. 128).
Test Administration | Test Security and Confidentiality
CAASPP CSA Technical Report | 2018–2019 Administration August 2020 Page 44
This section of the CSA Technical Report describes the measures intended to prevent potential test security incidents prior to testing and the actions that were taken to handle security incidents occurring during or after the testing window using the Security and Test Administration Incident Reporting System (STAIRS) process.
4.8.1. ETS’ Office of Testing Integrity (OTI) The OTI is a division of ETS that provides quality assurance services for all testing programs managed by ETS. This division resides in the ETS legal department. The Office of Professional Standards Compliance at ETS publishes and maintains the ETS Standards for Quality and Fairness (2014), which supports the OTI’s goals and activities. The ETS Standards for Quality and Fairness provides guidelines to help ETS staff design, develop, and deliver technically sound, fair, and beneficial products and services and help the public and auditors evaluate those products and services. The OTI’s mission is to
• minimize any testing security violations that can impact the fairness of testing,
• minimize and investigate any security breach that threatens the validity of the interpretation of test scores, and
• report on security activities. The OTI helps prevent misconduct on the part of students and administrators, detects potential misconduct through empirically established indicators, and resolves situations involving misconduct in a fair and balanced way that reflects the laws and professional standards governing the integrity of testing. In its pursuit of enforcing secure testing practices, the OTI strives to safeguard the various processes involved in a test development and administration cycle.
4.8.2. Procedures to Maintain Standardization of Test Security Test security requires the accounting of all secure materials—including online summative test items and student data—before, during, and after each test administration. The LEA CAASPP coordinator is responsible for keeping all electronic test materials secure, keeping student information confidential, and making sure the CAASPP test site coordinators and test administrators are properly trained regarding security policies and procedures. The CAASPP test site coordinator is responsible for mitigating test security incidents at the test site and for reporting incidents to the LEA CAASPP coordinator. The test administrator is responsible for reporting testing incidents to the CAASPP test site coordinator and securely destroying printed and digital media for items and passages generated by the print-on-demand feature of the test delivery system (TDS) (CDE, 2019a). The following measures ensured the security of the CAASPP:
• LEA CAASPP coordinators and test site coordinators must have signed and submitted a “CAASPP Test Security Agreement for LEA CAASPP coordinators and CAASPP test site coordinators” form to the California Technical Assistance Center before ETS can grant the coordinators access to TOMS (California Code of Regulations, Title 5 [5 CCR], Education, Division 1, Chapter 2, Subchapter 3.75, Article 1, Section 859[a]).
Test Administration | Test Security and Confidentiality
August 2020 CAASPP CSA Technical Report | 2018–2019 Administration Page 45
• Anyone having access to the testing materials must have signed and submitted a “Test Security Affidavit for Test Examiners, Test Administrators, Proctors, Translators, Scribes, and Any Other Person Having Access to CAASPP Tests” form to the CAASPP test site coordinator before receiving access to any testing materials (5 CCR, Section 859[c]).
In addition, it was the responsibility of every participant in the CAASPP System to report immediately any violation or suspected violation of test security or confidentiality. The test site coordinator reported to the LEA CAASPP coordinator. The LEA CAASPP coordinator reported to the CDE within 24 hours of the incident. (5 CCR, Section 859[e])
4.8.3. Security of Electronic Files Using a Firewall A firewall is software that prevents unauthorized entry to files, email, and other organization-specific information. All ETS data exchanges and internal email remain within the ETS firewall at all ETS locations, ranging from Princeton, New Jersey, to San Antonio, Texas, to Concord and Sacramento, California. All electronic applications that are included in TOMS remain protected by the ETS firewall software at all times. Due to the sensitive nature of the student information processed by TOMS, the firewall plays a significant role in maintaining assurance of confidentiality among the users of this information. Refer to section 1.7 Systems Overview and Functionality in Chapter 1: Introduction for more information on TOMS.
4.8.4. Transfer of Scores via Secure Data Exchange Due to the confidential nature of test results, ETS currently uses secure file transfer protocol (SFTP) and encryption for all data file transfers; test data is never sent via email. SFTP is a method for reliable and exclusive routing of files. Files reside on a password-protected server that only authorized users can access. ETS shares an SFTP server with the CDE. On that site, ETS posts Microsoft Word and Excel files, Adobe Acrobat PDFs, or other document files for the CDE to review; the CDE returns reviewed materials in the same manner. Files are deleted upon retrieval. The SFTP server is used as a conduit for the transfer of files; secure test data is only temporarily stored on the shared SFTP server. Industry-standard secure protocols are used to transfer test content and student data from the ETS internal data center to any external systems. ETS enters information about the files posted to the SFTP server in a web form on a SharePoint website; a CDE staff member monitors this log throughout the day to check the status of deliverables and downloads and deletes the file from the SFTP server when its status shows it has been posted.
4.8.5. Data Management in the Secure Database ETS currently maintains a secure database to house all student demographic data and assessment results. Information associated with each student has a database relationship to the LEA, school, and grade codes as the data is collected during operational testing. Only individuals with the appropriate credentials can access the data. ETS builds all interfaces with the most stringent security considerations, including interfaces with data encryption for databases that store test items and student data. ETS applies best and up-to-date security
Test Administration | Test Security and Confidentiality
CAASPP CSA Technical Report | 2018–2019 Administration August 2020 Page 46
practices, including system-to-system authentication and authorization, in all solution designs. All stored test content and student data are encrypted. Industry-standard secure protocols are used to transfer test content and student data from the ETS internal data center to any external systems. ETS complies with the Family Educational Rights and Privacy Act (20 United States Code [USC] § 1232g; 34 Code of Federal Regulations Part 99) and the Children’s Online Privacy Protection Act (15 USC §§ 6501-6506, P.L. No. 105–277, 112 Stat. 2681–1728). In TOMS, staff at LEAs and test sites have different levels of access appropriate to the role assigned to them.
4.8.6. Statistical Analysis on Secure Servers During CAASPP testing, the information technology staff at ETS retrieves data files from the American Institutes for Research (now Cambium Assessment) and loads them into a database. The ETS Data Quality Services staff extracts the data from the database and performs quality control procedures (e.g., the values of all variables are as expected) before passing files to the ETS statistical analysis group. The statistical analysis staff stores the files on secure servers. All staff members involved with the data adhere to the ETS Code of Ethics and the ETS Information Protection Policies to prevent any unauthorized access to data.
4.8.7. Student Confidentiality To meet requirements of the Every Student Succeeds Act, as well as state requirements, LEAs must collect demographic data about students’ ethnicity, disabilities, parent/guardian education, and so forth during the school year. ETS takes every precaution to prevent any of this information from becoming public or being used for anything other than for testing and score-reporting purposes. These procedures are applied to all documents in which student demographic data appears, such as technical reports.
4.8.8. Student Test Results 4.8.8.1. Types of Results The following deliverables are produced for reporting of the CSA:
• Individual Student Score Reports (printed and electronic)
• Internet reports—available on a public web reporting site—aggregated by content area and state, county, LEA, or test site
4.8.8.2. Security of Results Files ETS takes measures to protect files and reports that show students’ scores and reporting levels. ETS is committed to safeguarding all secure information in its possession from unauthorized access, disclosure, modification, or destruction. ETS has strict information security policies in place to protect the confidentiality of both student and client data. ETS staff access to production databases is limited to personnel with a business need to access the data. User IDs for production systems must be person-specific or for systems use only. ETS has implemented network controls for routers, gateways, switches, firewalls, network tier management, and network connectivity. Routers, gateways, and switches represent
Test Administration | Test Security and Confidentiality
August 2020 CAASPP CSA Technical Report | 2018–2019 Administration Page 47
points of access between networks. However, these do not contain mass storage or represent points of vulnerability, particularly for unauthorized access or denial of service. ETS has many facilities, policies, and procedures to protect computer files. Software and procedures such as firewalls, intrusion detection, and virus control are in place to provide for physical security, data security, and disaster recovery. ETS is certified in the BS 25999-2 standard for business continuity and conducts disaster recovery exercises annually. ETS routinely backs up all data to either disks through deduplication or to tapes, all of which are stored off site. Access to the ETS Computer Processing Center is controlled by employee and visitor identification badges. The Center is secured by doors that can only be unlocked by the badges of personnel who have functional responsibilities within its secure perimeter. Authorized personnel accompany visitors to the ETS Computer Processing Center at all times. Extensive smoke detection and alarm systems, as well as a preaction fire-control system, are installed in the Center. 4.8.8.3. Security of Individual Results ETS protects individual students’ results on both electronic files and paper reports during the following events:
• Scoring • Transfer of scores by means of secure data exchange • Reporting • Analysis and reporting of erasure marks • Posting of aggregate data • Storage
In addition to protecting the confidentiality of testing materials, ETS’ Code of Ethics further prohibits ETS employees from financial misuse, conflicts of interest, and unauthorized appropriation of ETS property and resources. Specific rules are also given to ETS employees and their immediate families who may take a test developed by ETS (e.g., a CAASPP assessment). The ETS OTI verifies that these standards are followed throughout ETS. This verification is conducted, in part, by periodic on-site security audits of departments, with follow-up reports containing recommendations for improvement.
4.8.9. Security and Test Administration Incident Reporting System (STAIRS) Process
Test security incidents, such as improprieties, irregularities, and breaches, are prohibited behaviors that give a student an unfair advantage or compromise the secure administration of the tests, which, in turn, compromise the reliability and validity of test results (CDE, 2019b). Whether intentional or unintentional, failure by staff or students to comply with security rules constitutes a test security incident. Test security incidents have impacts on scoring and affect students’ performance on the test. LEA CAASPP coordinators and CAASPP test site coordinators must ensure that all test security and summative administration incidents are documented by following the prompts in TOMS that guided coordinators in their submittal. An Appeal is a request to reset, restore, reopen, invalidate, or grant a grace period extension to a student’s test. If an Appeal to a student’s test was warranted, TOMS provided additional prompts to file the Appeal.

Test Administration | Test Security and Confidentiality
CAASPP CSA Technical Report | 2018–2019 Administration August 2020 Page 48
After a case was submitted, an email containing a case number and next steps was sent to the submitter (and to the LEA CAASPP coordinator, if the form was submitted by the CAASPP test site coordinator). The CAASPP STAIRS web form provided the LEA CAASPP coordinator, the CDE, and the California Technical Assistance Center with the opportunity to interact and communicate regarding the STAIRS process (CDE, 2019b). Prior to the operational assessment administration, ETS and the CDE agreed that the following types of STAIRS cases were also forwarded to the CDE:
• Cheating or accessing unauthorized devices • Disruption or technical issue • Exposing secure materials • Using an incorrect Statewide Student Identifier • Student disruption
4.8.9.1. Impropriety A testing impropriety is an unusual circumstance that has a low impact on the individual or group of students who are testing and has a low risk of potentially affecting student performance on the test, test security, or test validity. An impropriety can be corrected and contained at a local level. An impropriety should be reported to the LEA CAASPP coordinator and CAASPP test site coordinator immediately. The coordinator reported the incident within 24 hours, using the STAIRS/Appeals process in TOMS. 4.8.9.2. Irregularity A testing irregularity is an unusual circumstance that impacts an individual or a group of students who are testing and may potentially affect student performance on the test or impact test security or test validity. These circumstances can be corrected and contained at the local level and submitted using the STAIRS/Appeals process in TOMS. An irregularity must be reported to the LEA CAASPP coordinator and CAASPP test site coordinator immediately. The coordinator must report the irregularity within 24 hours, using the online STAIRS/Appeals process in TOMS. 4.8.9.3. Breach A testing breach is an event that poses a threat to the validity of the test. Breaches require immediate attention and escalation to the California Technical Assistance Center (CalTAC) (for social media breaches) or the CDE (for all other breaches) via telephone. Following the call, the CAASPP test site coordinator or LEA CAASPP coordinator must report the incident using the online STAIRS/Appeals process in TOMS within 24 hours. Examples may include such situations as a release of secure materials or a security or system risk. These circumstances have external implications for the CDE and may result in a decision to remove the test item(s) from the available secure bank.
4.8.10. Appeals For incidents that resulted in a need to reset, re-open, invalidate, or restore individual online student assessments, the request was approved by the CDE. In most instances, an Appeal was submitted to address a test security breach or irregularity. The LEA CAASPP coordinator or CAASPP test site coordinator submitted Appeals in TOMS. All submitted Appeals were available for retrieval and review by the appropriate credentialed users within a given organization. However, the view of Appeals is restricted according to the user role as established in TOMS. An Appeal could be requested only by the LEA CAASPP

Test Administration | Test Security and Confidentiality
August 2020 CAASPP CSA Technical Report | 2018–2019 Administration Page 49
coordinator or CAASPP test site coordinator if prompted while filing a STAIRS case in TOMS (CDE, 2019b). Table 4.4 describes types of appeals available during the 2018–2019 CAASPP administration.
Table 4.4 Types of Appeals Type of Appeal Description
Reset Resetting a student’s summative assessment removes that assessment from the system and enables the student to start a new assessment from the beginning.
Invalidation Invalidated summative tests will be scored and scores will be provided on the Student Score Report with a note that an irregularity occurred. The student(s) will be counted as participating in the calculation of the school’s participation rate for accountability purposes. The score will be counted as “not proficient” for aggregation into the CAASPP results.
Re-open Reopening a summative test allows a student to access an assessment that has already been submitted.
Restore Restoring a summative test returns a test from the Reset status to its prior status. This action could only be performed on tests that have been previously reset.
Grace Period Extension Permitting a Grace Period Extension allows the student to review previously answered questions upon logging back on to the assessment after expiration of the pause rule. A grace period extension will only be granted in cases where there was a disruption to a test session, such as a technical difficulty, fire drill, schoolwide power outage, earthquake, or other act beyond the control of the test administrator.
Test Administration | References
CAASPP CSA Technical Report | 2018–2019 Administration August 2020 Page 50
References American Educational Research Association, American Psychological Association, &
National Council on Measurement in Education. (2014). Standards for educational and psychological testing. Washington, DC: American Educational Research Association.
California Department of Education. (2018b). Technical specifications and configuration guide for CAASPP online testing. Sacramento, CA: California Department of Education. Retrieved from http://www.caaspp.org/rsc/pdfs/CAASPP.tech-specs-and-config-guide.2018-19.pdf
California Department of Education. (2018a). TOMS pre-administration guide for CAASPP testing. Sacramento, CA: California Department of Education. Retrieved from http://www.caaspp.org/rsc/pdfs/CAASPP.TOMS-pre-admin-guide.2018-19.pdf
California Department of Education. (2019c). Accessibility guide for CAASPP online testing. Sacramento, CA: California Department of Education. Retrieved from http://www.caaspp.org/rsc/pdfs/CAASPP.accessibility-guide.2018-19.pdf
California Department of Education. (2019d). Matrix one: Universal tools, designated supports, and accommodations for the California Assessment of Student Performance and Progress for 2018–19. Sacramento, CA: California Department of Education. Retrieved from https://www.cde.ca.gov/ta/tg/ai/caasppmatrix1.asp
California Department of Education. (2019a). CAASPP online test administration manual, 2018–19 administration. Sacramento, CA: California Department of Education. Retrieved from https://ca-toms-help.ets.org/caaspp-otam/.
California Department of Education. (2019b). CAASPP security incidents and appeals procedure guide, 2018–2019 administration. Sacramento, CA: California Department of Education. Retrieved from https://www.caaspp.org/administration/test-security/index.html
Educational Testing Service. (2014). ETS standards for quality and fairness. Princeton, NJ: Educational Testing Service. Retrieved from https://www.ets.org/s/about/pdf/standards.pdf
Smarter Balanced Assessment Consortium. (2014). Smarter Balanced Assessment Consortium: Usability, accessibility, and accommodations implementation guide. Los Angeles, CA: Smarter Balanced Assessment Consortium and National Center on Educational Outcomes. Retrieved from https://portal.smarterbalanced.org/library/en/usability-accessibility-and-accommodations-implementation-guide.pdf
Smarter Balanced Assessment Consortium. (2018). Smarter Balanced Resources and Practices Comparison Crosswalk. Los Angeles: Smarter Balanced Assessment Consortium. Retrieved from https://portal.smarterbalanced.org/library/en/uaag-resources-and-practices-comparison-crosswalk.pdf
Smarter Balanced Assessment Consortium. (2019). Smarter Balanced Assessment Consortium: Usability, accessibility, and accommodations guidelines. Los Angeles, CA: Smarter Balanced Assessment Consortium and National Center on Educational Outcomes. Retrieved from https://portal.smarterbalanced.org/library/en/usability-accessibility-and-accommodations-guidelines.pdf
Standard Setting | Background
August 2020 CAASPP CSA Technical Report | 2018–2019 Administration Page 51
Chapter 5: Standard Setting This chapter summarizes the standard setting process through which California Spanish Assessment (CSA) achievement levels and threshold scores were recommended. Included are an overview of the standard setting methodology, a summary of the standard setting procedure, a description of the achievement level descriptors (ALDs), and the results. The detailed standard setting information for the CSA is described in the Standard Setting Technical Report for the California Spanish Assessment (CDE, 2019).
5.1. Background The content of the CSA is aligned with the California Common Core State Standards en Español (CCCSSeE) (Council of Chief State School Officers, California Department of Education [CDE], and San Diego County Office of Education, 2012). The CDE and the administration of the CSA required a standard setting process to evaluate students’ Spanish skills in reading, writing mechanics, and listening against the new expectations. Standard setting refers to a class of methodologies by which one or more performance threshold scores are used to determine achievement levels. The purpose of the standard setting process for the CSA was to collect recommendations from Spanish-language educators in California for the placement of the CSA threshold scores for review by the CDE, with final determination by the State Board of Education (SBE). Educational Testing Service (ETS) conducted standard setting workshops from August 6–9, 2019, following the first operational administration of the CSA. The Bookmark standard setting method was applied to all items on each test, by grade. Refer to section 5.3 Standard Setting Methodology for more information about the Bookmark method. Through the standard setting process, input and recommendations on the threshold scores were solicited from Spanish-language educators in California. The CDE reviewed the input and recommendations and provided these recommendations to the SBE along with recommendations from the State Superintendent of Public Instruction. The SBE established the standards based on these recommendations. There are three achievement levels (Level 1 through Level 3); two threshold scores are needed to define the three achievement levels. Students with scale scores lower than the threshold score for Level 2 are assigned to the lowest achievement level, Level 1. Students with scale scores that are equal to or greater than the threshold score for Level 3 are assigned to the highest achievement level, Level 3. The rest of the students with valid scores are assigned to Level 2.
5.2. Achievement Level Descriptors (ALDs) The CSA ALDs describe expectations of what students can do at each level. The general, or policy, ALDs are short policy descriptors that convey the expectation across all grades and were approved by the California SBE in November 2017 (CDE, 2017). From July 18–19, 2018, 21 California educators convened in Sacramento to review and provide input on the range ALDs, which are descriptions of the Spanish reading/language arts knowledge and skills necessary for students in grades three through eight and high school to be placed into one of three achievement levels. These range ALDs were used to inform the standard setting process. Appendix 5.A provides a description of the three range ALDs, with Level 3 reflecting the highest level of achievement (CDE, 2017).

Standard Setting | Standard Setting Methodology
CAASPP CSA Technical Report | 2018–2019 Administration August 2020 Page 52
5.3. Standard Setting Methodology For the CSA, the Bookmark method was used for standard setting. The Bookmark method is an item-mapping procedure that allows multiple performance threshold scores to be set in an efficient manner. This method represents an appropriate balance between statistical rigor and informed opinion, as explained in the following subsection. In the case of the CSA, three of four panels worked on two tests (i.e., grades three and four, grades five and six, and grades seven and eight; the high school panel worked only on that test).
5.3.1. Bookmark Method The Bookmark method (Lewis, et al., 1998; Mitzel, et al., 2001) is a commonly used item-mapping procedure in which test items are ordered from easiest to most difficult based on actual student performance; the ordered items are presented in a booklet known as an ordered item booklet (OIB). The task of each panelist is to place a “bookmark” in the OIB that differentiates content that a student with just enough content knowledge and skills to be performing at a defined achievement level would likely know from content that the student would not likely know. A bookmark is placed in the OIB for each item defined at the border of each achievement level. For each CSA, two bookmarks were required to set the three achievement levels. The Bookmark method has its basis in item response theory (IRT) analysis. IRT is used to estimate item difficulties. Based on the first-year operational test data, a response probability of 0.67 estimated by the IRT model was employed to order the items from easiest to hardest and to place item difficulty estimates on the score scale. Panelists were instructed to consider the definition of “most likely” as having a two-thirds likelihood of answering a multiple-choice item correctly, thus the instructions to the panelists and the analytical model were aligned. One benefit of this approach is that once panelists make judgments in the OIB, the difficulty values associated with each item have a built-in relationship to scale scores through theta, a fact that allows results to be provided to score users and policy makers on the familiar metric of the scale score.
5.4. Standard Setting Procedures This section describes what occurred prior to and during the standard setting workshop.
5.4.1. Panelists A diverse group, representative of Spanish-language educators in California, was recruited to participate as panelists in the standard setting sessions. In recruiting panelists, the goal was to include a representative group of California educators who were familiar with the CCCSSeE and who have experience in the education of students in grades three through twelve who will take the CSA. It was important to include teachers working with these students as those educators provided a perspective on learning goals for the students taking the CSA, as well as students’ progress toward Spanish reading/language arts proficiency. The educators who participated in the CSA standard setting included representatives from across regions in California (north, south, and central) and across gender, race, and ethnic categories. The composition of each panel included the following as criteria for selection:
• Educators who were teaching Spanish-language learners, in the grade level(s) assigned to the panel

Standard Setting | Standard Setting Procedures
August 2020 CAASPP CSA Technical Report | 2018–2019 Administration Page 53
• Educators who were teaching students who would take the CSA
• Educators who were familiar with the CCCSSeE The final selection of panelists invited to the workshops was made by the CDE. The total number of panelists who participated and completed the CSA standard setting process was 56.
5.4.2. Materials Panelists were provided with a letter describing the purpose and procedures of the standard setting workshop along with a preworkshop assignment specific to the individual educator’s panel assignment, instructions, a notetaking form for the assignment, and the links to the training tests and to the general and range ALDs for the tests the panelists would be reviewing. During the workshop, panelists received training materials and a set of operational materials. The set of operational materials included a printed version of the CSA and the answer key with scoring rules for 2-point items, the OIB, judgment recording forms, and an item map. The detailed procedure with regard to securing those materials was described in the Standard Setting Technical Report for the California Spanish Assessment (CDE, 2019).
5.4.3. Process (Including Articulation) Prior to making judgements in the OIB, as part of a preworkshop assignment, panelists were provided with a link to the CSA training test on the CDE website and asked to take the training test for the grade level the panelists were scheduled to work with first. Panelists were also asked to become familiar with the general ALDs and the range ALDs and to access a link to the CCCSSeE. Panelists were asked to consider the expectations of a student in each of the achievement levels, take notes about the knowledge and skills of students at the beginning of Level 2 and Level 3, and bring those notes to the standard setting workshop. At the workshop, each panel began with the test familiarization by reviewing one of the two tests assigned to that panel, and then they developed borderline student definitions as a group for that grade level. The process to arrive at borderline student definitions involved small-group discussions and the development of draft borderline-student definitions, followed by a whole-panel discussion of the draft definitions to reach a panel consensus of what was expected. For each grade level or grade span of the CSA, two definitions were developed for two thresholds—the Level 3 borderline student definition followed by the Level 2 borderline student definition. The level 3 definition was developed first to allow cross grade articulation early in the process. After the “borderline Level 3 student” definition was drafted, two pairs of two panels working on adjacent CSA grade-level or grade-span tests met to discuss the drafts, provide feedback to each other, and finalize the definitions. These discussions and this work focused on cross-grade consistency of the ALDs and the description of the borderline student for Level 3. Each panel then reconvened and completed the “borderline Level 2 student” definition. Each panel, with the exception of the high school panel, completed the standard setting process on two CSA grade-level tests. After completing the process for the first grade level of the CSA, the panel began the entire process again with the second assessment. The grades five and six panel and the grades seven and eight panel met again to consider
Standard Setting | Results of the Standard Setting
CAASPP CSA Technical Report | 2018–2019 Administration August 2020 Page 54
cross-grade consistency when creating the borderline student definitions for their second CSA (for grades six and seven, respectively). The process of developing the borderline student definitions provided vertical articulation of the expectations across grades prior to bookmark judgments. To make judgments and place bookmarks in the OIB, panelists reviewed each item in the OIB in sequence and considered if the student at the beginning of Level 2, known as the borderline Level 2 student, would most likely be able to answer the item correctly. A panelist placed the Level 2 bookmark on the first item encountered in the OIB that the panelist believed the borderline Level 2 student would most likely not be able to address because items beyond that point were too difficult for that borderline student. The panelist continued from that point in the OIB and then stopped at the item that the borderline Level 3 student would not likely be able to address (i.e., the item that likely exceeds the ability of the borderline Level 3 student). Note that in the Bookmark method, the definition of “most likely” is related to the IRT model. That is, panelists were instructed to think of “most likely” as having a two-thirds likelihood of answering a multiple-choice item correctly. In ordering the items in the OIB, a response probability of 0.67 (RP67) is employed in the IRT model as recommended by research; thus, the instructions to the panelists and the analytical model are aligned.6 The Bookmark process was implemented in three rounds with feedback and discussion between rounds. The final recommended threshold scores were based on the median of panelists’ judgment scores. The last step in the workshop involved a subset of panelists from each panel room that were recruited to attend the cross-grade articulation meeting. The goal of this meeting was to ask panelists to consider the score recommendations by considering feedback and data across the seven sets of threshold score recommendations. Panelists were provided with the borderline student definitions across all panels. The panelists were asked to review the definitions for the assigned grade levels or grade span, along with the two adjacent grade levels or grade span. The panel facilitator asked the panelists to share the rationales and the discussions that occurred in each panel. Panelists next reviewed the impact data for all seven sets of threshold scores. As part of the standard setting process, the CDE analyzed the standard setting panel’s judgments and refined the threshold scores for consistency across all the CSA grade levels tested. The CDE’s recommendations were then presented to the SBE for approval.
5.5. Results of the Standard Setting The SBE approved the recommendation of the score reporting ranges for the CSA. The recommendations of the State Superintendent of Public Instruction (SSPI) are presented in table 5.1 sspi’s recommendations for the proposed thresholds for three levels on the csa. The scales in this table were presented and used in the standard setting process and are not the official reporting scale. The standard setting working scale ranges from 300 to 500 score points and is more user-friendly than the theta metric. The official scale score reporting scale was developed and approved after the SBE approval of score ranges. The table shows the percent of students statewide that would be placed in each of the three score ranges, identified in this table as Levels 1 through 3, on the basis of the results of the
6 In several applications of the Bookmark method, a target probability of two-thirds is used to define “most likely.” Refer, for example, to Cizek (2007).
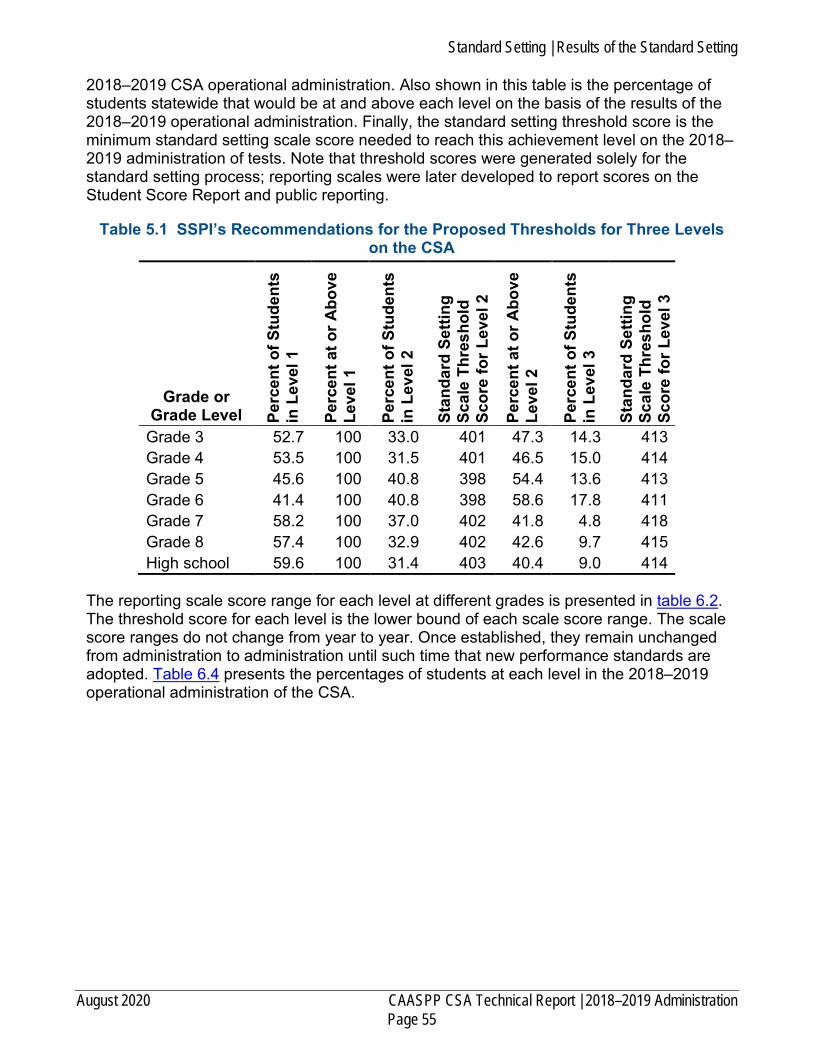
Standard Setting | Results of the Standard Setting
August 2020 CAASPP CSA Technical Report | 2018–2019 Administration Page 55
2018–2019 CSA operational administration. Also shown in this table is the percentage of students statewide that would be at and above each level on the basis of the results of the 2018–2019 operational administration. Finally, the standard setting threshold score is the minimum standard setting scale score needed to reach this achievement level on the 2018–2019 administration of tests. Note that threshold scores were generated solely for the standard setting process; reporting scales were later developed to report scores on the Student Score Report and public reporting.
Table 5.1 SSPI’s Recommendations for the Proposed Thresholds for Three Levels on the CSA
Grade or Grade Level Pe
rcen
t of S
tude
nts
in L
evel
1
Perc
ent a
t or A
bove
Le
vel 1
Perc
ent o
f Stu
dent
s in
Lev
el 2
Stan
dard
Set
ting
Scal
e Th
resh
old
Scor
e fo
r Lev
el 2
Perc
ent a
t or A
bove
Le
vel 2
Perc
ent o
f Stu
dent
s in
Lev
el 3
Stan
dard
Set
ting
Scal
e Th
resh
old
Scor
e fo
r Lev
el 3
Grade 3 52.7 100 33.0 401 47.3 14.3 413 Grade 4 53.5 100 31.5 401 46.5 15.0 414 Grade 5 45.6 100 40.8 398 54.4 13.6 413 Grade 6 41.4 100 40.8 398 58.6 17.8 411 Grade 7 58.2 100 37.0 402 41.8 4.8 418 Grade 8 57.4 100 32.9 402 42.6 9.7 415 High school 59.6 100 31.4 403 40.4 9.0 414
The reporting scale score range for each level at different grades is presented in table 6.2. The threshold score for each level is the lower bound of each scale score range. The scale score ranges do not change from year to year. Once established, they remain unchanged from administration to administration until such time that new performance standards are adopted. Table 6.4 presents the percentages of students at each level in the 2018–2019 operational administration of the CSA.
Standard Setting | References
CAASPP CSA Technical Report | 2018–2019 Administration August 2020 Page 56
References California Department of Education. (2017, November 8). California State Board of
Education: Final minutes: November 8–9, 2017. Retrieved from https://www.cde.ca.gov/be/mt/ms/documents/finalminutes0809nov2017.docx
California Department of Education. (2019). Standard setting technical report for the California Spanish Assessment. [Unpublished report]. Sacramento, CA: California Department of Education.
Cizek, G. J., & Bunch, M. B. (2007). Standard setting: A guide to establishing and evaluating performance standards on tests. Thousand Oaks, CA: Sage Publications.
Council of Chief State School Officers, California Department of Education, and San Diego County Office of Education. (2012). Common Core State Standards in language arts and literacy in history/social studies, science, and technical subjects: Spanish language version. Retrieved from https://commoncore-espanol.sdcoe.net/CCSS-en-Espanol/SLA-Literacy
Lewis, D. M., Green, D. R., Mitzel, H. C., Baum, K., & Patz, R. J. (1998). The Bookmark standard setting procedure: Methodology and recent implementations. Paper presented at the 1998 annual meeting of the National Council on Measurement, San Diego, CA.
Mitzel, H. C., Lewis, D. M., Patz, R. J., & Green, D. R. (2001). The bookmark procedure: Psychological perspectives. In G. J. Cizek (Ed.), Setting performance standards: Concepts, methods, and perspectives (pp. 249–81). Mahwah, NJ: Erlbaum.

Scoring and Reporting | Student Test Scores
August 2020 CAASPP CSA Technical Report | 2018–2019 Administration Page 57
Chapter 6: Scoring and Reporting Student item responses were scored and analyzed to determine individual students’ scores for the operational California Spanish Assessment (CSA). On the basis of the analyses of the item responses, individual student scores (i.e., overall reporting scores) were calculated and reported. In addition, student test scores were aggregated to produce summary reports for local educational agencies (LEAs). This chapter summarizes the scoring at the item level in the operational CSA and the approach implemented to produce student scores. This chapter also describes scores reported at the individual student level and various reports that were generated for 2018–2019 CSA administration.
6.1. Student Test Scores Overall reporting scores for the CSA are produced at the individual student level. To obtain overall reporting scores, the ability (theta) scores need to be estimated. Prior to the test administration, Educational Testing Service (ETS) Assessment & Learning Technology Development staff reviewed each item and determined the answer keys. The keys were provided to the American Institutes for Research (AIR) (now Cambium Assessment) for implementation in the test delivery system (TDS). After AIR finished machine scoring item responses, scores and responses were delivered to ETS. ETS’ Enterprise Score Key Management (eSKM) system collected and calculated individual students’ overall scores (e.g., total raw scores). ETS used two parallel scoring systems to produce and verify students’ scores: the eSKM scoring system, which received individual students’ item scores and item responses from AIR and computed individual student scores for the ETS reporting system; and the score computation by ETS’ Psychometric Analysis & Research team, which also computed individual student scores based on the same data files but using SAS, statistical analysis system software. The scores from the two systems were then compared for the purpose of internal quality control. Inconsistency in the total raw scores were discussed and resolved. The parallel scoring process ensured the quality and accuracy of scoring and supported the transfer of scores into the database of the student records scoring system, the Test Operations Management System (TOMS).
6.1.1. Incomplete and Complete Cases Whether a test should be scored or reported depended on the “complete” status of the test and how much of the test was submitted for scoring. Depending on the nature of the missing data, different actions were taken. As defined in the CSA scoring and reporting specifications, tests were considered “complete” and students were scored if students responded to at least 10 items. Students were assigned the lowest obtainable scale score (LOSS) if responding to at least 1 item but less than 10 items. Tests were considered “partially complete” if students logged on to the test but answered no items. Finally, tests were considered “noncomplete” if students did not log on to the test.
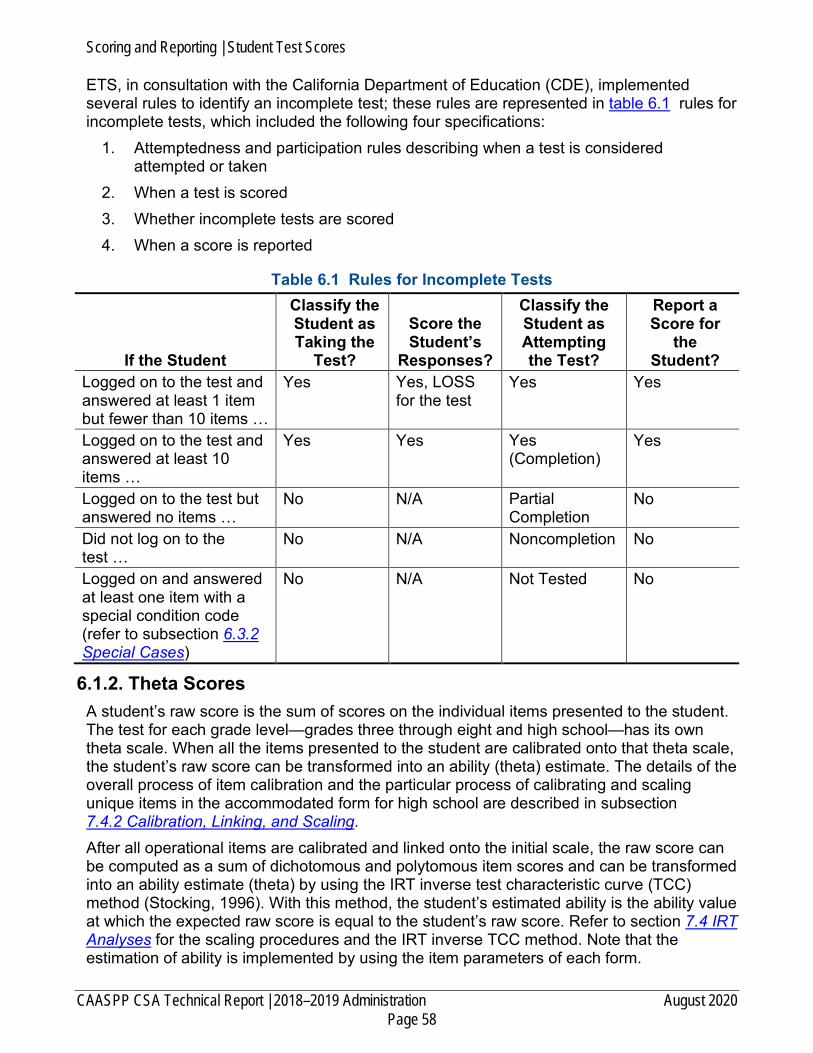
Scoring and Reporting | Student Test Scores
CAASPP CSA Technical Report | 2018–2019 Administration August 2020 Page 58
ETS, in consultation with the California Department of Education (CDE), implemented several rules to identify an incomplete test; these rules are represented in table 6.1 rules for incomplete tests, which included the following four specifications:
1. Attemptedness and participation rules describing when a test is considered attempted or taken
2. When a test is scored 3. Whether incomplete tests are scored 4. When a score is reported
Table 6.1 Rules for Incomplete Tests
If the Student
Classify the Student as Taking the
Test?
Score the Student’s
Responses?
Classify the Student as Attempting the Test?
Report a Score for
the Student?
Logged on to the test and answered at least 1 item but fewer than 10 items …
Yes Yes, LOSS for the test
Yes Yes
Logged on to the test and answered at least 10 items …
Yes Yes Yes (Completion)
Yes
Logged on to the test but answered no items …
No N/A Partial Completion
No
Did not log on to the test …
No N/A Noncompletion No
Logged on and answered at least one item with a special condition code (refer to subsection 6.3.2 Special Cases)
No N/A Not Tested No
6.1.2. Theta Scores A student’s raw score is the sum of scores on the individual items presented to the student. The test for each grade level—grades three through eight and high school—has its own theta scale. When all the items presented to the student are calibrated onto that theta scale, the student’s raw score can be transformed into an ability (theta) estimate. The details of the overall process of item calibration and the particular process of calibrating and scaling unique items in the accommodated form for high school are described in subsection 7.4.2 Calibration, Linking, and Scaling. After all operational items are calibrated and linked onto the initial scale, the raw score can be computed as a sum of dichotomous and polytomous item scores and can be transformed into an ability estimate (theta) by using the IRT inverse test characteristic curve (TCC) method (Stocking, 1996). With this method, the student’s estimated ability is the ability value at which the expected raw score is equal to the student’s raw score. Refer to section 7.4 IRT Analyses for the scaling procedures and the IRT inverse TCC method. Note that the estimation of ability is implemented by using the item parameters of each form.

Scoring and Reporting | Student Test Scores
August 2020 CAASPP CSA Technical Report | 2018–2019 Administration Page 59
When a conversion table from the raw score to theta score is created for each form, the theta score of each individual student can be obtained in the conversion table. The overall theta score distributions for each grade are presented in appendix 6.A. Refer to appendix 6.B for the raw-score-to-theta-score conversion tables.
6.1.3. Scale Scores for the Total Assessment Raw scores obtained on each grade-level CSA are transformed to scale scores using the scaling process described in subsection 7.4.2 Calibration, Linking, and Scaling. The following requirements were used to develop and define the CSA reporting scale ranges:
1. Each scale score has three digits (e.g., 320, 551, or 780) where the first digit isindicative of the grade being reported. The leading digit is defined by the grade forelementary and middle school, while the high school leading digit is set to “9.” Thelatter two digits represent the scale score as derived from the transformation from theraw scores to the scale scores. Refer to subsection 7.4.2.3.2 Transformation fromTheta Scores to Scale Scores for details of the transformation.
2. Score ranges are grade-specific. For example, the possible scale scores would be300 to 399 for grade three with the LOSS at 300 and the highest obtainable scalescore (HOSS) at 399. For grade four, this range is 400 to 499 with a LOSS of 400and a HOSS of 499, and so on for the other grades. For high school grades, thescale ranges from 900 to 999 with a LOSS of 900 and a HOSS of 999.
3. Each threshold score on the scale is the same from year to year. Also, across thegrade levels, the last two digits corresponding to the score reporting range are thesame, such as 360 for grade three, 460 for grade four, 560 for grade five, 660 forgrade six, 760 for grade seven, 860 for grade eight, and 960 for high school.
4. Students who logged on to the test and answered at least 1 item but fewer than 10items, as shown in table 6.1 rules for incomplete tests, are assigned the LOSS.
For students who complete a CSA, scale scores cannot be lower than the LOSS or higher than the HOSS as a result of truncation in the scale score transformation listed in table 7.10. For example, the scale scores for grade three are truncated at a minimum of 300 and a maximum of 399. As a result, the range of student ability estimates [-6, +6] is transformed to the scale score range [300, 399] for grade three and [400, 499] for grade four. The scale score ranges for other grades follow the same pattern. The complete raw-to-scale score conversion tables for each CSA test are presented in table 6.B.1 through table 6.B.14 in appendix 6.B. The raw scores, theta scores, transformed scale scores, and the number and percentage of students at each raw score are listed in those tables.

Scoring and Reporting | Overview of Score Aggregation Procedures
CAASPP CSA Technical Report | 2018–2019 Administration August 2020 Page 60
6.1.4. Score Reporting Ranges CSA reporting scales classify each student’s performance into one of the three score reporting ranges. Detailed information regarding the determination of the score reporting ranges can be found in the Standard Setting Technical Report for the California Spanish Assessment (CDE, 2019). The score reporting ranges for each grade level are presented in table 6.2.
Table 6.2 CSA Score Reporting Ranges by Grade Level Grade or
Grade Level Range 1 Range 2 Range 3 Grade 3 300–348 349–359 360–399 Grade 4 400–448 449–459 460–499 Grade 5 500–545 546–559 560–599 Grade 6 600–647 648–659 660–699 Grade 7 700–743 744–759 760–799 Grade 8 800–847 848–859 860–899 High school 900–949 950–959 960–999
6.2. Overview of Score Aggregation Procedures For the CSA, the aggregated scores are generated for the selected groups of interest (gender, ethnicity, English language fluency, etc.) and for the total population. This subsection contains a description of the types of aggregation that are performed on the CSA summary test scores.
6.2.1. Individual Student Score Distributions and Summary Statistics Summary statistics that describe student performance on each test are presented in table 6.3. Included in the table are the number of students taking each test and the means and standard deviations of student scores expressed in terms of both scale scores and theta scores. The table shows that 9,243 students in grade three took the CSA. However, only 376 students in grade twelve took the CSA. The number of students tested decreased from lower grades to higher grades.
Table 6.3 Mean and Standard Deviation of Theta Scores and Scale Scores
Grade or Grade Level
Number of Students Tested with Valid Scores
Scale Score Mean
Scale Score
SD
Theta Score Mean
Theta Score
SD Grade 3 9,243 348 9.9 -0.01 0.73 Grade 4 8,173 448 10.0 -0.01 0.80 Grade 5 6,868 547 10.0 -0.02 0.72 Grade 6 4,792 650 10.0 -0.01 0.69 Grade 7 3,400 742 9.8 -0.02 0.64 Grade 8 2,672 845 10.1 -0.02 0.68

Scoring and Reporting | Overview of Score Aggregation Procedures
August 2020 CAASPP CSA Technical Report | 2018–2019 Administration Page 61
Table 6.3 (continuation)
Grade or Grade Level
Number of Students Tested with Valid Scores
Scale Score Mean
Scale Score
SD
Theta Score Mean
Theta Score
SD High school—Grade 9 1,555 946 8.5 -0.11 0.61 High school—Grade 10 1,009 948 9.3 0.04 0.68 High school—Grade 11 982 948 9.3 0.02 0.68 High school—Grade 12 376 949 9.5 0.10 0.69 High school—All grades 3,922 947 9.1 -0.02 0.66
* The incomplete cases are not included in the analysis. The number and percentage of students at each score reporting range for each test is presented in table 6.4. More students are at score reporting range 1 than range 2 or range 3 for all grade levels, and score reporting range 3 has the fewest students.
Table 6.4 Numbers and Percentages of Students in Score Reporting Ranges
Grade or Grade Level Range
1 N Range
1 % Range
2 N Range
2 % Range
3 N Range
3 % Grade 3 4,968 53.75 3,000 32.46 1,275 13.79 Grade 4 4,472 54.72 2,515 30.77 1,186 14.51 Grade 5 3,220 46.88 2,756 40.13 892 12.99 Grade 6 2,040 42.57 1,928 40.23 824 17.20 Grade 7 2,016 59.29 1,230 36.18 154 4.53 Grade 8 1,578 59.06 851 31.85 243 9.09
High school—Grade 9 1,032 66.37 437 28.10 86 5.53 High school—Grade 10 558 55.30 347 34.39 104 10.31 High school—Grade 11 562 57.23 317 32.28 103 10.49 High school—Grade 12 205 54.52 116 30.85 55 14.63 High school—All grades 2,357 60.10 1,217 31.03 348 8.87
6.2.2. Group Scores Statistics summarizing student performance by grade for selected groups of students are provided in appendix 6.C. In table 6.C.1 through table 6.C.11, students are grouped by demographic characteristics, including gender, ethnicity, English language fluency, economic status (disadvantaged or not), special education services status, length of enrollment in U.S. schools, Spanish-language program type, and percentage of daily instruction in Spanish. For each demographic student group, the number of students who completed testing with a valid reporting scale score, reporting score means and standard deviations, and the percentage of students in each score reporting range are included in the tables. Table 4.1 provides definitions of the demographic student groups. To protect student privacy, when the number of students in a student group is 10 or fewer, the summary statistics are not reported and are presented as “N/A.”

Scoring and Reporting | Reports Produced and Scores for Each Report
CAASPP CSA Technical Report | 2018–2019 Administration August 2020 Page 62
6.3. Reports Produced and Scores for Each Report Score summaries are reported for different purposes for the CSA online assessments. The four major purposes are to
1. help facilitate conversations between parents/guardians and teachers about student performance,
2. serve as a tool to help parents/guardians and teachers work together to improve student learning,
3. help schools and LEAs identify strengths and areas that need improvement in their educational programs, and
4. provide the public and policymakers with information about student achievement. This section provides detailed descriptions of the uses and applications of the California Assessment of Student Performance and Progress (CAASPP) reporting for students. Scores for the CSA, as one of the components in CAASPP, are reported through the CAASPP reporting system.
6.3.1. Online Reporting TOMS is a secure website hosted by ETS that permits LEA users to manage the CAASPP online summative assessments and to inform the TDS. This system uses a role-specific design to restrict access to certain tools and applications based on the user’s designated role. Specific functions of TOMS include the following:
• Manage user access privileges
• Manage test administration calendars and testing windows
• Manage student test assignments
• Manage and confirm the accuracy of students’ test settings (i.e., designated supports and accommodations) prior to testing
• Generate and download various reports In addition to TOMS, there are two California online reporting systems: The Online Reporting System (ORS) and the California Educator Reporting System (CERS). TOMS communicates with the CERS, which provides authorized users with interactive and cumulative online reports for the CSA at the student, school, and LEA levels. The CERS provides access to two CAASPP functions: Score Reports, which provide preliminary score data for each administered test available in the reporting system; and Completion Status Reports, which provide completion data for students taking the test in the reporting system. LEA users can download files including the CSA score report data at the student level in PDF, Excel, and comma-separated value formats from TOMS.
6.3.2. Special Cases Student scores are not reported for the following cases:
• Student was absent from the test administration • Student moved or had a medical emergency during testing • Student’s parent/guardian requested exemption from testing
Scoring and Reporting | Reports Produced and Scores for Each Report
August 2020 CAASPP CSA Technical Report | 2018–2019 Administration Page 63
• Student did not log on to test systems• Student was administered out-of-grade level tests• Student was invalidated in the system (not reported in aggregated reporting)
6.3.3. Types of Score Reports CAASPP reports fall into three categories. The specific reports within each category are presented in this subsection. 6.3.3.1. Student Score Report The CSA Student Score Report is the official score report for parents or guardians and describes the student’s results, including reporting scale scores and a description of score reporting ranges. Scores for students who were assigned accommodations or designated supports are reported in the same way as for students who were not assigned accommodations or designated supports. Detailed information about accessibility resources is described in section 4.6 Universal Tools, Designated Supports, and Accommodations for Students with Disabilities in chapter 4. In all, LEAs had four options for accessing and distributing Student Score Reports to parents/guardians:
1. Accessing electronic Student Score Reports using a locally provided parent/guardianor student portal
2. Downloading Student Score Reports from TOMS and making them availableelectronically using a secure local method
3. Downloading Student Score Reports from TOMS, printing them, and making themavailable locally
4. Purchasing paper Student Score Reports from ETSFurther information about the Student Score Report and other reports is provided on the CAASPP Starting Smarter website, https://ca.startingsmarter.org/. 6.3.3.2. School Report The school performance report provides group information including the school’s average reporting scale score and the percentage of students at each score reporting range. This report also provides a list of students’ reporting scale scores and score reporting ranges. These reports may be found in the CERS. 6.3.3.3. District Report The district performance report provides school-level information including the school average reporting scale score and the percentage of students at each score reporting range. This report lists all the proficiency information for each school, including the number of students who completed testing with a valid reporting scale score, average reporting scale score, and percentage of students in each score reporting range. Internet reports are accessible to the public online on the Test Results for California’s Assessments website at https://caaspp-elpac.cde.ca.gov/caaspp/.
Scoring and Reporting | Reports Produced and Scores for Each Report
CAASPP CSA Technical Report | 2018–2019 Administration August 2020 Page 64
6.3.4. Score Report Applications CSA results provide parents/guardians with information about their child’s progress. The results are a tool for increasing communication and collaboration between parents/guardians and teachers. These results are one measure of student’s academic performance and provide limited information. Like any important measure of student performance, they should be viewed with other available information such as progress on individualized education program goals, assignments, and teacher conferences. Results can be used to communicate with a student’s teachers about how to help the student progress in Spanish reading/language arts competency. There may be a low, moderate, or high degree of alignment between the CSA results and the LEA’s instructional programs. Factors that determine this alignment are:
• Does the LEA’s Spanish language program provide Spanish reading/language arts instruction?
• Is the LEA’s Spanish language program aligned with the California Common Core State Standards en Español?
• Is there a percentage of the LEA’s instructional day that is conducted in Spanish? If all three statements are true, then an LEA may have a high degree of alignment between its CSA results and its instructional program. The less true the statements are, the lower the degree of the alignment. With this in mind, schools may use the CSA results to help make decisions about how to support student achievement. CSA results, however, should never be used as the only source of information to make important decisions about a child’s education. CSA results help schools and LEAs identify strengths and weaknesses in their instructional programs.
6.3.5. Criteria for Interpreting Test Scores LEAs may use the CSA results to help inform decisions around instructional needs, but the CSA results should not be used in isolation to make inferences about instructional needs. It is important to remember that results from a single test can provide only limited information. Other relevant information should be considered as well. It is advisable for parents and guardians to evaluate their child’s strengths and weaknesses in the relevant topics by reviewing classroom work and progress reports in addition to the student’s CSA results. It is also important to note that a student’s score in a content area contains measurement error and could vary to some extent if the student were retested.
6.3.6. Criteria for Interpreting Group Score Reports The information presented in various reports must be interpreted with caution when making performance comparisons. When comparing reporting scale scores, the user is limited to the comparison within a grade level. The user may compare reporting scale scores for the same grade within a school, between schools, or between a school and its district, its county, or the state.

Scoring and Reporting | References
August 2020 CAASPP CSA Technical Report | 2018–2019 Administration Page 65
References California Department of Education. (2019). Standard setting technical report for the
California Spanish Assessment. [Unpublished report]. Sacramento, CA: California Department of Education.
Stocking, M. L. (1996). An alternative method for scoring adaptive tests. Journal of Educational and Behavioral Statistics, 21, 365–89.
Analyses | Overview
CAASPP CSA Technical Report | 2018–2019 Administration August 2020 Page 66
Chapter 7: Analyses This chapter summarizes the results of the analyses of the data from the 2018–2019 California Spanish Assessment (CSA) operational test administration, including classical item analyses, differential item functioning (DIF) analyses, item response theory (IRT) calibration, and response time analyses. Information on test reliability is also reported in this chapter.
7.1. Overview This chapter provides information on the psychometric analyses of the 2018–2019 operational CSA. It describes the data samples used for the statistical analyses, presents the results of the item and test analyses, and explains all statistical procedures implemented in the psychometric analyses. The procedures designed to ensure the validity of score uses and interpretations are also provided.
7.1.1. Summary of the Analyses The following list identifies the analyses conducted for the CSA. Each analysis is described in the narrative subsequently, and the corresponding analysis results are provided in the appendices.
1. Classical Item Analyses—Classical item analysis for the CSA is discussed insection 7.2 Classical Item Analyses. Appendix 7.A presents results of the classicalitem analyses, including item difficulty index and item-total correlation coefficient foreach item. In addition, the item type and any associated item flags are also provided.
2. Differential Item Functioning (DIF) Analyses—DIF analysis for the CSA isdescribed in section 7.3 Differential Item Functioning (DIF) Analyses. Appendix 7.Bpresents the results of the DIF analyses for all items with sufficient student samplesizes. The distributions of items across DIF categories are listed.
3. Item Response Theory (IRT) Analyses—IRT analyses, including calibration andscaling for the CSA are described in section 7.4 IRT Analyses. The results of theanalyses for the 2018–2019 operational administration include the following:
• A single-group concurrent calibration combining both the regular form and theaccommodated form within a grade level for all grades is presented, as is a two-step calibration for high school to link the items from the accommodation form tothe high school general form (The details of the overall process of item calibrationand the special process of linking the unique items from the accommodated formto the general form for high school are elaborated in subsection 7.4.2 Calibration,Linking, and Scaling.)
• Appendix 7.C includes the distributions of item difficulty parameter estimates(b-values) in each grade level. The item difficulty parameter estimates (b-values)for all of the items in each test are listed. For polytomous items, partial-credit stepvalues (d-values) are also provided.

Analyses | Overview
August 2020 CAASPP CSA Technical Report | 2018–2019 Administration Page 67
• For high school, appendix 7.D includes the scatterplots showing the relationship between item difficulty parameter estimates (b-values) of all the items in the regular form for high school and their 2018 fall field test item difficulty parameter estimates (b-values) after transforming the 2018 fall field test estimates onto the reference scale from the 2018–2019 operational administration.
4. Response Time Analyses—Response time analyses are described in section 7.5 Response Time Analyses. Appendix 7.E presents the results of response time analysis.
5. Reliability Analyses—Reliability estimation for the CSA is illustrated in section 7.6 Reliability Analyses. Table 7.F.1 through table 7.F.7 in appendix 7.F provide results of the reliability analyses of total test scores for selected student groups of interest (e.g., gender, ethnicity, etc.), and each form of the grade-level. Table 7.F.22 through table 7.F.35 present statistics describing the decision accuracy and decision consistency of the score reporting range classifications.
6. Validity Evidence—Validity evidence related to the CSA is discussed in section 7.7 Validity Evidence.
7.1.2. Sample Used for the Analyses In general, analyses included in the technical report are based on all valid scores in the tested population. The actual data sample used depends on the time that data source became available as well as the information contained in the data to meet the analysis timeline. Both classical item analysis and IRT calibration include students who logged on to the test and answered at least one item. The IRT analyses (appendix 7.C and appendix 7.D) were based on the data file available in June 2019. The classical item analyses (appendix 7.A) and item-level DIF analyses (appendix 7.B) were based on the complete data file available in July 2019, after the administration testing window was closed on July 15, 2019. All other analyses, such as the response time analyses and reliability analyses, used the final version of the production data file for student reports, which became available in December 2019. All data sources include all valid student scores. Table 7.1 shows small differences in student counts among the data sources used for IRT calibration analysis, classical item analysis and DIF analysis, and the final production data file. Note that the calibration sample data includes fewer students than the classical item analysis and DIF sample data, while the calibration sample data is representative of the population. A small number of student scores was excluded from the final production data as a result of the data validation process. Note that (IA) is used in the following table to abbreviate classical item analysis.
Table 7.1 Sample Size by Form Grade or
Grade Level Calibration Sample N
IA and DIF Sample N
Final Production Data N
Grade 3 9,038 9,270 9,243 Grade 4 8,014 8,178 8,173 Grade 5 6,730 6,873 6,868 Grade 6 4,773 4,799 4,792

Analyses | Classical Item Analyses
CAASPP CSA Technical Report | 2018–2019 Administration August 2020 Page 68
Table 7.1 (continuation)
Grade or Grade Level
Calibration Sample N
IA and DIF Sample N
Final Production Data N
Grade 7 3,365 3,405 3,400 Grade 8 2,574 2,672 2,672
High school 3,857 3,941 3,922
7.2. Classical Item Analyses Classical item analyses are conducted to evaluate the performance of all operational test items with respect to item difficulty, item discrimination, and distractor analysis. In addition, the distributions of score categories on key-based, selected-response items and rule-based, machine-scored items are also included in the classical item analyses results. Lastly, the associated flagging rules of these statistics are used to identify items that are not performing as expected. Items scored as one (correct) or zero (incorrect) are referred to as dichotomous items. Items with maximum score greater than one are called polytomous items. Table 7.2 and table 7.3 present the summary results of item difficulty and item-total correlation by grade level. Table 7.4 presents the summary results of flagged items in each form by grade level. In addition, appendix 7.A presents results of the classical item analyses, including item difficulty indices and item-total correlation coefficient. The item type and associated item flags are also provided.
7.2.1. Classical Item Difficulty Indices (p-value and Average Item Score) For dichotomous items, item difficulty is indicated by its p-value, which is the proportion of students who answer the item correctly. The range of p-values is from 0.00 to 1.00. Items with high p-values are easier items; those with low p-values are more difficult items. The formula for the p-value for a dichotomous item is
(7.1)
Refer to the Alternative Text for Equation 7.1 for a description of this equation. where,
is the number of students that answered item i correctly, and
is the total number of students who were presented with item i.
For polytomous items, the difficulty is indicated by the average item score (AIS). The AIS can range from 0.00 to the maximum total possible points for an item. Desired AIS values for polytomous items generally fall within the range of 20 percent to 95 percent of the maximum obtainable item score; items with values outside this range are flagged for review. To facilitate the interpretation, the AIS values for polytomous items are often expressed as the proportion of the maximum possible score, which are equivalent to the p-values of dichotomous items.

Analyses | Classical Item Analyses
August 2020 CAASPP CSA Technical Report | 2018–2019 Administration Page 69
The formula for the p-value for a polytomous item is
(7.2) Refer to the Alternative Text for Equation 7.2 for a description of this equation.
where,
is the score assigned for a given polytomous item i and student j,
is the total number of students who were presented with item i, and
Max (Xi) is the maximum possible score for item i.
7.2.2. Item-Total Score Correlation The item-total correlation statistic describes the relationship between students’ performance on a specific item and their performance on the total test. It is calculated as the correlation coefficient between the item score and total score. In general, item-total correlation ranges from -1.0 (for a perfect negative relationship) to 1.0 (for a perfect positive relationship). A relatively high positive item-total correlation coefficient value is desired, as it indicates that students with higher scores on the overall test tend to perform better on the item. A negative item-total correlation typically signifies a problem with the item, as the students with higher scores on the overall test are more likely to get the item wrong or receive a low score, and the students with lower scores on the overall test are more likely to get the item correct or a high score. For the CSA, the polyserial correlation is used for both polytomous and dichotomous items. Statistically, polyserial correlations are based on a polyserial regression model (Olsson, 1979; Drasgow, 1988), which assumes that performance on an item is determined by the examinee’s position on an underlying latent variable that is normally distributed at a given criterion score level. Polyserial correlation is an estimate of the correlation between the test score and the latent variable that determines the examinee’s performance on the item. Based on this approach, the polyserial correlation can be estimated as
(7.3) Refer to the Alternative Text for Equation 7.3 for a description of this equation.
where,
is the standard deviation (SD) of the students’ total test scores as a criterion score, and
is the item parameter to be estimated from the data, with the estimate denoted as , using maximum likelihood estimation. It is a regression coefficient (slope) for predicting the continuous version of an item score onto the continuous version of the total score.
Analyses | Classical Item Analyses
CAASPP CSA Technical Report | 2018–2019 Administration August 2020 Page 70
There are as many regressions as there are boundaries between scores with all regressions sharing a common slope, β. For a polytomous item, there are m-1 regressions, where m is the number of score points on the item. Beta (β) is the common slope for all m-1 regressions. Desired polyserial correlation values of items are positive and larger than 0.20. Items with negative polyserial correlation values or values below 0.2 are flagged for review.
7.2.3. Distractor Analyses The quality of distractors is an important component of an item’s overall quality. Distractors should be clearly incorrect, but at the same time be plausible and attractive to students who do not understand the content or skills being assessed. For the operational CSA, the following distractor analyses were conducted to evaluate the quality of distractors. 7.2.3.1. The Proportion of Students Choosing Each Distractor The percentage of students at each response option is calculated for the highest-performing 20 percent of students. If the percentage of students who selected a distractor is greater than the percentage of students who selected the correct answer for the high-performing group, the item is flagged and examined to determine if it has multiple correct answers or the wrong key (i.e., the item is miskeyed). 7.2.3.2. Polyserial Correlation The polyserial correlation is calculated for each response option. While the key should have a positive polyserial correlation with the criterion score, the distractors should exhibit negative polyserial correlations (i.e., lower-ability students would likely choose the distractors, while higher-ability students would not). An item with a positive distractor-total correlation is flagged for review, as this item may have multiple correct answers, be miskeyed, or have other content issues.
7.2.4. Omission and Completion Rates An item is considered “omitted” if it was seen but not answered (i.e., it was left blank). Because students are not allowed to skip questions once they have started taking the CSA, and the only exception is when students skip questions belonging to a reading passage or a paginated item group and exit out of the testing system, the possibility of an omission would be very small.
7.2.5. Distribution of Item Scores For polytomous items, examination of the distribution of scores assists in showing how well the item performed. If no students achieved the highest possible score, the item may not be functioning as expected because the item may be confusing, poorly worded, unexpectedly difficult, or students may not have had an opportunity to learn the content. Items with a low percentage (i.e., less than 3 percent) of students obtaining any possible item score were flagged for further review. Such items may pose problems during the IRT calibrations so require careful review and, possibly, may need to be excluded from the item calibration analyses.
Analyses | Classical Item Analyses
August 2020 CAASPP CSA Technical Report | 2018–2019 Administration Page 71
7.2.6. Summary of Classical Item Analyses Flagging Criteria In summary, an item is flagged for review if the item analysis yields any of the following results. One item could have multiple flags if the statistics meet the flagging criteria:
• A difficulty flag indicates extreme values of the proportion-correct (for dichotomous items) or the proportion of the possible maximum points earned (for polytomous items): – A-flag: A p-value less than 0.2 for dichotomous items and polytomous items
suggests that the item might be too difficult. – H-flag: A p-value greater than 0.95 for dichotomous items and polytomous items
suggests that the item might be too easy.
• A discrimination flag (R-flag) indicates that the item does not discriminate effectively between high- and low-ability students. Items with a polyserial correlation less than 0.20 are flagged.
• An omit flag (O-flag) is set for dichotomous items and polytomous items with nonresponse rates greater than five percent.
• A distractor flag (P-flag) is used for an item with any distractors having positive correlation with the criterion score.
• A miskey flag (D-flag) is used for multiple-choice items when more of the high-ability examinee group—the top 20 percent of examinees on the total assessment—choose any distractor rather than choosing the response keyed as correct.
• An underrepresented score point flag (L-flag) is used for any item that has less than 3 percent of the students at any score level.
Educational Testing Service’s (ETS’) Psychometric Analysis & Research (PAR) staff and Assessment & Learning Technology Development staff carefully reviewed each of the flagged items during and at the end of the item analyses. All confirmed flagged items were also reviewed by content experts and then summarized for the California Department of Education (CDE) with recommendations for subsequent analyses.
7.2.7. Classical Item Analyses Results Summary The summary statistics of the classical item analyses, which include the means and ranges of overall item difficulty and item-total correlation for all operational items, are presented in table 7.2 and table 7.3 for each grade level. There is a range of item difficulties with the p-values ranging from 0.04 to 0.90 and the average p-values ranging from 0.42 to 0.48, indicating those items are slightly difficult for students. The CSA grade-level assessments had a wide range of item difficulties, with some items being easy for the students (items with p-values close to 0.90) and some items being difficult for the students (items with p-values below 0.33). Most items are clustered in the range of 0.2–0.6 in p-value. The average item-total correlation ranged from 0.35 to 0.42. These values of the item-total correlations indicate that the items have acceptable levels of discrimination.
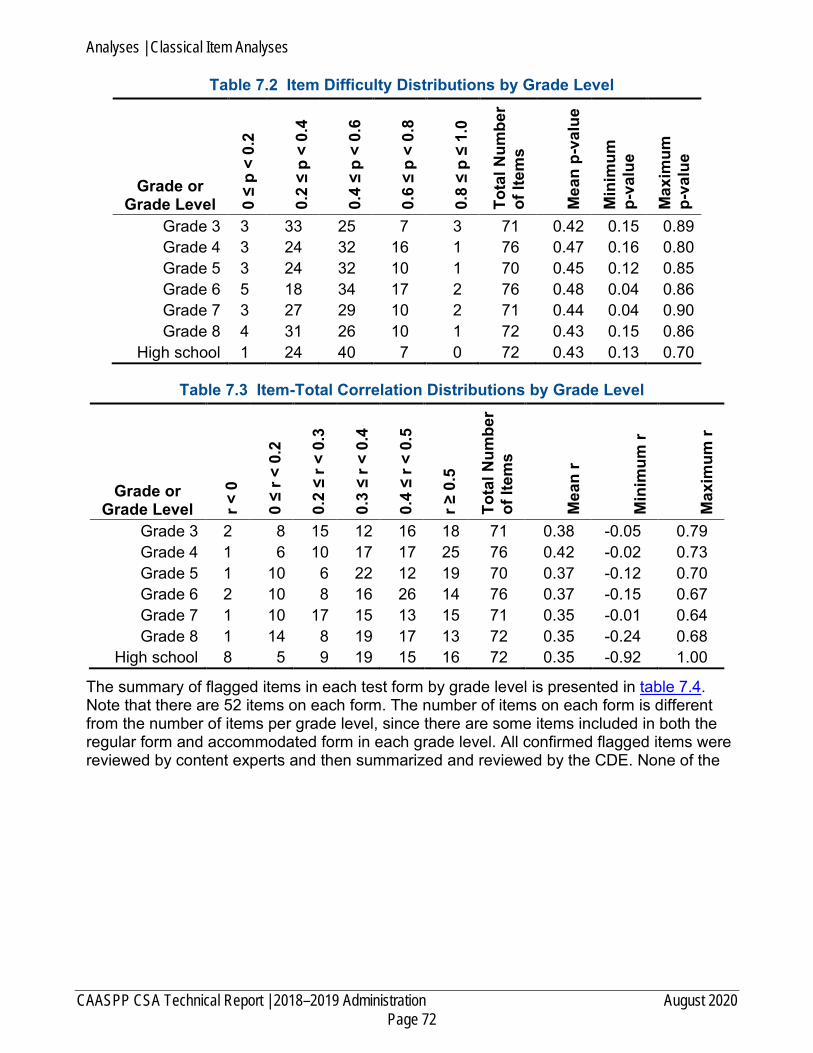
Analyses | Classical Item Analyses
CAASPP CSA Technical Report | 2018–2019 Administration August 2020 Page 72
Table 7.2 Item Difficulty Distributions by Grade Level
Grade or Grade Level 0
≤ p
< 0.
2
0.2
≤ p
< 0.
4
0.4
≤ p
< 0.
6
0.6
≤ p
< 0.
8
0.8
≤ p
≤ 1.
0
Tota
l Num
ber
of It
ems
Mea
n p-
valu
e
Min
imum
p-
valu
e
Max
imum
p-
valu
e
Grade 3 3 33 25 7 3 71 0.42 0.15 0.89 Grade 4 3 24 32 16 1 76 0.47 0.16 0.80 Grade 5 3 24 32 10 1 70 0.45 0.12 0.85 Grade 6 5 18 34 17 2 76 0.48 0.04 0.86 Grade 7 3 27 29 10 2 71 0.44 0.04 0.90 Grade 8 4 31 26 10 1 72 0.43 0.15 0.86
High school 1 24 40 7 0 72 0.43 0.13 0.70
Table 7.3 Item-Total Correlation Distributions by Grade Level
Grade or Grade Level r <
0
0 ≤
r < 0
.2
0.2
≤ r <
0.3
0.3
≤ r <
0.4
0.4
≤ r <
0.5
r ≥ 0
.5
Tota
l Num
ber
of It
ems
Mea
n r
Min
imum
r
Max
imum
r
Grade 3 2 8 15 12 16 18 71 0.38 -0.05 0.79 Grade 4 1 6 10 17 17 25 76 0.42 -0.02 0.73 Grade 5 1 10 6 22 12 19 70 0.37 -0.12 0.70 Grade 6 2 10 8 16 26 14 76 0.37 -0.15 0.67 Grade 7 1 10 17 15 13 15 71 0.35 -0.01 0.64 Grade 8 1 14 8 19 17 13 72 0.35 -0.24 0.68
High school 8 5 9 19 15 16 72 0.35 -0.92 1.00
The summary of flagged items in each test form by grade level is presented in table 7.4. Note that there are 52 items on each form. The number of items on each form is different from the number of items per grade level, since there are some items included in both the regular form and accommodated form in each grade level. All confirmed flagged items were reviewed by content experts and then summarized and reviewed by the CDE. None of the

Analyses | Classical Item Analyses
August 2020 CAASPP CSA Technical Report | 2018–2019 Administration Page 73
flagged items were identified as having any content flaws during the thorough review by content experts and the CDE.
Table 7.4 Flagged Items Summary in Each Form by Grade Level
Grade or Grade Level Fo
rm
No.
of I
tem
s
No.
of F
lag
A
Item
s
Perc
ent o
f Fl
ag A
Item
s
No.
of F
lag
H
Item
s
Perc
ent o
f Fl
ag H
Item
s
No.
of F
lag
R
Item
s
Perc
ent o
f Fl
ag R
Item
s
No.
of F
lag
D
Item
s
Perc
ent o
f Fl
ag D
Item
s
Grade 3 1 52 0 0.00% 0 0.00% 5 9.62% 5 9.62% Grade 3 A 52 3 5.77% 0 0.00% 9 17.31% 10 19.23% Grade 4 1 52 2 3.85% 0 0.00% 2 3.85% 4 7.69% Grade 4 A 52 2 3.85% 0 0.00% 6 11.54% 6 11.54% Grade 5 1 52 1 1.92% 0 0.00% 7 13.46% 6 11.54% Grade 5 A 52 3 5.77% 0 0.00% 8 15.38% 9 17.31% Grade 6 1 52 3 5.77% 0 0.00% 6 11.54% 8 15.38% Grade 6 A 52 3 5.77% 0 0.00% 10 19.23% 11 21.15% Grade 7 1 52 1 1.92% 0 0.00% 5 9.62% 6 11.54% Grade 7 A 52 3 5.77% 0 0.00% 9 17.31% 6 11.54% Grade 8 1 52 1 1.92% 0 0.00% 6 11.54% 5 9.62% Grade 8 A 52 3 5.77% 0 0.00% 12 23.08% 10 19.23%
High school 1 52 0 0.00% 0 0.00% 4 7.69% 5 9.62% High school A 52 1 1.92% 0 0.00% 12 23.08% 8 15.38%
Table 7.4 Flagged Items Summary in Each Form by Grade Level (Continued)
Grade or Grade Level Fo
rm
No.
of I
tem
s
No.
of F
lag
P Ite
ms
Perc
ent o
f Fl
ag P
Item
s
No.
of F
lag
O
Item
s
Perc
ent o
f Fl
ag O
Item
s
No.
of F
lag
L Ite
ms
Perc
ent o
f Fl
ag L
Item
s
Grade 3 1 52 15 28.85% 0 0.00% 1 1.92% Grade 3 A 52 18 34.62% 0 0.00% 0 0.00% Grade 4 1 52 15 28.85% 0 0.00% 1 1.92% Grade 4 A 52 17 32.69% 0 0.00% 0 0.00% Grade 5 1 52 17 32.69% 0 0.00% 0 0.00% Grade 5 A 52 21 40.38% 0 0.00% 0 0.00% Grade 6 1 52 19 36.54% 0 0.00% 1 1.92% Grade 6 A 52 17 32.69% 0 0.00% 1 1.92% Grade 7 1 52 25 48.08% 0 0.00% 0 0.00% Grade 7 A 52 22 42.31% 4 7.69% 0 0.00%
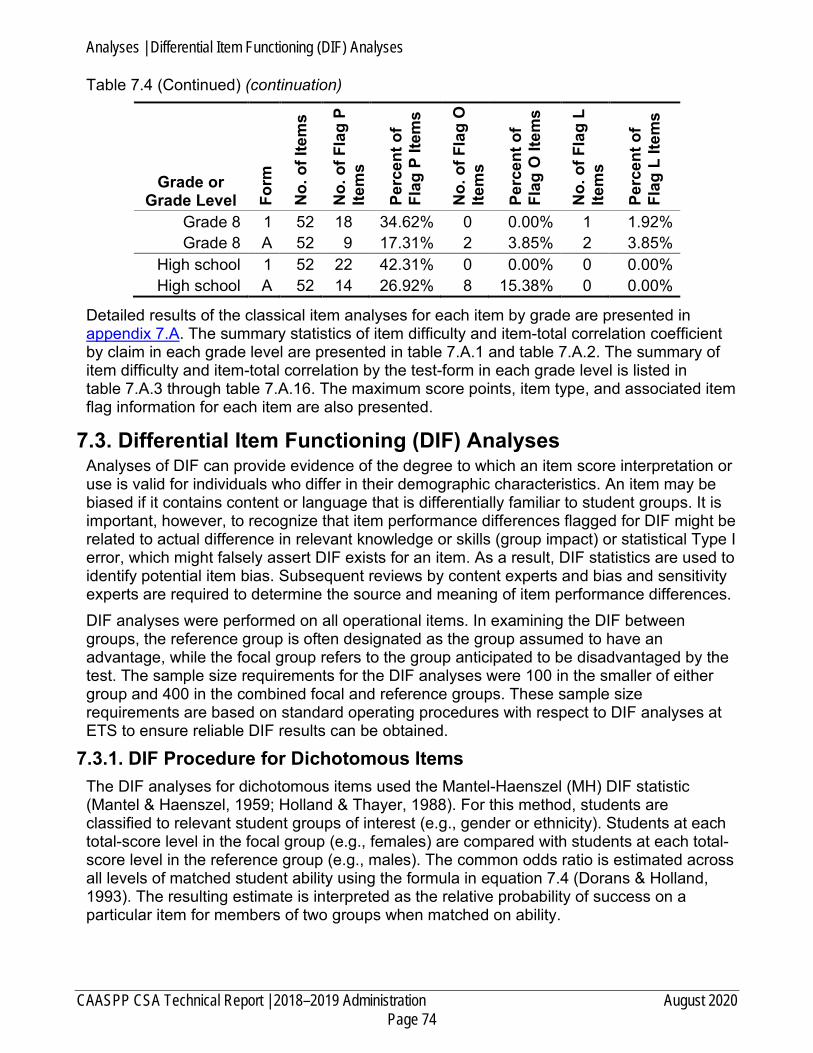
Analyses | Differential Item Functioning (DIF) Analyses
CAASPP CSA Technical Report | 2018–2019 Administration August 2020 Page 74
Table 7.4 (Continued) (continuation)
Grade or Grade Level Fo
rm
No.
of I
tem
s
No.
of F
lag
P Ite
ms
Perc
ent o
f Fl
ag P
Item
s
No.
of F
lag
O
Item
s
Perc
ent o
f Fl
ag O
Item
s
No.
of F
lag
L Ite
ms
Perc
ent o
f Fl
ag L
Item
s
Grade 8 1 52 18 34.62% 0 0.00% 1 1.92% Grade 8 A 52 9 17.31% 2 3.85% 2 3.85%
High school 1 52 22 42.31% 0 0.00% 0 0.00% High school A 52 14 26.92% 8 15.38% 0 0.00%
Detailed results of the classical item analyses for each item by grade are presented in appendix 7.A. The summary statistics of item difficulty and item-total correlation coefficient by claim in each grade level are presented in table 7.A.1 and table 7.A.2. The summary of item difficulty and item-total correlation by the test-form in each grade level is listed in table 7.A.3 through table 7.A.16. The maximum score points, item type, and associated item flag information for each item are also presented.
7.3. Differential Item Functioning (DIF) Analyses Analyses of DIF can provide evidence of the degree to which an item score interpretation or use is valid for individuals who differ in their demographic characteristics. An item may be biased if it contains content or language that is differentially familiar to student groups. It is important, however, to recognize that item performance differences flagged for DIF might be related to actual difference in relevant knowledge or skills (group impact) or statistical Type I error, which might falsely assert DIF exists for an item. As a result, DIF statistics are used to identify potential item bias. Subsequent reviews by content experts and bias and sensitivity experts are required to determine the source and meaning of item performance differences. DIF analyses were performed on all operational items. In examining the DIF between groups, the reference group is often designated as the group assumed to have an advantage, while the focal group refers to the group anticipated to be disadvantaged by the test. The sample size requirements for the DIF analyses were 100 in the smaller of either group and 400 in the combined focal and reference groups. These sample size requirements are based on standard operating procedures with respect to DIF analyses at ETS to ensure reliable DIF results can be obtained.
7.3.1. DIF Procedure for Dichotomous Items The DIF analyses for dichotomous items used the Mantel-Haenszel (MH) DIF statistic (Mantel & Haenszel, 1959; Holland & Thayer, 1988). For this method, students are classified to relevant student groups of interest (e.g., gender or ethnicity). Students at each total-score level in the focal group (e.g., females) are compared with students at each total-score level in the reference group (e.g., males). The common odds ratio is estimated across all levels of matched student ability using the formula in equation 7.4 (Dorans & Holland, 1993). The resulting estimate is interpreted as the relative probability of success on a particular item for members of two groups when matched on ability.

Analyses | Differential Item Functioning (DIF) Analyses
August 2020 CAASPP CSA Technical Report | 2018–2019 Administration Page 75
(7.4)
Refer to the Alternative Text for Equation 7.4 for a description of this equation. where,
m is the number of score categories of the total test, Rrm is the number of students in the reference group who answer the item correctly at score level m, Wfm is the number of students in the focal group who answer the item incorrectly at score level m, Ntm is the total number of students at score level m,
Rfm is the number of students in the focal group who answer the item correctly at score level m, and Wrm is the number of students in the reference group who answer the item incorrectly at score level m.
To facilitate the interpretation of MH results, the common odds ratio is frequently transformed to the delta scale using the following formula (Holland & Thayer, 1988):
(7.5)
Refer to the Alternative Text for Equation 7.5 for a description of this equation. Positive values indicate DIF in favor of the focal group (i.e., positive DIF items are differentially easier for the focal group), whereas negative values indicate DIF in favor of the reference group (i.e., negative DIF items are differentially harder for the focal group).
7.3.2. DIF Procedure for Polytomous Items The standardization DIF (Dorans & Schmitt, 1993; Zwick, Thayer, & Mazzeo, 1997; Dorans, 2013) in conjunction with the Mantel chi-square statistic (Mantel, 1963; Mantel & Haenszel, 1959) is calculated for polytomous items. The standardized mean difference (SMD) compares the item means of the two groups after adjusting for differences in the distribution of students across all items and is calculated using the following formula:
(7.6)
Refer to the Alternative Text for Equation 7.6 for a description of this equation. where,
X is the criterion score (total raw score), Y is the item score,

Analyses | Differential Item Functioning (DIF) Analyses
CAASPP CSA Technical Report | 2018–2019 Administration August 2020 Page 76
M is the number of score levels on X, Nrm is the number of students in the reference group at score level m, Nfm is the number of students in the focal group at score level m, Er is the expected item score for the reference group, and Ef is the expected item score for the focal group.
A positive SMD value means that, conditional on the criterion score, the focal group has a higher mean item score than the reference group (i.e., the item is differentially easier for the focal group). In contrast, a negative SMD value means that, conditional upon the criterion score, the focal group has a lower mean item score than the reference group (i.e., the item is differentially harder for the focal group).
7.3.3. DIF Categories and Definitions Based on the DIF statistics and significance tests, items are classified into three categories and assigned values of A, B, or C. Category A items contain negligible DIF, Category B items exhibit slight to moderate DIF, and Category C items possess moderate to large DIF values. The DIF categories for dichotomous items are defined in table 7.5; the DIF categories for polytomous items are defined in table 7.6.
Table 7.5 DIF Categories for Dichotomous Items DIF Category Criteria
A (negligible) • Absolute value of MH D-DIF is not significantly different from zero at the 0.05 level or is less than one.
• Positive values are classified as “A+” and negative values, as “A-.”
B (moderate) • Absolute value of MH D-DIF is significantly different from zero but not from one at the 0.05 level and is at least one; OR
• Absolute value of MH D-DIF is significantly different from one but is less than 1.5.
• Positive values are classified as “B+” and negative values, as “B-.”
C (large) • Absolute value of MH D-DIF is significantly greater than one at the 0.05 level and is at least 1.5.
• Positive values are classified as “C+” and negative values, as “C-.”
Table 7.6 DIF Categories for Polytomous Items DIF Category Criteria
A (negligible) • Mantel Chi-square p-value > 0.05 level or |SMD/SD| ≤ 0.17 B (moderate) • Mantel Chi-square p-value < 0.05 level and 0.17< |SMD/SD| ≤ 0.25
C (large) • Mantel Chi-square p-value < 0.05 level and |SMD/SD| > 0.25
Note: SMD = standardized mean DIF; SD = total group standard deviation of item score

Analyses | IRT Analyses
August 2020 CAASPP CSA Technical Report | 2018–2019 Administration Page 77
7.3.4. Items Exhibiting Significant DIF DIF analyses for the gender group were conducted for the CSA for each grade level. Appendix 7.B provides detailed DIF results. Table 7.B.1 shows the distributions of items across the DIF category classifications for each grade level. In addition, “Small N” indicates that the DIF analysis was not performed due to insufficient sample size in table 7.B.1. There were no C-DIF items for any grade level for the gender group comparison.
7.4. IRT Analyses IRT is built upon the item response function, which describes the probability of a given response as a function of a person’s true ability. IRT can be used to implement item calibrations, link item parameters, scale test scores across different forms or test administrations, evaluate item performance, build an item bank, and assemble test forms. The item parameter baseline scale for the CSA was derived from the 2018–2019 operational administration data. For grades three through eight, concurrent calibration was conducted for all operational items on the regular form and the accommodated form for each grade level. For high school, items on the regular form were successfully calibrated and the baseline scale was established. However, the unique items in the operational accommodated form could not be calibrated due to an insufficient number of students who took this test. To calibrate those unique items in the accommodated form, the PAR team used data from the 2018 fall field test that had sufficient student samples to support calibration. After the 2018 fall field test items were calibrated, they were linked to the high school operational baseline scale so that students taking the accommodated form for high school could be scored. This section describes how IRT models were used in the CSA for calibrating items for all grades and for the high school regular test form, as well as how the item parameter estimates from the 2018 fall field test were linked on to the spring 2019 baseline scale for high school.
7.4.1. Item Response Theory Models The one-parameter logistic item response theory (1PL-IRT) model was used for the CSA item calibration and was selected after consultation with the CDE. In particular, the generalized partial credit model (GPCM) (Muraki, 1992) restricted for 1PL-IRT, which is essentially the partial credit model (PCM) (Masters, 1982), is applied to both dichotomous and polytomous items. The mathematical form of the GPCM is

Analyses | IRT Analyses
CAASPP CSA Technical Report | 2018–2019 Administration August 2020 Page 78
(7.7) Refer to the Alternative Text for Equation 7.7 for a description of this equation.
where,
is the probability of student with proficiency obtaining score h on item i,
is the maximum number of score points for item i,
is the discrimination parameter and is fixed to 0.588 for every item,
is the location parameter for item i,
is the category parameter for item i on item score v, and
D is a scaling constant of 1.7 that makes the logistic model approximate the normal ogive model.
When , equation 7.7 becomes an expression of the one-parameter logistic (1PL) model for dichotomous items. Essentially, the 1PL model (Hambleton, Swaminathan, & Rogers, 1991) and the PCM (Masters, 1982) were used for dichotomous items and polytomous items, respectively.
7.4.2. Calibration, Linking, and Scaling 7.4.2.1. Item Calibration After the 2018–2019 CSA operational administration, all of the items at each grade level were calibrated concurrently using all available data, including students who were administered the regular and accommodated forms. Previous studies show that, compared with separate calibration, concurrent calibration is more accurate when the data fits the IRT model (Kim & Cohen, 1998; Hanson & Béguin, 2002). After consultation with the CDE, a single-group concurrent calibration approach was used for item calibration of the CSA. As a result of the concurrent calibration, the item parameter estimates were placed on a common scale for the same grade level. As stated in subsection 7.4.1 Item Response Theory Models, the 1PL model (Hambleton, Swaminathan, & Rogers, 1991) and the corresponding PCM were jointly used to concurrently calibrate dichotomously and polytomously scored items. The software flexMIRT® (Cai, 2016) version 3.5 was used for calibration.
Analyses | IRT Analyses
August 2020 CAASPP CSA Technical Report | 2018–2019 Administration Page 79
7.4.2.1.1. Data Preparation Prior to IRT calibration analyses, ETS psychometricians reviewed the results of the classical item analyses to decide whether any items were of poor quality and needed to be removed from calibration. The results also were reviewed by ETS content experts and the CDE. The decision whether to remove items from calibration was made in consultation with the CDE. For the 2018–2019 operational administration of the CSA, no items were excluded from the calibration analyses. For IRT calibration, scored item response data was used to create the IRT analysis input data files for each grade, including responses to items in the regular form and the accommodated form. The IRT analysis input data file was a sparse matrix, because each student completed either the regular form or the accommodated form. Similar to the classical item analyses, “omit” items were treated as incorrect and “not presented” items were treated as blank. 7.4.2.1.2. Description of the Calibration Procedure FlexMIRT (Cai, 2016), a multilevel and multiple-group IRT software package for item analysis and test scoring, was used for CSA item calibration analysis. This software can fit a variety of IRT models to both single-level and multilevel data that are dichotomous, polytomous, or both, and was chosen for its superior flexibility among IRT software programs. The calibration procedure is as follows:
1. Receive test form planners and create the item mapping files 2. Receive data 3. Run complete classical item analysis and create the sparse matrices 4. Create the flexMIRT control files 5. Run flexMIRT and evaluate the results
The procedure described next was followed to calibrate the 2018–2019 student response data using flexMIRT for each grade.
1. Prepare and format the input data files as required by flexMIRT 2. Prepare flexMIRT control files and specify the IRT models and analyses (The 1PL-
IRT model and the corresponding PCM were used.) 3. Evaluate the flexMIRT output to examine whether every execution of flexMIRT
analysis reached satisfactory convergence 4. Review the item parameter estimates:
a. At the form level, the summary statistics for the b-parameter estimates (location difficulty) and d-parameter estimates (step difficulty) were examined, including the mean, SD, median, minimum, maximum, and model-fit. The model-fit was evaluated using the root mean square error of approximation (RMSEA). RMSEA values less than 0.05 indicate good fit while RMSEA values greater than 0.10 indicate poor fit (Browne & Gudeck, 1993). The b-parameters were correlated with the p-values.

Analyses | IRT Analyses
CAASPP CSA Technical Report | 2018–2019 Administration August 2020 Page 80
b. At the item level, statistics of individual items were examined, including item difficulty estimates, model-fit statistics, and the IRT-based item parameters. The b-parameters and the d-parameters should be in the range of -4.0 to +4.0 with a standard error of 0.4 or less.
5. Flag items that did not perform as expected (All flagged items were discussed thoroughly with the CDE to decide whether those items should be removed from calibration or whether the scoring categories needed to be collapsed.)
As a result of consultation with the CDE, no items used during the 2018–2019 CSA operational administration were removed from the analysis and no categories were collapsed. The calibration process was conducted independently by two ETS psychometricians to ensure quality and accuracy of results. Specifically, two psychometricians independently created flexMIRT control files and ran the same input data files and then compared the calibration results. Any differences in the output were investigated. Refer to section 8.6 Quality Control of Psychometric Specifications for more details about this procedure. 7.4.2.2. Linking the Item Parameters from the Accommodated High School
Assessment As mentioned previously, concurrent calibration, including all student responses to the items across the regular and accommodated forms, was conducted for each grade, with the exception of the accommodated high school form. Because few students completed the accommodated high school form, unique items in the accommodated form could not be calibrated successfully. However, those unique items were also administered on the 2018 fall field test regular form and had a sufficient student sample to support calibration. Therefore, the item parameter estimates derived from the calibration of the 2018 fall field test items were linked to the spring 2018 operational item baseline scale. A two-step calibration approach was used to support this linking for the high school accommodated assessment. In the first step, IRT calibration was conducted on the item responses of the students who completed the regular form in the 2018–2019 operational administration, to build an item baseline scale. Additionally, a concurrent calibration was conducted on the item responses of the students who were administered the regular forms in the 2018 fall field test administration7, to link the unique items in the accommodated form to the item baseline scale. In the second step, the item parameter estimates of the regular form obtained from the 2018–2019 operational administration were used to establish the item bank baseline scale. Then, items on the regular form for the 2018–2019 operational administration were used as anchor items to link the unique item parameters of the accommodated form to the item bank baseline scale. The 2018 fall field test item-difficulty estimates were placed on the item bank baseline scale by using the set of linking items (i.e., anchor set) administered in the 2018–2019 operational assessment for high school. The anchor item set was used to calculate the linking constants to place the 2018 fall field test item-difficulty parameters onto the 2018–2019 item bank baseline scale by using the mean-to-mean method described in the next subsection. The linking process was carried
7 There were 682 students who were administered the regular forms in the 2018 fall field test administration; their responses were used for calibration.

Analyses | IRT Analyses
August 2020 CAASPP CSA Technical Report | 2018–2019 Administration Page 81
out iteratively by inspecting differences between the transformed new and reference estimates for the anchor items and by removing the anchor items for which the item difficulty estimates changed significantly; this is called the robust-z procedure. Robust-z is also described in more detail in subsection 7.4.2.2.2 Robust-Z Procedure. 7.4.2.2.1. Mean-to-Mean Transformation Because the item difficulty estimates from the 2018 fall field test calibration may not be comparable to those from the 2018–2019 operational calibration, the 2018 fall field test item difficulty estimates needed to be transformed onto the item baseline scale, to make them comparable to the 2018–2019 operational item-difficulty parameters. The mean-to-mean transformation assumes that the 2018–2019 operational item difficulty values and the 2018 fall field test item difficulty values differ by a constant; that is, the 2018 fall field test item difficulty values can be made comparable to the 2018–2019 operational item difficulty values by adding the same constant for all field test items. If this assumption is correct, then that constant is the difference between the means of the 2018–2019 operational item difficulty values and 2018 fall field test item difficulty values for the anchor items. An iterative procedure is implemented to calculate the linking constants using the 2018–2019 operational items on the regular form. For each iteration of linking constants computation, the procedure described in subsection 7.4.2.2.2 Robust-Z Procedure is intended to inspect the differences between the transformed (2018 fall field test) and the base estimates (2018–2019 operational assessment) for the anchor items and remove anchor items for which the item difficulty estimates changed significantly. There are nine steps involved in making mean-to-mean transformation.
1. Identify the anchor items in both the base (2018–2019 operational) and 2018 fall field test administrations
2. Obtain the item difficulty parameters (b-values) of these anchor items on the item bank scale
3. Obtain the item difficulty parameters (b-values) of these anchor items from the calibration of the 2018 fall field test administration
4. Calculate the average item difficulty for the anchor set 5. Calculate the average item difficulty for the anchor set from the 2018 fall field test
administration calibration 6. Obtain the transformation constant by taking the difference between the two average
item difficulties (b-values), using the average item difficulty for the anchors set on the item baseline scale, and then subtracting the average item difficulty for the anchor set from the calibration of the 2018 fall field test administration to compute the linking constant
7. Obtain a set of adjusted item difficulty parameters (b-values) by applying the linking constant to the item difficulty parameters of the anchor items from the 2018 fall field test administration

Analyses | IRT Analyses
CAASPP CSA Technical Report | 2018–2019 Administration August 2020 Page 82
8. Remove anchor items by following the procedure as described in the subsection 7.4.2.2.2 Robust-Z Procedure (For the first iteration, the anchor set includes all anchor items, while for subsequent iterations, the anchor set includes the remaining anchor items after removing unstable anchors one-by-one.)
9. Repeat steps 1 through 8 until no remaining items have significant differences between the adjusted field test and reference item difficulty parameter values
7.4.2.2.2. Robust-Z Procedure To identify any unstable anchor items, ETS used an outlier detection procedure based on the robust-z statistic (Huynh, 2000; Huynh & Rawls, 2009). In this application, robust-z was calculated based on the distribution of the difficulty difference for the anchor items between the 2018–2019 operational administration and the 2018 fall field test administration for the high school assessment, as described in equation 7.8.
(7.8) Refer to the Alternative Text for Equation 7.8 for a description of this equation.
where,
D is the difference between the base and transformed new item difficulty of an anchor item,
MdD is the median of a distribution of D for all anchor items, and
IQR is the interquartile range of a distribution of D for all anchor items, which is defined as the difference between the third quartile (Q3) and the first quartile (Q1) when all the D values are rank ordered.
A large value of this statistic for any anchor item indicates that the reference item difficulty parameter and the linked 2018 fall field test item difficulty parameter for that item differed substantially. The criterion for removing anchor items is that the robust-z value is greater than 1.645. One anchor item was removed at each iteration. The following criteria were evaluated at each iteration:
• The correlation between the reference item difficulty estimates and 2018 fall field test difficulty estimates for the anchor sets should be no less than .95.
• The ratio of standard deviations (RSD) of the reference item difficulty estimates and 2018 fall field test difficulty estimates for the anchor items should be between .95 and 1.1.
After each iteration, the mean difference of the anchor sets between the base item-difficulty estimates and the 2018 fall field test item difficulty estimates was recomputed based on the remaining anchor items. Once the final anchor item set was obtained, ETS discussed its psychometric characteristics with the CDE and received approval from the CDE. Removed anchor items were not used in the computation of the linking constants but were still included in calibration and for deriving raw-to-theta conversions for the high school assessment.
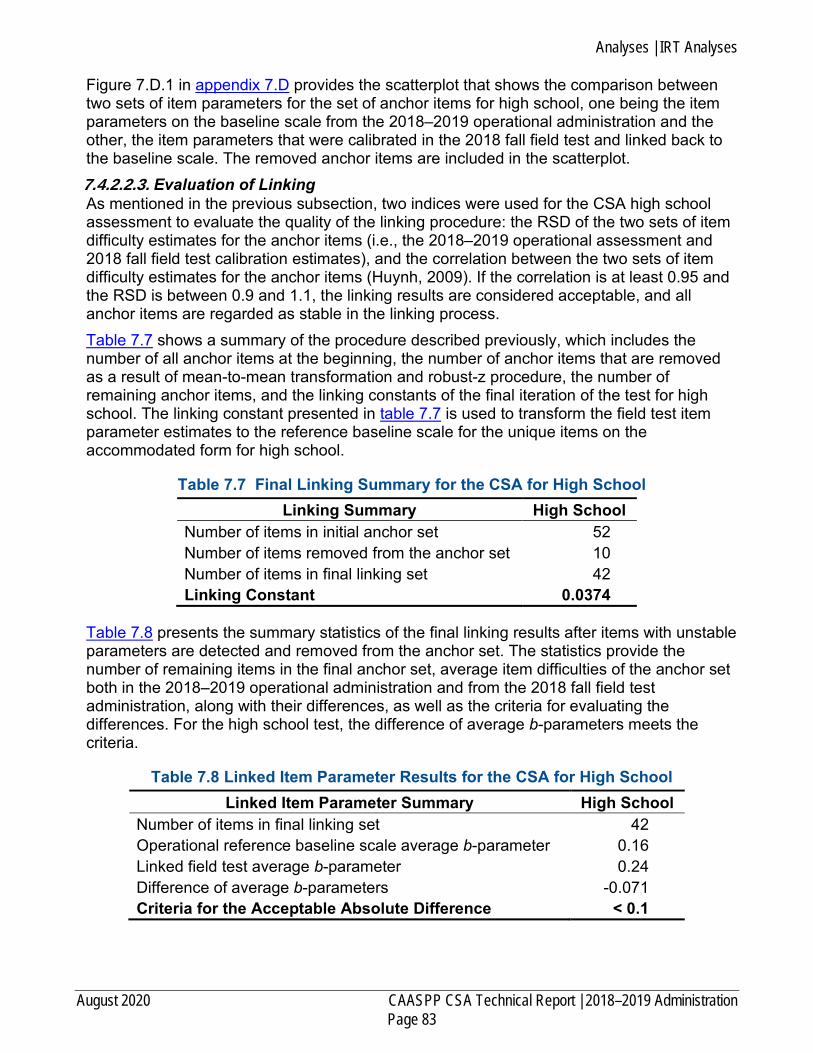
Analyses | IRT Analyses
August 2020 CAASPP CSA Technical Report | 2018–2019 Administration Page 83
Figure 7.D.1 in appendix 7.D provides the scatterplot that shows the comparison between two sets of item parameters for the set of anchor items for high school, one being the item parameters on the baseline scale from the 2018–2019 operational administration and the other, the item parameters that were calibrated in the 2018 fall field test and linked back to the baseline scale. The removed anchor items are included in the scatterplot. 7.4.2.2.3. Evaluation of Linking As mentioned in the previous subsection, two indices were used for the CSA high school assessment to evaluate the quality of the linking procedure: the RSD of the two sets of item difficulty estimates for the anchor items (i.e., the 2018–2019 operational assessment and 2018 fall field test calibration estimates), and the correlation between the two sets of item difficulty estimates for the anchor items (Huynh, 2009). If the correlation is at least 0.95 and the RSD is between 0.9 and 1.1, the linking results are considered acceptable, and all anchor items are regarded as stable in the linking process. Table 7.7 shows a summary of the procedure described previously, which includes the number of all anchor items at the beginning, the number of anchor items that are removed as a result of mean-to-mean transformation and robust-z procedure, the number of remaining anchor items, and the linking constants of the final iteration of the test for high school. The linking constant presented in table 7.7 is used to transform the field test item parameter estimates to the reference baseline scale for the unique items on the accommodated form for high school.
Table 7.7 Final Linking Summary for the CSA for High School Linking Summary High School
Number of items in initial anchor set 52 Number of items removed from the anchor set 10 Number of items in final linking set 42 Linking Constant 0.0374
Table 7.8 presents the summary statistics of the final linking results after items with unstable parameters are detected and removed from the anchor set. The statistics provide the number of remaining items in the final anchor set, average item difficulties of the anchor set both in the 2018–2019 operational administration and from the 2018 fall field test administration, along with their differences, as well as the criteria for evaluating the differences. For the high school test, the difference of average b-parameters meets the criteria.
Table 7.8 Linked Item Parameter Results for the CSA for High School Linked Item Parameter Summary High School
Number of items in final linking set 42 Operational reference baseline scale average b-parameter 0.16 Linked field test average b-parameter 0.24 Difference of average b-parameters -0.071 Criteria for the Acceptable Absolute Difference < 0.1

Analyses | IRT Analyses
CAASPP CSA Technical Report | 2018–2019 Administration August 2020 Page 84
Table 7.9 presents the total number of operational items on the regular form for high school, the number of remaining anchor items after robust-z evaluation, the percentage of remaining anchor items out of all the operational items on the regular form, the correlation between the final set of the transformed (2018 fall field test administration) and the reference (2018–2019 operational administration) difficulty estimates for the anchor items, and the RSD between the final set of the transformed (2018 fall field test administration) and the reference (2018–2019 operational administration) difficulty estimates for the anchor items.
Table 7.9 Evaluation of Anchor Set Between 2018–2019 Operational and 2018 Fall Field Test for High School
Anchor Set Evaluation High
School Number of unique operational items on the regular form 52 Anchor items remaining after deletions 42 Remaining anchor items as percentage of all operational items on the regular form
81%
Correlation between 2018–2019 operational test item difficulty parameters and 2018 fall field test item difficulty parameters
0.9601
RSD of Item Difficulty Parameters Between 2018–2019 Operational and 2018 Fall Field Test
1.0399
7.4.2.3. Scaling the Scores For the CSA 2018–2019 operational administration, the number-correct scores (raw scores) of each form are transformed to scale scores by a two-step process for grades three through eight. First, the item-difficulty estimates for each grade are concurrently calibrated and used as the base scale for the item bank, as described in subsection 7.4.2.1 Item Calibration. Then, the number-correct scores (raw scores) of each form are transformed to ability (theta) scores that will be used to establish the reporting scale by the inverse test characteristic curve (TCC) procedure described in subsection 7.4.2.3.1 Inverse Test Characteristic Curve (TCC) Procedure. Finally, these ability (theta) scores are transformed to scale scores through the linear transformation described in subsection 7.4.2.3.2 Transformation from Theta Scores to Scale Scores. For high school, the item-difficulty estimates for the regular form are calibrated and used as the baseline scale for the item bank. The unique items on the accommodated form are calibrated using the 2018 fall field test data and transformed to the baseline scale for the item bank, as described in subsection 7.4.2.2.1 Mean-to-Mean Transformation. Then, the number-correct scores (raw scores) of each form are transformed to ability (theta) scores by the inverse TCC procedure. The requirements that are particularly applied to the CSA reporting scale are also listed in subsection 7.4.2.3.2 Transformation from Theta Scores to Scale Scores. 7.4.2.3.1. Inverse Test Characteristic Curve (TCC) Procedure After all the item difficulty estimates were calibrated to the reference scale derived from the 2018–2019 operational administration, students’ overall ability estimates were derived from the input data file that was described in subsection 7.4.2.1.1 Data Preparation, through the IRT inverse TCC method (Stocking, 1996). This method transforms the sum of the student’s item scores into an ability estimate. That estimate is the ability value that makes the sum of

Analyses | IRT Analyses
August 2020 CAASPP CSA Technical Report | 2018–2019 Administration Page 85
the expected scores on the items administered to the student equal to the sum of the scores that the student actually received on those items. The TCC expresses the expected total score on a set of items as a function of the student’s ability, which is shown in equation 7.9:
(7.9)
Refer to the Alternative Text for Equation 7.9 for a description of this equation. where,
ndich is the number of dichotomous items in the test, Pi(θ) is the probability of a correct response to item i at ability θ on the dichotomous item in equation 7.7, npoly is the number of polytomous items in the test, m is the number of score categories for each polytomous item, sxj is the value for score category x for the polytomous item j, Pxj(θ) is the probability that an examinee with ability θ obtains score sx on the polytomous item j in equation 7.7, and ξ(θ) is the corresponding expected total score.
7.4.2.3.2. Transformation from Theta Scores to Scale Scores Students’ ability estimates (theta scores) were transformed to the scale score metric by applying a linear transformation based on threshold theta values. Those threshold values were determined after standard setting and approved by the California State Board of Education. Table 5.1 SSPI’s Recommendations for the Proposed Thresholds for Three Levels on the CSA shows the standard setting threshold scores. There are two threshold theta values (for score reporting range 2 and reporting range 3) to define the three score reporting ranges. To set the CSA scale, a common SD across grades is set at 10. Table 7.10 shows the predetermined reporting score range 3 threshold theta scores from the standard setting results and the scale scores. The CSA scale scores were created in equation 7.10:
(7.10)
Refer to the Alternative Text for Equation 7.10 for a description of this equation. where,
SS is the reporting scale score, θ is the theta score corresponding to the student’s total raw score, SSthreshold3 is the predetermined reporting scale score range 3 threshold, σSS is the predetermined SD of the reporting scale score (10 for all grade levels), σθ is the SD of the theta scores calculated based on the regular form of the 2018–2019 operational administration, and
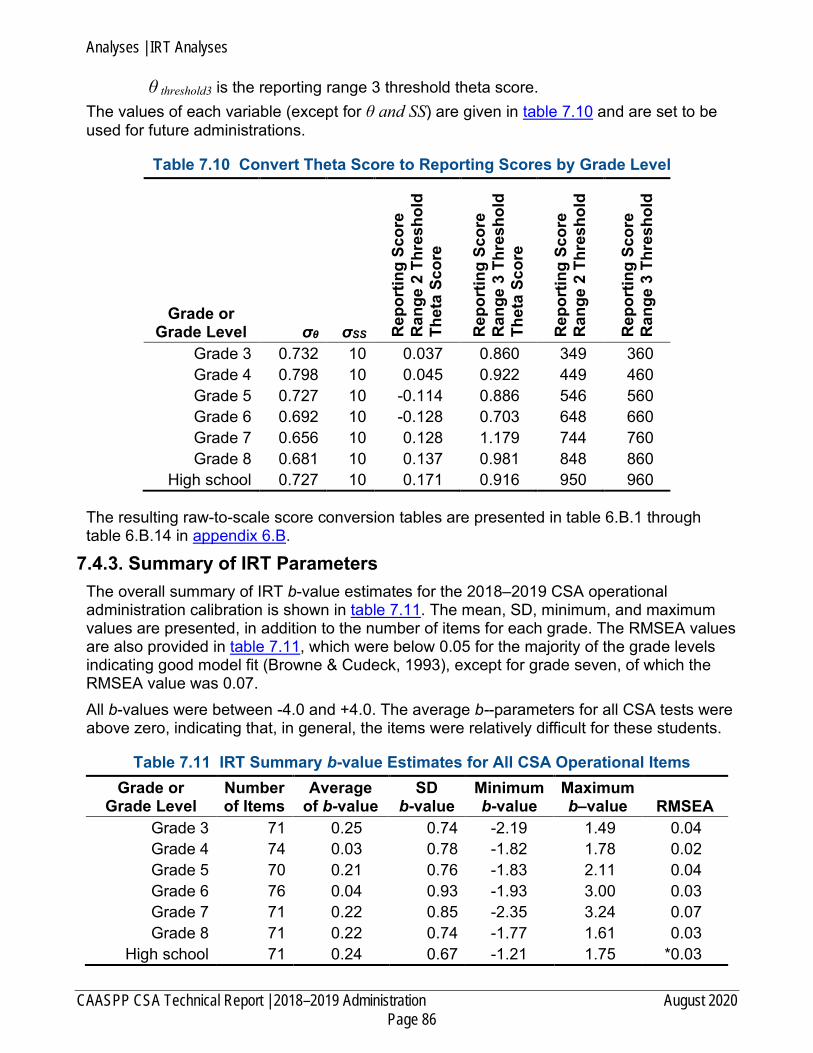
Analyses | IRT Analyses
CAASPP CSA Technical Report | 2018–2019 Administration August 2020 Page 86
θ threshold3 is the reporting range 3 threshold theta score. The values of each variable (except for θ and SS) are given in table 7.10 and are set to be used for future administrations.
Table 7.10 Convert Theta Score to Reporting Scores by Grade Level
Grade or Grade Level σθ σSS R
epor
ting
Scor
e R
ange
2 T
hres
hold
Th
eta
Scor
e
Rep
ortin
g Sc
ore
Ran
ge 3
Thr
esho
ld
Thet
a Sc
ore
Rep
ortin
g Sc
ore
Ran
ge 2
Thr
esho
ld
Rep
ortin
g Sc
ore
Ran
ge 3
Thr
esho
ld
Grade 3 0.732 10 0.037 0.860 349 360 Grade 4 0.798 10 0.045 0.922 449 460 Grade 5 0.727 10 -0.114 0.886 546 560 Grade 6 0.692 10 -0.128 0.703 648 660 Grade 7 0.656 10 0.128 1.179 744 760 Grade 8 0.681 10 0.137 0.981 848 860
High school 0.727 10 0.171 0.916 950 960
The resulting raw-to-scale score conversion tables are presented in table 6.B.1 through table 6.B.14 in appendix 6.B.
7.4.3. Summary of IRT Parameters The overall summary of IRT b-value estimates for the 2018–2019 CSA operational administration calibration is shown in table 7.11. The mean, SD, minimum, and maximum values are presented, in addition to the number of items for each grade. The RMSEA values are also provided in table 7.11, which were below 0.05 for the majority of the grade levels indicating good model fit (Browne & Cudeck, 1993), except for grade seven, of which the RMSEA value was 0.07. All b-values were between -4.0 and +4.0. The average b--parameters for all CSA tests were above zero, indicating that, in general, the items were relatively difficult for these students.
Table 7.11 IRT Summary b-value Estimates for All CSA Operational Items Grade or
Grade Level Number of Items
Average of b-value
SD b-value
Minimum b-value
Maximum b–value RMSEA
Grade 3 71 0.25 0.74 -2.19 1.49 0.04 Grade 4 74 0.03 0.78 -1.82 1.78 0.02 Grade 5 70 0.21 0.76 -1.83 2.11 0.04 Grade 6 76 0.04 0.93 -1.93 3.00 0.03 Grade 7 71 0.22 0.85 -2.35 3.24 0.07 Grade 8 71 0.22 0.74 -1.77 1.61 0.03
High school 71 0.24 0.67 -1.21 1.75 *0.03

Analyses | Response Time Analyses
August 2020 CAASPP CSA Technical Report | 2018–2019 Administration Page 87
* RMSEA for high school regular form calibration
Table 7.C.1 through table 7.C.7 in appendix 7.C present the distributions and summary statistics (mean, SD, minimum and maximum) of the IRT b-values by claim and for all items in each grade. In addition, table 7.C.8 through table 7.C.21 provide the IRT difficulty and step parameter estimates at the item level by form in each grade.
7.5. Response Time Analyses The length of time it takes students to complete an assessment is recorded and analyzed to build a profile describing what a typical testing event looks like for each grade-level assessment. In addition, variability in testing time is investigated to determine whether a student’s testing time should be viewed as unusual or irregular for further investigation. It should be noted that the CSA tests are untimed. In these analyses, all students who completed testing with a valid reporting scale score are included. The testing population is partitioned into performance quartiles based on all operational items. The descriptive statistics—for example, the number of students, mean, SD, minimum and maximum, percentiles—of the time required to complete the total test are computed for each of the four performance quartile groups for each grade level (i.e., grades three through eight and the high school grade levels). Appendix 7.E summarizes results of testing time analysis. Table 7.E.1 through table 7.E.11 provide descriptive statistics of total testing time for the full student population at each ability level for each grade level. The unit of testing time is in minutes; for example, in table 7.E.1, the median (i.e., 50th percentile) of the testing time is 64.66 minutes for the grade three, Q1 group of students who took the regular form. Overall, students at the lowest quartile level (Q1) have shorter testing times than students in the other quartile groups. The median total testing time generally increases as the quartile level increases from the first quartile to the last quartile (Q4), meaning that the students who performed better on the CSA tended to spend more time on the test.
7.6. Reliability Analyses Reliability of the test scores is the consistency of the scores across conditions that can be assumed to differ at random, especially which form of the test the student is administered. There are several different ways of estimating alternate-forms reliability. The type of alternate-forms reliability estimate reported here is an internal-consistency measure, which is derived from analysis of the consistency of the performance of individuals across items within a test. Reliability coefficients range from zero to one. The higher the reliability coefficient for a set of scores, the more likely individuals are to obtain very similar scores upon repeated testing occasions, if the students do not change in their level of the knowledge or skills measured by the test. The standard error of measurement (SEM) quantifies the amount of inconsistency in the test scores. SEM is the extent to which students’ scores tend to differ from the scores they would receive if the assessment were perfectly reliable. The larger the SEM, the more the students’ scores would tend to vary over repeated testing. Observed scores with large SEM pose a challenge to the valid interpretation of a single test score. For the CSA, reliability and SEM estimates were calculated at the test-form level.

Analyses | Reliability Analyses
CAASPP CSA Technical Report | 2018–2019 Administration August 2020 Page 88
Also reported for the CSA is the reliability of classification, which is an estimate of the proportion of students who are accurately and consistently classified into score reporting ranges. There are two kinds of classification reliability statistics: decision accuracy and decision consistency. Decision accuracy is the agreement between the classifications actually made and the classifications that would be made if the test scores were perfectly reliable. Decision consistency is the agreement between the classifications that would be made on two test forms.
7.6.1. Internal Consistency Reliability Coefficient alpha (Cronbach, 1951), which measures internal consistency reliability, is the most commonly used estimate of alternate-forms reliability. Coefficient alpha is estimated by substituting sample estimates for the parameters and is defined as follows:
(7.11)
Refer to the Alternative Text for Equation 7.11 for a description of this equation. where,
K is the number of items in the test, is the observed variance of item i in the test, and is the observed variance of the total test score.
Since CSA forms have mixed item types (dichotomous and polytomous items), it is more appropriate to report stratified alpha (Feldt & Brennan, 1989). Stratified alpha is a weighted average of coefficient alphas for item sets with different maximum score points, or “strata.” It is a reliability estimate computed by dividing the test into parts (strata), computing coefficient alpha separately for each part, and using the results to estimate a reliability coefficient for the total score. The formula for the stratified alpha is
(7.12)
Refer to the Alternative Text for Equation 7.12 for a description of this equation. where,
is the variance for strata j of the test, is the total variance of the test, and is the Cronbach’s alpha for strata j of the test.
Estimates of stratified alpha are computed by substituting sample estimates for the parameters in the formula.
7.6.2. Standard Error of Measurement (SEM) for Raw Scores The SEM provides a measure of score instability in a different metric. The formula for the SEM is
(7.13)

Analyses | Reliability Analyses
August 2020 CAASPP CSA Technical Report | 2018–2019 Administration Page 89
Refer to the Alternative Text for Equation 7.13 for a description of this equation. where,
is the reliability estimated in equation 7.12, and is the SD of the total score.
Table 7.12 gives the reliability and SEM for each CSA form, along with the number of items and students upon which those analyses were performed. These results indicate that the reliability estimates for all test are moderately high. Reliability coefficients for the 2018–2019 operational CSA ranged from 0.81 to 0.86 for the regular forms and from 0.70 to 0.82 for the accommodated forms. The number of items in table 7.12 is based on each form, whereas the number of items in table 7.11 includes all operational items per grade. The reliability coefficients for the regular forms are above 0.80, which is acceptable for standardized assessments. The relatively low reliability coefficients for the accommodated forms are associated with the small number of students and lower variance. Most of the students who took the accommodated forms had a visual impairment, which might explain the homogeneity associated with CSA scores on the accommodated forms. Results based on samples that contain 50 or fewer examinees should be interpreted with caution due to small sample sizes.
Table 7.12 Test Reliability of the Total Scores
Grade or Grade Level Form N
Item
s
N P
oint
s
N S
tude
nts
Mean SD Rel
iabi
lity
SEM Grade 3 1 52 63 8,895 29.73 9.16 0.85 3.56 Grade 3 A 52 60 348 21.78 7.37 0.79 3.40 Grade 4 1 52 64 7,781 32.54 9.46 0.86 3.52 Grade 4 A 52 61 392 25.53 8.16 0.82 3.43 Grade 5 1 52 62 6,477 28.54 8.87 0.84 3.59 Grade 5 A 52 63 391 26.66 7.46 0.78 3.47 Grade 6 1 52 65 4,581 33.76 8.81 0.83 3.61 Grade 6 A 52 64 211 28.82 7.36 0.77 3.54 Grade 7 1 52 65 3,263 30.34 8.40 0.81 3.66 Grade 7 A 52 63 137 25.51 6.27 0.70 3.45 Grade 8 1 52 66 2,589 33.05 8.71 0.82 3.65 Grade 8 A 52 58 83 20.16 6.20 0.70 3.40
High school 1 52 64 3,907 30.55 8.49 0.81 3.67 High school A 52 62 15 24.53 6.76 0.73 3.49
7.6.3. Student Group Reliabilities and SEMs CSA reliabilities were examined for various student groups that tested. The student groups included in these analyses were defined by their gender, economic status, provision of special services, length of attendance in U.S. schools, whether they received instruction in
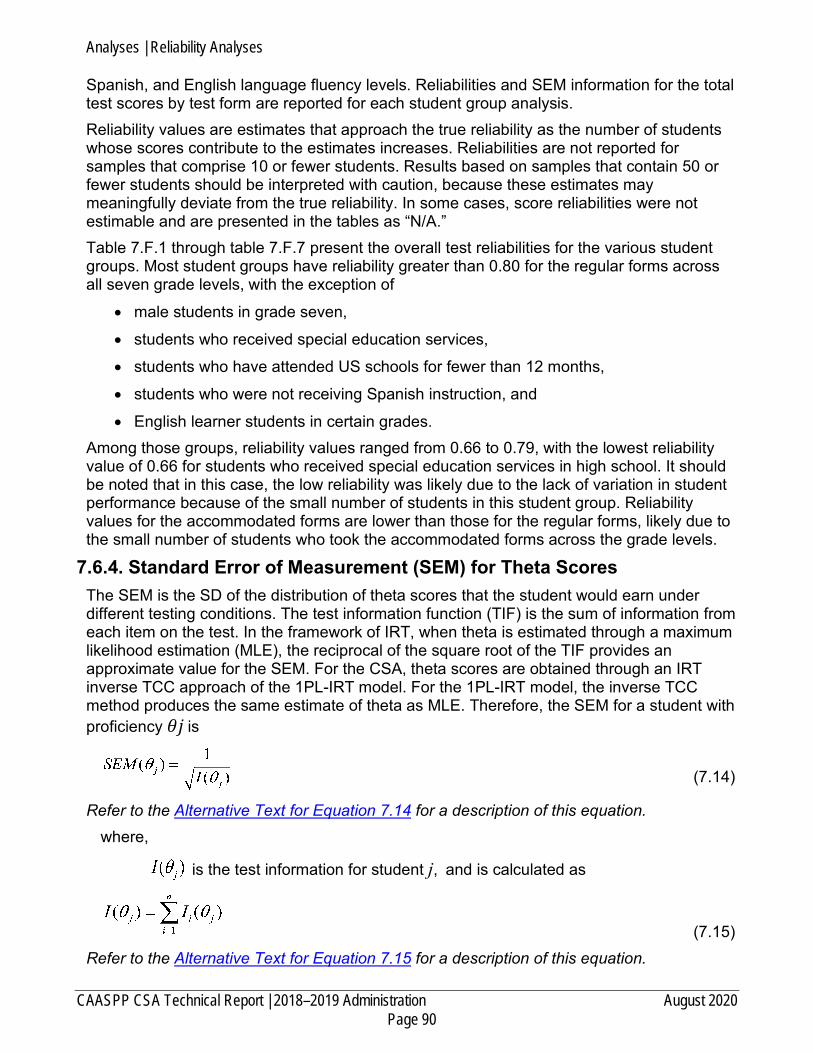
Analyses | Reliability Analyses
CAASPP CSA Technical Report | 2018–2019 Administration August 2020 Page 90
Spanish, and English language fluency levels. Reliabilities and SEM information for the total test scores by test form are reported for each student group analysis. Reliability values are estimates that approach the true reliability as the number of students whose scores contribute to the estimates increases. Reliabilities are not reported for samples that comprise 10 or fewer students. Results based on samples that contain 50 or fewer students should be interpreted with caution, because these estimates may meaningfully deviate from the true reliability. In some cases, score reliabilities were not estimable and are presented in the tables as “N/A.” Table 7.F.1 through table 7.F.7 present the overall test reliabilities for the various student groups. Most student groups have reliability greater than 0.80 for the regular forms across all seven grade levels, with the exception of
• male students in grade seven,
• students who received special education services,
• students who have attended US schools for fewer than 12 months,
• students who were not receiving Spanish instruction, and
• English learner students in certain grades. Among those groups, reliability values ranged from 0.66 to 0.79, with the lowest reliability value of 0.66 for students who received special education services in high school. It should be noted that in this case, the low reliability was likely due to the lack of variation in student performance because of the small number of students in this student group. Reliability values for the accommodated forms are lower than those for the regular forms, likely due to the small number of students who took the accommodated forms across the grade levels.
7.6.4. Standard Error of Measurement (SEM) for Theta Scores The SEM is the SD of the distribution of theta scores that the student would earn under different testing conditions. The test information function (TIF) is the sum of information from each item on the test. In the framework of IRT, when theta is estimated through a maximum likelihood estimation (MLE), the reciprocal of the square root of the TIF provides an approximate value for the SEM. For the CSA, theta scores are obtained through an IRT inverse TCC approach of the 1PL-IRT model. For the 1PL-IRT model, the inverse TCC method produces the same estimate of theta as MLE. Therefore, the SEM for a student with proficiency 𝜃𝑗 is
(7.14)
Refer to the Alternative Text for Equation 7.14 for a description of this equation. where,
is the test information for student j, and is calculated as
(7.15) Refer to the Alternative Text for Equation 7.15 for a description of this equation.
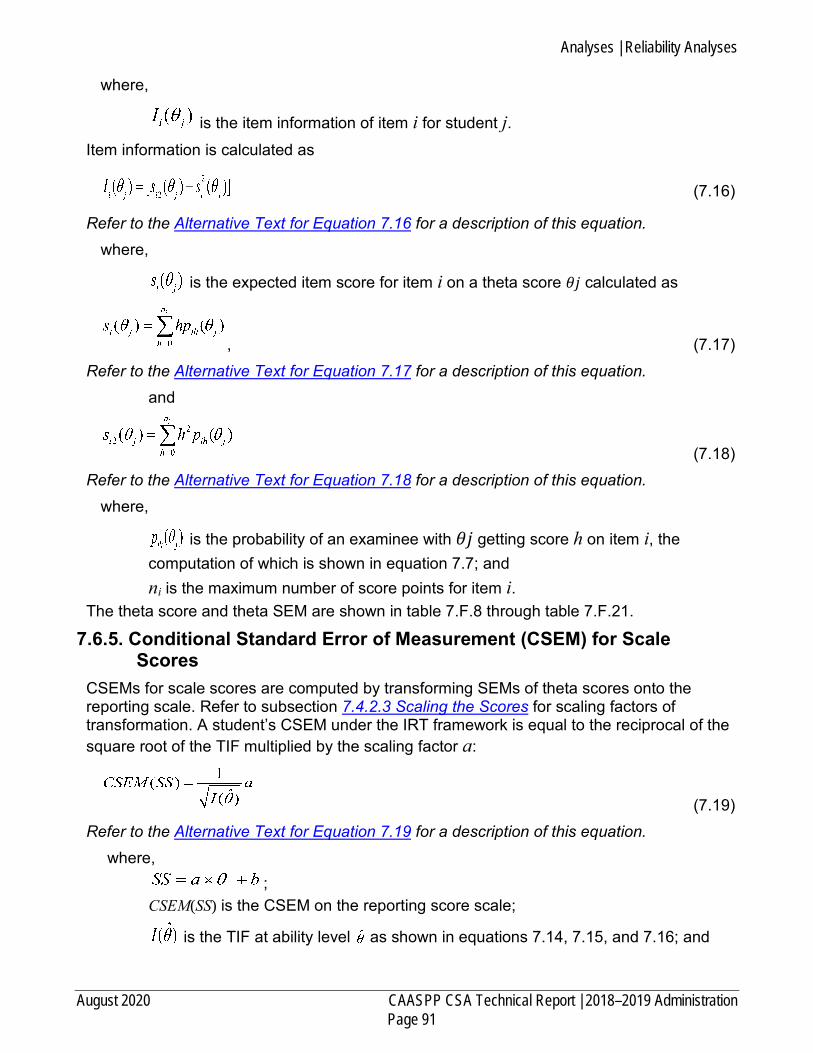
Analyses | Reliability Analyses
August 2020 CAASPP CSA Technical Report | 2018–2019 Administration Page 91
where,
is the item information of item i for student j. Item information is calculated as
(7.16)
Refer to the Alternative Text for Equation 7.16 for a description of this equation. where,
is the expected item score for item i on a theta score 𝜃𝑗 calculated as
, (7.17) Refer to the Alternative Text for Equation 7.17 for a description of this equation.
and
(7.18) Refer to the Alternative Text for Equation 7.18 for a description of this equation.
where,
is the probability of an examinee with 𝜃𝑗 getting score h on item i, the computation of which is shown in equation 7.7; and ni is the maximum number of score points for item i.
The theta score and theta SEM are shown in table 7.F.8 through table 7.F.21.
7.6.5. Conditional Standard Error of Measurement (CSEM) for Scale Scores
CSEMs for scale scores are computed by transforming SEMs of theta scores onto the reporting scale. Refer to subsection 7.4.2.3 Scaling the Scores for scaling factors of transformation. A student’s CSEM under the IRT framework is equal to the reciprocal of the square root of the TIF multiplied by the scaling factor a:
(7.19) Refer to the Alternative Text for Equation 7.19 for a description of this equation.
where, ;
CSEM(SS) is the CSEM on the reporting score scale;
is the TIF at ability level as shown in equations 7.14, 7.15, and 7.16; and

Analyses | Reliability Analyses
CAASPP CSA Technical Report | 2018–2019 Administration August 2020 Page 92
a is the scaling factor (the slope) needed to transform theta to the scale score metric.
The value of a varies by grade level (refer to the slope values calculated in equation 7.10). CSEMs vary across the scale and are typically smaller in scale score units toward the center of the scale where more items are located, whereas larger at the extreme ends of the scale. When a test has threshold scores, it is important to provide CSEMs at the threshold scores. Table 7.13 presents the scale score CSEMs at the lowest score required for a student to be classified in the score reporting range 2 and score reporting range 3 for each CSA.
Table 7.13 Scale Score CSEM at Score Reporting Range Threshold
Grade or Grade Level R
epor
ting
Scor
e R
ange
2 T
hres
hold
Ran
ge 2
CSE
M
Rep
ortin
g Sc
ore
Ran
ge 3
Thr
esho
ld
Ran
ge 3
CSE
M
Grade 3 349 4 360 4 Grade 4 449 3 460 4 Grade 5 546 4 560 4 Grade 6 648 4 660 4 Grade 7 744 4 760 4 Grade 8 848 4 860 4
High school 950 4 960 4
The scale score and scale score CSEM are shown in table 7.F.8 through table 7.F.21.
7.6.6. Decision Classification Analyses Decision accuracy describes the extent to which students are classified in the same way as they would be on the basis of the average of all possible forms of a test. Decision accuracy answers the following question: How does the actual classification of students, based on their single-form scores, agree with the classification that would be made on the basis of their true scores, if their true scores were somehow known? The RELCLASS-COMP program estimates decision accuracy by using an estimated bivariate distribution of reported classifications on the current form of the exam and the classifications based on an all-forms average (true score). Decision consistency describes the extent to which students are classified in the same way as they would be on the basis of a single form of a test other than the one for which data is available. Decision consistency answers the following question: What is the agreement between the classifications based on two nonoverlapping, equally difficult forms of the test? The methodology used for estimating the reliability of classification decisions is described in Livingston and Lewis (1995) and is implemented using the ETS-proprietary computer program RELCLASS-COMP (Version 4.14). RELCLASS-COMP also estimates decision

Analyses | Reliability Analyses
August 2020 CAASPP CSA Technical Report | 2018–2019 Administration Page 93
consistency by using an estimated bivariate distribution of reported classifications on the current form of the test and classifications on a hypothetical alternate form using the reliability of the test and strong true-score theory. Decision consistency values are always lower than the corresponding decision accuracy values because in decision consistency, both of the classifications of the student are based on scores that depend on which form of the test the student took. In decision accuracy, only one of the classifications is based on a score that can vary in this way. In each case, the proportion of classifications with exact agreement is the sum of the entries in the diagonal of the contingency table representing the bivariate distribution. Reliability of classification at a threshold score is estimated by combining the score reporting ranges above a particular threshold score and combining the score reporting ranges below that threshold. The result is a two-by-two table indicating whether the students reach the threshold score or not. The sum of the entries in the main diagonal is the number of students accurately (or consistently) classified as not reaching versus reaching the threshold score. Table 7.14 and table 7.15 illustrate these 2 × 2 contingency tables.
Table 7.14 Decision Accuracy for Reaching a Score Reporting Range Threshold
Status on the Form Taken
True Status on All Forms Average: Does Not Reach a Reporting Range Threshold
True Status on All Forms Average: Reaches a
Reporting Range Threshold Does not reach a reporting range threshold
Correct classification Misclassification
Reaches a reporting range threshold
Misclassification Correct classification
Table 7.15 Decision Consistency for Reaching a Score Reporting Range Threshold
Status on the Form Taken
Decision Made on a Single Form: Does Not Reach a
Reporting Range Threshold
Decision Made on a Single Form: Reaches a Reporting
Range Threshold Does not reach a reporting range threshold
Correct classification Misclassification
Reaches a reporting range threshold
Misclassification Correct classification
The results of these analyses are presented in table 7.F.22 through table 7.F.35 in appendix 7.F. Each table includes the contingency tables for both accuracy and consistency of the various reporting range classifications. The proportion of students being accurately classified is determined by summing across the diagonals of the upper tables. The proportion of consistently classified students is determined by summing the diagonals of the lower tables. The overall decision accuracy is greater than 0.75 for all seven tests, with the highest accuracy of 0.84 occurring for grade seven and the lowest level of accuracy of 0.78 occurring in grade five. The overall decision consistency is relatively lower, with the lowest consistency of 0.69 occurring for grade five and the highest consistency of 0.77 occurring in grade seven.

Analyses | Validity Evidence
CAASPP CSA Technical Report | 2018–2019 Administration August 2020 Page 94
7.7. Validity Evidence Validity refers to the degree to which each interpretation or use of a test score is supported by the accumulated evidence (American Educational Research Association [AERA], American Psychological Association [APA], & National Council on Measurement in Education [NCME], 2014; ETS, 2014). It constitutes the central notion underlying the development, administration, and scoring of tests, and the uses and interpretations of test scores. The validation process does not rely on a single study or gathering only one type of evidence. Rather, validation involves multiple investigations and different kinds of supporting evidence (AERA, APA, & NCME, 2014; Cronbach, 1971; ETS, 2014; Kane, 2006). It begins with the test design and is implicit throughout the entire assessment process, which includes item development and field testing, analyses of items, test scaling and linking, scoring, reporting, and score usage. In this section, the evidence gathered is presented to support the intended uses and interpretations of scores for the CSA. This section is organized primarily around the principles prescribed by AERA, APA, and NCME’s Standards for Educational and Psychological Testing (2014). These Standards require a clear definition of the purpose of the test, a description of the constructs to be assessed, and the population to be assessed, as well as how the scores are to be interpreted and used. The Standards identify five kinds of evidence that can provide support for score interpretations and uses:
1. Evidence based on test content 2. Evidence based on relations to other variables 3. Evidence based on response processes 4. Evidence based on internal structure 5. Evidence based on the consequences of testing
The next subsection defines the purpose of the CSA, followed by a description and discussion of different kinds of validity evidence that have been gathered.
7.7.1. Evidence in the design of the CSA 7.7.1.1. Purpose The CSA is designed to measure a student’s Spanish skills in reading, writing mechanics, and listening for the purposes of
• providing student-level data in Spanish competency,
• providing aggregate data that may be used for evaluating the implementation of Spanish language arts programs at the local level, and
• providing a high school measure suitable to be used, in part, for the California State Seal of Biliteracy.
The assessment provides students an annual opportunity to measure their reading/language arts competency in Spanish. 7.7.1.2. The Constructs to Be Measured As a voluntary assessment to measure a student’s Spanish skills in reading, writing mechanics, and listening, the CSA is designed to show how well students perform relative to the Spanish version of Common Core English language arts/literacy standards (i.e., California Common Core State Standards en Español [CCCSSeE]), which was developed
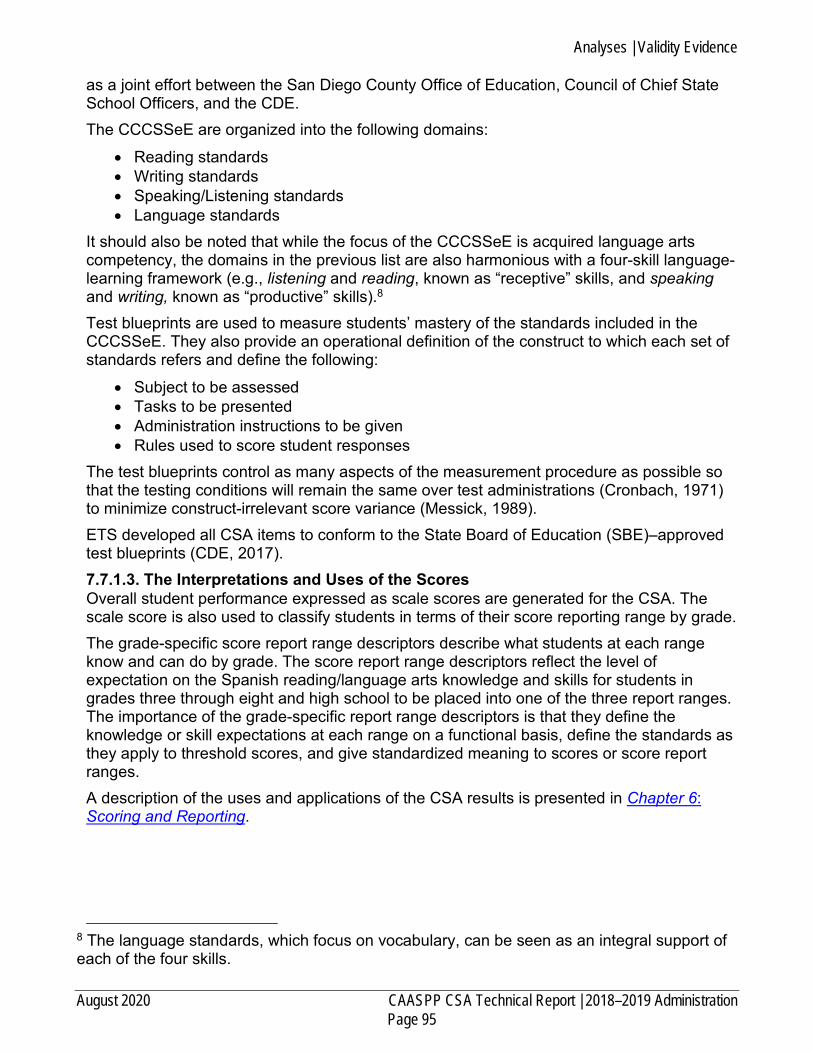
Analyses | Validity Evidence
August 2020 CAASPP CSA Technical Report | 2018–2019 Administration Page 95
as a joint effort between the San Diego County Office of Education, Council of Chief State School Officers, and the CDE. The CCCSSeE are organized into the following domains:
• Reading standards • Writing standards • Speaking/Listening standards • Language standards
It should also be noted that while the focus of the CCCSSeE is acquired language arts competency, the domains in the previous list are also harmonious with a four-skill language-learning framework (e.g., listening and reading, known as “receptive” skills, and speaking and writing, known as “productive” skills).8 Test blueprints are used to measure students’ mastery of the standards included in the CCCSSeE. They also provide an operational definition of the construct to which each set of standards refers and define the following:
• Subject to be assessed • Tasks to be presented • Administration instructions to be given • Rules used to score student responses
The test blueprints control as many aspects of the measurement procedure as possible so that the testing conditions will remain the same over test administrations (Cronbach, 1971) to minimize construct-irrelevant score variance (Messick, 1989). ETS developed all CSA items to conform to the State Board of Education (SBE)–approved test blueprints (CDE, 2017). 7.7.1.3. The Interpretations and Uses of the Scores Overall student performance expressed as scale scores are generated for the CSA. The scale score is also used to classify students in terms of their score reporting range by grade. The grade-specific score report range descriptors describe what students at each range know and can do by grade. The score report range descriptors reflect the level of expectation on the Spanish reading/language arts knowledge and skills for students in grades three through eight and high school to be placed into one of the three report ranges. The importance of the grade-specific report range descriptors is that they define the knowledge or skill expectations at each range on a functional basis, define the standards as they apply to threshold scores, and give standardized meaning to scores or score report ranges. A description of the uses and applications of the CSA results is presented in Chapter 6: Scoring and Reporting.
8 The language standards, which focus on vocabulary, can be seen as an integral support of each of the four skills.

Analyses | Validity Evidence
CAASPP CSA Technical Report | 2018–2019 Administration August 2020 Page 96
The CSA results have four primary purposes: 1. Help facilitate conversations between parents/guardians and teachers about student
performance 2. Serve as a tool to help parents/guardians and teachers work together to improve
student learning 3. Help schools and local educational agencies identify strengths and areas that need
improvement in their educational programs 4. Provide the public and policymakers with information about student achievement.
7.7.1.4. Intended Test Population The intended test population for the CSA consists of students receiving instruction in Spanish in California and students seeking a measure that recognizes their Spanish-specific academic reading, writing mechanics, and listening skills. It is critical to recognize the diverse characteristics of the test population for the CSA and the context in which the test purpose and use are situated.
7.7.2. Evidence Based on Test Content Evidence based on test content refers to traditional forms of content validity evidence, such as the rating of test specifications and test items (Crocker, Miller, & Franks, 1989; Sireci, 1998), as well as alignment methods for educational tests that evaluate the interactions between curriculum frameworks, testing, and instruction (Rothman, Slattery, Vranek, & Resnick, 2002; Bhola, Impara & Buckendahl, 2003; Martone & Sireci, 2009). 7.7.2.1. Description of the State Standards The CSA is aligned with the CCCSSeE. The purpose of the CCCSSeE is to guide instruction in a multitude of contexts, including in-class, collaborative activities. The focuses of the CCCSSeE are acquired language arts competency and the necessary knowledge and skills needed to reach the standards in each grade. 7.7.2.2. Item Specification Item specifications describe the characteristics of items that are written to measure each content standard. ETS maintains item specification for each grade-level CSA. The specifications for the CSA are described in Chapter 3: Item Development and Test Assembly. 7.7.2.3. Assessment Blueprints The CSA blueprints describe each of the Spanish language arts domains including reading, writing mechanics, and listening for all grades tested and how that content domain is assessed through the testable standards (CDE, 2017). Each test is described by a single blueprint. The degree to which test forms administered in 2018–2019 meet the blueprint is provided in Chapter 3: Item Development and Test Assembly and in appendix 3.A. 7.7.2.4. Form Assembly Process Once items are developed and field-tested, ETS selects all CSA items to conform to the SBE-approved CSA content standards and test blueprints. The content standards, blueprints, and test specifications were used as the basis for choosing items for the CSA. Refer to Chapter 3: Item Development and Test Assembly for information on the test assembly process.

Analyses | Validity Evidence
August 2020 CAASPP CSA Technical Report | 2018–2019 Administration Page 97
7.7.3. Evidence Based on Response Processes Validity evidence based on response processes refers to “evidence concerning the fit between the construct and the detailed nature of performance or response actually engaged in by students” (AERA et al., 2014, p. 12). This type of evidence generally includes documentation of activities such as
• systematic observations of test response behavior,
• analysis of student item-response-time data, and
• evaluation of the reasoning processes students employ when solving test items (Embretson, 1983; Messick, 1989).
This type of evidence is used to confirm that the CSA assessments are measuring the cognitive skills that are intended as the objects of measurement, and that students are using these targeted skills to respond to the items. 7.7.3.1. Analysis of Testing Time Testing time for each administration can be evaluated for consistency by examining the expected response processes for the items presented to students. The length of time it takes students to complete an assessment is collected and analyzed to build a profile describing what a typical testing event looks like for each content area and grade. In addition, variability in testing time is investigated to determine whether a student’s testing time should be viewed as unusual or irregular. It should be noted that the CSA grade-level assessments are untimed. Students with no item response and those who did not answer at least 10 items were removed from these analyses. The remaining testing population is partitioned into quartiles based on scale scores. These quartile groupings are not the same as the reporting levels. Descriptive statistics of the time required to complete the total test are computed for each of the four quartile groups by grade level. Some cases of extremely long testing time may be attributed to the test’s not being closed down properly. Results should be interpreted with caution. The medians (50th percentile) are more meaningful in the interpretation of the time comparisons because medians are less impacted by extreme values than means. Table 7.E.1 through table 7.E.11 in appendix 7.E present total testing time and percentile information at each student performance quartile level by grade level. The unit of testing time is minutes; for example, in table 7.E.1, the median (i.e., 50th percentile) of the testing time is 64.66 minutes for grade three Q1 group of the students who took the regular form. Overall, students at the lowest quartile level (Q1) have shorter testing times than students in the other quartile groups. The median total testing time generally increases as the quartile level increases from Q1 to Q4. That is, students who performed better on the CSA tended to spend more time on the test. For example, for grade three, the median testing time for students in the Q1 group was 64.66 minutes, while the median testing time for students in the Q4 group was 92.64 minutes.

Analyses | Validity Evidence
CAASPP CSA Technical Report | 2018–2019 Administration August 2020 Page 98
7.7.4. Evidence Based on Internal Structure Internal structure evidence evaluates the strength or salience of the major dimensions underlying an assessment. For the CSA, it is assumed that a single construct underlies the total scores obtained on each assessment. Evidence to support this assumption can be gathered from the results of item analyses, DIF analysis, evaluations of internal consistency, and studies of reliability. 7.7.4.1. Classical Statistics Polyserial correlations calculated for the items in an assessment show the degree to which the items discriminate between students with low and high scores on an assessment. To the degree that the correlations are high, evidence that the items assess the same construct is provided. As shown in table 7.3, the mean polyserial correlation was between 0.35 and 0.42. The polyserial correlations for the individual items in the CSA are presented in table 7.A.3 through table 7.A.16. Also relevant to the validity of a score interpretation are the ranges of item difficulty for the items on which a test score will be based. The finding—that items have difficulties that span the range of student ability—provides evidence that students at all levels of ability are adequately measured by the items. Information on average item p-values is given in table 7.2; the data in table 7.2 indicates that these assessments had average p-values ranging from 0.42 to 0.48. Individual item p-values are also presented, in table 7.A.3 through table 7.A.16. 7.7.4.2. Differential Item Functioning (DIF) DIF analyses were conducted to assess differences in the item performance of groups of students who differ in their demographic characteristics. For the CSA, none of the items were identified as having significant levels of DIF. Refer to section 7.3 Differential Item Functioning (DIF) Analyses for a description of the DIF analyses and appendix 7.B, where the results of the DIF analyses are reported. 7.7.4.3. Overall Reliability Estimates The results of reliability analyses on the overall raw score for each CSA form are presented in table 7.12. The results indicate that the reliability estimates for all tests are moderately high, ranging from 0.810 to 0.862 for the regular forms and 0.698 to 0.823 for the accommodated forms. 7.7.4.4. Student Groups Reliability Estimates The reliabilities are also examined for various student groups. The student groups considered are gender, economic status, provision of special services, length of attendance in U.S. schools, whether they received instruction in Spanish, and English language fluency levels. Across student groups, reliability coefficients are higher than 0.80, except for the accommodated forms. The reliability was lower due to a lack of variations in performance caused by small group size and homogenous group members. Refer to 7.6.3 Student Group Reliabilities and SEMs for the details. Reliability estimates and SEM information for the total test scores by test-form are reported for each student group in table 7.F.1 through table 7.F.7 in appendix 7.F. 7.7.4.5. Reliability of Performance Classifications The methodology used for estimating the reliability of classification decisions is described with the decision classification analyses in subsection 7.6.6 Decision Classification Analyses. The overall decision accuracy is greater than 0.75 for all seven assessments. The

Analyses | Validity Evidence
August 2020 CAASPP CSA Technical Report | 2018–2019 Administration Page 99
overall decision consistency is relatively lower, with the lowest being 0.69, for grade five. The results of these analyses are presented in table 7.F.22 through table 7.F.35 in appendix 7.F.
7.7.5. Evidence Based on Relations to Other Variables Evidence based on relations to other variables can be evaluated using the correlation between the CSA results and variables related to students, as well as the correlation between the CSA scores and the other CAASPP assessment scores. Most students in grades three through eight and grade eleven who take the CSA also take the CAASPP Smarter Balanced English language arts/literacy (ELA) assessment. The Smarter Balanced for ELA is based on the Common Core State Standards (CCSS) for ELA. This computer-based assessment is for all students in grades three through eight and grade eleven. Given that these two assessments are both measures of a student’s reading/language arts skills and are aligned with similar standards (the CCCSSeE is a translated and linguistically augmented version of the CCSS for ELA), the results of the correlation between the CSA scores and CAASPP Smarter Balanced for ELA scores are essential for supporting the validity of certain inferences based on CSA scores. During the 2018–2019 CSA operational administration, the correlations between CSA scale scores and CAASPP Smarter Balanced for ELA scale scores ranged from 0.60 to 0.65 for grades three through eight and 0.43 for high school. The high school sample included only grade eleven students—the only commonly assessed grade in high school—and was much smaller, with only 963 students. The lower correlation in high school appears to contribute to the limited amount of variability of scores in the sample. Overall, the moderate correlation indicates an appropriate level of association between the Smarter Balanced for ELA and the Spanish reading language arts assessment, since these two assessments are measuring common aspects of language arts. However, these two assessments also measure language and literacy skills that are specific to each language.
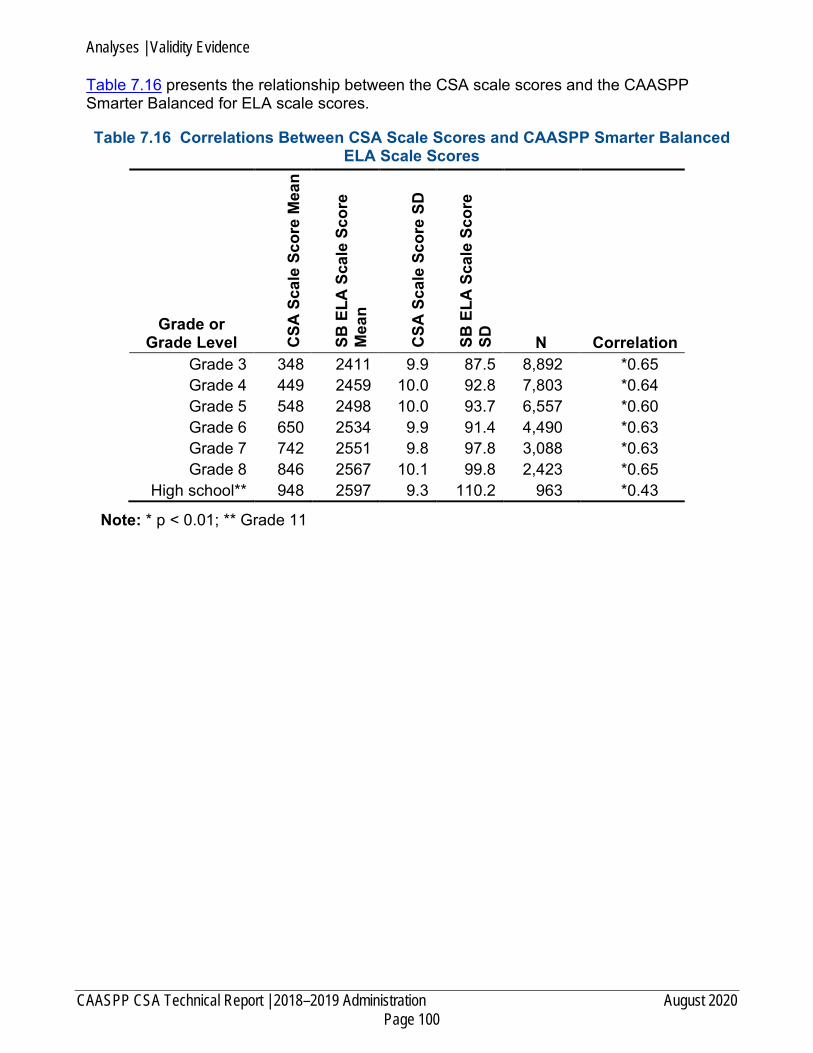
Analyses | Validity Evidence
CAASPP CSA Technical Report | 2018–2019 Administration August 2020 Page 100
Table 7.16 presents the relationship between the CSA scale scores and the CAASPP Smarter Balanced for ELA scale scores.
Table 7.16 Correlations Between CSA Scale Scores and CAASPP Smarter Balanced ELA Scale Scores
Grade or Grade Level C
SA S
cale
Sco
re M
ean
SB E
LA S
cale
Sco
re
Mea
n
CSA
Sca
le S
core
SD
SB E
LA S
cale
Sco
re
SD
N Correlation Grade 3 348 2411 9.9 87.5 8,892 *0.65 Grade 4 449 2459 10.0 92.8 7,803 *0.64 Grade 5 548 2498 10.0 93.7 6,557 *0.60 Grade 6 650 2534 9.9 91.4 4,490 *0.63 Grade 7 742 2551 9.8 97.8 3,088 *0.63 Grade 8 846 2567 10.1 99.8 2,423 *0.65
High school** 948 2597 9.3 110.2 963 *0.43
Note: * p < 0.01; ** Grade 11
Analyses | References
August 2020 CAASPP CSA Technical Report | 2018–2019 Administration Page 101
References American Educational Research Association, American Psychological Association, &
National Council on Measurement in Education. (2014). Standards for educational and psychological testing. Washington, DC: American Educational Research Association.
Bhola, D. S., Impara, J. C., & Buckendahl, C. W. (2003). Aligning tests with states’ content standards: Methods and issues. Educational Measurement: Issues and Practice, 22, 21–29.
Browne, M. W., & Cudek, R. (1993). Alternative ways of assessing model fit. In K. Bollen & J.S. Long (Eds.) Testing structural equation models (pp. 136–62). Newbury Park, CA: Sage Publications.
Cai, L. (2016). FlexMIRT®: Flexible multilevel, multidimensional item analysis and test scoring (Version 3.5) [computer software]. Chapel Hill, NC: Vector Psychometric Group.
California Department of Education. (2017). California Spanish Assessment blueprint. Sacramento, CA: California Department of Education. Retrieved from https://www.cde.ca.gov/be/ag/ag/yr17/documents/nov17item07a3.pdf
Crocker, L. M., Miller, D., & Franks, E. A. (1989). Quantitative methods for assessing the fit between test and curriculum. Applied Measurement in Education, 2, 179–94.
Cronbach, L. J. (1951). Coefficient alpha and the internal structure of tests. Psychometrika, 16(3), 297–334.
Cronbach, L. J. (1971). Test validation. In R. L. Thorndike (Ed.), Educational measurement (2nd ed.). Washington, DC: American Council on Education.
Dorans, N. J. (2013). ETS contributions to the quantitative assessment of item, test, and score fairness. ETS Research Report Series, i–38.
Dorans, N. J., & Holland, P. W. (1993). DIF detection and description: Mantel-Haenszel and standardization. In P. W. Holland & H. Wainer (Eds.), Differential item functioning (pp. 35–66). Hillsdale, NJ: Lawrence Erlbaum Associates, Inc.
Dorans, N. J., & Schmitt, A. P. (1993). Constructed response and differential item functioning: A pragmatic approach. In R. E. Bennett & W. C. Ward (Eds.), Construction versus choice in cognitive measurement (pp. 135–65). Hillsdale, NH: Lawrence Erlbaum Associates, Inc.
Drasgow F. (1988). Polychoric and polyserial correlations. In L. Kotz & N. L. Johnson (Eds.), Encyclopedia of statistical sciences (Vol. 7, pp. 69–74). New York: Wiley.
Educational Testing Service. (2014). ETS standards for quality and fairness. Princeton, NJ: Educational Testing Service.
Embretson (Whitley), S. (1983). Construct validity: construct representation versus nomothetic span. Psychological Bulletin, 93, 179–97.
Feldt, L. S., & Brennan, R. (1989). Reliability. In R. L. Linn (Ed.), Educational measurement (3rd ed., pp. 105–46). New York: Macmillan.
Analyses | References
CAASPP CSA Technical Report | 2018–2019 Administration August 2020 Page 102
Hambleton, R. K., Swaminathan, H., & Rogers, H. J. (1991). Fundamentals of item response theory. Newbury Park, CA: Sage Publications.
Hanson, B. A., & Béguin, A. A. (2002). Obtaining a common scale for item response theory item parameters using separate versus concurrent estimation in the common item equating design. Applied Psychological Measurement, 26, 3–24.
Holland, P. W., & Thayer, D. T. (1988). An alternate definition of the ETS delta scale of stem difficulty (Research Report 85–43). Princeton, NJ: Educational Testing Service. Retrieved from https://onlinelibrary.wiley.com/doi/epdf/10.1002/j.2330-8516.1985.tb00128.x
Huynh, H (2000, June). Guidelines for Rasch Linking for PACT. Memorandum to Paul Sandifer on June 18, 2000. Columbia, SC: Available from Author.
Huynh, H, & Rawls. A. (2009). A comparison between robust z and 0.3-logit difference procedures in assessing stability of linking items for the Rasch model. In Everett V. Smith Jr. & Greg E. Stone (Eds.) Applications of Rasch Measurement in Criterion-Reference Testing: Practice analysis to Score Reporting. Maple Grove, MN: JAM Press.
Kane, M. (2006). Validation. In R. L. Brennan (Ed.), Educational measurement (4th ed., pp. 17–64). Washington, DC: American Council on Education and Praeger.
Kim, S. H., & Cohen, A. S. (1998). A comparison of linking and concurrent calibration under item response theory. Applied Psychological Measurement, 22, 131–143.
Livingston, S. A., & Lewis, C. (1995). Estimating the consistency and accuracy of classification based on test scores. Journal of Educational Measurement, 32, 179–97.
Mantel, N. (1963). Chi-square tests with one degree of freedom: Extensions of the Mantel-Haenszel procedure. Journal of the American Statistical Association, 58, 690–700.
Mantel, N. & Haenszel, W. (1959). Statistical aspects of the analyses of data from retrospective studies of disease. Journal of the National Cancer Institute, 22, 719–48.
Martone, A., & Sireci, S. G. (2009). Evaluating alignment between curriculum, assessments, and instruction. Review of Educational Research, 4, 1332–61.
Masters, G. N. (1982). A Rasch model for partial credit scoring. Psychometrika, 47(2), 149–74.
Messick, S. (1989). Validity. In R. Linn (Ed.), Educational measurement (3rd ed.). Washington, DC: American Council on Education.
Muraki, E. (1992). A generalized partial credit model: Application of an EM algorithm. Applied Psychological Measurement, 16(2): 159–76.
Olsson, U. (1979) Maximum likelihood estimation of the polychoric correlation coefficient. Psychometrika 44, 443–60.
Rothman, R., Slattery, J. B., Vranek, J. L., & Resnick, L. B. (2002). Benchmarking and alignment of standards and testing [Technical Report 566]. Washington, DC: Center for the Study of Evaluation.

Analyses | References
August 2020 CAASPP CSA Technical Report | 2018–2019 Administration Page 103
Sireci, S. G. (1998). Gathering and analyzing content validity data. Educational Assessment, 5, 299–321.
Stocking, M. L. (1996). An alternative method for scoring adaptive tests. Journal of Educational and Behavioral Statistics, 21, 365–89.
Zwick, R., Thayer, D. T., & Mazzeo, J. (1997). Descriptive and inferential procedures for assessing differential item functioning in polytomous items. Applied Measurement in Education, 10(4), 321–44.

Analyses | Accessibility Information
CAASPP CSA Technical Report | 2018–2019 Administration August 2020 Page 104
Accessibility Information 7.7.6. Alternative Text for Equation 7.1
p-value sub dich equals the fraction with the numerator the sum of X sub ic and the denominator N sub I end fraction.
7.7.7. Alternative Text for Equation 7.2 p-value sub poly equals the fraction with the numerator X sub ij and the denominator N sub i times Max of X sub I end fraction.
7.7.8. Alternative Text for Equation 7.3 r sub polyreg equals the fraction Beta sub hat times S tot divided by the square root of Beta sub hat squared times s sub tot squared plus 1.
7.7.9. Alternative Text for Equation 7.4 Alpha sub MH equals the numerator open parenthesis the sum sub m of R sub rm times W sub fm divided by N sub tm close parenthesis divided by the denominator open parenthesis the sum sub m of R sub fm times W sub rm divided by N sub tm closed parenthesis.
7.7.10. Alternative Text for Equation 7.5 MH D - DIF equals negative 2.35 times the natural logarithm open bracket alpha sub MH close bracket.
7.7.11. Alternative Text for Equation 7.6 SMD equals the fraction with numerator the sum from m equals 1 to M of N sub fm times E sub f of Y from X equals m and denominator the sum from m equals 1 to M of N sub fm end fraction minus the fraction with numerator the sum from m equals 1 to M of N sub fm times E sub r of Y from X equals m and denominator the sum from m equals 1 to M of N sub fm end fraction equals the fraction with the numerator the sum from m equals 1 to M of D sub fm and the denominator m equals1 to M of N suf fm end fraction.
7.7.12. Alternative Text for Equation 7.7 P sub ih of theta sub j equals: The numerator exp open parenthesis the sum from v equals 1 to h of Da sub i open parenthesis theta sub j minus b sub I plus d sub iv close parenthesis close parenthesis divided by the denominator open parenthesis 1 plus the sum from c equals 1 to n sub I exp open parenthesis the sum from v equals 1 to c of Da sub I open parenthesis theta sub j minus b sub I plus d sub iv close parenthesis close parenthesis close parenthesis, if score h equals 1, 2, …, n sub i. P sub ih of theta sub j equals: 1 divided by the denominator open parenthesis 1 plus the sum from c equals 1 to n sub I exp open parenthesis the sum from v equals 1 to c of Da sub I open parenthesis theta sub j minus b sub I plus d sub iv close parenthesis close parenthesis close parenthesis, if score h equals 0.

Analyses | Accessibility Information
August 2020 CAASPP CSA Technical Report | 2018–2019 Administration Page 105
7.7.13. Alternative Text for Equation 7.8 Z equals the numerator open absolute symbol, D subtracts Md sub D, close absolute symbol, divided by the denominator of 0.74 times IQR.
7.7.14. Alternative Text for Equation 7.9 Epsilon of theta equals the sum from i equals 1 to ndich of P sub i of theta plus the sum from j equals 1 to npoly times the sum of x equals 1 to m of s sub xj times P sub xj of theta.
7.7.15. Alternative Text for Equation 7.10 Scale score equals scale score at threshold 3 plus sigma sub scale score divided by sigma sub theta times open bracket theta minus theta sub threshold 3 close bracket.
7.7.16. Alternative Text for Equation 7.11 Alpha equals fraction with numerator K and denominator K minus 1 end fraction times open bracket 1 minus fraction with numerator sum from I equals 1 to K of S squared sub X sub I and denominator S squared sub X close bracket.
7.7.17. Alternative Text for Equation 7.12 Rho sub strata equals 1 minus fraction with numerator sum of sigma squared sub X sub j times open bracket 1 minus alpha sub j close bracket and denominator sigma squared sub X.
7.7.18. Alternative Text for Equation 7.13 SEM equals S sub X times square root of 1 minus rho sub strata.
7.7.19. Alternative Text for Equation 7.14 SEM of Theta sub j equals 1 divided by the square root of I of theta sub j.
7.7.20. Alternative Text for Equation 7.15 I of theta sub j equals the sum from I equals 1 to n of I sub I of theta sub j.
7.7.21. Alternative Text for Equation 7.16 I sub i of theta sub j equals open bracket s sub i2 of theta sub j minus s sub i squared of theta sub j.
7.7.22. Alternative Text for Equation 7.17 S sub i of Theta sub j equals the sum from h equals zero to n of h times p sub ih of Theta sub j.
7.7.23. Alternative Text for Equation 7.18 S sub i2 of Theta sub j equals the sum from h equals zero to n sub i of h squared times p sub ih of Theta sub j.
7.7.24. Alternative Text for Equation 7.19 SEM of Theta sub j equals 1 divided by the square root of I of theta sub j.
Quality Control | Quality Control of Item Development
CAASPP CSA Technical Report | 2018–2019 Administration August 2020 Page 106
Chapter 8: Quality Control The California Department of Education (CDE) and Educational Testing Service (ETS) implemented rigorous quality control procedures throughout the test development, administration, scoring, and analyses processes for the California Spanish Assessment (CSA). As part of this effort, ETS staff worked with its Office of Professional Standards Compliance, which publishes and maintains the ETS Standards for Quality and Fairness (ETS, 2014). These standards support the goals of delivering technically sound, fair, and useful products and services; and assisting the public and auditors in evaluating those products and services. This chapter highlights the quality control processes used at various stages of administration.
8.1. Quality Control of Item Development ETS’ goal is to provide the best standards-based and innovative items for the CSA. Items developed for the CSA were subject to an extensive item review process. The item writers hired to develop CSA items and tasks, some of whom are current California educators, were trained in California Assessment of Student Performance and Progress (CAASPP) and ETS policies on quality control of item content, sensitivity and bias guidelines, and guidelines for accessibility to ensure that the items allow the widest possible range of students to demonstrate their content knowledge. Once a written item was accepted for authoring—that is, once it was entered into ETS’ item bank and formatted for use in an assessment—ETS employed a series of internal and external reviews. These reviews used established criteria and specifications to judge the quality of item content and to ensure that each item measured what it is intended to measure. These reviews also examined the overall quality of the test items before presentation to the CDE and item reviewers. To finish the process for item development, a group of California educators reviewed the items and performance tasks for accessibility, bias and sensitivity, and content, and made recommendations for item enhancement. The details on item development processes for quality control purposes are described in section 3.5 Item Review Process of Chapter 3: Item Development and Test Assembly.
8.2. Quality Control of Test Assembly The assembly of all test forms must conform to blueprints that represent a set of constraints and specifications. ETS conducted multiple levels of quality assurance checks on each constructed operational test form to ensure it met the form-building specifications. Both ETS Assessment & Learning Technology Development (ALTD) and Psychometric Analysis & Research (PAR) staff reviewed and signed off on the accuracy of forms before the test forms were put into production for administration in the operational assessment. Detailed information related to test assembly can be found in section 3.7 Test Assembly and Length. In particular, the assembly of all test forms went through a certification process that included various checks, including verifying that
• all answers were correct,
• answers were scored correctly in the item bank and incorrect answers were scored as incorrect,
• all items aligned with the standard,

Quality Control | Quality Control of Test Materials
August 2020 CAASPP CSA Technical Report | 2018–2019 Administration Page 107
• all content in the item was correct,
• distractors were plausible,
• multiple-choice item options were parallel in structure,
• language was grade-level appropriate,
• no more than three multiple choice items in a row had the same key,
• all art was correct,
• there were no errors in spelling or grammar, and
• items adhered to the approved style guide. Reviews were also conducted for functionality and sequencing during the user acceptance testing (UAT) process to ensure all items functioned as expected.
8.3. Quality Control of Test Materials 8.3.1. Developing Test Administration Instructions
ETS staff consulted with internal subject matter experts and conducted validation checks to verify that test instructions accurately matched the testing processes. Copy editors and content editors reviewed each document for spelling, grammar, accuracy, and adherence to CDE style and usage requirements as well as the CSA accessibility standards. Instructions for the CSA were written in Spanish to be read to students in Spanish. CSA content was incorporated to fit the CAASPP System specifications. All CAASPP documents were approved by the CDE before they could be published to the CAASPP website at http://www.caaspp.org/. Only nonsecure documents were posted to this website.
8.3.2. Processing Test Materials Online tests that were submitted by students were transmitted from the American Institutes for Research (AIR) (now Cambium Assessment) to ETS each day. Each system was checked for the completeness of the student record, and records that were identified as having an error were flagged for review.
8.4. Quality Control of Test Administration The quality of test administration for the CSA, and all assessments administered as part of the CAASPP System, was monitored and controlled through several strategies. A fully staffed support center, the California Technical Assistance Center (CalTAC), supports all local educational agencies (LEAs) in the administration of CAASPP assessments. In addition to providing guidance and answering questions, CalTAC regularly conducts outreach campaigns on particular administration topics to ensure all LEAs understand correct test administration procedures. CalTAC is guided by a core group of LEA outreach and advocacy staff that manage communications to LEAs; provide regional and web-based trainings; and host a website, http://www.caaspp.org/, that houses a full range of manuals, videos, and other instructional and support materials. The quality of test administration was further managed through comprehensive rules and guidelines for maintaining the security and standardization of CAASPP assessments,
Quality Control | Quality Control of Scoring
CAASPP CSA Technical Report | 2018–2019 Administration August 2020 Page 108
including the CSA. LEAs received training on these topics and were provided tools for reporting security incidents and resolving testing discrepancies for specific testing sessions. The ETS Office of Testing Integrity (OTI) reinforced the quality control procedures for test administration, providing quality assurance services for all testing programs managed by ETS. The detailed procedures the OTI developed and applied in quality control are described in subsection 4.8.1 ETS’ Office of Testing Integrity (OTI).
8.5. Quality Control of Scoring 8.5.1. Development of Scoring Specifications
A number of measures were taken to ascertain that the scoring keys were applied to the student responses as intended and the student scores were computed accurately. ETS built and reviewed the scoring system models based on the reporting specifications approved by the CDE. These specifications contain detailed scoring procedures, along with the procedures for determining whether a student has attempted a test and whether that student’s response data should be included in the statistical analysis and calculation for computing summary data. Prior to the test administration, ETS ALTD staff reviewed and verified the keys and scoring rubrics for each item. Then, these keys and rubrics were provided to AIR for implementing machine scoring of the item responses. In addition, the student’s original response string was stored for data verification and auditing purposes. Standard quality inspections were performed on all data files, including the evaluation of each student data record for correctness and completeness. Student results are kept confidential and secure at all times.
8.5.2. Quality Control of Machine-Scoring Procedures AIR, the CAASPP subcontractor, provided the test delivery system (TDS) and scored machine-scorable items. AIR staff independently reviewed all CSA forms by taking sample tests. Responses to the test forms were compared with the answer keys for each form to confirm the accuracy of scoring keys. The scores for all applicable items were recorded. A final comparison of the test map to each online form as configured in the UAT environment ensured that no changes to the form were introduced prior to operational deployment. A real-time, quality-monitoring component was built into the TDS. After a test was administered to a student, the TDS passed the resulting data to the quality assurance (QA) system. QA conducted a series of data integrity checks, ensuring, for example, that the record for each test contained information for each item, keys for multiple-choice items, score points in each item, and the total number of operational items. In addition, QA also checked to ensure that the test record contained no data from items that might have been invalidated. Data passed directly from the Quality Monitoring System to the Database of Record, which served as the repository for all test information, and from which all test information was pulled and transmitted to ETS in a predetermined results format.
Quality Control | Quality Control of Psychometric Specifications
August 2020 CAASPP CSA Technical Report | 2018–2019 Administration Page 109
8.5.3. Enterprise Score Key Management System (eSKM) Processing Prior to the start of the test administration, test-level scores were defined in a scoring model configured in ETS’ eSKM system. After the administration started, and after AIR completed machine-scoring, item scores and responses were delivered to ETS. ETS’ Centralized Repository Distribution System and Enterprise Service Bus departments collected and parsed .xml files that contained student response data from AIR. The eSKM system collected and calculated individual students’ overall scores and generated student scores in the approved statistical extract format. The data extracts were sent to ETS’ Data Quality Services for data validation. Following successful validation, the student response statistical extracts were made available to the PAR team. The eSKM system implemented scoring procedures specified by the PAR team.
8.5.4. Psychometric Processing Prior to the administration, the ETS PAR team verified the score calculation was accurate by both reviewing the configuration setup and using the UAT data. When the operational data arrived, eSKM received the individual students’ item scores from AIR and calculated individual student scores for ETS’ reporting systems. The PAR team also computed individual student scores based on item scores delivered by AIR. The scores from the two sources were then compared for internal quality control. Any differences in the scores were discussed and resolved. All scores complied with the ETS scoring specifications and the parallel scoring process to ensure the quality and accuracy of scoring and to support the transfer of scores into the database of the student records scoring system, the Test Operations Management System.
8.6. Quality Control of Psychometric Specifications 8.6.1. Development of Psychometric Specifications
ETS scoring specifications for the CSA were completed, reviewed, approved, and checked in advance of the receipt of student response data. Before psychometric analysis, PAR developed a psychometric analysis plan and road map, describing each step of psychometric analyses, procedures, and schedules. This plan was submitted to the CDE for review and approval. After that, psychometric specifications were developed for ETS data analysts conducting all analyses. Psychometric specifications contained detailed scoring procedures as well as the procedures for determining whether a student attempted a test and whether that student’s response data should be included in the statistical analyses and calculations for computing summary data.
8.6.2. Quality Control of Psychometric Analyses All psychometric analyses conducted at ETS underwent comprehensive quality checks by a team of psychometricians and data analysts. Detailed checklists and psychometric specifications were developed by members of the team for each of the statistical procedures performed on CSA results data including classical item analyses, differential item functioning, item response theory (IRT) calibration, linking, and scaling. Classical item analyses and differential item functioning analyses were run and confirmed by independent analysts. Results were then reviewed by the ETS psychometricians to
Quality Control | Quality Control of Reporting
CAASPP CSA Technical Report | 2018–2019 Administration August 2020 Page 110
compile a list of flagged items. Items that were flagged for questionable statistical attributes were sent to ETS ALTD staff for review; their comments were reviewed by the psychometricians before the review by the CDE. The ETS ALTD and PAR teams worked together to evaluate and make recommendations to the CDE about any problematic items that should be removed from IRT calibration. During the calibration process, checks were made to ascertain that the input files were established accurately. Checks were also made on the number of items, number of examinees with valid scores, IRT item difficulty estimates, standard errors for the item difficulty estimates, and the linking and scaling process. Two psychometricians conducted parallel calibration processing and compared the results to check for any inconsistency. Psychometricians also performed detailed reviews of relevant statistics to determine whether the chosen IRT model fit the data. Once raw-to-scale-score conversion tables for each form were generated, psychometricians carried out quality control checks on each scoring table to verify
• all possible raw scores for each form were included in the tables;
• the lowest obtainable scale score and the highest obtainable scale score matched the specifications for each grade, respectively; and
• the threshold score for the score reporting range was correctly identified. After all quality control steps were completed and any differences were resolved, one final inspection of scoring tables was conducted prior to uploading the tables to eSKM for score reporting.
8.7. Quality Control of Reporting To ensure the quality of the CSA results for both individual student and summary reports, four general areas were evaluated:
1. Comparison of report formats with input sources from the CDE-approved samples 2. Validation of the report data through quality control checks performed by ETS’ Data
Quality Services and Resolutions teams, as well as running of all the Student Score Reports through ETS’ patented Quality Control Interrogator software
3. Evaluation of the production of all Student Score Reports—available in paper and electronic versions—by verifying the print quality, comparing the number of report copies, sequence of the report order, and offset characteristics to the CDE requirements
4. Proofreading of the pilot and production reports by the CDE and ETS prior to any LEA mailings
All reports were required to include a single, accurate LEA code, an LEA name, and a school name. All elements conformed to the CDE’s official county/district/school (CDS) code and naming records. From the start of processing through scoring and reporting, the CDS Master File was used to verify and confirm the accuracy of codes and names. The CDE provided a revised LEA Master File to ETS throughout the year as updates became available. After the reports were validated in accordance with CDE requirements, a set of reports representing all possible grades, content areas, and reporting outcomes was provided to the
Quality Control | Quality Control of Reporting
August 2020 CAASPP CSA Technical Report | 2018–2019 Administration Page 111
CDE and ETS for review and approval. Electronic reports were sent on the actual report template, organized as they were expected to look in production. Upon the CDE’s approval of the reports generated for the initial review, ETS proceeded with the first batch of report production. The first production batch was inspected to validate a subset of LEAs that contained key reporting characteristics and demographics of the state. The first production batch incorporated selected LEAs and provided the final check prior to generating all reports and making them electronically available for download in TOMS and for student information systems through an application programming interface, as well as mailing them to the LEAs that requested printed Student Score Reports.
8.7.1. Exclusion of Student Scores from Summary Reports ETS provided the CDE with reporting specifications that documented when to exclude student scores from summary reports. These specifications included the logic for handling submitted tests that, for example, identified students who tested but responded to no items, who were not tested due to parent/guardian request, or who did not complete the test due to illness. The methods for handling other anomalies were also covered in the specifications. These anomalies are described in more detail in the subsection 6.3.2 Special Cases.
8.7.2. End-to-End Testing for Operational Administration ETS conducted end-to-end testing prior to the start of the test administration. The purpose of this testing was to verify that all systems, processes, and resources were ready for the operational administration. ETS employed a number of approaches to verify ongoing systems performance, including monitoring of system availability and online system usage. Time was allotted for user acceptance testing to confirm that the systems met requirements and to make identified corrections before final deployment. To accomplish system acceptance and sign off, ETS deployed systems to a staging area, which mirrored the final production environment, for operational and user acceptance testing. Final approval by the CDE triggered the final deployment of the system.

Quality Control | Reference
CAASPP CSA Technical Report | 2018–2019 Administration August 2020 Page 112
Reference Educational Testing Service. (2014). ETS standards for quality and fairness. Princeton, NJ:
Educational Testing Service. Retrieved from https://www.ets.org/s/about/pdf/standards.pdf

Continuous Improvement | Administration and Test Delivery
August 2020 CAASPP CSA Technical Report | 2018–2019 Administration Page 113
Chapter 9: Continuous Improvement The California Spanish Assessment (CSA) had its first operational administration in spring 2019. Since its inception, continuous efforts have been made to improve the CSA in various ways. This chapter documents the processes whereby ETS ensures continuous improvements and the results of this process in the current year in the areas of test delivery and administration, psychometric analyses, and accessibility.
9.1. Administration and Test Delivery 9.1.1. Survey Results
The California Assessment of Student Performance and Progress (CAASPP) program solicits feedback annually for participants of the suite of CAASPP assessments, through the CAASPP Post-Test Survey. In general, local educational agencies (LEAs) reported having a good experience with the CSA administration; for example, less than 1 percent of survey respondents indicated that the CSA administration needs more training materials. The survey revealed that usage of the CSA practice and training tests is low. Approximately 40 percent of respondents indicated that they reviewed the CSA practice and training tests themselves, while a smaller portion indicated that they reviewed the CSA practice and training tests with their students. However, all respondents who accessed the CSA practice and training test found them to be useful to both school staff and students. This survey also captured for what purpose respondents used the CSA results. Almost all respondent used it as a measure of Spanish reading/language arts competency, and about half of the respondents used the assessment as an evaluation of their local educational agency’s (LEA’s) Spanish instructional program.
9.1.2. Training and Communication ETS and the CDE continue to incorporate the CSA into the CAASPP System of assessments by including it in the pretest workshop and other trainings as well as in CAASPP manuals, with communication as a focal point. Because the CSA is a new assessment and is voluntary, ETS will continue to provide statewide training specific to the CSA to LEA staff and test administrators to help LEAs understand and interpret CSA scores and to communicate the availability of the CSA. ETS developed and provided practice and training tests with a variety of item types, to continue familiarizing students with the CSA items. The practice tests mirror the test length and grade levels on the operational CSA and are developed using the same standards as the operational assessment. The practice and training tests included all accessibility resources that the operational assessment provided, with the exception of braille, closed captioning, text-to-speech, and audio transcripts. A student’s experience with the practice and training tests can help inform the decision about whether or not a student takes the operational CSA. LEAs are encouraged to use the practice and training tests to help students become more familiar with using the technology and technology-enhanced items prior to taking the operational assessment.
Continuous Improvement | Accessibility
CAASPP CSA Technical Report | 2018–2019 Administration August 2020 Page 114
9.2. Accessibility ETS continues to increase the number of accessibility resources available for the future operational assessment. In the interest of increasing the number of items that are “born accessible”—i.e., items that are as universally accessible as possible by all populations—ETS continues to investigate the construct-irrelevant use of item types that have no discernable difference from traditional test questions. As a result, ETS is reducing the development of both Match items and text-based Zone items, because they can be less accessible for students with sensory disabilities to discern. Operational items were reviewed by teachers of students with visual impairment (TVIs) after their appearance on the CSA field test. Item development was adjusted by incorporating TVIs’ feedback. To ensure items’ accessibility to students with sensory disabilities, CSA items will be reviewed on an ongoing basis by TVIs following the first year of administration.

Continuous Improvement | Reference
August 2020 CAASPP CSA Technical Report | 2018–2019 Administration Page 115
Reference Educational Testing Service. (2019). Summary of results from the California Assessment of
Student Performance and Progress California Spanish Assessment 2018–19 operational test post-test survey. [Unpublished report]. Princeton, NJ: Educational Testing Service.