California Residue and In-forest...
24
Transcript of California Residue and In-forest...
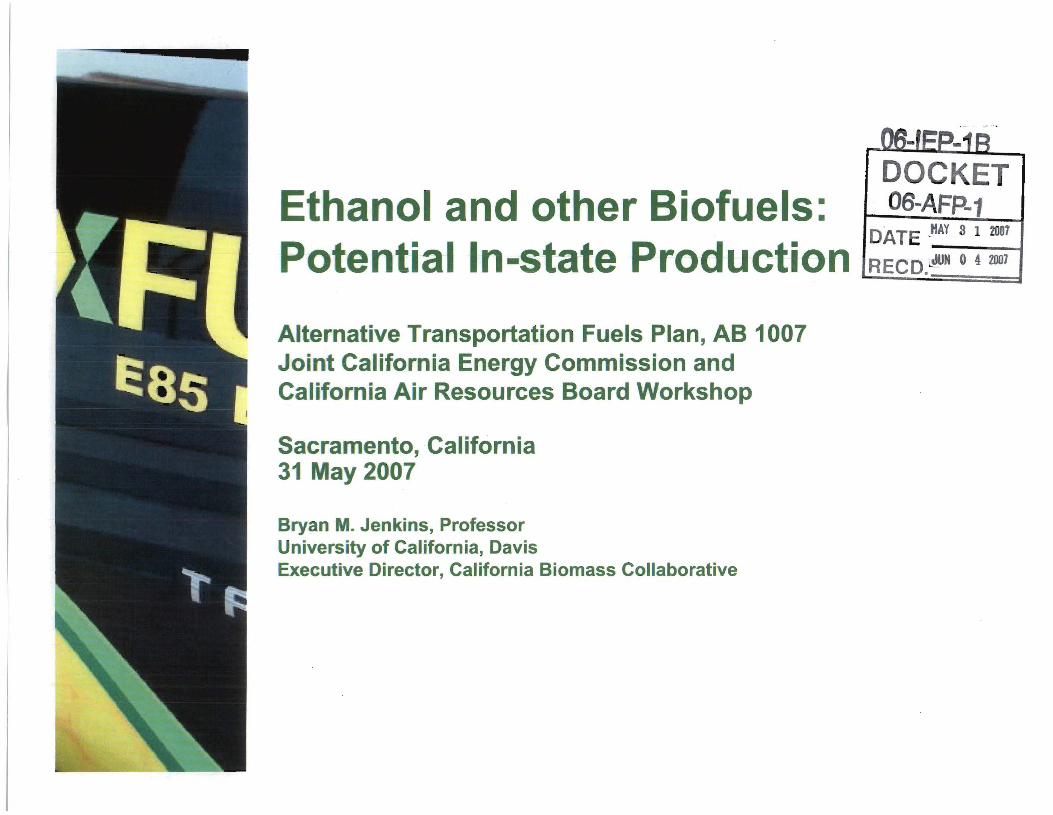
California Residue and In-forest Biomass Resources
0 20 40 60 80 100
Total
Urban
Forestry
Agriculture
Biomass (Million BDT/year)
Potential FeedstockGross Biomass
+ 90 BCF/year biomethane
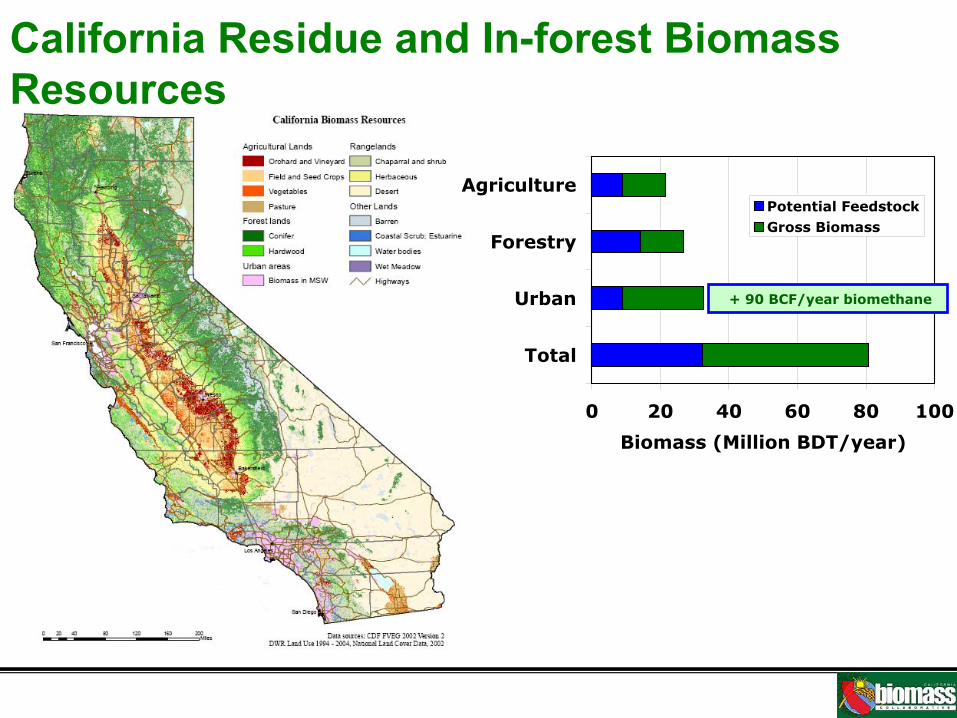
Principal Biomass Conversion Pathways
• Thermochemical Conversion– Combustion– Gasification– Pyrolysis
• Bioconversion– Anaerobic/Fermentation– Aerobic Processing– Biophotolysis
• Physicochemical– Heat/Pressure/Catalysts– Refining– Makes e.g. Esters (Biodiesel),
Alkanes
• Energy– Heat– Electricity
• Fuels– Solids– Liquids– Gases
• Products– Chemicals– Materials
• Production• Collection• Processing• Storage• Transportation
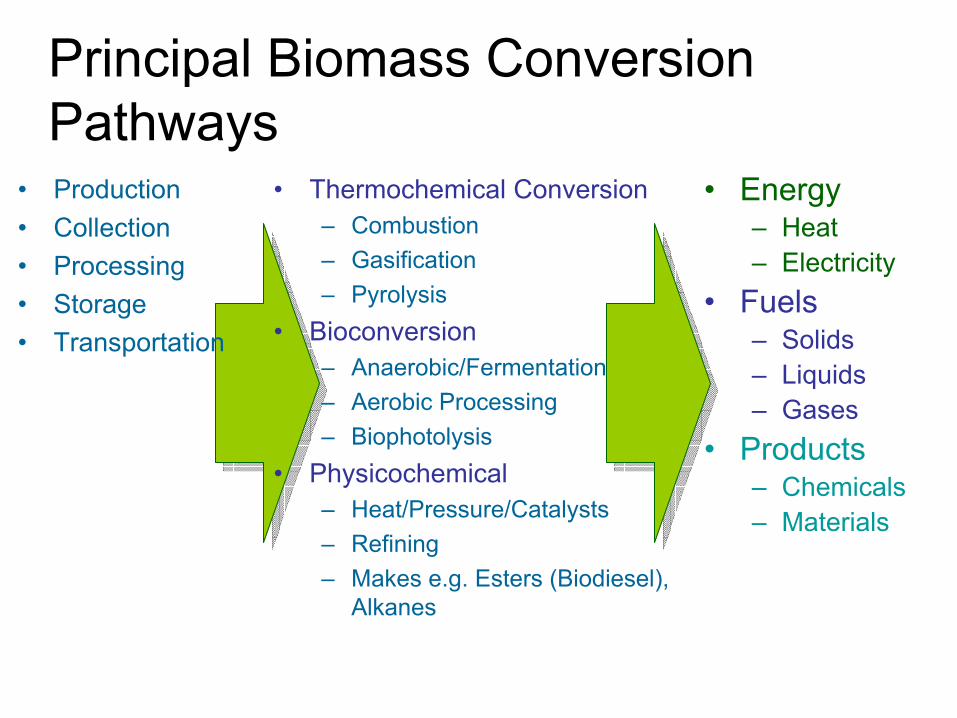
Biorefining Approaches
• Thermochemical • Biochemical
• Synthesis gas – (CO + H2 + other)
• Sugar monomers, acids
Gasification,Pyrolysis
Pretreatment,Hydrolysis
(cell wall deconstruction)
ThermolyticSolidsOils
HydrolyticCellulose
Hemicellulose
CatalyticSynthesis Fermentation
• Hydrocarbons, mixed alcohols, hydrogen, ammonia, SNG, ethanol, higher alcohols…
• Ethanol, higher alcohols, biomethane, hydrogen, acids…
SyngasFermentation
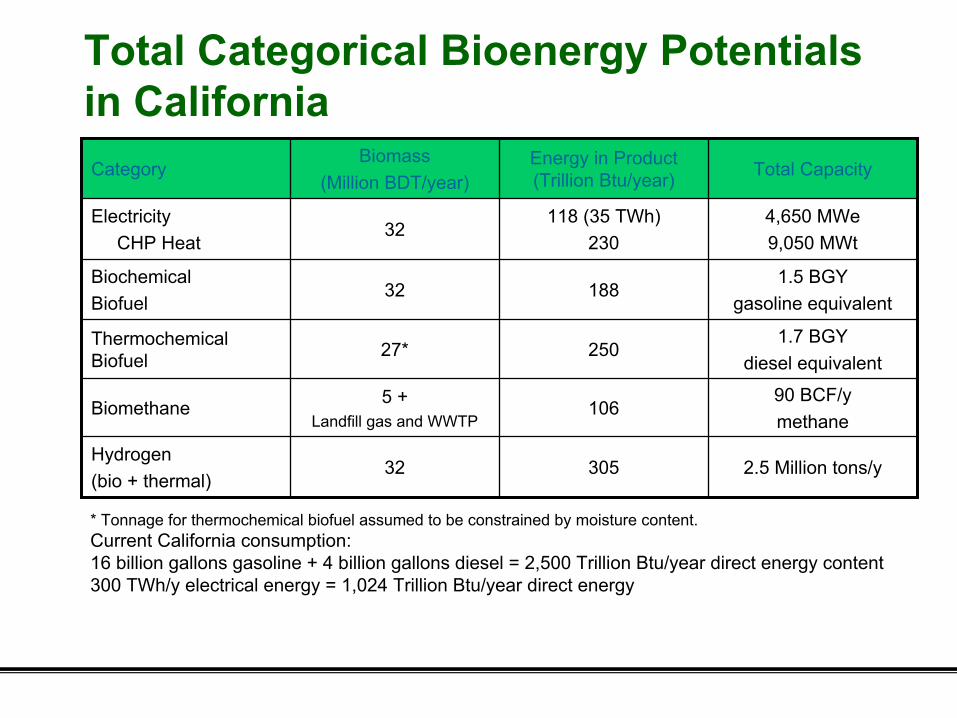
Total Categorical Bioenergy Potentials in California
2.5 Million tons/y30532Hydrogen (bio + thermal)
90 BCF/y methane
1065 +Landfill gas and WWTP
Biomethane
1.7 BGY diesel equivalent
25027*Thermochemical Biofuel
1.5 BGY gasoline equivalent
18832Biochemical Biofuel
4,650 MWe9,050 MWt
118 (35 TWh)230
32Electricity
CHP Heat
Total CapacityEnergy in Product (Trillion Btu/year)
Biomass (Million BDT/year)
Category
* Tonnage for thermochemical biofuel assumed to be constrained by moisture content.Current California consumption:16 billion gallons gasoline + 4 billion gallons diesel = 2,500 Trillion Btu/year direct energy content300 TWh/y electrical energy = 1,024 Trillion Btu/year direct energy

0
1
2
3
2005 2010 2015 2020 2025 2030 2035 2040 2045 2050Year
Ann
ual B
ioen
ergy
(Bill
ion
Gal
lons
of G
asol
ine
Equi
vale
nt)
California biofuel scenario:In-state residue + bioenergy crop additions
Biofuels
Biomethane
Electricity
Hydrogen

* Suspect - Probably higher
985132Totals
5.722Animal and food waste digester
6420Wastewater treatment *
27560Landfill gas-to-energy
64030Solid Fuel Combustion (includes 3 MSW facilities)
Gross Capacity (MW)
Number of facilities
Technology/Fuel Source
Current Biomass Power Capacity in California
Solid Combustion Fuel Sources
0
10
20
30
40
50
Forest Urban Wood Ag./ FoodProcessing
MSW
(%)
Source: Williams, 2007
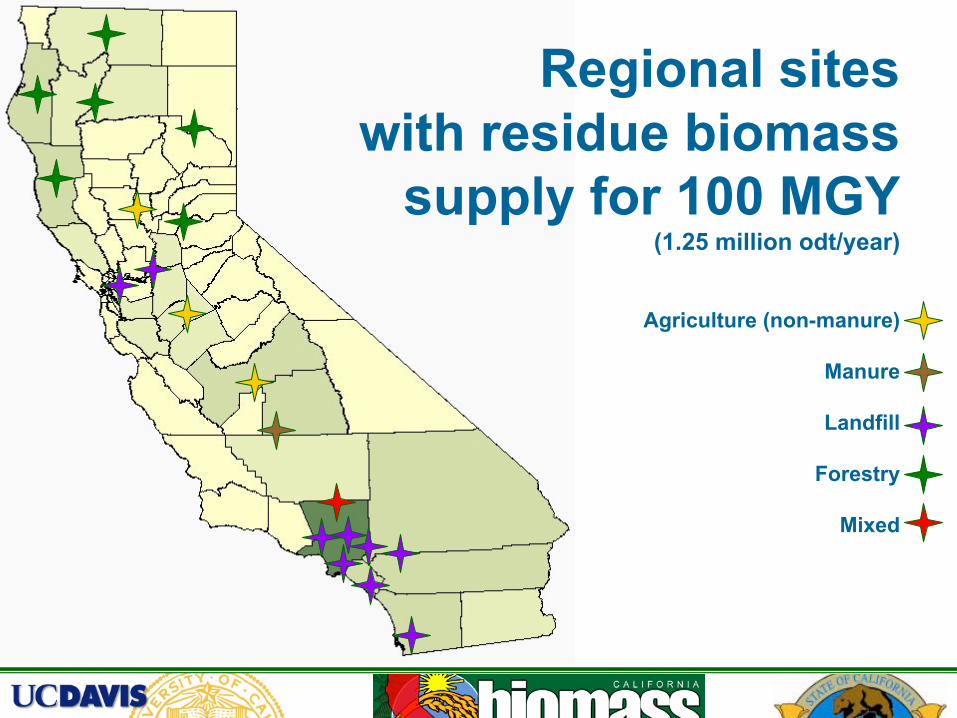
Regional siteswith residue biomass
supply for 100 MGY(1.25 million odt/year)
Agriculture (non-manure)
Manure
Landfill
Forestry
Mixed
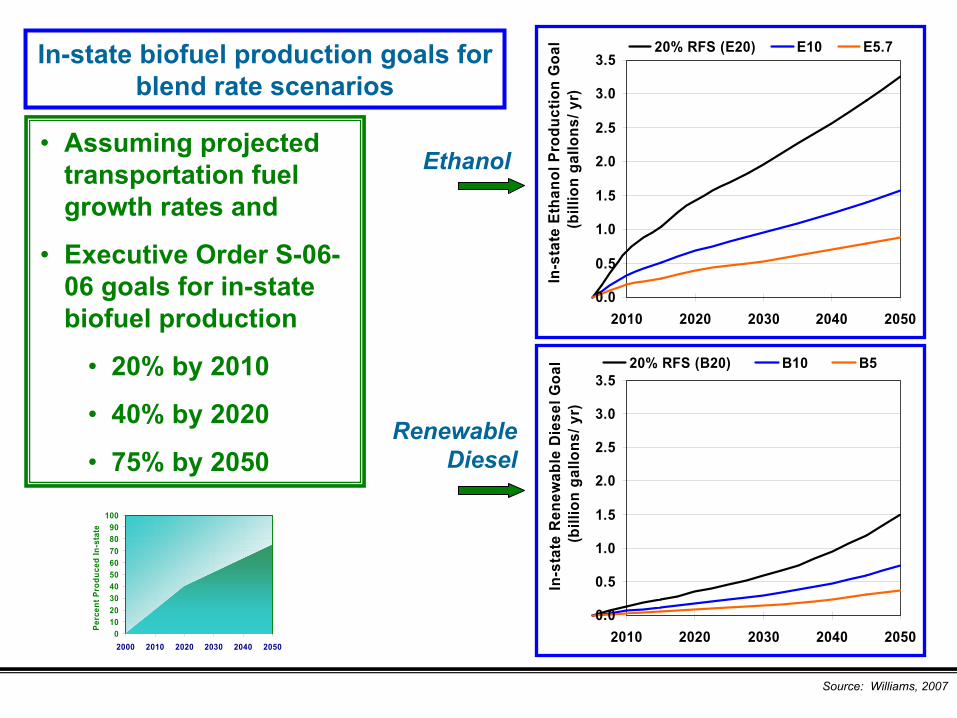
In-state biofuel production goals for blend rate scenarios
• Assuming projected transportation fuel growth rates and
• Executive Order S-06-06 goals for in-state biofuel production
• 20% by 2010
• 40% by 2020
• 75% by 2050
0.0
0.5
1.0
1.5
2.0
2.5
3.0
3.5
2010 2020 2030 2040 2050
In-s
tate
Eth
anol
Pro
duct
ion
Goa
l(b
illio
n ga
llons
/ yr)
20% RFS (E20) E10 E5.7
0.0
0.5
1.0
1.5
2.0
2.5
3.0
3.5
2010 2020 2030 2040 2050
In-s
tate
Ren
ewab
le D
iese
l Goa
l (b
illio
n ga
llons
/ yr)
20% RFS (B20) B10 B5
Ethanol
Renewable Diesel
Source: Williams, 2007
0102030405060708090
100
2000 2010 2020 2030 2040 2050
Perc
ent P
rodu
ced
In-s
tate
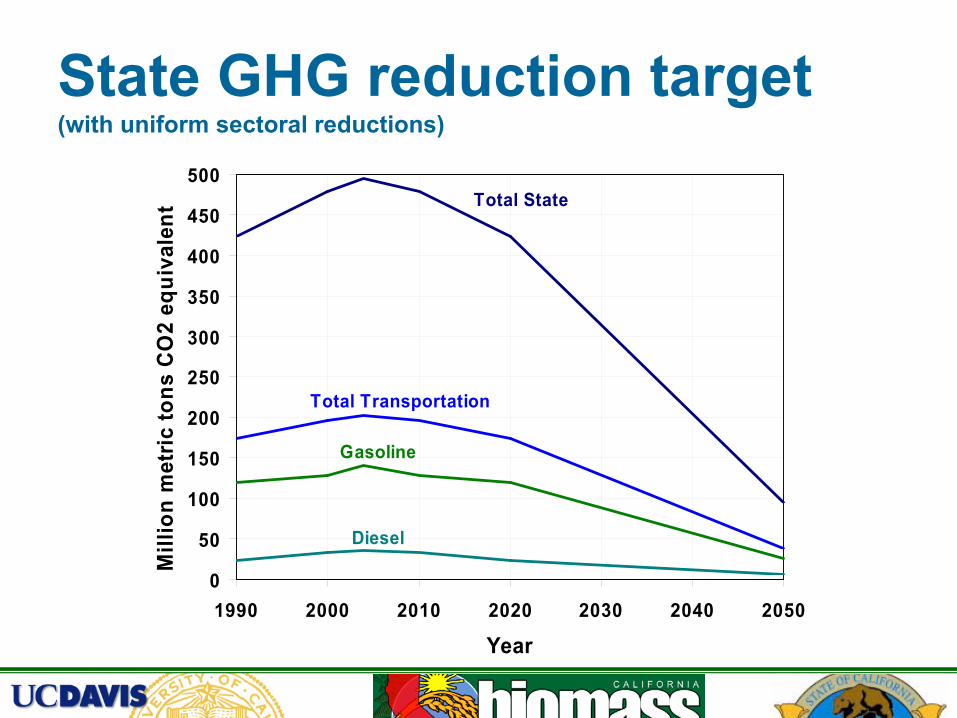
State GHG reduction target(with uniform sectoral reductions)
0
50
100
150
200
250
300
350
400
450
500
1990 2000 2010 2020 2030 2040 2050
Year
Mill
ion
met
ric to
ns C
O2
equi
vale
nt
Total Transportation
Diesel
Gasoline
Total State
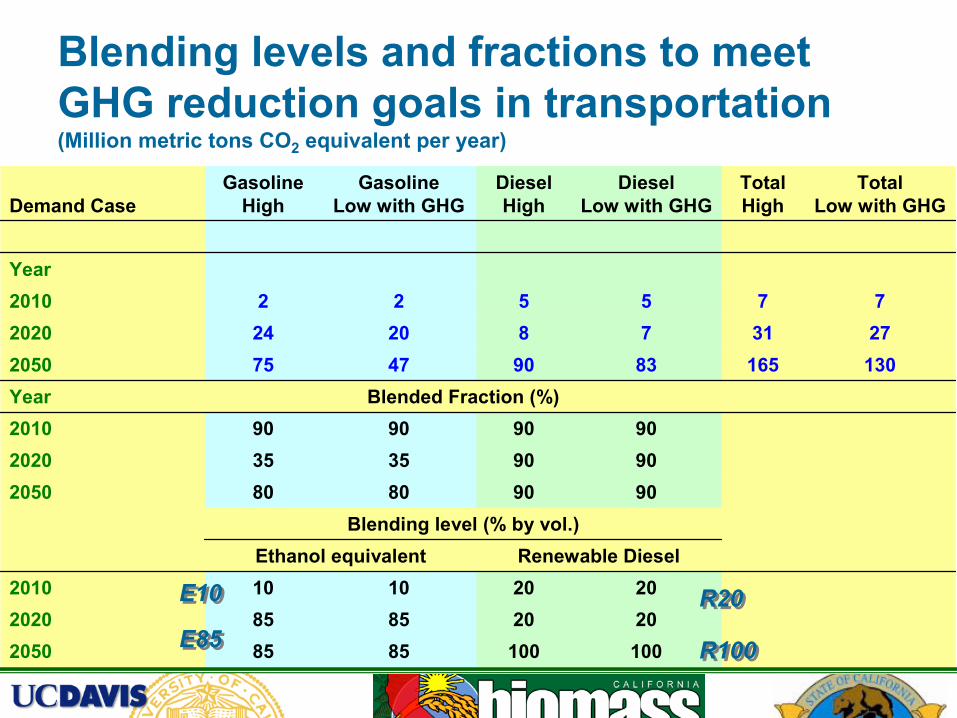
Blending levels and fractions to meet GHG reduction goals in transportation(Million metric tons CO2 equivalent per year)
10010085852050202085852020202010102010
Renewable DieselEthanol equivalentBlending level (% by vol.)
909080802050909035352020909090902010
Blended Fraction (%)Year130165839047752050273178202420207755222010
Year
Total Low with GHG
Total High
Diesel Low with GHG
Diesel High
Gasoline Low with GHG
Gasoline HighDemand Case
E85E85
E10E10 R20R20
R100R100
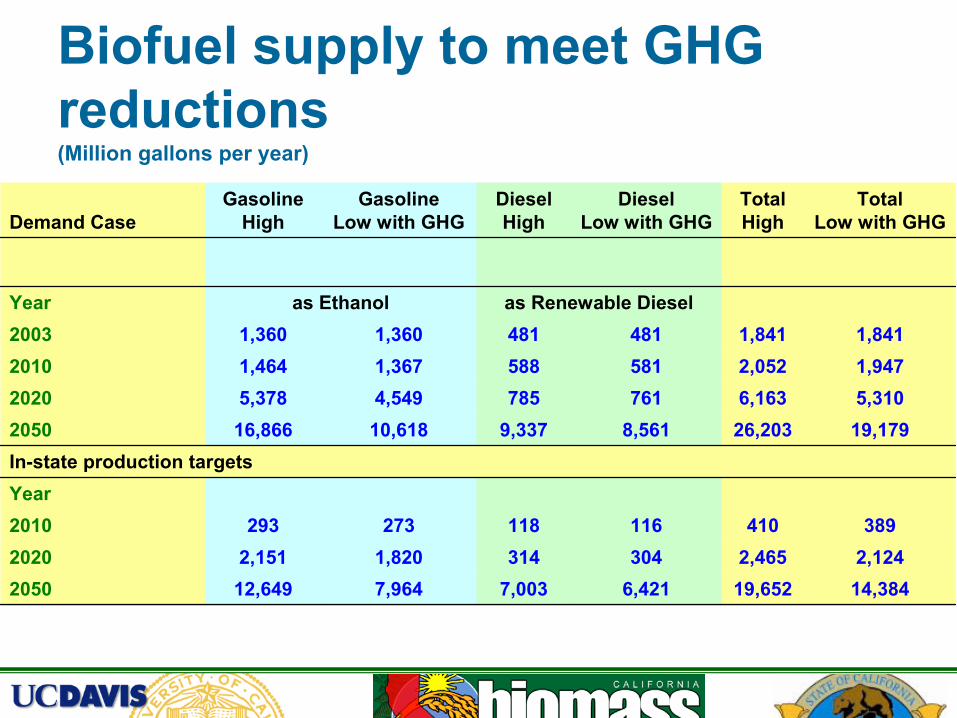
Biofuel supply to meet GHG reductions(Million gallons per year)
14,38419,6526,4217,0037,96412,64920502,1242,4653043141,8202,15120203894101161182732932010
YearIn-state production targets
19,17926,2038,5619,33710,61816,86620505,3106,1637617854,5495,37820201,9472,0525815881,3671,46420101,8411,8414814811,3601,3602003
as Renewable Dieselas EthanolYear
Total Low with GHG
Total High
Diesel Low with GHG
Diesel High
Gasoline Low with GHG
Gasoline HighDemand Case
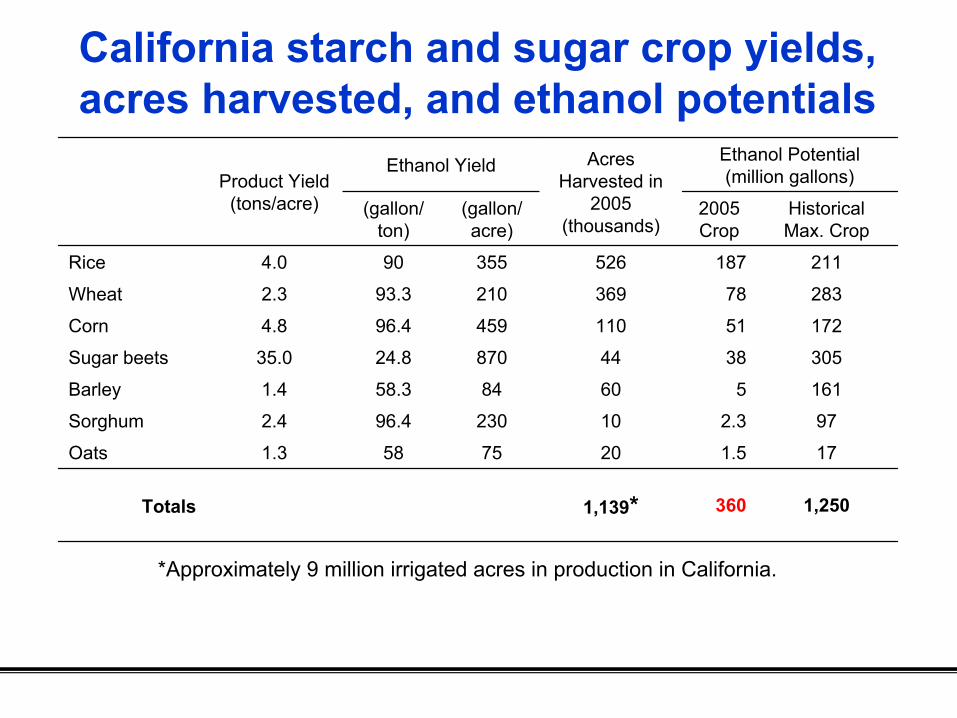
1,2503601,139*Totals
171.5207558 1.3Oats
972.31023096.4 2.4Sorghum
1615608458.3 1.4Barley
305384487024.8 35.0Sugar beets
1725111045996.4 4.8Corn
2837836921093.3 2.3Wheat
21118752635590 4.0Rice
Historical Max. Crop
2005 Crop
(gallon/acre)
(gallon/ton)
Ethanol Potential (million gallons)
Acres Harvested in
2005 (thousands)
Ethanol Yield Product Yield
(tons/acre)
*Approximately 9 million irrigated acres in production in California.
California starch and sugar crop yields, acres harvested, and ethanol potentials

University of California, Davis
Bioenergy Crops• Cereals
– Grains for fermentation (known), cellulosicresiduals and dedicated crops for fermentation (developmental), thermochemical processing, or other
– Price impacts due to large fuel demand– Current California corn imports equivalent
to 200 to 450 million gallons ethanol
University of California, Davis
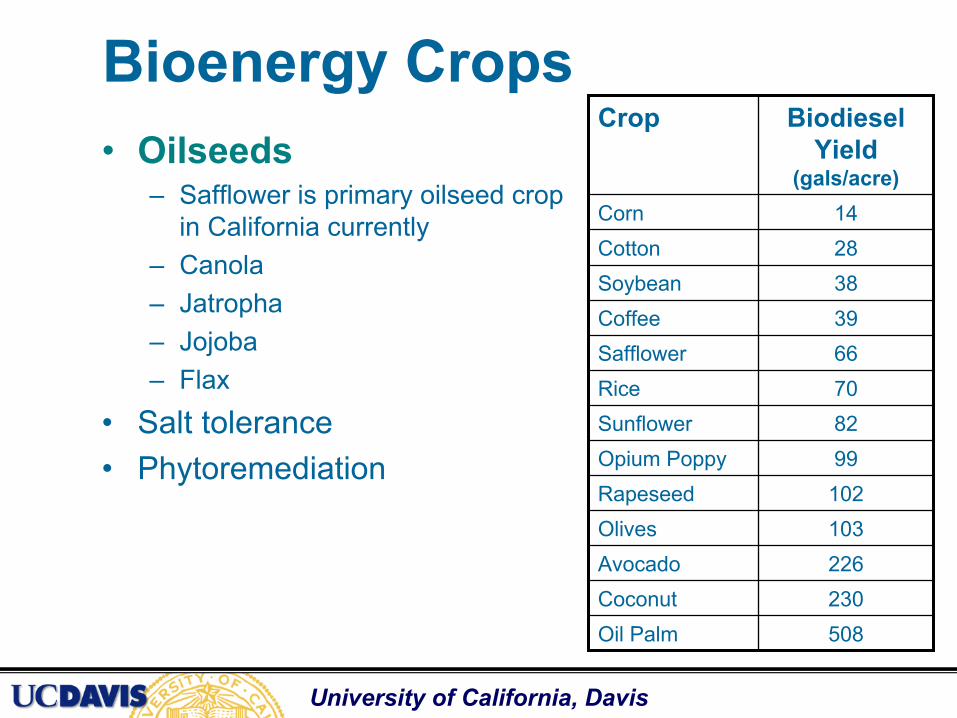
• Oilseeds– Safflower is primary oilseed crop
in California currently– Canola– Jatropha– Jojoba– Flax
• Salt tolerance• Phytoremediation
508Oil Palm230Coconut226Avocado103Olives102Rapeseed99Opium Poppy82Sunflower 70Rice66Safflower39Coffee38Soybean28Cotton14Corn
BiodieselYield
(gals/acre)
CropBioenergy Crops

University of California, Davis
• Sugar crops– Sugar beets
• High yields • Salt tolerant
– Sugar cane• Trials in Imperial Valley• Harvest season can be
staged with beets• 18 – 30 dry tons/acre-year
– Sweet Sorghum• Testing program by CDFA
1980s-1990s
Sugar beet yields Kaffka, 2006
Kaffka, 2006
Bioenergy Crops

University of California, Davis
Example: Sugar Cane• Imperial Valley trials
– Potential of 1200-1400 gallons ethanol per acre per year– Potential additional 400-700 gallons ethanol per year from
bagasse via cellulosic fermentation or other conversion methods (reduced by use for power and heat generation)
– 500,000 acres of cropland– 20% crop shift to sugar cane
• 100,000 acres at 2,100 gallons/acre-year--210 Million gallons ethanol/year
• Some estimates suggest higher ethanol yields• 4,000-6,000 gallons/acre-year• Water and sustainability effects uncertain

Land area required for alternative biofuel scenarios
Oil seed crop requirements to meet in-state production goals for conventional biodiesel (thousand acres)
14,8757,4383,7191,48820503,4271,71385734320201,2956483241302010
B20B10B5B2Year
Starch and sugar crop land area requirements for in-state ethanol production goals (thousand acres)
3,7421,8061,0154,1001,9791,1127,0763,4161,91920501,6477954471,8058714893,1161,50484520207763752118514112311,4687093982010E20E10E5.7E20E10E5.7E20E10E5.7
Sugar BeetCorn + StoverCorn Year
Source: LCFS report and Williams, 2007
University of California, Davis
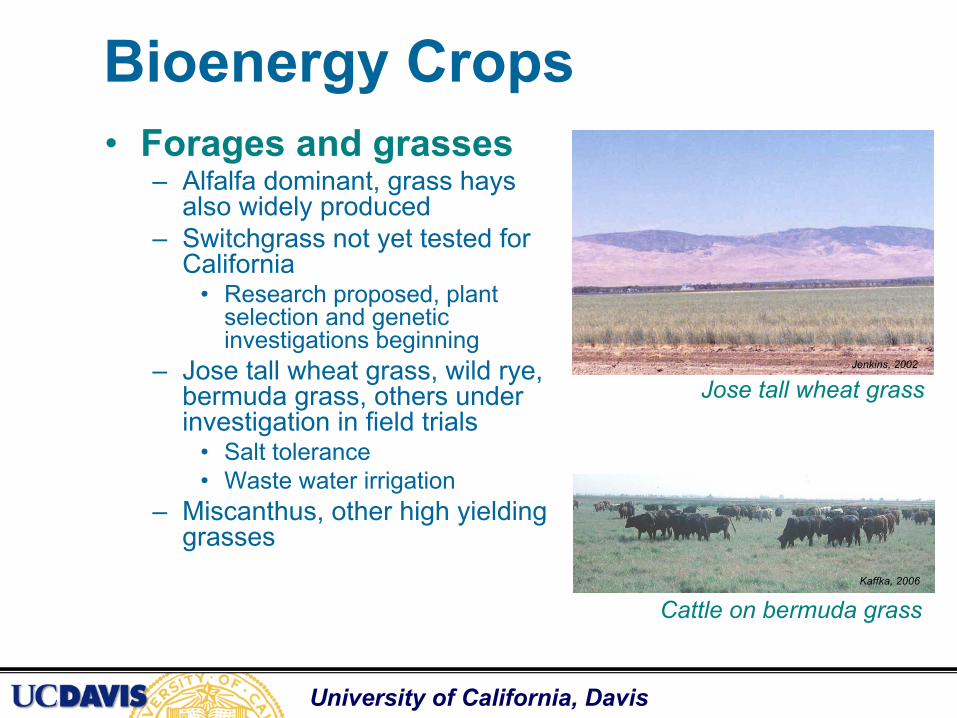
Cattle on bermuda grass
• Forages and grasses– Alfalfa dominant, grass hays
also widely produced– Switchgrass not yet tested for
California• Research proposed, plant
selection and genetic investigations beginning
– Jose tall wheat grass, wild rye, bermuda grass, others under investigation in field trials
• Salt tolerance• Waste water irrigation
– Miscanthus, other high yielding grasses
Kaffka, 2006
Jose tall wheat grassJenkins, 2002
Bioenergy Crops

University of California, Davis
• Tree crops– Agroforestry crops investigated
as part of integrated on-farm drainage management systems
• Eucalyptus• Athel• Casuarina
– Commercial plantation production of eucalyptus in northern California
– Poplar testing on waste water– Many other species
Eucalyptus plantation, Corning, California
Poplar plantation, Jamestown, California
Bioenergy Crops

University of California, Davis
• Algae– Diatoms, green algae, blue-green
algae, golden algae– Source of carbohydrates, protein, oils
(principally triacyglycerols)– CO2 recycling, potential for
biohydrogen production– Productivity as high as 50 g m-2 day-1
(production may be seasonal)– Potential lipid yields 30X terrestrial oil
crops– Research conducted under DOE
Aquatic Species Program 1978-1996– Substantial technical hurdles remain,
recommendations for additional research on basic biology
– Integration with waste water and nutrient management
Bioenergy Crops

California cellulosic ethanol potential
Source: Williams, 2007
Potential Ethanol
Biomass Source
Potential Feedstock
(million dry ton/yr)
(million gallons/y) (million gge/y)
Field and Seed 2.3 160 105
Orchard/Vine 1.8 125 83
Landfilled Mixed paper 4.0 320 213
Landfilled wood & greenwaste with ADC 2.7 216 144
Forest thinnings 14.2 990 660 Totals- Current California 24.9 1,814 1205 1.5 Million Acres Dedicated Energy Crop Low Yield (5 dry tons/acre, 80 gallons/ton) 7.5 600 400
High Yield (9 dry tons/acre, 100 gallons/ton) 13.5 1,350 900
Low Yield 32 2,414 1605 Range
State potentials with 1.5 M acres energy crop
High Yield 38 3,164 2105

Resource sufficiency for 2020• Biomass sources potentially sufficient to supply
2 - 3 BGY gasoline equivalent – meets in-state production targets for 2020– substantial additional amounts (3 – 4 BGY needed to
satisfy GHG emission reduction targets if transportation to supply appropriate share of state reductions
• crop shifting (e.g. 2 million acres might supply additional 2 BGY at average of 10 dry tons/acre-year, other resources potentially constraining)
• biofuel imports• biomass imports• other alternative fuels, increased efficiency, biofuels not the only
solution– technology deployment uncertain
Resource sufficiency for 2050• Projected in-state biomass sources clearly
insufficient to meet GHG emission reduction shares for transportation alone by 2050 without radical change to transportation system
• Projected in-state biomass supply to satisfy high growth fuel demand (20 BGY biofuels) exceeds 200 million tons per year– Supplemental biofuel imports but in-state production
target not likely met– Biomass imports but global sustainability needs to be
considered