California PATH Leadership · · 2017-07-12California PATH—Partners for Advanced Transit and...
20
Intellimotion vol. 10 no. 3 2003 Research Updates in Intelligent Transportation Systems Volume 10, No. 3 2003 California PATH—Partners for Advanced Transit and Highways—is a collaboration between the California Department of Transportation (Caltrans), the University of California, other public and private academic institutions, and private industry. PATH’s mission: applying advanced technol- ogy to increase highway capacity and safety, and to reduce traffic congestion, air pollu- tion and energy consumption. Page 1 Change of Leadership and a New Direction for California PATH Page 2 Smart Buses, Smart Intersection Shine at Washington IVI Meeting Page 4 Freeway OnRamp Metering, Delay Savings, and Diverge Bottleneck Page 6 Bus Rapid Transit Planning: Riverside and Worldwide (Part 2) Page 8 PATH Demonstrates Automated Bus Rapid Transit Technologies Page 18 PATH on Paper continued on page 15 S erving as the Director of PATH for the past six years has been a very rewarding experi- ence for me. I took over immediately after DEMO’97 from Professor Pravin Varaiya who had led PATH during the years of the NAHSC (Nation- al Automated Highway Systems Consortia). We faced some very difficult times after the demise of the NAHSC but were able to maintain our posi- tion as the leading international research institute in vehicle automation while greatly expanding our role in traffic management and information. Pat Conroy and later Hamed Benouar led this ini- tiative and worked closely with Caltrans to apply ITS to the states transportation problems. I am very happy to turn over the reigns of PATH to Professor Samer Madanat. He has had a very successful career as transportation academic in our Civil and Environmental Engineering’s Trans- portation group. After obtaining his PhD from MIT in 1988 he joined the faculty at Purdue Uni- versity and finally joined the Berkeley faculty in 1996. His area of research is in transportation sys- tems analysis and infrastructure management. He has worked closely with both the US Department of Transportation and Caltrans. He has an excit- ing vision for PATH and the energy and enthusi- asm to make it happen. I look forward to continue working with Samer and to help him in any way I can to make his vision come true. A Word from Karl Hedrick A Word from Samer Madanat The New PATH: Moving Research into Field Operational Tests Since its conception, PATH has played an impor- tant role in the development of both the state and the national Intelligent Transportation System programs, participated in the founding of the Intelligent Transportation Society of America and conducted research under a number of state and federally sponsored ITS research programs. PATH gained international reputation in the area of Advanced Vehicle Control and Safety Systems (AVCSS). In the early 90s, PATH made contributions to the National ITS Architecture. From 1994 to 1998, PATH was a key member of the National Automated Highway System Consortium. Since 1998, PATH has participated in Federal DOT’s Intelligent Vehicle Initiative Programs. Throughout, PATH researchers made fundamental advances in the application of control and systems engineering methods to col- lision warning and avoidance for cars, buses and trucks. PATH researchers have also contributed sig- nificantly to research in the areas of Advanced Traffic Management and Information Systems (ATMIS). The list of accomplishments in this area includes the development of state-of-the- art Traffic Surveillance technologies, algorithms A Fond Farewell to Karl Hedrick and a Welcome to Samer Madanat California PATH Change of Leadership:
Transcript of California PATH Leadership · · 2017-07-12California PATH—Partners for Advanced Transit and...

Intellimotion vol. 10 no. 3 2003
Research Updates inIntelligent Transportation Systems
Volume 10, No. 32003
California PATH—Partners for Advanced Transit and Highways—is a collaboration between the California Department of Transportation (Caltrans), the University of California, other public and private academic institutions, and private industry.
PATH’s mission: applying advanced technol-ogy to increase highway capacity and safety, and to reduce traffic congestion, air pollu-tion and energy consumption.
Page 1Change of Leadership and a New Direction for California PATH
Page 2Smart Buses, Smart Intersection Shine at Washington IVI Meeting
Page 4Freeway OnRamp Metering, Delay Savings, and Diverge Bottleneck
Page 6Bus Rapid Transit Planning: Riverside and Worldwide (Part 2)
Page 8PATH Demonstrates Automated Bus Rapid Transit Technologies
Page 18PATH on Paper
continued on page 15
Serving as the Director of PATH for the past
six years has been a very rewarding experi-
ence for me. I took over immediately after
DEMO’97 from Professor Pravin Varaiya who had
led PATH during the years of the NAHSC (Nation-
al Automated Highway Systems Consortia). We
faced some very difficult times after the demise
of the NAHSC but were able to maintain our posi-
tion as the leading international research institute
in vehicle automation while greatly expanding
our role in traffic management and information.
Pat Conroy and later Hamed Benouar led this ini-
tiative and worked closely with Caltrans to apply
ITS to the states transportation problems.
I am very happy to turn over the reigns of PATH
to Professor Samer Madanat. He has had a very
successful career as transportation academic in
our Civil and Environmental Engineering’s Trans-
portation group. After obtaining his PhD from
MIT in 1988 he joined the faculty at Purdue Uni-
versity and finally joined the Berkeley faculty in
1996. His area of research is in transportation sys-
tems analysis and infrastructure management. He
has worked closely with both the US Department
of Transportation and Caltrans. He has an excit-
ing vision for PATH and the energy and enthusi-
asm to make it happen. I look forward to continue
working with Samer and to help him in any way
I can to make his vision come true.
A Word from Karl Hedrick A Word from Samer MadanatThe New PATH:
Moving Research into Field Operational Tests
Since its conception, PATH has played an impor-
tant role in the development of both the state and
the national Intelligent Transportation System
programs, participated in the founding of the
Intelligent Transportation Society of America and
conducted research under a number of state and
federally sponsored ITS research programs.
PATH gained international reputation in
the area of Advanced Vehicle Control and Safety
Systems (AVCSS). In the early 90s, PATH made
contributions to the National ITS Architecture.
From 1994 to 1998, PATH was a key member
of the National Automated Highway System
Consortium. Since 1998, PATH has participated
in Federal DOT’s Intelligent Vehicle Initiative
Programs. Throughout, PATH researchers made
fundamental advances in the application of
control and systems engineering methods to col-
lision warning and avoidance for cars, buses and
trucks.
PATH researchers have also contributed sig-
nificantly to research in the areas of Advanced
Traffic Management and Information Systems
(ATMIS). The list of accomplishments in this
area includes the development of state-of-the-
art Traffic Surveillance technologies, algorithms
A Fond Farewell to Karl Hedrick and a Welcome to Samer Madanat
California PATH Change of Leadership:
2 Intellimotion vol. 10 no. 3 2003
California PATH staff demonstrated the re-
sults of three current research projects at
the National Intelligent Vehicle Initiative
(IVI) Meeting held in Washington, DC from June
24-26, 2003. The technically successful demonstra-
tions, held at the Turner-Fairbanks Federal High-
way Administration (FHWA) Research Center, in
McLean, Virginia, won high praise and contributed
significantly to the IVI meeting. They illustrated
the professionalism and technical capabilities of
PATH teams, and promoted awareness of PATH
among peers and transportation organizations
around the world.
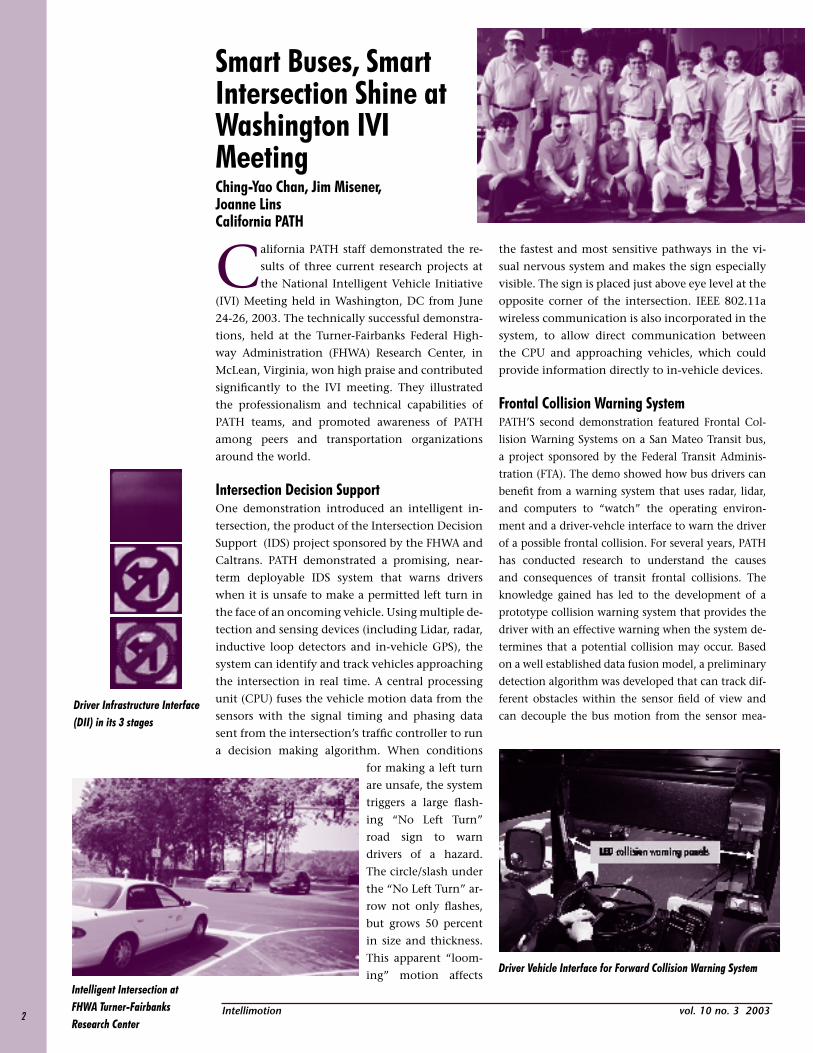
Intersection Decision SupportOne demonstration introduced an intelligent in-
tersection, the product of the Intersection Decision
Support (IDS) project sponsored by the FHWA and
Caltrans. PATH demonstrated a promising, near-
term deployable IDS system that warns drivers
when it is unsafe to make a permitted left turn in
the face of an oncoming vehicle. Using multiple de-
tection and sensing devices (including Lidar, radar,
inductive loop detectors and in-vehicle GPS), the
system can identify and track vehicles approaching
the intersection in real time. A central processing
unit (CPU) fuses the vehicle motion data from the
sensors with the signal timing and phasing data
sent from the intersection’s traffic controller to run
a decision making algorithm. When conditions
for making a left turn
are unsafe, the system
triggers a large flash-
ing “No Left Turn”
road sign to warn
drivers of a hazard.
The circle/slash under
the “No Left Turn” ar-
row not only flashes,
but grows 50 percent
in size and thickness.
This apparent “loom-
ing” motion affects
the fastest and most sensitive pathways in the vi-
sual nervous system and makes the sign especially
visible. The sign is placed just above eye level at the
opposite corner of the intersection. IEEE 802.11a
wireless communication is also incorporated in the
system, to allow direct communication between
the CPU and approaching vehicles, which could
provide information directly to in-vehicle devices.
Frontal Collision Warning SystemPATH’S second demonstration featured Frontal Col-
lision Warning Systems on a San Mateo Transit bus,
a project sponsored by the Federal Transit Adminis-
tration (FTA). The demo showed how bus drivers can
benefit from a warning system that uses radar, lidar,
and computers to “watch” the operating environ-
ment and a driver-vehcle interface to warn the driver
of a possible frontal collision. For several years, PATH
has conducted research to understand the causes
and consequences of transit frontal collisions. The
knowledge gained has led to the development of a
prototype collision warning system that provides the
driver with an effective warning when the system de-
termines that a potential collision may occur. Based
on a well established data fusion model, a preliminary
detection algorithm was developed that can track dif-
ferent obstacles within the sensor field of view and
can decouple the bus motion from the sensor mea-
Smart Buses, Smart Intersection Shine at Washington IVI MeetingChing-Yao Chan, Jim Misener, Joanne LinsCalifornia PATH
Driver Infrastructure Interface (DII) in its 3 stages
Intelligent Intersection at FHWA Turner-Fairbanks Research Center
Driver Vehicle Interface for Forward Collision Warning System

3Intellimotionvol. 10 no. 3 2003
surements. A warning algorithm was also developed
to incorporate a warning threshold synthesized from
the drivers’ normal braking behavior. When the sys-
tem determines that the distance to a vehicle or ob-
stacle in front of the bus is closing too rapidly, it lights
up two orange LED lightbars mounted on each side
of the windshield. The LED elements are illuminated
sequentially, giving the illusion of a moving bar of
light. The more imminent the collision, the longer
and faster the bar moves. This prototype has been put
into regular transit service for field testing, to verify if
the performance requirements developed under this
project are within a reasonable and reachable range.
PATH human factors researchers worked closely
with SamTrans drivers to understand their needs and
expectations and their operational environment, and
to define system boundaries. Drivers’ inputs and their
active involvement in brainstorming different design
options greatly contributed to the design of the proto-
type Driver Vehicle Interface (DVI). Through exten-
sive field tests and close interaction with bus drivers,
the system is being improved, and is now being inte-
grated with side collision warning system through a
joint effort by a California and Pennsylvania partner-
ship to provide an integrated solution for transit col-
lisions.
Precision Docking The third demo showcased precision docking, an es-
sential element of Bus Rapid Transit (BRT) operations.
The PATH system involves a variety of BRT technolo-
gies implemented on a 40-ft compressed natural gas
(CNG) bus, made possible by a FTA lane-assist project
and a Caltrans BRT development project.
In the precision docking demonstration, the bus
steered itself along a demonstration course represent-
ing the path a bus would take to approach a curb-
side bus stop. The bus was completely computer-con-
trolled, automatically following a series of magnets
that defined the course, and using a smooth speed
profile for its acceleration and braking.
A 90-meter-long path of magnetic markers was
placed on the road-
way surface, 1.2 me-
ters apart, to form a
reference trajectory.
Using PATH’s mag-
netic guidance sys-
tem and highly so-
phisticated signal
processing tech-
niques, an onboard
computer directs a
steering input to an
actuator on the steering column, which steers the bus
precisely along a desired trajectory, with a tolerance of
approximately one centimeter. The bus is also
equipped with throttle and brake control systems that
allow it to stop within ten centimeters of a designated
location. With these capabilities, buses can be auto-
mated to dock precisely at bus stops, thus providing
easy access and enhancing passenger safety. When
combined with a boarding platform that is at the
same level as the floor of the bus, precision docking
eliminates the need for stepping up into the bus,
which can be difficult for elderly or persons with mo-
bility impairments. It also eliminates the need for
wheelchair lifts or similar costly devices.
The PATH precision-docking bus provides highly
reliable and accurate performance. Several LED
lights on the dashboard inform the driver about
the status and readiness of the bus and the docking
systems. The driver can easily select between full
and partial automation, and make the transition
smoothly.
Because the guidance system eliminates driver
variation and driver error in steering, a guided ve-
hicle is capable of precise lane-keeping. The result
can be a significant reduction in accidents involv-
ing side collisions to transit buses, collisions at
bus stops, and passenger injuries during boarding,
alighting, bus starting, bus stopping and bus turn-
ing. Guided pathways could also reduce scrapes at
narrow toll booths and at the bus wash.
PATH’s technical staff has considerable experi-
ence and expertise in vehicle guidance systems
and safety applications. PATH was instrumental
in developing and deploying technology for the
National AHS Consortium 1997 Demonstration,
and many other international technology demon-
strations. In recent years, PATH technologies have
been deployed on snow removal equipment (snow-
plow and snowblower) under the sponsorship of
Caltrans.
Magnetometer and Magnets for PATH’s Magnetic Marker Reference System
Precison Docking Bus and Course
Gap Between Bus and Platform

4 Intellimotion vol. 10 no. 3 2003
On-ramp metering has been used to manage
freeway traffic congestion for decades. By
restricting inflows from on-ramps, meters
can improve travel conditions on the freeway
itself. But a metering scheme whereby commuter
delay is merely transferred from the freeway to its
on-ramps and surface streets can be counter-
productive. After all, it is the freeway that has more
space for storing delayed vehicles and queue
storage space is a commodity that should not be
squandered.
A scheme that actually reduces delay would
seem worthwhile. But much of the literature on
how metering might achieve these reductions is
not correct.
In this article simple analogies to freeway
systems are used to clarify some key facts about
ramp metering an delay savings. The analogies
reveal why delay reductions are not realized merely
by metering to increase travel speeds and flows on
freeway links within a system. Rather, the analogies
show that delay is diminished by metering in ways
that increase outflows from a freeway system. The
analogies are also used to explain why a metering
logic that increases outflows at one freeway site can
be very different from the logic needed at another
site. This point is emphasized by showing how
certain metering algorithms can actually reduce
outflows (and therefore increase delay) when the
freeway is plagued by a diverge bottleneck., like
those tat occur at congested off-ramps. Other
considerations important for managing traffic on
real-world freeway systems are also discussed in
this article.
Simple AnalogiesWe now consider issues of metering and delay in
the context of some very simple and hypothetical
queuing systems. These systems serve people exiting
a sports stadium. Their geometries, however, are
similar to those of freeways. Key points arising
from the stadium analogies will be used in later
sections to direct our discussion concerning real-
world freeway on-ramp metering schemes.
Figure 1(a) illustrates two links that merge to
a common stream close to the exit of our sports
stadium. Customers in the common stream are
served in a first-in, first-out fashion. The figure
thus illustrates a queuing system that is clearly
similar to a simple freeway system. Link A and
the common stream are analogous to a freeway
stretch and Link B to the freeway’s on-ramp. (The
dashed lines labeled “off-ramp” in the figure can
be ignored for now).
Let us suppose that during the rush to leave
the stadium after a game, customer arrival rates to
Links A and B exceed μ, the capacity of the stadium
exit. (Analogously, μ can be viewed as the capacity
of the freeway link just downstream of a merge).
Left unattended, the short stretch of common
stream upstream of the stadium exit soon becomes
completely queued: the flow in this queue is μ. The combined rate at which customers from Links
A and B advance to the common stream is then
µ as well. We can assume that queues propagate
backward on both these links.
The resulting customer delay in this system is
given by a queuing diagram like the one in Figure
1(b). This diagram is a means of displaying data
that might have actually been measured. The
Freeway Onramp Metering, Delay Savings, and the Diverge Bottleneck
Michael J. Cassidy, UC Berkeley

5Intellimotionvol. 10 no. 3 2003
Since customers from A now exit the stadium
at higher rates, they incur lower delay. But this
metering does not change the total delay. Figure
1(b) plainly shows that if the V- and D-curves are
unaltered, total delay is conserved: at best, delay
is merely re-distributed, with more now going
to customers from B. (We assume for now that
metering does not affect the demand for travel
displayed by the V-curve).
But costs arise if on-ramps are metered too
restrictively. Suppose Link B, and any sources
feeding Link A, are metered so restrictively that
customers pass through the stadium exit at a rate
lower than µ. We will assume this rate is 0.97µ,
to make the scheme analogous to one recently
proposed for freeway on-ramps (Jia et al, 2000).
Link A is completely unqueued; otherwise the exit
rate would be µ. Customers on Link A now enjoy
higher speeds (as compared with the unmetered
case) and flows on Link A can be higher as well. Yet
total delay in the system, and the duration of the
rush, both increase.continued on page 10
curve labeled V (for “virtual” departures) displays
the cumulative number of customers from both
links that would have liked to have exited the
stadium by time t. Since the V(t) are connected
with a smooth curve, its slopes are the rates at
which customers would have exited the stadium
in the absence of delay. This curve could have
been constructed by measuring, for each link,
all customer arrival times at some location(s)
upstream of all queues; by increasing each arrival
time by that customer’s free flow (or undelayed)
trip time from the measurement location to the
stadium exit; and by sorting the array of these
virtual departure times in ascending order and
then plotting them cumulatively. Notably, the
number of these customers to have actually exited
the stadium by time t is displayed by the curve
labeled D, for actual “departures.” (The dashed
lines in Figure 1(b) are explained later).
It follows that the shaded area in Figure 1(b)
is the total delay collectively incurred by all
customers in the system. In this example, the
queue(s) and delay persisted from time t1 to t2.
The only conjecture here comes from having
drawn the D-curve with a fixed slope µ during the
rush. This assumes that, if not impeded by some
queue from further downstream, customers pass
through the stadium exit at its capacity whenever
queues form in the system. This maximum rate is
independent of the number that are queued and of
the proportions of exiting customers supplied by
each link.
These assumptions seem reasonable when
customers are stadium patrons. On the highway,
there is considerable empirical evidence that
vehicles really do discharge from a so-called active
merge bottleneck (one characterized by queue
discharge rates that are not affected by traffic
conditions downstream) at a nearly constant rate.
Variations in these vehicular discharge flows are
relatively small (Cassidy and Bertini, 1999; Bertini
and Cassidy, 2002; Mauch and Cassidy, 2002;
Persaud, et al, 1998; Hall and Agyemang-Duah,
1991).
Suppose a stadium employee acts as a meter by
further restricting the rates customers from Link
B merge into the common stream, to favor those
from A (see Figure 1(a)). Travel speeds and flows
then increase on Link A. This is because queued
flows on Link A will be µ, less the rate entering the
common stream from Link B. This effect has been
measured in real-world freeway traffic (Cassidy and
Mauch, 2001).
Off-Ramp
Capacity =
Link A
Link B
meter
Stadium Exit (Capacity = µ)
Diagram of simple queing System
Common Stream
Off-Ramp
Figure 1a
Shaded Area = Total Delay in System
Figure 1b
Example queing diagram for the system
rushTime, t
0.97
DV
Cummulative
Number of
Customers
t2t1
congested period

6 Intellimotion vol. 10 no. 3 2003
Fare Collection & BoardingTwo methods for reducing passenger dwell time
(the time passengers spend on the bus) and pas-
senger inconvenience are: reducing on-board fare
collection time, and eliminating on-board pay-
ment. Eleven reviewed cases have adopted or plan
to adopt at least one of the two strategies.
“Exact change” fare collection is inconvenient
for both passengers and bus operators: lots of coins
are needed, and keeping cash on board generates
security issues. Prepaid fare methods, such as
seasonal passes, prevalued cards, and smart cards
read by electronic card readers, have been found
to reduce collection time in Charlotte, Santa Clara
County, Adelaide, Bogotá, Nagoya, and Curitiba.
Eliminating on-board payment reduces pas-
senger dwell time, since it enables passengers to
board and leave by all the doors. The simplest strat-
egy is to create a free zone for short trips within
a small area, (e.g., downtown Orlando’s Lymmo).
Another is to build passenger-loading platforms
where passengers pay at a turnstile before entering
the loading area, as in Curitiba’s staffed tube. A
third is the proof-of-payment collection or honor
system used in Charlotte, Eugene, Hartford, Ot-
tawa, and Adelaide. There, passengers board with a
pass or validated ticket, which they show to inspec-
tors at random checks.
Passenger Information SystemOne of the earmarks of a high-quality transit sys-
tem is the intelligible design of its passenger in-
formation system. Integrated visual and audible
displays in vehicles and along the corridor inform
passengers about basic service characteristics: the
system map, stop names, names and destinations
for all routes serving each stop, span of service, fre-
quency of service during peak and off-peak hours,
and a map to other connections. A further advance
is real-time information supported by AVL technol-
ogy that can display the arrival time of the next
bus at a stop.
Service Levels The most important characteristic of BRT service
is high frequency, whether on fixed or headway-
based schedules. Almost all sixteen reviewed cases
provide headways of less than 5 minutes during
peak hours (90 seconds in Curitiba), and around
10 minutes during off-peak hours. Feeder services
often run on headways of less than 15-30 minutes,
timed to meet the main service with reduced-cost
or free transfer. The service span basically runs
from 5AM until midnight (24 hours a day in Santa
Clara).
Fare PolicyA reasonable fare structure should target the aver-
age income level and consumption ability of its cus-
tomers. A BRT system should consider other traffic
modes’ service levels and fare structures when set-
ting its fare policy, since it won’t be competitive
unless it either provides superior service levels at
the same price or equivalent service levels at lower
prices. Coordinating fare policy with other local
services, such as rail transit or feeder services, can
benefit customers riding both systems and increase
the usage of BRT systems.
Complementary land use policyBuilding a BRT system usually means property ac-
quisition and the relocation of some residents. The
impact on all affected properties, whether commer-
cial, residential or industrial, needs to be assessed.
Land-use regulations in residential areas may need
to be changed to establish cut-through paths link-
ing cul-de-sacs, so bicyclists and walkers may have
direct access to transit. A good site for a station will
already have some commercial activity nearby and
a solid base of transit ridership. For example, Otta-
wa has put some BRT stations in shopping malls, so
that passengers reach the malls directly by transit.
Bus Rapid Transit Planning: Riverside and Worldwide (Part 2)Ying-Hsiu Jill Liu, UC Berkeley; Jim Misener, Gerald Stone, California PATH

7Intellimotionvol. 10 no. 3 2003
Financial StrategyAll eight US BRT cases have received (or will re-
ceive) grants from Federal, state, and local govern-
ments, while some of the non-US BRT cases have
brought the private sector into some segment of a
BRT system delivery process. In Charlotte, Federal
funds paid for vehicles and technology, while state
and local funds paid for the costs of project design,
right-of-way acquisition, and construction.
The private sector participates in BRT proj-
ects in several ways: in Orlando, there are service
partnerships with local agencies; in Curitiba, pri-
vate sector contracts are awarded for billeting or
operations, while public companies pay for the in-
frastructure, planning and control process. Other
innovative methods to save system expenses are:
• Quebec: eliminating some off-peak service to
support more intensive peak services
• Hartford: speeding-up overall construction pro-
cesses by the Design-Build method
• Ottawa: Outside-In approach in building the
system. Here, segments of a transit system are first
built in areas where land is easily acquired, to get
public support for continuous funding. These lands
BenefitsRidership Travel Time Travel Speed Passenger
Wait TimePassengerDwell Time
OtherBenefits
Case
Eugene, OR
Hartford,Connecticut
Santa Clara County, CA
Charlotte, NC
Los Angeles, CA
Orlando, FL
Miami, FL
Pittsburgh, PA
n/a Reduction by 20% in 2001 (from 27 minutes to21 minutes) with future goal of 40% by 2015
15% reduction (withlow-floor design)
Estimated riderships in 2020: 8,800average weekday ; 3,700 daily new riders
Reduction from 35 min to 25 min 25 mph at some grade crossings, and 30-45 mphon the exclusive grade-separated ROW throughNewington, West Hartford and Hartford.
28,000 daily riders Reduction by 25%-40%
55% since startup (from 10,138 monthlyin 1/99 to 15,687 in 1/2000
Estimated savings ranging from 7-14 minutes
Total ridership increase by 27% (from 13,500to 17,100) with 3/1 new riderships
25% travel time saving and 33% reduction ofdelay by traffic signals.
14-30 mph; overall speed increase by 23% (17mph); eastbound 20% and westbound 27%
Reduction from 10-12min to 4-6 min
20 sec Almost no bus bunching(outperforming the time-pointbased local service)
Ridership doubled (4,000 weekly passengers) n/a Lower travel speed (only 33%) due to toomany stops
24 boarding per hour (ridership in corridorncreased 49% on weekdays, 69% Sundays,130% Saturdays)
10% time saving (reduction from20-18 min
18 mph (max express)
Average daily 8,000 riders with projected10,000 new daily by 2005
Up to 26 minutes for morning peak direction trips, andsomewhat less time savings in the afternoon peqk.
Up to 55 mph
Ottawa, OnatarioCanada
Quebec, Canada
Montreal, Canada
Adelaide, Australia
Brisbane, SoutheastQueenlands, Australia
Curitiba, Brazil
Bogotá, Columbia
Nagoya
100,000 daily passengers 30-50 min/hr 89% user satisfaction
n/a n/a n/a
35% increase after first year. 25 mph (up to 100 kph) 99% schedule adherence
Annual increase 70%; daily passenger27,000
40-50% time savings (40 min to 20-25 min) 100 kph
60,000 trips per day 80 kph on Busway; 50 kph throughBusway Stations
Land values of suburbs nearBusway Stations increased20.86% (Holland Park West)3 months after implementation.
1.3 million passengers/day (70% use BRT) express 32 kph, bi-articulated stoppingevery 500 meteters 20 kph
20 sec 27 million fewer auto trips/year30% less fuel/capita= 55% of private trips in city
600,000 passengers/day Savings of 10 min on express route (30% reduction) 26.2 kph 2 seconds with24 people
93% reduction in fatalities fromtraffic accidents; 40% drop insome air pollutants; 88%acceptance level
36,000 passengers/day 16-19 kph (originally 15 kph)
are normally in the suburbs. Then, the system can
start service on the periphery while building down-
town segments.
• Miami: adoption of minibuses to reduce operat-
ing costs.
Benefits BRT benefits include increased total ridership in the
planned corridors, reduced travel time via higher
speed, reduced passenger wait time, and reduced
passenger dwell time. Some BRT systems attract rid-
ers from conventional bus services that share the
same markets, some get riders by enticing them
from their cars (Curitiba, Ottawa, etc.), and some
get new riders from surrounding neighborhoods
with good feeder services. Other positive impacts
of BRT may be increases in land value (Brisbane), in
customer satisfaction increases (Ottawa), reduced
fuel consumption (Curitiba), reduced air pollution,
and reduced accident rates.
Cost EffectivenessVarious indices can be used to assess the cost-ef-
fectiveness of BRT systems, such as total cost, cost continued on page 14

8 Intellimotion vol. 10 no. 3 2003
PATH researchers demonstrated some
of the key technologies for automated
bus rapid transit (A-BRT) services for
invited visitors in San Diego on the week-
end of August 23-24. This demonstration
continued a distinguished PATH tradition
of demonstrating the most advanced ITS ca-
pabilities under realistic conditions on full-
scale vehicles, and true to that tradition it
exceeded the expectations of the visitors.
PATH has equipped three transit buses with the
sensing, actuation, communication and computa-
tion systems needed to enable them to operate
under completely automatic control. At the same
time, these buses were equipped with a specially-
designed driver-vehicle interface (DVI) system to
show how easy it is for the driver to interact with
the automation systems, to transfer back and forth
between normal manual driving and automation
and to initiate automated maneuvers such as lane
changing on the highway and precision docking
at local bus stops. The emphasis of this demon-
stration was showing the realistic opportunities
for implementation of the A-BRT technologies to
improve transit service and economics. Since the
demonstration buses were two standard-size (40
foot) buses powered by compressed natural gas
(CNG) and one 60-foot articulated bus powered by
a diesel engine, it was also possible to show how
the automation technologies can harmonize the
performance of these very different vehicles so that
they can operate close together in an electroni-
cally-coupled “virtual train”.
The transit service functions that were demon-
strated included:
• Precision docking of a bus at two
different platforms, one represent-
ing an in-line platform at a bus ter-
minal and the other representing a
curb-side platform requiring an ap-
proach with a lane change ahead of
a line of parked cars. In both cases,
the bus stopped with a gap of less
than an inch between the bus floor and the plat-
form, making it easy for one of visitors to roll on
and off the bus in a wheelchair. Both the steering
and the stopping of the bus were controlled au-
tomatically, although initial deployments of this
service would probably only use the automated
steering function, leaving the full attention of
the driver for watching out for pedestrians and
passengers.
• Automatic lane-keeping (or lane assist) of the
buses operating in a line-haul mode on the I-15
HOV lanes. This demonstration showed the abil-
ity of the automatic steering system to keep the
bus centered accurately over the lane, while pro-
viding a smooth ride for the passengers. This is an
important capability to enable buses to operate in
narrow lanes where
right of way is costly
or unavailable. The
driver was able to
switch back and forth
between automatic
and manual steering
at will, showing how
a driver could over-
ride the automatic
system when neces-
sary.
• Automatic lane-changing while operating on
the highway, initiated by the driver pressing a
button on the DVI. In order for buses to be able
to enter or exit from an A-BRT bus-way, or from
off-line stations, it is necessary for them to be
able to change lanes automatically. This part of
the demonstration showed the ability to execute
PATH Demonstrates Automated Bus Rapid Transit TechnologiesSteven E. Shladover
Precision Docking Demonstration
Lane Assist Demonstration

9Intellimotionvol. 10 no. 3 2003
this maneuver repeatedly, with a minimum of ef-
fort required by the driver.
• Fully automated bus driving. The buses were
operated in both low speed (docking) and high
speed (highway driving) conditions with fully
automatic steering and speed control. Once the
driver transferred control to the automated sys-
tem, he did not need to do anything else until
reaching the other end of the HOV lanes, where
he regained control. This capability indicated the
potential for future operations without requiring
a driver to be on every bus operating along a ded-
icated, protected bus-way. However, the technol-
ogy is not yet sufficiently mature and fault-toler-
ant to make it possible for our drivers to leave
the driver’s seat (except in the limited case of the
low-speed precision docking maneuver).
• Automated “virtual train” of buses. The diesel
bus was electronically “coupled” behind one of
the CNG buses for a run down the length of the
I-15 HOV lanes (8 miles), making use of a “WiFi”
wireless data link, combined with forward-look-
ing lidar and radar sensors to detect the gap and
speed difference between the buses. The buses
ran at separations of 40 m and 15 m to each other
and smoothly performed the automatic transi-
tions between these two different target separa-
tions. The operations at the 15 m separation
showed the potential for automated bus trains to
carry very high passenger volumes in the high-
est- density corridors. With that size separation
between the buses in the “virtual train”, and with
a long enough separation between consecutive
bus trains to ensure that no failure would involve
more than one bus train, a sequence of three-bus
trains could provide 70,000 seats per hour in one
lane, which is competitive with the highest-vol-
ume rail transit services.
The visitors who participated in this demonstra-
tion included members of the Board of Directors
of ITS America and the Program Steering Commit-
tee of the Cooperative Vehicle-Highway Automa-
tion Systems (CVHAS) pooled-fund project, as well
as the attendees of the TRB meeting on “Urban
& Community Transit – The Role for Automated
BRT”. The reactions of the visitors were very enthu-
siastic. For example, Neil Schuster, the President
and CEO of ITS America, said,
“The San Diego demo went very well and I know our
members enjoyed it; this is the fourth time I’ve seen the
technology in action, and each time I’m amazed - now
I can tell friends I rode in a city bus, going down a real
highway at speed, too close to a bus in front of us for
a human driver to attempt. For me, the expression on
someone’s face the first time they comprehend they are
in a moving vehicle without a driver is priceless!...what
a great morning!”
The discussions in the TRB meeting that imme-
diately followed the demonstration were strongly
influenced by many comments indicating that
the demonstration changed people’s minds about
what was possible and opened their eyes to new
possibilities for using vehicle automation technol-
ogy to improve transit operations. That, of course,
is one of the strongest reasons for investing the ef-
fort to present such a demonstration.
The efforts were considerable and involved ex-
tensive time spent away from home by a team of
fifteen PATH research and development engineers,
working under the leadership of Dr. Ching-Yao
Chan. Their work schedule was governed by the
limited availability of the I-15 HOV facility for test-
ing in preparation for the demonstration. All of the
preparatory testing needed to be conducted during
the four weekends prior to the demonstration (8
am to 8 pm each day) and during the weeknights
in the two weeks immediately before the demon-
stration (8 pm to midnight). With outstanding
cooperation and support from Caltrans District 11
and Division of Research and Innovation (DRI) col-
leagues, extremely rapid progress was made during
that final month of preparations for the demon-
stration.
Driver Vehicle Interface (DVI)
Close Following Bus Platoon Demonstration

10 Intellimotion vol. 10 no. 3 2003
This is made clear in Figure 1(b). Since the
maximum slope of the D-curve drops to 0.97µ, as
shown by one of the dashed lines, the shaded area
grows. The rush, which formerly ended at time t2,
ends later. The start of the rush could occur even
earlier then t1.
Conversely, increasing the slope of the D-curve
by maximizing outflows from a system decreases
delay. Increasing cumulative outflow can be an
important objective in any attempt to reduce
commuter delay via metering. This objective is
suitable not only for the simple system in Figure
1(a), but for freeway systems that include many
on- and off-ramps as well.
Many engineers, unaware of the above,
erroneously use higher vehicle speeds and flows
on freeway links within a system as evidence
that a metering scheme has decreased delay
(e.g. MnDOT, 2001). The potential flaw in this
reasoning is evident in the previous discussion.
If we view the hypothetical system in Figure 1(a)
as a freeway merge, with Link B as its metered
on-ramp, our metering efforts discussed thus far
have promoted higher speeds and flows on Link A
because restrictions were eased there by lowering
the inflows from B. But this did not diminish
delay. The overly-restrictive scheme even increased
delay!
Some engineers have been quick to assume that
higher capacities can be sustained at an active
merge bottleneck by using ramp metering (e.g.
Papageorgiou and Kotsialos, 2000). Evidence of
this is still preliminary however.
Now suppose that an off-ramp is located along
Link A and that we continue to meter Link B
with the overly-restrictive scheme. In this case,
metering B to increase A’s flow could mean higher
outflows from this off-ramp because customers
might now get to the off-ramp with less impedance
(see Daganzo, 1996). This would reduce delay if the
increased off-ramp flow increased the total outflow
from the system.
But suppose that the common stream has an
“off-ramp” just beyond the stadium exit and that
this off-ramp’s capacity is µo, with µo < µ; (see again Figure 1(a)). Suppose too that the proportion
of vehicles entering the common stream that are
bound for this off-ramp is αo. Since vehicles in
the common stream are served first-in, first-out,
the flow that approaches this off-ramp can never
exceed μo/αo; under this (maximum) flow, vehicles
use the off-ramp at its capacity, µo.
If the flow directed to the off-ramp exceeds the
ramp’s capacity; e.g., if αo•0.97µ > µo, the off-
ramp would be unable to absorb this flow. It would
become an active diverge bottleneck: a queue
would form in the common stream and propagate
backward past the stadium exit and onto Link A.
The flow leaving the stadium would become μo/αo, and this flow would be lower than 0.97µ. Delay
in the system would increase; further; Figure 1(b)
shows that the shaded area in the queuing diagram
would grow.
The above illustration makes clear that discharge
flows through the bottleneck are sensitive to αo.
Suppose the proportion of vehicles bound for the
downstream off-ramp and originating from Link
A, αoA, equaled the analogous proportion from
B, αoB. In this case, metering cannot increase
flows through the diverge because changing the
metering rate (for B) would not change αo. However, metering can affect the diverge
bottleneck (and the delay it creates) if the
scheme can affect the αo. This can occur for αoA ≠ αoB. Our present metering scheme would, for
example, promote lower outflows from the diverge
bottleneck if αoA > αoB. This is because metering B
would foster higher αo in the common stream.
Metering for Diverge Bottlenecks on FreewaysWe have shown that decreased delay comes if
metering increases outflows from a system, that
higher travel speeds and flows within a system are
not evidence of higher outflows, and that reducing αo can increase outflows from diverge bottlenecks.
There is a key similarity between the hypothetical
diverge bottleneck just described and those on
actual freeways.
Freeways have multiple lanes, which afford
vehicle over-taking maneuvers. So, freeway links
continued from page 5Ramp Metering

11Intellimotionvol. 10 no. 3 2003
upstream of diverge bottlenecks do not necessarily
serve vehicles in a strictly first-in, first-out fashion.
Vehicles might therefore approach a diverge
bottleneck at rates greater than μo/αo, where µo is
again the off-ramp capacity.
Yet traffic can be impeded by diverge bottlenecks
in ways that are strikingly similar to our analogy.
First, non-exiting vehicles in the freeway shoulder
lane can be constrained by the off-ramp’s queue.
Second, this queue can spread to adjacent freeway
lanes and entrap vehicles there when commuters
bound for the congested off-ramp decelerate before
squeezing into the shoulder lane.
Failure to appreciate this fact can aggravate
the problems of freeway diverge bottlenecks. To
elaborate on this point, we first note that the
overly-restrictive metering strategy in our earlier
analogy is akin to so-called demand-capacity
metering schemes that have been around for
decades (see, for example, Wattleworth, 1964).
With theses schemes, each on-ramp is controlled
to keep flows entering the downstream freeway
link from exceeding some target flow; the target
typically approaches ore equals the links estimated
capacity.
This kind of metering can be ill advised for a
diverge bottleneck. This is because on-ramps not
for upstream of the bottleneck may be metered
restrictively, even though drivers entering the
freeway at these locations are not likely headed
for the problematic off-ramp. (Commute distances
on freeways tend to be long). So, thanks to
this metering, drivers who are bound for the
problematic ramp and who enter the freeway
many miles upstream (at on-ramps that may or
may note be metered) can travel the freeway with
less impedance.
By metering commuters not destined for
the problematic off-ramp to favor those who
are headed there, the demand-capacity scheme
promotes higher αo on the freeway. Consequently,
the scheme may not prevent queues from forming
on the freeway (just as the metering scheme in our
analogy did not prevent queuing on Link A and
on the common stream when our hypothetical
diverge became an active bottleneck. Further the
scheme can cause bottleneck outflow to diminish
and commuter delay to increase.
Further Issues in Metering for Freeway Diverge BottlenecksHaving seen how demand-capacity metering can
be problematic for diverge bottlenecks, we next
discuss other well-known metering algorithms
that share this limitation. This will be followed by
discussion of traffic management policies better
suited to diverge bottlenecks.
The ALINEA metering algorithm (Papageorgiou
and Kotsialos, 2000) can create problems at a
freeway diverge or exacerbate problems that
already exist there. Under ALINEA’s “traffic
responsive” logic, an on-ramp’s metering rate at
some time t is adjusted from its previous rate based
on freeway occupancy measured by detectors
downstream. At each time step, the metering
rate is made more (or less) restrictive than before
if the measured occupancy is above (or below)
some specified target. The target is typically the
occupancy corresponding to capacity flow on the
downstream link.
Suppose ALINEA was deployed on the freeway
stretch shown in Figure 2. When the off-ramp
near the downstream end becomes congested, a
queue (shown with shading) forms and propagates
backward past two neighboring on-ramps
upstream. The detectors just downstream of each
on-ramp then measure occupancies above their
targets, because queued occupancies exceed those
corresponding to capacity flows. Consequently,
more restrictive metering rates are implemented at
these on-ramps.
However, few if any vehicles entering on these
nearby on-ramps are headed for the congested off-
ramp, because commute distances on a freeway
are usually longer than a few miles. By metering
inflows from these nearby on-ramps more
restrictively than from on-ramps further upstream,
the scheme can promote higher αo on the freeway
stretch. This reduces outflows from the bottleneck
and makes the freeway queue upstream even more
dense. The detectors then measure even higher
occupancies: a downward spiral may thus occur,
marked by more restrictive metering at the nearby
on-ramps that intensifies queuing and increases
delay. This state of affairs might continue for some
time.
Variants of ALINEA’s logic, including the
algorithms known as METALINE (Papageorgiou
and Kotsialos, 2000) and SWARM (NET, 1996),
On-ramp
Detectors Detectors
CongestedOff-ramp
On-ramp
A few Miles
Figure 2Hypothetical freeway site
continued on next page

12 Intellimotion vol. 10 no. 3 2003
function with “coordinated logic,” whereby
neighboring on-ramps are grouped together
and each ramp’s metering rate is assigned
so that the burden of moderating freeway
inflows is shared by the entire group. But
this can still foster higher αo upstream of
a diverge bottleneck. Even an entire group
of on-ramps may not serve a high proportion of
traffic bound for the problematic off-ramp.
Even if not subjected to metering schemes like
those above, diverge bottlenecks can create huge
delay (Muñoz and Daganzo, 2000; Cassidy, et al,
2002). Fortunately there are cases whereby different
on-ramp metering logic can be effective in dealing
with this type of bottleneck. For example, one
might coordinate the metering rates at multiple
on-ramps in ways that deliberately reduce αo. On-ramps serving many vehicles destined for
the problematic off-ramp could be metered more
restrictively than others (see Lovell and Daganzo
2001). Implementing such a metering scheme can
be difficult, since it requires estimates of demands
for freeway travel by origin and destination. In
the future, it may be possible to identify vehicles
bound for a problematic off-ramp and meter these
vehicles differently from other on-ramp traffic
(Daganzo et al 2001). However, the necessary
technology has yet to be tested.
It should also be noted that a diverge bottleneck
might be suitably addressed using a freeway
traffic management strategy other than on-ramp
metering. In many cases, the simplest solution for
such a bottleneck would be to increase the rate at
which vehicles can exit the off-ramp. This would
commonly entail treating bottlenecks on nearby
surface streets, since these are frequent causes of
off-ramp queues. Other strategies for managing
diverge bottlenecks and mitigating other sources
of delay are offered in Daganzo et al 2001. Suitable
schemes will vary from site to site. Sometimes
doing nothing may be preferable to implementing
an ill-suited scheme.ConclusionsWe have shown that commuter delay can be
reduced by metering to promote higher freeway
outflows. This can sometimes be done by limiting
the αo upstream of diverge bottlenecks. Greater
outflows can also be realized if meters keep a
freeway queue from propagating beyond an off-
ramp and starving it of flow.
Sometimes delay can be reduced if metering
alters travel behavior; for example if it motivates
some commuters to change their routes. Those
who switch routes, however, often incur more
delay than the had previously: after all, they had
previously viewed their new routes as inferior.
Moreover, commuters who divert from a freeway
may increase delay on surface streets. (Traffic
subjected to these added delays could include city
buses and their many passengers). So, evidence of
commuter route diversion does not necessarily
mean reduced delay. Unfortunately, the full effects
of such diversion can be difficult to evaluate,
because these effects are often spread over many
neighboring surface streets.
Field-testing a scheme’s effectiveness in
increasing freeway outflows is a much simpler
matter. Such tests need not focus on vehicle speeds
and flows on freeway links. Instead, counts can be
made of the vehicles exiting at each freeway egress
point, that is, at each and every off-ramp in the
system and at the freeway link farthest downstream.
These counts should be recorded at specified time
t spanning the rush, and intervals of 5 minutes or
so should generally suffice. The counts for each
and every ith egress point can then be summed
together at each of these t, D(t) = ∑iDi(t), and the
cumulative curve of these summed D can be
plotted over time.
One can construct such a cumulative curve
before a scheme’s deployment and determine the
area under the curve bounded by the start and end
times of the rush. The same kind of curve can be
measured after the scheme’s installation, and the
area determined for the comparable time period.
The difference in these areas is an indicator of
the scheme’s performance. This idea is implicit in
some work regarding dynamic traffic assignment
for roadway networks (Lin and Cao, 1997).
Without higher freeway outflows, and absent
favorable changes in travel behavior, on-ramp
metering can at best only transfer traveler delay
from the freeway to on-ramps and surface streets.
Although there might at times be advantages
to this, the transfer can result in queue storage
problems.
The literature says surprisingly little on this
problem. Even less is written about the added com-
muter delays created by overly restrictive metering
schemes, or by schemes that promote higher αo upstream of diverge bottlenecks. For example,
most reports promoting or critiquing demand-
capacity schemes or algorithms like ALINEA make
no mention of their limitations in addressing
diverge bottlenecks. Perhaps this is a reason meter-
ing schemes are sometimes designed without due
consideration for local freeway conditions; (see
Cassidy, 2002 for an illustration of this).

13Intellimotionvol. 10 no. 3 2003
In some instances, bottlenecks are relatively
easy to identify from measured traffic data. In
other cases, sources of delay are not so readily
distinguished. Some diverge bottlenecks, for
example, can be difficult to diagnose because of
other geometric inhomogeneities nearby. In these
cases, bottlenecks can usually be identified with
the aid of high resolution methods for processing
traffic measurements. Such methods might include
suitably scaled curves of cumulative vehicle count
vs time (Cassidy and Windover 1996). These kinds
of data plots can reveal much about the sources of
delay and other details of freeway traffic.
Making such diagnoses is important, since
no single metering logic can suitably address all
conditions that arise on different freeways. So
a metering scheme, or any traffic management
strategy, should be designed only after the freeway
of interest has been carefully examined and its
bottlenecks identified. For a freeway with a diverge
bottleneck, adhering to this sequence can save
commuter delay. Not adhering to this sequence
can be disastrous.
ReferencesBertini, R.L. and Cassidy, M.J. (2002) Some observed queue discharge features at a freeway bottleneck downstream of a merge. Transpn. Res. 36A, 683-697. Cassidy, M.J. and J.R. Windover. (1995) Methodology for Assessing Dynamics of Freeway Traffic Flow. Transpn. Res. Rec. 1484, 73-79.Cassidy, M.J. and Bertini, R.L. (1999) Some traffic features at freeway bottlenecks. Transpn. Res. 33B, 25-42.Cassidy, M.J. and Mauch, M (2001) An observed traffic pattern in long freeway queues. Transpn. Res. 35A, 143-156.Cassidy, M.J. (2002) Critique of a freeway On-ramp metering scheme and broader related issues. Report 2002-4, Institute of Transportation Studies, University of California, Berkeley.Cassidy, M.J., Anani, S.B. and Haigwood, J.M. (2002) Study of freeway traffic near an off-ramp. Transpn. Res. 36A, 563-572.Cassidy, M.J. and Rudjananakanoknad, J. (2002) Study of traffic at a freeway merge and roles for ramp metering. California PATH Working Paper UCB-ITS-PWP-2002-2, California PATH Program, University of California, Berkeley.
Dagazo, C.F. (1996) The nature of highway gridlock and how to prevent it. In: Lesort, (Ed.), Transpn. and Traffic Theory, Elsevier, Amsterdam, pp 629-646.Daganzo, C.F., Laval, J. and Muñoz (2001) Ten Strategies for Freeway Congestion Mitigation with Advanced Technologies. California PATH Research Report UCB-ITS-PRR-2002-3, California PATH Program, University of California, Berkeley.Hall, F.L. and Agyemang-Duah, K. (1991) Freeway capacity drop and the definition of capacity. Transpn Res. Rec. 1320, 91-98 (see especially Tables 2 and 3).Jia, Z., Varaia, P., Chen, C., Petty, K. and Skabardonis, A. (2000) Congestion, excess demand and effective capacity in California freeways. Report prepared by the PeMS Development Group, University of California, Berkeley, available at http://transacct.eecs.berkeley.eduLighthill, M.J. and Whitham, G.B. (1955) On kinematic waves I: flood movement in long rivers. II: a theory of traffic flow on long crowded roads. Procs. Royal Soc. A229, 281-345.Lin, W.H. and Cao, J.M. (1997) A system optimal dymanic traffic assignment model with limited system control. Presented at the 76th Annual Meeting of the Transportation Research Board, Washington, D.C.Lovell, D. and Daganzo, C.F. (2000) Access control on networks with unique O-D paths. Transpn. Res. 34B, 185-202. Mauch, M. and Cassidy, M.J. (2002) Freeway traffic oscillations: observations and predictions. In: Taylor, M.A.P. (Ed.), Transpn. and Traffic Theory, Elsevier, Amsterdam, pp 653-674.Minnesota Department of Transportation, MnDOT (2001) Twin cities ramp evaluation. Executive Summary, Cambridge Systematics, Inc. available at http://www.dot.state.mn.us/rampmeterstudyMuñoz, J.C. and Daganzo, C.F. (2000) The bottleneck mechanism at a freeway diverge. Transpn. Res. 36A, 483-506.NET (1996) System wide adaptive ramp metering algorithm – high level design. Final Report prepared by NET for Caltrans and FHWA.Papageorgiou, M. and Kotsialos, A. (2000) Freeway ramp metering: an overview. Procs. IEEE Intelligent Transpn. Systs. Dearborne, MI, pp. 228-238.Persaud, B., Yagar, S. and Brownlee, R. (1998) Exploration of the breakdown phenomenon in freeway traffic. Transpn Res. Rec. 1634, 64-69 (see especially Figure 1).Wattleworth, J.A. (1964) System demand-capacity analysis on the inbound Gulf Freeway. Texas Transpn. Inst. Res. Rept. 24-8.
14 Intellimotion vol. 10 no. 3 2003
per rider, subsidy per rider, cost per passenger mile,
passenger per vehicle, passenger per vehicle hour,
fare box recovery rate, benefit-cost ratio, etc. The
measurement methods used in the cases reviewed
varied considerably from one to another.
Other IssuesSince most reviewed cases are successful BRT imple-
mentations, some of them naturally are calling for
future extensions (Curitiba, Ottawa, Adelaide, Los
Angeles, Miami, Nagoya, and Bogotá). Future ex-
tensions involve many complex issues, for exam-
ple, funding sources, cost-benefit analysis, technol-
ogy options, operation and maintenance, public
acceptance, multi-agency and multi-jurisdictional
coordination over the corridor, service cuts of
conventional services, potential markets, etc. Ade-
laide’s government plans to use a mixture of a new
alignment and rail alignment instead of a guided
busway on a new extension because the original O-
Bahn technology is no longer feasible from a cost-
benefit perspective. Similarly, Nagoya’s future plan
doubts the necessity for an expensive guideway
system given uncertain markets and development.
On the other hand, future plans for mixed traffic
type BRTs like Los Angeles’ call for exclusive bus
lanes on arterial segments where feasible, within
limits dictated by predicted congestion and delay.
Even a thriving BRT system can’t always grow us-
ing its original technology. Moreover, the multi-
agency cooperation needed to ensure level of ser-
vice, service coverage, and fare policy can involve
very complicated issues when system extensions
are planned.
continued from page 7Get on the Mailing List!FAX, mail or e-mail us the following information for a free subscription to Intellimotion: Name & Title Address E-mail address
If you wish to be notified by email when next issue is ready online, and not receive a paper copy, please let us know.
Please mention the Intellimotion mailing list. See the last page for our address and fax number.
Due to mailing costs we can no longer send paper copies inter-nationally. Please send us your email and we will notify you when the next issue is ready online.
ITS DecisionAnalysis of Implementation of
Intelligent Transportation Systems
www.path.berkeley.edu/itsdecision
PATH Bibliographic DatabaseThe PATH Bibliographic Database, the world’s largest on Intelligent Transportation Systems is now accessible at:
http://www4.nationalacademies.org/trb/tris.nsf/web/path
It currently lists over 25,000 bibliographic records with abstracts.Also available is the monthly PATH Recent Additions list, a collection of 150-200 recent citations to the Database at:
http://www.lib.berkeley.edu/ITSL/newbooks.html
BRT Worldwide

15Intellimotionvol. 10 no. 3 2003
for Traffic State estimation, improved Traffic Flow
theories, intelligent onramp metering control
schemes, new models for traveler route choice in
the presence of advanced traffic information, and
other state-of-the-art developments.
Based on this solid foundation of accomplish-
ments, the new thrust at PATH has now shifted to
the validation of these research products through
Field Operational Testing (FOT). This represents
the logical next step in moving the results of the
research toward deployment. Until now, most
of the validation of PATH research has been per-
formed through simulation or controlled experi-
ments. While these are helpful, they cannot be a
substitute for testing new technologies or strategies
in the real world.
To reflect this new thrust on FOT, PATH under-
went a reorganization during the summer of 2003.
The previous division of PATH between AVCSS and
ATMIS research was not appropriate to the new
research emphasis, where experts in sensing and
communication technologies, transportation sci-
ence, behavioral research, economics and policy
work collaboratively in the planning, design and
implementation of Field Operational Tests. The
objective of the new structure is to emphasize an
application problem orientation, rather than a
technology orientation.
The new PATH is organized along four programs:
• Traffic Operations Research
• Transit Operations Research
• Transportation Safety Research
• Policy and Behavioral Research.
In the following sections, we describe the
research agendas of these four programs. We place
special emphasis on new research initiatives, and
on the collaborative aspects of these research
activities. We also highlight current or planned
FOT efforts.
Traffic OperationsProgram Leader: Alex Skabardonis
The PATH traffic operations research program fo-
cuses on advancing the state-of-the-art in traffic
management and traveler information systems,
while producing results that can be implemented
in the field. The research is undertaken by a state-
wide team of fifteen faculty and more than 40
graduate students and staff working closely with
the program sponsors. Currently there are more
than 25 active research efforts including develop-
ment and testing of surveillance technologies,
algorithms for data processing, fusion and analysis,
development of analytical and simulation tech-
niques for performance measurement, simulation
and visualization tools for impact analysis and
evaluation, and formulation and testing of ad-
vanced operational strategies for managing conges-
tion and reducing commuter delays.
Examples of Traffic Operations Research Include: The Performance Measurement System or
PeMS. Development and implementation of sys-
tems to provide real-time traffic information to
motorists in various forms from changeable mes-
sage signs to personalized itineraries via cellular
phones.
Formulation and demonstration of control
strategies to alleviate bottlenecks at freeway merg-
ing areas, adaptive signal control strategies on
urban arterials that also provide priority to transit
vehicles, and systems that facilitate the coordina-
tion of operating agencies to minimize the re-
sponse time to incidents.
In addition, unique laboratories and test
beds have been created to provide the data and
operating environments to study traffic flow
dynamics and test improved strategies in real-
world conditions. These facilities and data are
being used by researchers worldwide.
continued from page 1
PATH Reorganization
TDS2 Testbed I-405 Irvine (top)Berkeley Highway Lab (lower left)UC Irvine ATMS Testbed (lower right)

16 Intellimotion vol. 10 no. 3 2003
Transit OperationsProgram Leader: Wei-Bin Zhang
Working with a large numbers of transit agencies,
built upon solid technical expertise and through
fundamental research as well as Field Operational
Tests, the PATH transit research program addresses
real-world problems and brings in advanced, yet
practical solutions. The following examples high-
light the ways in which PATH is working on
improving Public Transportation Systems:
Bus Rapid Transit (BRT): is a new form of transit
involving innovative planning and advanced tech-
nologies that improve the efficiency of operating
mass-transit bus routes. PATH’s research in BRT
covers a wide range of subject areas including
planning, evaluation and technology develop-
ment. As an example, PATH is also working on an
adaptive signal priority concept that allows busses
to smoothly travel through intersections while
minimizing the disturbance of the flow of cross
traffic. Building on its Advanced Vehicle Control
System’s research, PATH developed lane assist and
precision docking systems allowing transit busses
to be operated on a narrow lane and to dock at bus
stops with rail-like accuracy. To demonstrate the
most advanced BRT concepts, PATH developed and
demonstrated an Automated BRT system on I-15
using two automatically controlled busses in San
Diego in August 2003 (see article on page 8).
On-Demand Responsive Transit (DRT): and para-
transit services provide critical links for transit
dependant riders to gain mobility, but have cur-
rently been less cost effective for transit agencies
to operate. PATH addresses factors influencing pro-
ductivity and operating costs of DRT by develop-
ing approaches for improving the transit agency’s
cost of operation.
Frontal Collision Warning System (FWCS): Under the
Transit Intelligent Vehicles Initiative (IVI) program
sponsored by Federal Transit Administration, PATH
is working with transit agencies, the California
Department of Transportation and a bus manu-
facturer to develop requirement specifications for
a frontal collision warning system. As part of this
study, PATH has developed prototype frontal col-
lision warning systems that work within urban
settings where the driving environment is more
complex than in highway settings.
SamTrans Bus Fitted with Forward Collision Warning System (upper
right)
Sensors Tested (left to right) Ultrasonic, Radar, Lidar
Demand Responsive Transit Vehicle
Potential Automated Close Following Bus Rapid Transit Scenario

17Intellimotionvol. 10 no. 3 2003
Transportation SafetyProgram Leader: Jim Misener
The PATH Transportation Safety Research Program’s
objective is to provide products that can be tested
and deployed within a short time frame using a
combination of advanced technology and human
factors research. PATH research has a proud heri-
tage of vehicle-infrastructure collaboration, and its
many enabling technologies and capacities make
it tangible. This research ranges from implementa-
tion of wireless, sensing technologies; to human
factors and driver cognition expertise to unlock
the “Science of Driving”; through in-the-field
hardware, software and systems application of
vehicle, vehicle-highway, and driver experiments.
PATH’s aim is to develop first-class applied
safety research products, developed in collabora-
tion with its customers and aimed at near-term
deployment in order to make streets and highways
safer. PATH has many projects and research inter-
ests dealing with intersection safety, snow removal
equipment operation, modeling of driver actions,
elderly drivers, at-grade rail crossing and pedes-
trian safety.
One of the largest safety efforts is the inter-
section decision support (or IDS) project explores
a promising, near-term deployable vehicle-infra-
structure cooperative system to aid drivers in
identifying when it is unsafe to make a permit-
ted left turn in the face of an oncoming vehicle.
Using multiple detection and sensing devices
(including lidar, radar, inductive loop detectors
and in-vehicle GPS), the system can identify and
track vehicles approaching the intersection in real
time. Combined with vehicle motion data, signal
timing and phasing data sent from the traffic
controller are used to run a decision-making algo-
rithm. When conditions are unsafe for making a
permitted left turn, a dynamic “no left turn” sign
pulses (or “looms”) and displays a warning to the
driver. In order to illustrate an alternate path to
deployment, dedicated short-range wireless com-
munication has also been incorporated to allow
direct communication between our roadside and
approaching vehicles, thus creating a “smart”
intersection that can provide information directly
to in-vehicle devices.
Policy & Behavioral ResearchProgram Leader: Susan Shaheen
management; carsharing; elderly driving behavior
and attitudes; institutional approaches to inter-
jurisdictional system management; measur-
ing impacts of graduated licensing laws
in California; an evaluation of California’s
chassis network; shared-use, low-speed
modes linked to transit, including e-bikes
and Segway Human Transporters; innova-
tive methods to improve transit access and
reliability, such as intelligent bus priority
lanes; and planning/evaluation of Caltrans’
Innovative Corridors Initiative.
The Policy and Behavioral Research program focus-
es on understanding the role, response, and impacts
of advanced transportation technologies. It brings
together a variety of theories, methodologies, and
disciplines in answering applied policy, planning,
and implementation questions related to trans-
portation technology use, markets, and response.
Disciplines and approaches include: engineering,
planning, economics, systems and policy analysis,
psychology, sociology, business, and marketing.
Research in this area seeks to address transporta-
tion issues related to congestion, air quality, and
energy and land use.
Projects involve faculty, staff, and students
from across the State. These include: smart parking
Rail Crossing (upper left)Rotary Snowblower (above) Instrumented Intersection (lower left)
Segway Human Transporter: Possible Low-speed Transit Access Vehicle

18 Intellimotion vol. 10 no. 3 2003
PATH publications (which include research reports, working papers, technical memoranda, and techni-cal notes) can be obtained from:
Institute of Transportation Studies Publications OfficeUniversity of California109 McLaughlin HallBerkeley, CA 94720-1720
510-642-3558, FAX: 510-642-1246
http://www.its.berkeley.edu/publications/publications.html
A searchable database of PATH publications is available via the PATH World Wide Web site at:http://www.path.berkeley.edu
PATH on PaperAn Updated List of Recent PATH Sponsored Research Publications
All papers available online at: http://www.path.berkeley.edu/PATH/Publications/index.html
Deployment and Evaluation of Real-Time Vehicle Reidentification from an Operations Perspective, Benjamin Coifman, Pravin Varaiya, 54 pp, $15 UCB-ITS-PRR-2002-37
Benchmarking Best Practices of Demand Respon-sive Transit Systems, Maged Dessouky, Kurt Palmer, Tamer Abdelmaguid, 64 pp, $15 UCB-ITS-PRR-2003-1
Evaluation of the Effects of Intelligent Cruise Control Vehicles in Mixed Traffic, Petros Ioannou, 64 pp, $15 UCB-ITS-PRR-2003-2
Evaluation of the ACC Vehicles in Mixed Traffic: Lane Change Effects and Sensitivity Analysis, Petros Ioan-nou, Margareta Stefanovic, 32 pp, $10 UCB-ITS-PRR-2003-3
Enhanced AHS Safety Through the Integration of Vehicle Control and Communication, J.K. Hedrick, R. Sengupta, Q. Xu, Y. Kang, C. Lee, 54 pp, $15 UCB-ITS-PRR-2003-4
Safety Performance and Robustness of Heavy Vehicle AVCS, Paul Yih, Krishna Satyan, J. Christian Gerdes, 99 pp, $15 UCB-ITS-PRR-2003-5
The Automated Highway System/Street Interface: Final Report, Randolph Hall, Chinan Chin, Nishad Gadgil, 99 pp, $15 UCB-ITS-PRR-2003-6
SmartBRT: A Set of Planning, Analysis and Evaluation Tools for Bus Rapid Transit: Final Report Year 1 of 2, Tunde Balvanyos, Wes Bethel, Yonnel Gardes, Natalia Kourjanskaia, Hongchao Liu, Jim Misener, Joao Sousa, Joel VanderWerf, Wenbin Wei, 91 pp, $15 UCB-ITS-PRR-2003-7
Evaluation of Magnetic Markers as a Position Refer-ence System for Ground Vehicle Guidance and Con-trol, Ching-Yao Chan, Han-Shue Tan, 26 pp, $10 UCB-ITS-PRR-2003-8
Bay Area Simulation and Ramp Metering Study - Year 2 Report, Yonnel Gardes, Amy Kim, Dolf May, 108 pp, $20 UCB-ITS-PRR-2003-9
Lateral Control of Heavy Vehicles for Automated Sys-tems: Final Report for MOU 313, Pushkar Hingwe, Jen-Yu Wang, Meihua Tai, Masayoshi Tomizuka, 73 pp, $15 UCB-ITS-PRR-2003-10
Develop Precision Docking Function for Bus Opera-tion, Han-Shue Tan, 32 pp, $10 UCB-ITS-PRR-2003-11
Experimental Verification of Discretely Variable Com-pression Braking Control for Heavy Duty Vehicles, Ardalan Vahidi, Anna G. Stefanopoulou, Phil Farias, Tsu Chin Tsao, 50 pp, $10 UCB-ITS-PRR-2003-12
Development of Integrated Meso/Microscale Traffic Simulation Software for Testing Fault Detection and Handling Algorithms in AHS: Final Report, Roberto Horowitz, 34 pp, $10 UCB-ITS-PRR-2003-13
Validation of Daganzo’s Behavioral Theory of Multi-Lane Traffic Flow: Final Report, James H. Banks, Mohammad R. Amin, Michael Cassidy, Koohong Chung, 93 pp, $15 UCB-ITS-PRR-2003-14
Parameter Estimation and Supervisory Techniques for Robust Longitudinal Control of Heavy Vehicles, Maria Druzhinina, Lasse Moklegaard, Anna G. Ste-fanopoulou, 34 pp, $10 UCB-ITS-PRR-2003-15
Parameter Estimation and Command Modification for Longitudinal Control of Heavy Vehicles, Hong S. Bae, J. Christian Gerdes, 33 pp, $10, UCB-ITS-PRR-2003-16
Loop Detector Data Collection and Travel Time Measurement in the Berkeley Highway Laboratory, Adolf D. May, Randall Cayford, Ben Coifman, Greg Merritt, 93 pp, $15 UCB-ITS-PRR-2003-17
Institutional Aspects of Multi-Agency Transit Opera-tions, Mark A. Miller, Amy Lam, 78 pp, $15 UCB-ITS-PRR-2003-18
Definition and Evaluation of Bus and Truck Automa-tion Operations Concepts: Final Report, H.-S. Jacob Taso, Jan L. Botha, Aleksandr A. Zabyshny and Jen-nifer E. Day, 104 pp, $20 UCB-ITS-PRR-2003-19
U.S. Shared-use Vehicle Survey Findings: Opportuni-ties and Obstacles for Carsharing and Station Car Growth, Susan A. Shaheen, Mollyanne Meyn, Kamill Wipyewski, 19 pp, $5 UCB-ITS-PRR-2003-20
Davis Smart Mobility Model Project: Initial Scoping and Planning Study, Susan A. Shaheen, Rachel S. Finson, 39 pp, $10 UCB-ITS-PRR-2003-21

19Intellimotionvol. 10 no. 3 2003
Freeway Performance Measurement System (PeMS), Chao Chen, 216 pp, $30 UCB-ITS-PRR-2003-22
TRACER: In-vehicle, GPS-based, Wireless Technology for Traffic Surveillance and Management, M.G. Mc-Nally, J.E. Marca, C.R. Rindt, A.M. Koos, 80 pp, $15 UCB-ITS-PRR-2003-23
Robust Lateral Control of Heavy Duty Vehicles: Final Report, Meihua Tai, Masayoshi Tomizuka, 80 pp, $15 UCB-ITS-PRR-2003-24
The State of Cellular Probes, Youngbin Yim, 40 pp, $10 UCB-ITS-PRR-2003-25
Vehicle Lateral Control Under Fault in Front and/or Rear Sensors, Guang Lu, Jihua Huang, Masayoshi Tomizuka, 50 pp, $10 UCB-ITS-PRR-2003-26
Enhanced AHS Safety Through the Integration of Vehicle Control and Communication, J.K. Hedrick, R. Sengupta, Q. Xu, Y. Kang, C. Lee, 106 pp., $20 UCB-ITS-PRR-2003-27
University of California, Davis Long-Range Develop-ment Plan: A Davis Smart Mobility Model, Susan Shaheen, Caroline J. Rodier, Rachel S. Finson, 184 pp, $25 UCB-ITS-PRR-2003-28
Development of Requirement Specifications for Tran-sit Frontal Collision Warning System, Xiqin Wang, Joanne Lins, Ching-Yao Chan, Scott Johnston, Kun Zhou, Aaron Steinfeld, Matt Hanson, Wei-Bin Zhang, 84 pp, $15 UCB-ITS-PRR-2003-29
Relationships Among Urban Freeway Accidents, Traf-fic Flow, Weather, and Lighting Conditions, Thomas F. Golob, Wilfred W. Recker, 25 pp, $5 UCB-ITS-PWP-2003-1
Evaluation of Potential ITS Strategies Under Non-Re-current Congestion Using Microscopic Simulation, Lianyu Chu, Henry X. Liu, Will Recker, Steve Hague, 52 pp, $15 UCB-ITS-PWP-2003-2
Multi-Sensor Traffic Data Fusion, ZuWhan Kim, A. Skabardonis, 17 pp, $5 UCB-ITS-PWP-2003-3
Integrated Smart Feeder/Shuttle Bus Service, Avishai Ceder, Youngbin Yim, 54 pp, $15 UCB-ITS-PWP-2003-4
Traveler Response to Innovative Personalized De-mand-Responsive Transit in the San Francisco Bay Area, Asad J. Khattak, Youngbin Yim, 36 pp, $10 UCB-ITS-PWP-2003-5
Investigation of Traveler Information and Related Travel Behavior in the San Francisco Bay Area, Asad J. Khattak, Felipe Targa, Youngbin Yim, 30 pp, $10 UCB-ITS-PWP-2003-6
Institutional, Organizational and Market Aspects of Successful ITS Deployment: A Case Study Analysis, Patrick Conroy, 31 pp, $10 UCB-ITS-PWP-2003-7
Implementing a Kalman Filtering Dynamic O-D Al-gorithm within Paramics-Analysing Quadstone Won Efforts for the Dynamic O-D Estimation Problem, Reinaldo C. Garcia, 19 pp, $5 UCB-ITS-PWP-2003-8
A Tool to Evaluate the Safety Effects of Changes in Freeway Traffic Flow, Thomas F. Golob, Wilfred W. Recker, Veronica M. Alvarez, 25 pp, $5 UCB-ITS-PWP-2003-9
On the Numerical Treatment of Moving Bottlenecks, Carlos Daganzo, Jorge A. Laval, 29 pp, $10 UCB-ITS-PWP-2003-10
Estimation of Truck Traffic Volume from Single Loop Detectors Using Lane-to-Lane Speed Correlation, Jaimyoung Kwon, Pravin Varaiya, Alexander Skabar-donis, 29 pp, $10 UCB-ITS-PWP-2003-11
A Method for Relating Type of Crash to Traffic Flow Characteristics on Urban Freeways, Thomas F. Golob, Wilfred W. Recker, 36 pp, $10 UCB-ITS-PWP-2003-12
Safety Aspects of Freeway Weaving Sections, Thomas F. Golob, Wilfred W. Recker, Veronica M. Alvarez, 24 pp, $5 UCB-ITS-PWP-2003-13
An Enhancement to Speed Estimation with Single Loops, Wei-Hua Lin, Joy Dahlgren, Hong Huo, 21 pp, $5 UCB-ITS-PWP-2003-14

NON-PROFIT ORGANIZATIONU.S. POSTAGE PAID
UNIVERSITY OF CALIFORNIA
University of California
California PATH PublicationsRichmond Field Station, Bldg. 452Berkeley, CA 94720-3580
Address Service Requested
1-18482-23929-44
Intellimotion is a quarterly newsletter edited and designed by the California PATH Publications Department.
Publications Manager Bill Stone Editor Gerald Stone Multimedia Specialist Jay Sullivan
For more information or to offer comments about this newsletter, please write, call, fax or e-mail:
PATH Publications1357 South 46th Street, Bldg. 452
Richmond, CA 94804-4648Tel: 510/231-9495 FAX: 510/231-9565e-mail: [email protected]
http://www.path.berkeley.edu
Graphics by Authors, Bill Stone and Jay Sullivan photos by Bill Stone, Jay Sullivan, Kalynda Stone and Gerald Stone, Segway Photo page 16 courtesy of Segway
Partners for Advanced Transit and Highways
Director Samer MadanatCaltrans Management Liasion Homar Noroozi
Primary funding provided by:
©2003 California PATH. All rights reserved. Unless permission is grant-ed, this material shall not be reproduced, stored in a retrieval system, or transmitted in any form or by any means, electronic, mechanical, photocopying, recording or otherwise.
ISSN-1061-4311
Printed on recycled paper
Member