
California Essential Habitat Connectivity Project
51
1 California Essential Habitat Connectivity Project
Transcript of California Essential Habitat Connectivity Project

1
California Essential Habitat Connectivity Project

2
Planning for Habitat Connectivity
The intent behind this project was to plan for the continuance of species and their ability to move across the landscape to access resources. Connectivity also provides for the maintenance of ecological processes.

3
Why? Nature needs room to roam. Connected habitat reserves provide for:
Movement by individuals to access resources in home rangeSeasonal migrationImmigration and emigration within metapopulations, allowing for demographic rescueGene flow. Areas with genetic variability area more likely to facilitate evolution as the environment changes.Recolonization after local extinctionPopulation movement in response to disasters or changing climateEcological processes such as disturbance, predator-prey interactions, and seed dispersal
Here are some of the reasons why connected habitat reserves are needed.

4
How? Habitat connectivity can take many forms.
Habitat connectivity can take many forms. One goal of connectivity planning is to provide structural connectivity, simply linking two large natural areas (top left illustration). The ultimate goal is to allow for functional connectivity for any given species, which means there is habitat within the connection for breeding, feeding, or shelter.
Functional connectivity may allow access to an important water body (top right), provide multiple corridor options for species (bottom left), and provide protection for large habitat areas via buffer zones (bottom right).
The California Essential Habitat Connectivity Project considered both structural and functional connectivity.
Buffer Guidelines:http://www.unl.edu/nac/bufferguidelines/guidelines/2_biodiversity/4.html
5
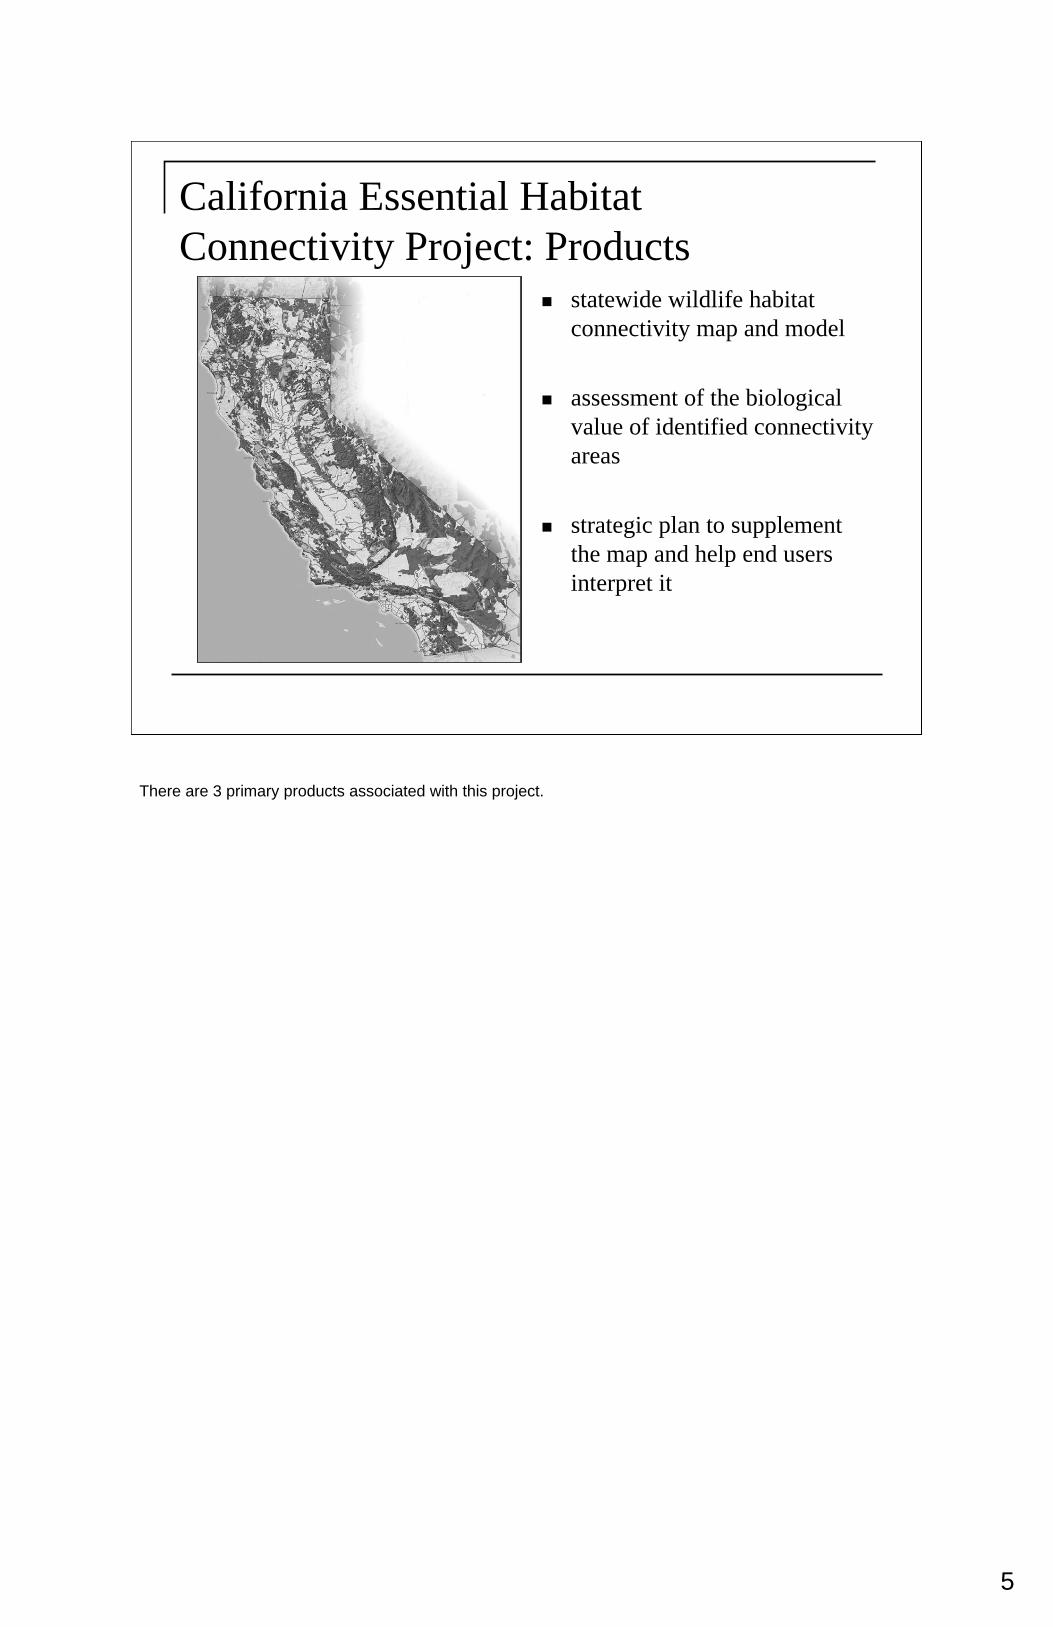
California Essential Habitat Connectivity Project: Products
statewide wildlife habitat connectivity map and model
assessment of the biological value of identified connectivity areas
strategic plan to supplement the map and help end users interpret it
There are 3 primary products associated with this project.

6
California Essential Habitat Connectivity Project: Goals

7
Produce a statewide assessment of essential habitat connectivity that:
complies or is consistent with recent legislation.
AB 2785 (2008) requires CDFG to map essential wildlife corridors and habitat linkages.
SB 85 (2007) requires CDFG to develop vegetation and wildlife habitat mapping standards.

8
Produce a statewide assessment of essential habitat connectivity that:
complies or is consistent with recent legislation.
Section 6001 of the Safe Accountable Flexible Efficient Transportation Equity Act (SAFETEA-LU) of 2005 requires that environmental resource impacts be considered in the transportation planning process.
Avoidance, minimization and mitigation measures must be identified.
9
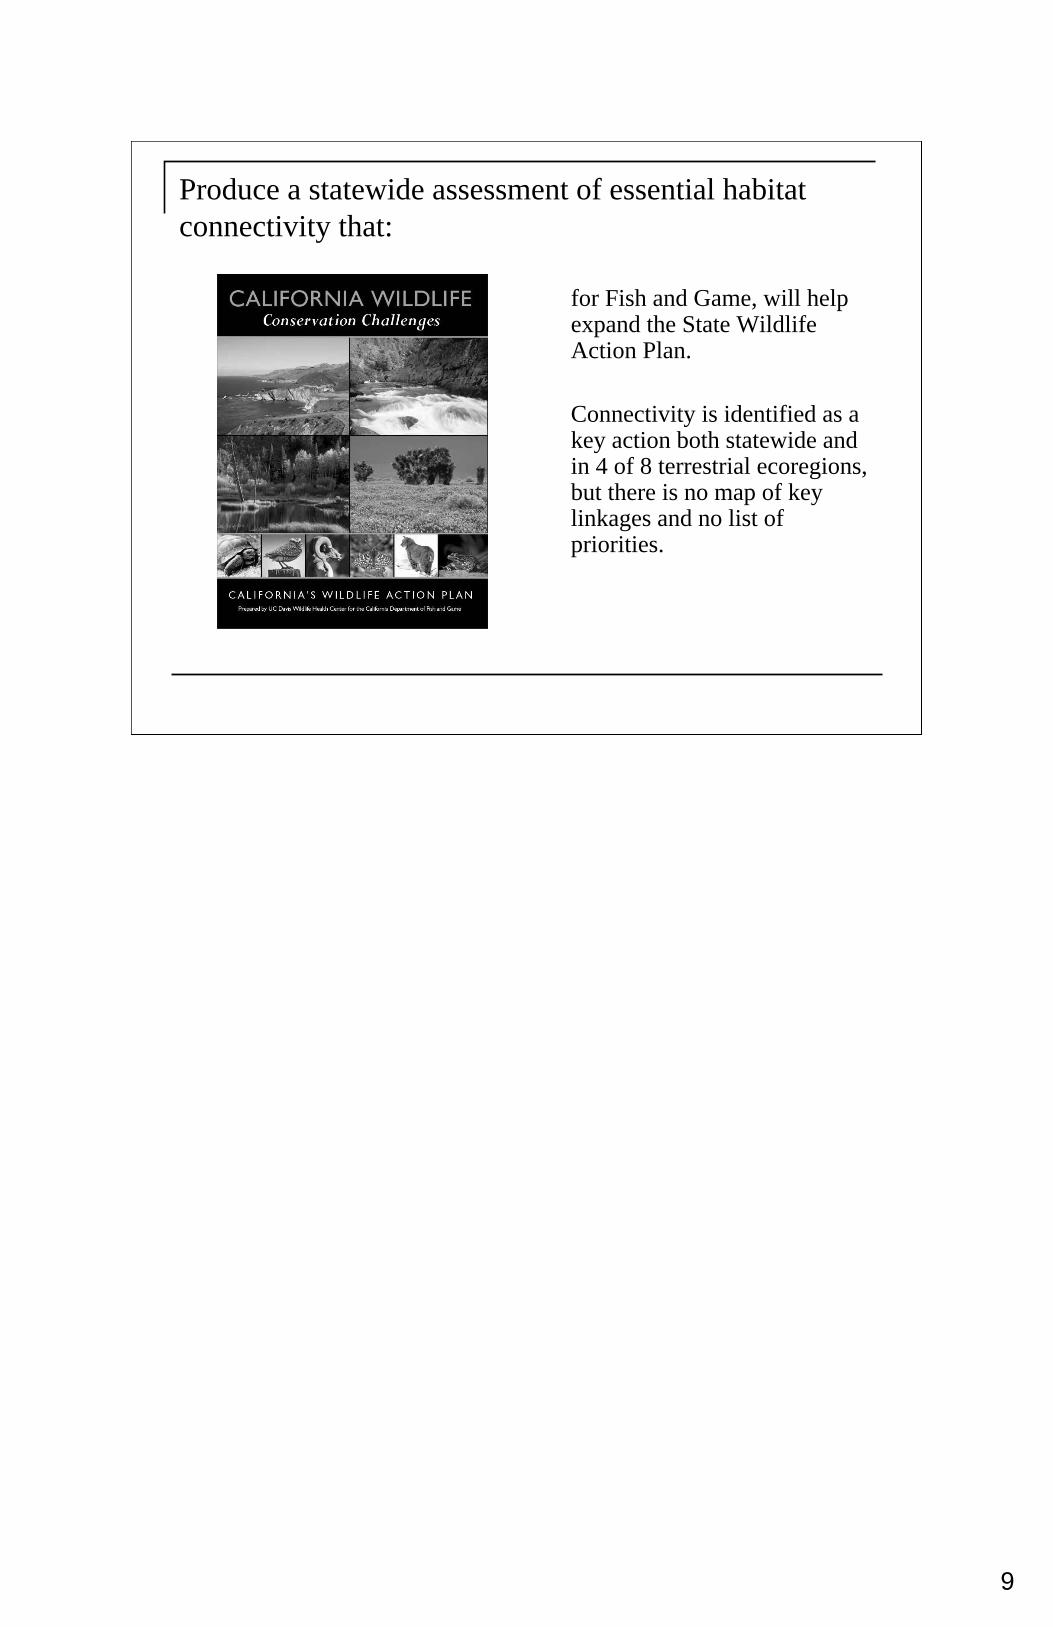
Produce a statewide assessment of essential habitat connectivity that:
for Fish and Game, will help expand the State Wildlife Action Plan.
Connectivity is identified as a key action both statewide and in 4 of 8 terrestrial ecoregions, but there is no map of key linkages and no list of priorities.

10
Produce a statewide assessment of essential habitat connectivity that:
for Caltrans and regional transportation agencies, will inform policy and provide standardized data for integrating transportation planning with connectivity planning.
11
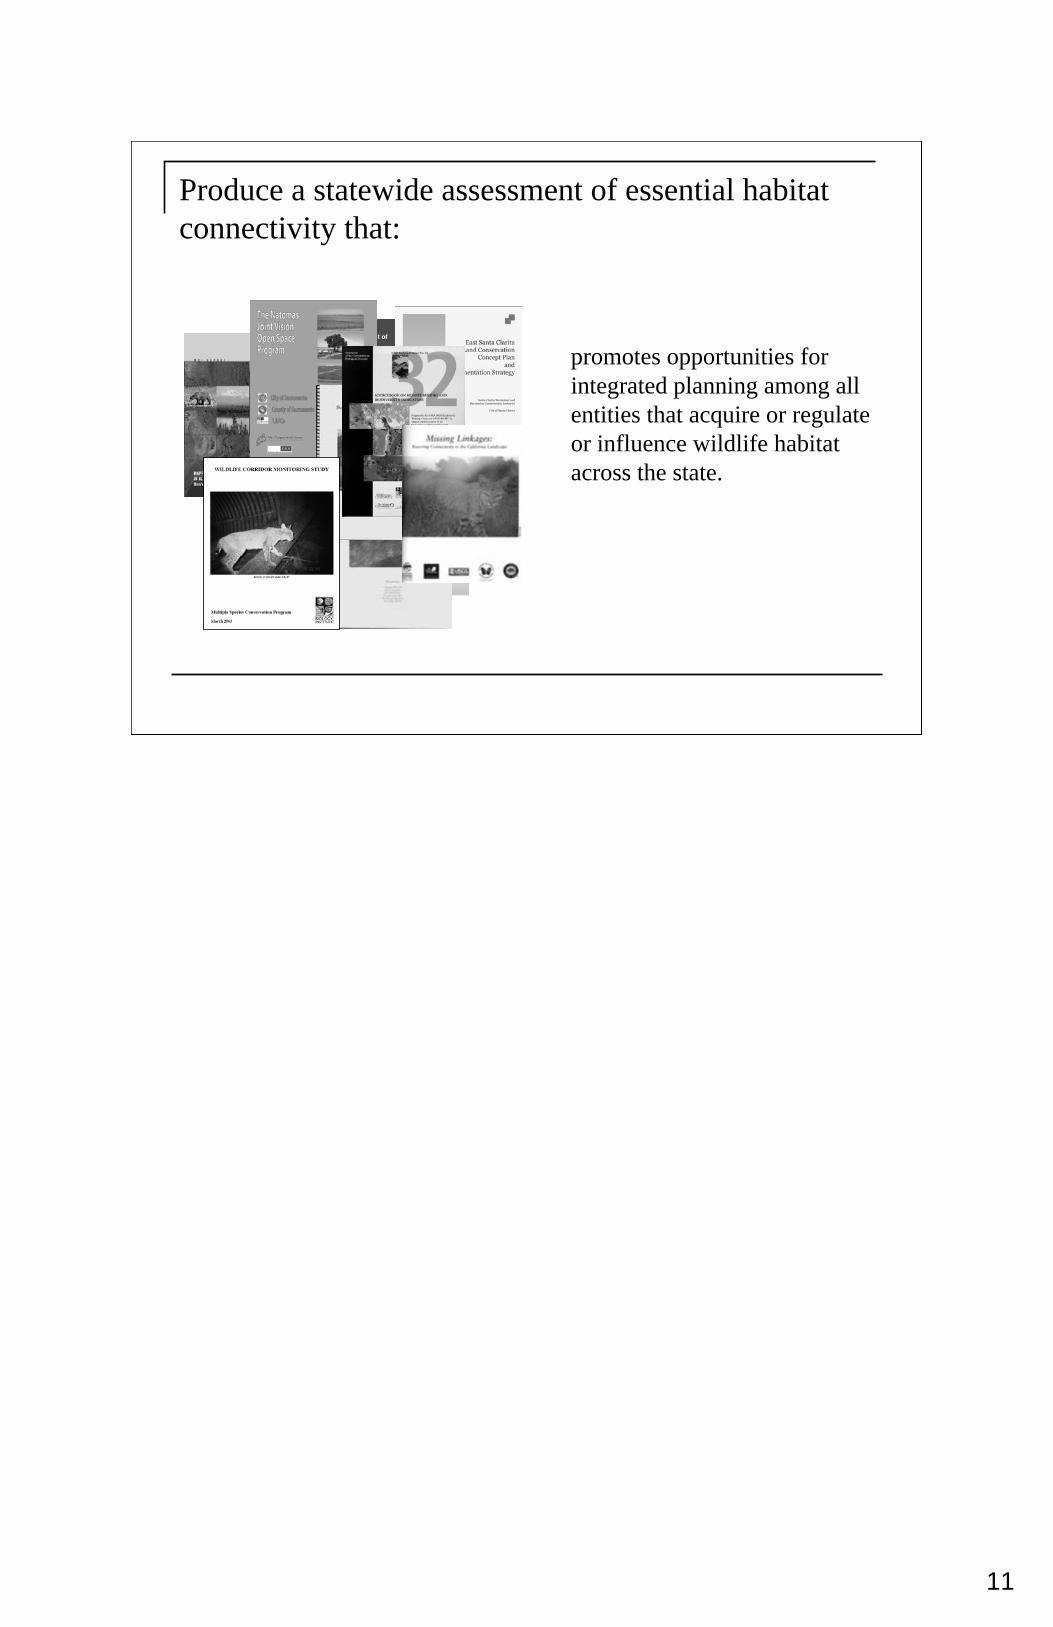
Produce a statewide assessment of essential habitat connectivity that:
promotes opportunities for integrated planning among all entities that acquire or regulate or influence wildlife habitat across the state.
12
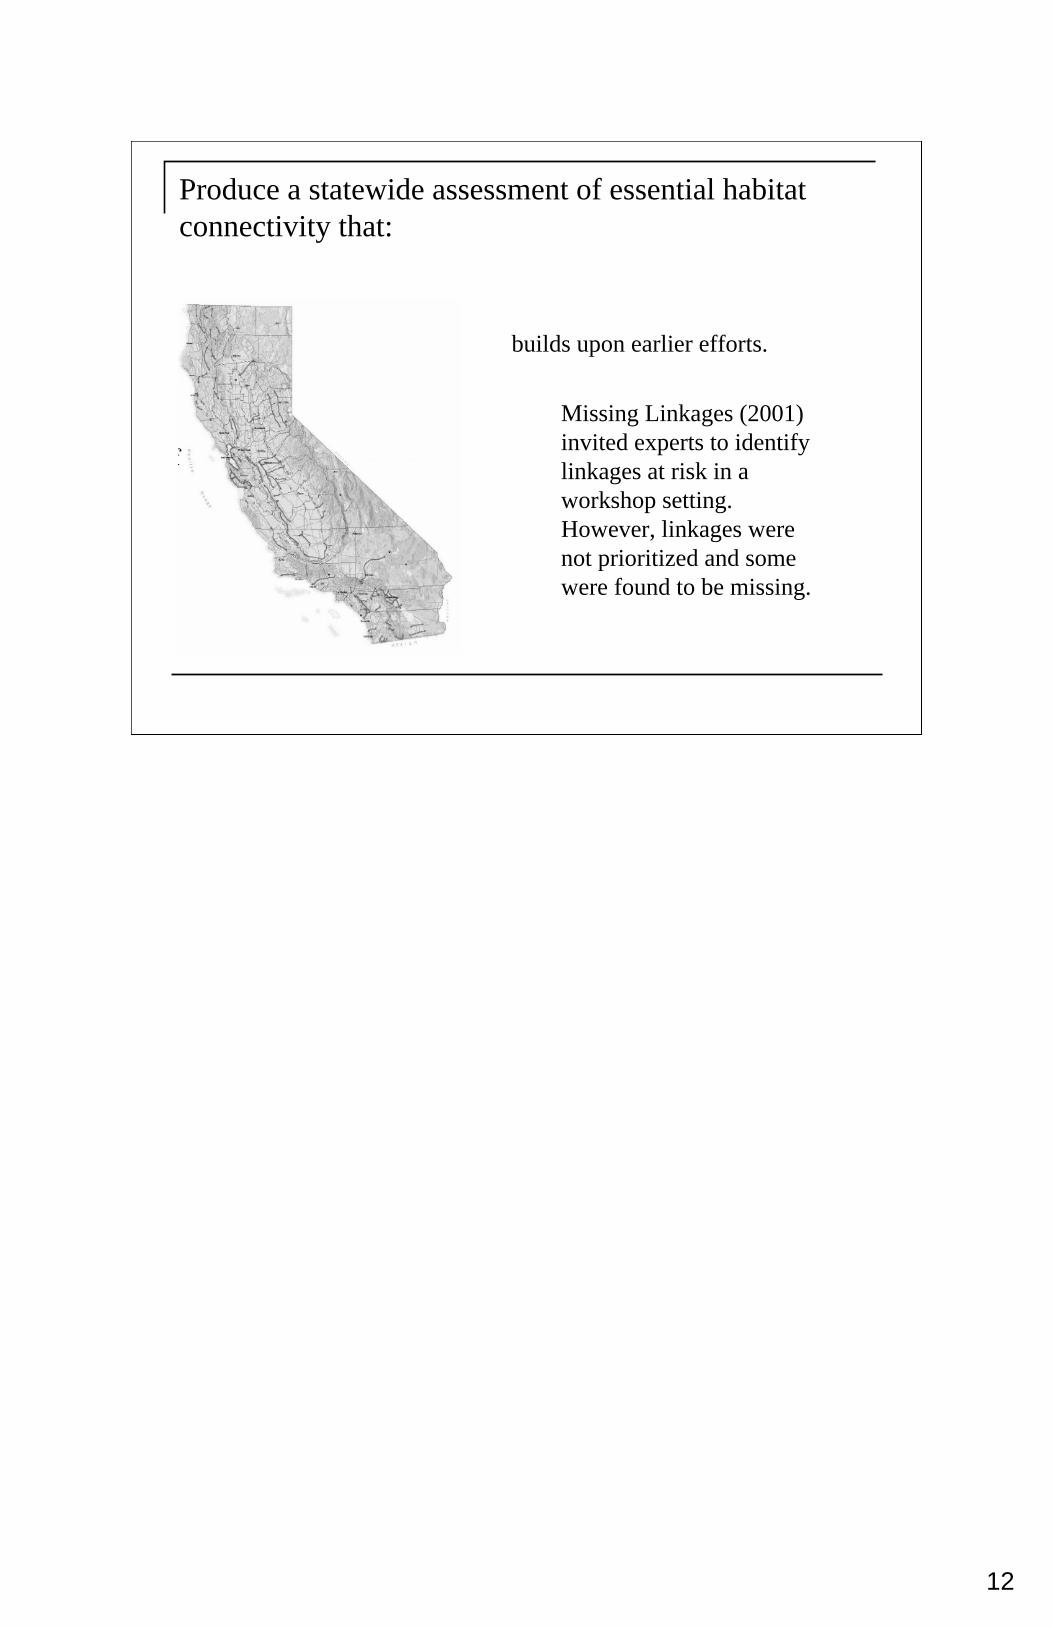
Produce a statewide assessment of essential habitat connectivity that:
builds upon earlier efforts.
Missing Linkages (2001) invited experts to identify linkages at risk in a workshop setting. However, linkages were not prioritized and some were found to be missing.

13
Produce a statewide assessment of essential habitat connectivity that:
is transparent scientifically-defensible and repeatable.
14
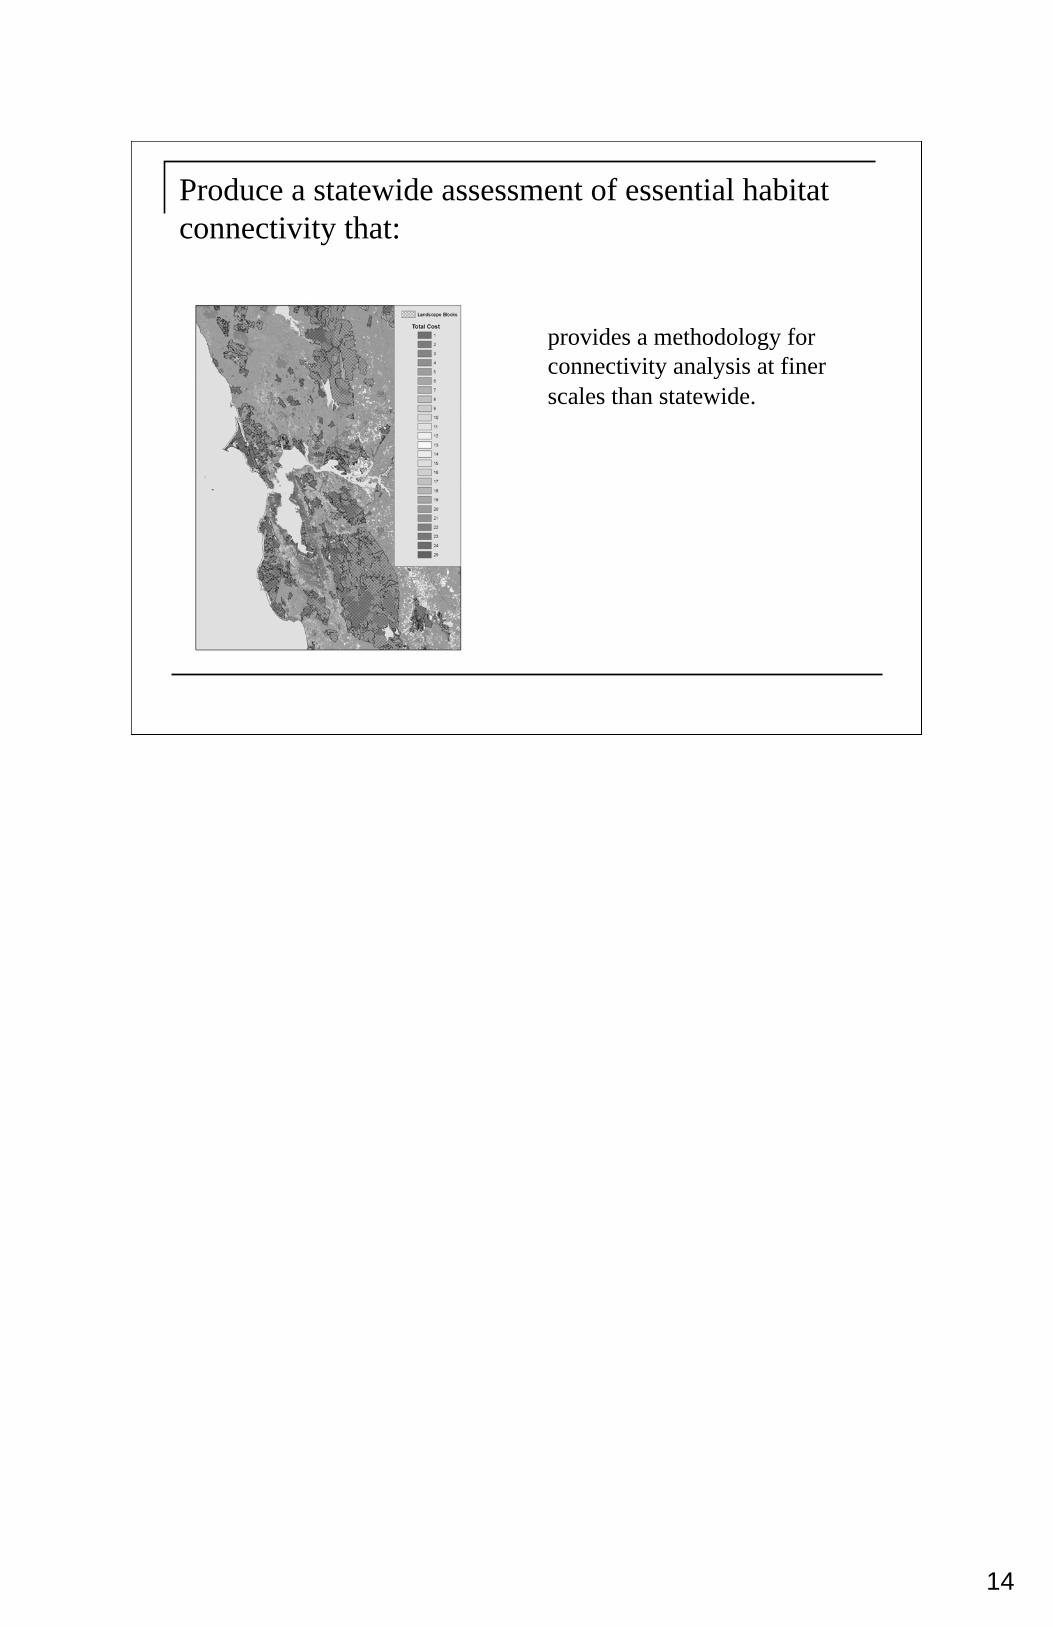
Produce a statewide assessment of essential habitat connectivity that:
provides a methodology for connectivity analysis at finer scales than statewide.
15
California Essential Habitat Connectivity Project: Approach

16
Biological Values Matrix
Caltrans, Fish and Game and the consulting team collaborated with over 60 public agencies and tribes to work through this process. A multi-disciplinary team was established to help scope the products. A smaller technical advisory group was formed to provide input on technical elements of the framework and model. The project timeline was fast paced (18 months), so the approach was to get input in 4 efficient well planned face-to-face meetings with interim conference calls as needed.

17
Here is a sample of the many organizations involved.

18
California Essential Habitat Connectivity Project: Key Decisions
The technical advisory group was asked to provide input on several key decisions related to the modeling effort.
19
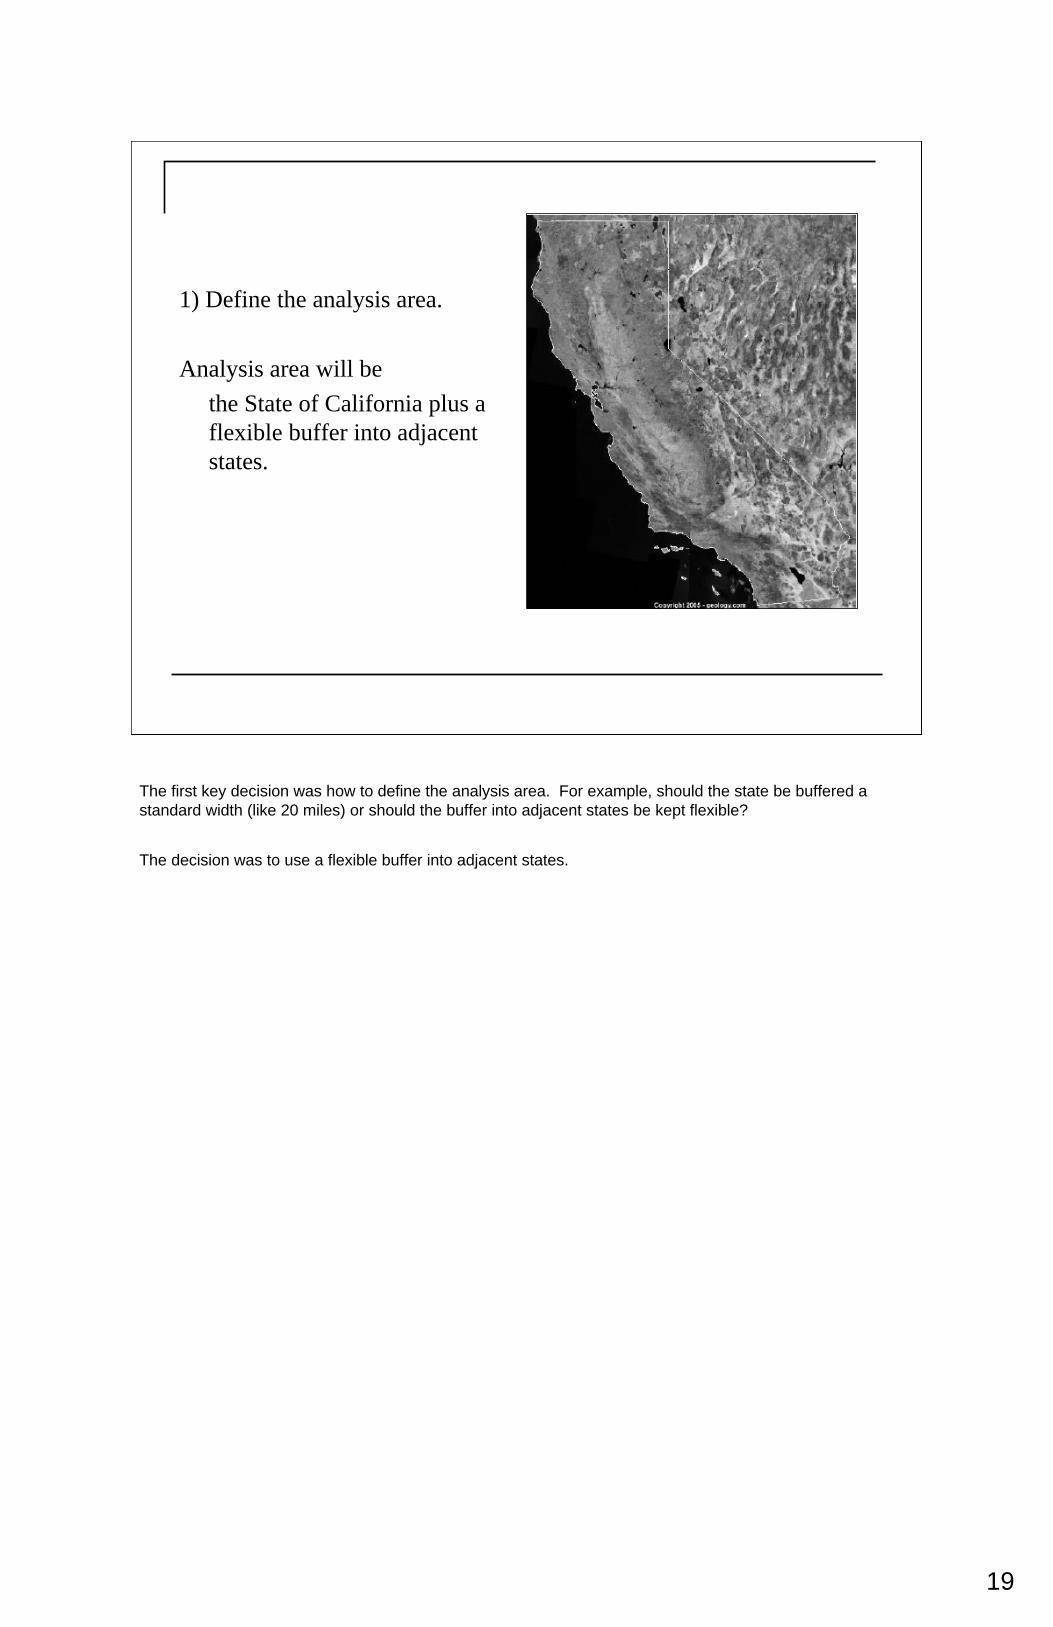
1) Define the analysis area.
Analysis area will bethe State of California plus a flexible buffer into adjacent states.
The first key decision was how to define the analysis area. For example, should the state be buffered a standard width (like 20 miles) or should the buffer into adjacent states be kept flexible?
The decision was to use a flexible buffer into adjacent states.

20
2) Define the areas to be connected - a.k.a. Natural Landscape Blocks (NLBs) or “blobs”.
Use areas of high ecological integrity.
Use 6,000 acre minimum to start.
Use a relatively fine resolution (100m pixel). Note: Graphic is for display purposes only.
The next decision was how to define the Natural Landscape Blocks or “blobs”. Before modeling connectivity it is, of course, necessary to have something to connect. Key questions here were:
How should Natural Landscape Blocks be defined and what spatial data sets should be used?
What size should the smallest defined block be? If it is defined as 2,000 acres, for example, no block smaller than 2,000 acres will show up on the final map.
What should be the resolution of the spatial data set? In other words, what should be the size of the pixels or units that make up the blocks?
The decision was to use areas of high ecological integrity, using several spatial data sets to define ecological integrity; to start with a 6,000 acre minimum block size; to use a relatively fine resolution (100 meter pixels, meaning each one of the squares you see in the illustration is 100 meters across on the ground); …
21
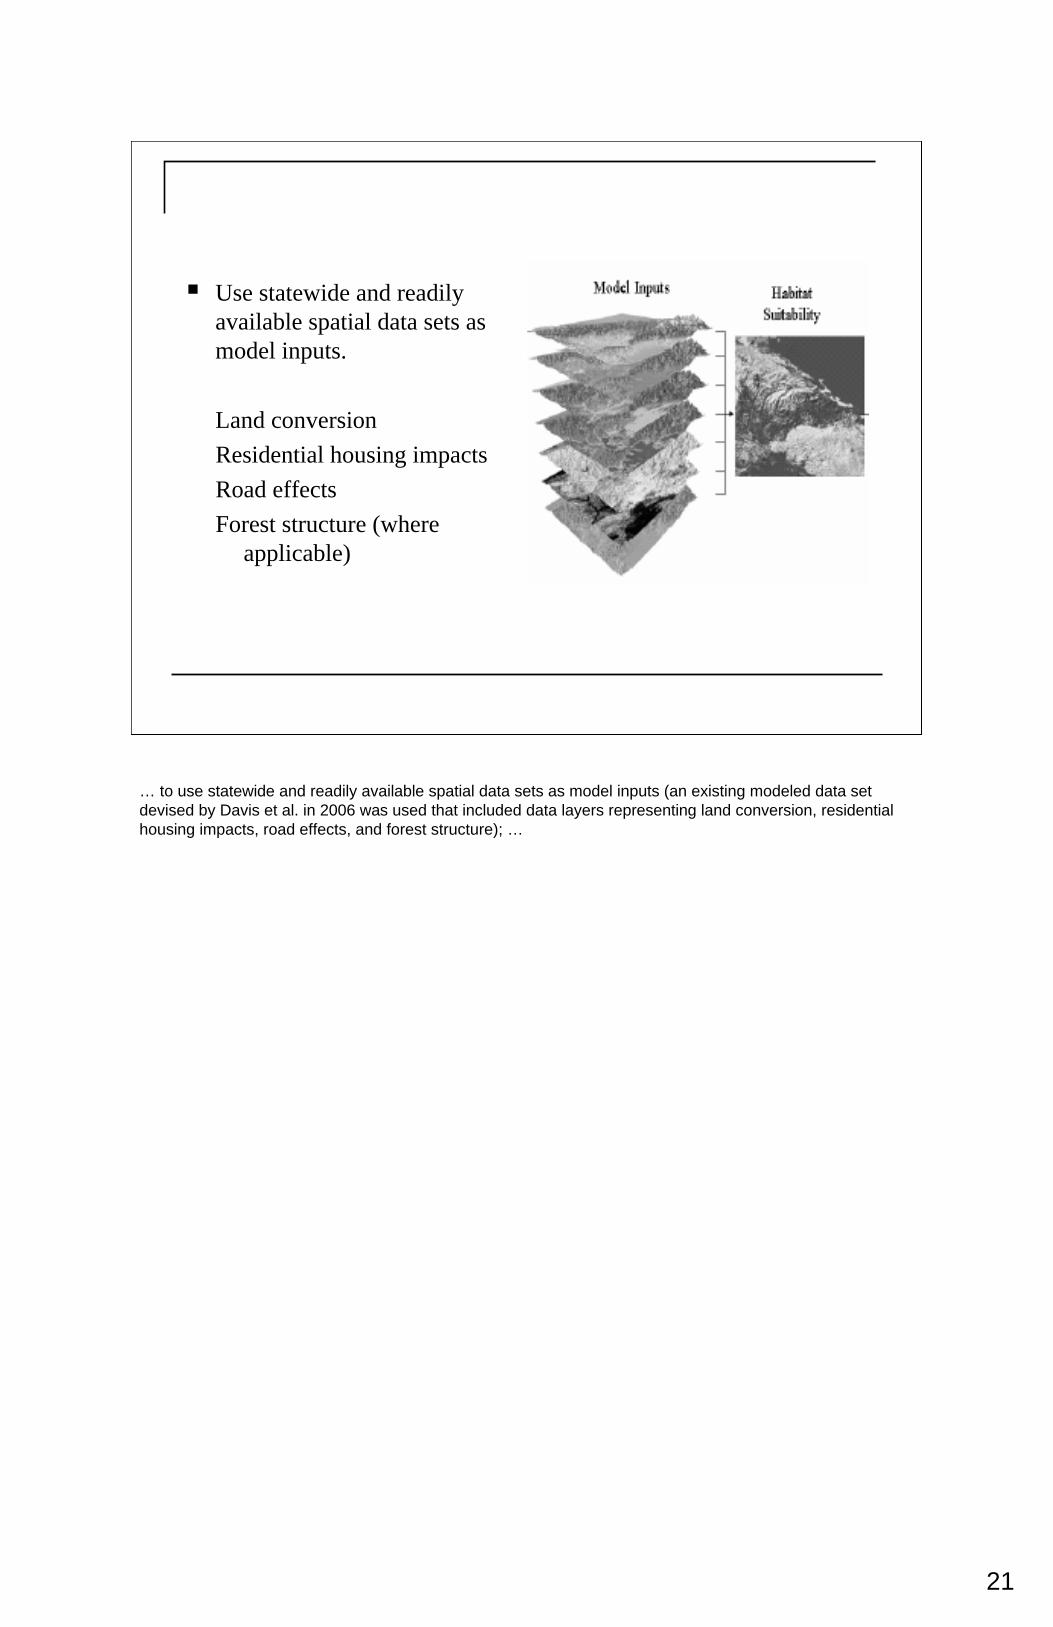
Use statewide and readily available spatial data sets as model inputs.
Land conversionResidential housing impactsRoad effectsForest structure (where
applicable)
… to use statewide and readily available spatial data sets as model inputs (an existing modeled data set devised by Davis et al. in 2006 was used that included data layers representing land conversion, residential housing impacts, road effects, and forest structure); …
22
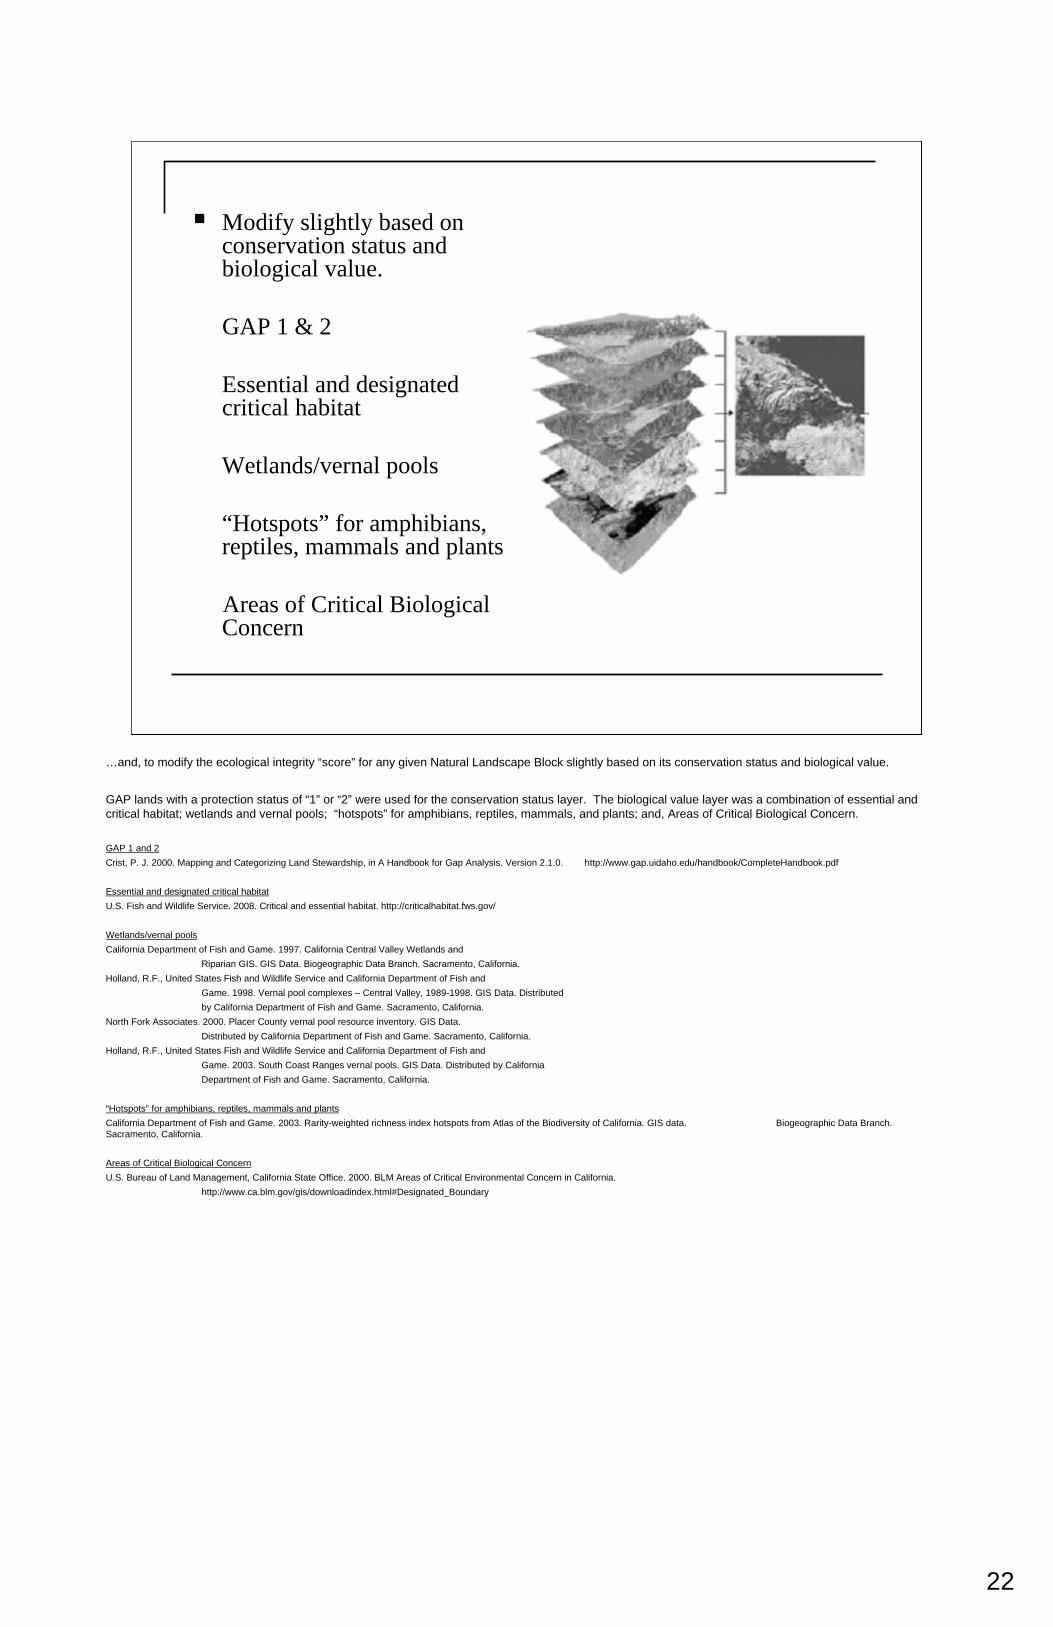
Modify slightly based on conservation status and biological value.
GAP 1 & 2
Essential and designated critical habitat
Wetlands/vernal pools
“Hotspots” for amphibians, reptiles, mammals and plants
Areas of Critical Biological Concern
…and, to modify the ecological integrity “score” for any given Natural Landscape Block slightly based on its conservation status and biological value.
GAP lands with a protection status of “1” or “2” were used for the conservation status layer. The biological value layer was a combination of essential and critical habitat; wetlands and vernal pools; “hotspots” for amphibians, reptiles, mammals, and plants; and, Areas of Critical Biological Concern.
GAP 1 and 2 Crist, P. J. 2000. Mapping and Categorizing Land Stewardship, in A Handbook for Gap Analysis. Version 2.1.0. http://www.gap.uidaho.edu/handbook/CompleteHandbook.pdf
Essential and designated critical habitatU.S. Fish and Wildlife Service. 2008. Critical and essential habitat. http://criticalhabitat.fws.gov/
Wetlands/vernal poolsCalifornia Department of Fish and Game. 1997. California Central Valley Wetlands and
Riparian GIS. GIS Data. Biogeographic Data Branch. Sacramento, California.Holland, R.F., United States Fish and Wildlife Service and California Department of Fish and
Game. 1998. Vernal pool complexes – Central Valley, 1989-1998. GIS Data. Distributedby California Department of Fish and Game. Sacramento, California.
North Fork Associates. 2000. Placer County vernal pool resource inventory. GIS Data.Distributed by California Department of Fish and Game. Sacramento, California.
Holland, R.F., United States Fish and Wildlife Service and California Department of Fish andGame. 2003. South Coast Ranges vernal pools. GIS Data. Distributed by CaliforniaDepartment of Fish and Game. Sacramento, California.
“Hotspots” for amphibians, reptiles, mammals and plantsCalifornia Department of Fish and Game. 2003. Rarity-weighted richness index hotspots from Atlas of the Biodiversity of California. GIS data. Biogeographic Data Branch. Sacramento, California.
Areas of Critical Biological ConcernU.S. Bureau of Land Management, California State Office. 2000. BLM Areas of Critical Environmental Concern in California.
http://www.ca.blm.gov/gis/downloadindex.html#Designated_Boundary

23
A total of 850 Natural Landscape Blocks of 2,000 to 3.7 million acres were identified.
In the end, a total of 850 Natural Landscape Blocks were identified. They range in size from 2,000 to 3.7 million acres.
The minimum size of a Natural Landscape Block analyzed for connectivity with any other habitat block is 10,000 acres.
24
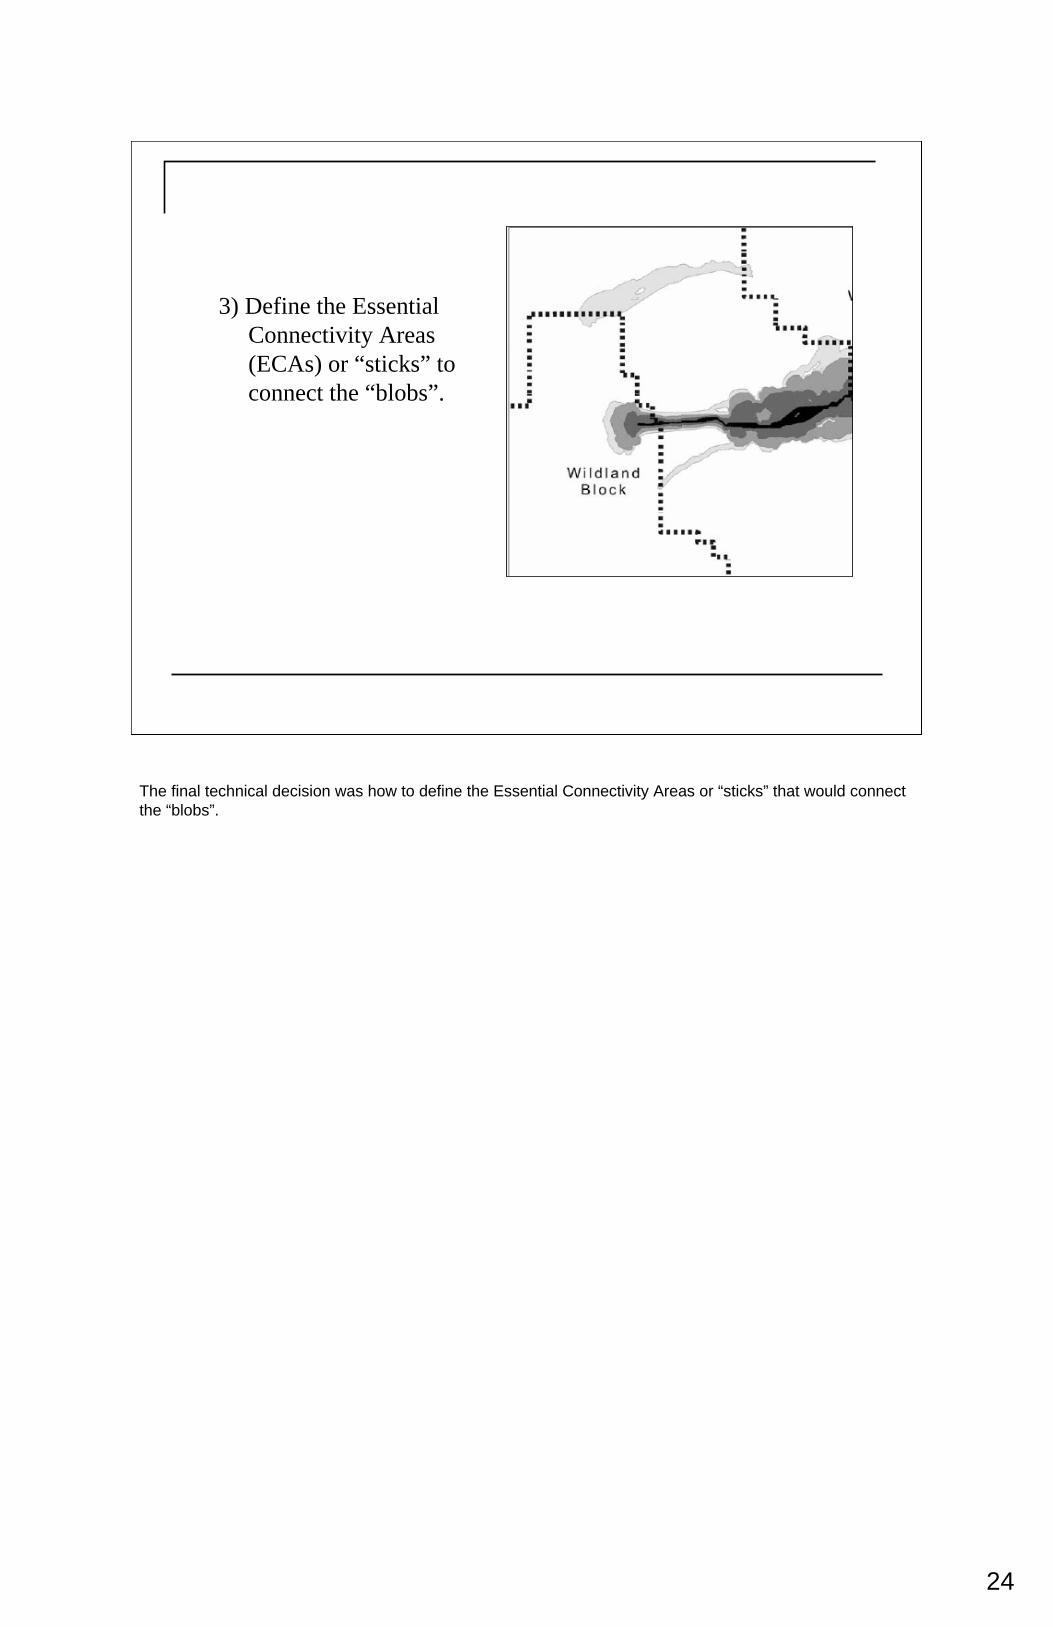
3) Define the Essential Connectivity Areas (ECAs) or “sticks” to connect the “blobs”.
The final technical decision was how to define the Essential Connectivity Areas or “sticks” that would connect the “blobs”.

25
Use a least-cost corridor method of connecting wildland blocks.
Use the centroid of each wildland block as a corridor terminus.
Use an inverse of ecological integrity as the resistance surface (alternative would be to define by focal species).
Add buffered river corridors where they are not already included.
The decision was:
to use a least cost corridor method of connecting the wildland blocks; you can think of this method as modeling “the path of least resistance”;
to use the centroid of each wildland or Natural Landscape Block as a terminus for the linkage or corridor; one alternative would be to model from block edge to block edge;
to use the inverse of ecological integrity as the resistance surface; this means the difficulty or resistance in moving across the landscape is defined generally, by how much ecological integrity there is, rather than defined per the needs of a focal species;
and, to add buffered river corridors where they were not picked up by the modeling.
26
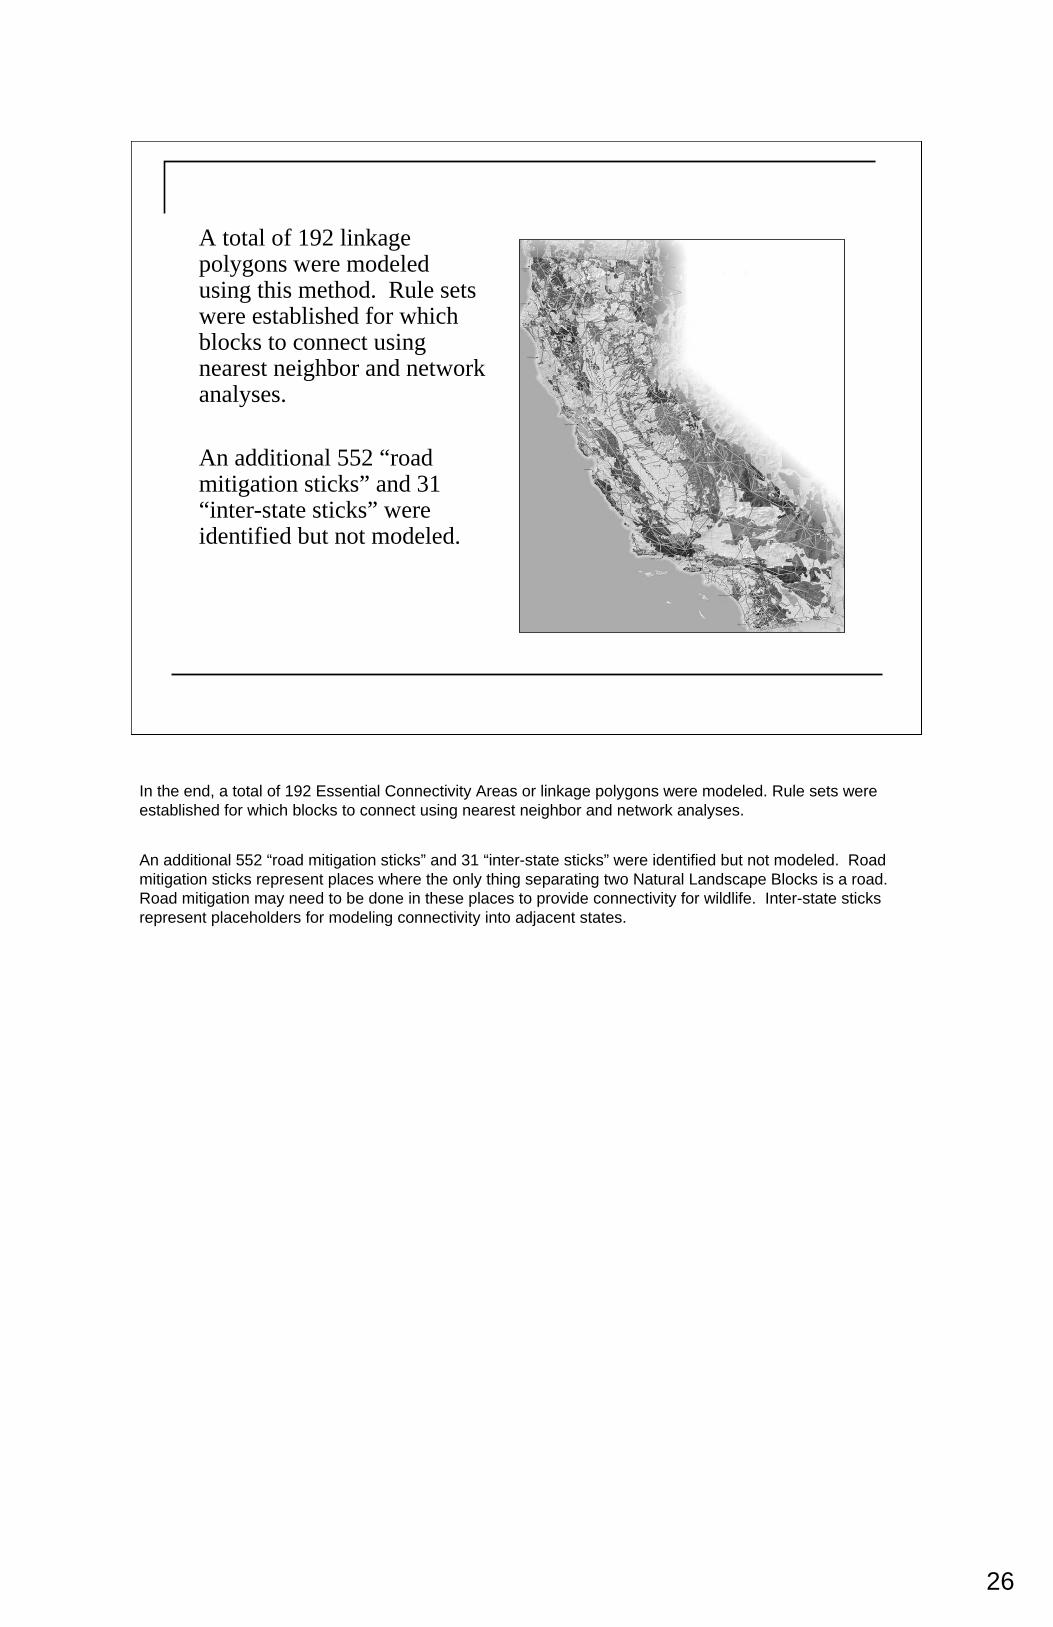
A total of 192 linkage polygons were modeled using this method. Rule sets were established for which blocks to connect using nearest neighbor and network analyses.
An additional 552 “road mitigation sticks” and 31 “inter-state sticks” were identified but not modeled.
In the end, a total of 192 Essential Connectivity Areas or linkage polygons were modeled. Rule sets were established for which blocks to connect using nearest neighbor and network analyses.
An additional 552 “road mitigation sticks” and 31 “inter-state sticks” were identified but not modeled. Road mitigation sticks represent places where the only thing separating two Natural Landscape Blocks is a road. Road mitigation may need to be done in these places to provide connectivity for wildlife. Inter-state sticks represent placeholders for modeling connectivity into adjacent states.
27
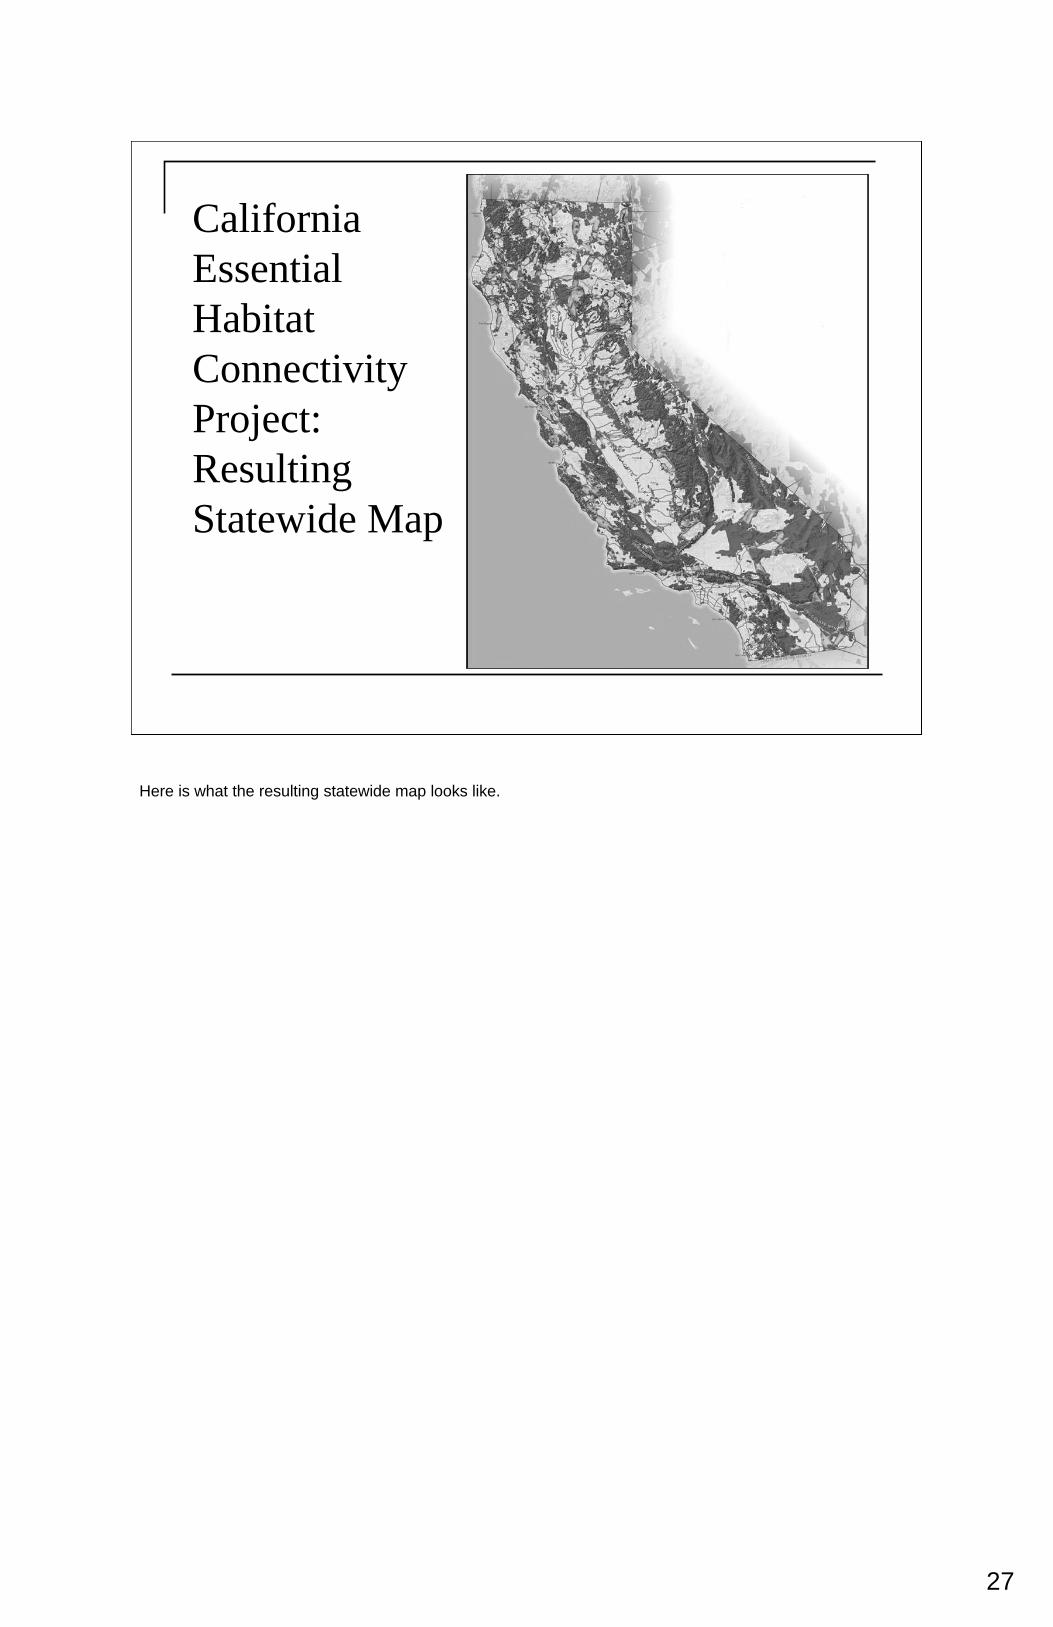
California Essential Habitat Connectivity Project: Resulting Statewide Map
Here is what the resulting statewide map looks like.
28
California Essential Habitat Connectivity Project:
Comparison of Results to Existing Connectivity Analyses and Conservation Networks
Results were then compared with existing connectivity analyses and conservation networks at several spatial scales.
29
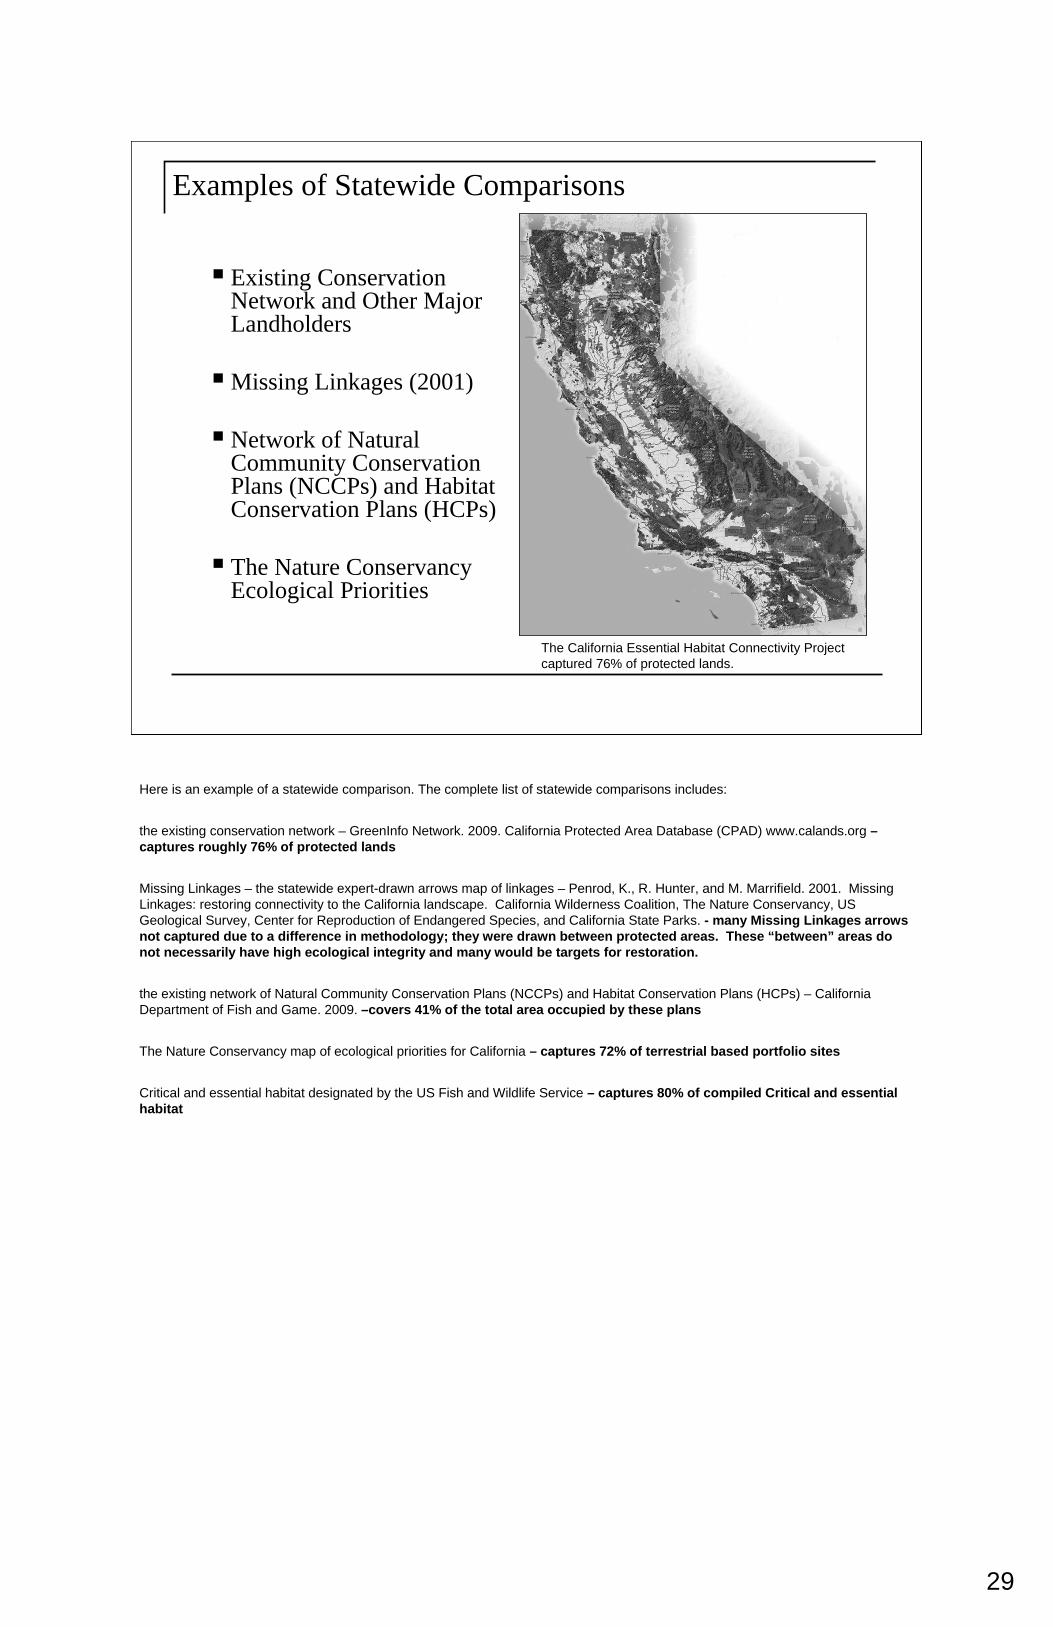
Examples of Statewide Comparisons
Existing Conservation Network and Other Major Landholders
Missing Linkages (2001)
Network of Natural Community Conservation Plans (NCCPs) and Habitat Conservation Plans (HCPs)
The Nature Conservancy Ecological Priorities
The California Essential Habitat Connectivity Project captured 76% of protected lands.
Here is an example of a statewide comparison. The complete list of statewide comparisons includes:
the existing conservation network – GreenInfo Network. 2009. California Protected Area Database (CPAD) www.calands.org –captures roughly 76% of protected lands
Missing Linkages – the statewide expert-drawn arrows map of linkages – Penrod, K., R. Hunter, and M. Marrifield. 2001. Missing Linkages: restoring connectivity to the California landscape. California Wilderness Coalition, The Nature Conservancy, US Geological Survey, Center for Reproduction of Endangered Species, and California State Parks. - many Missing Linkages arrows not captured due to a difference in methodology; they were drawn between protected areas. These “between” areas do not necessarily have high ecological integrity and many would be targets for restoration.
the existing network of Natural Community Conservation Plans (NCCPs) and Habitat Conservation Plans (HCPs) – California Department of Fish and Game. 2009. –covers 41% of the total area occupied by these plans
The Nature Conservancy map of ecological priorities for California – captures 72% of terrestrial based portfolio sites
Critical and essential habitat designated by the US Fish and Wildlife Service – captures 80% of compiled Critical and essential habitat
30
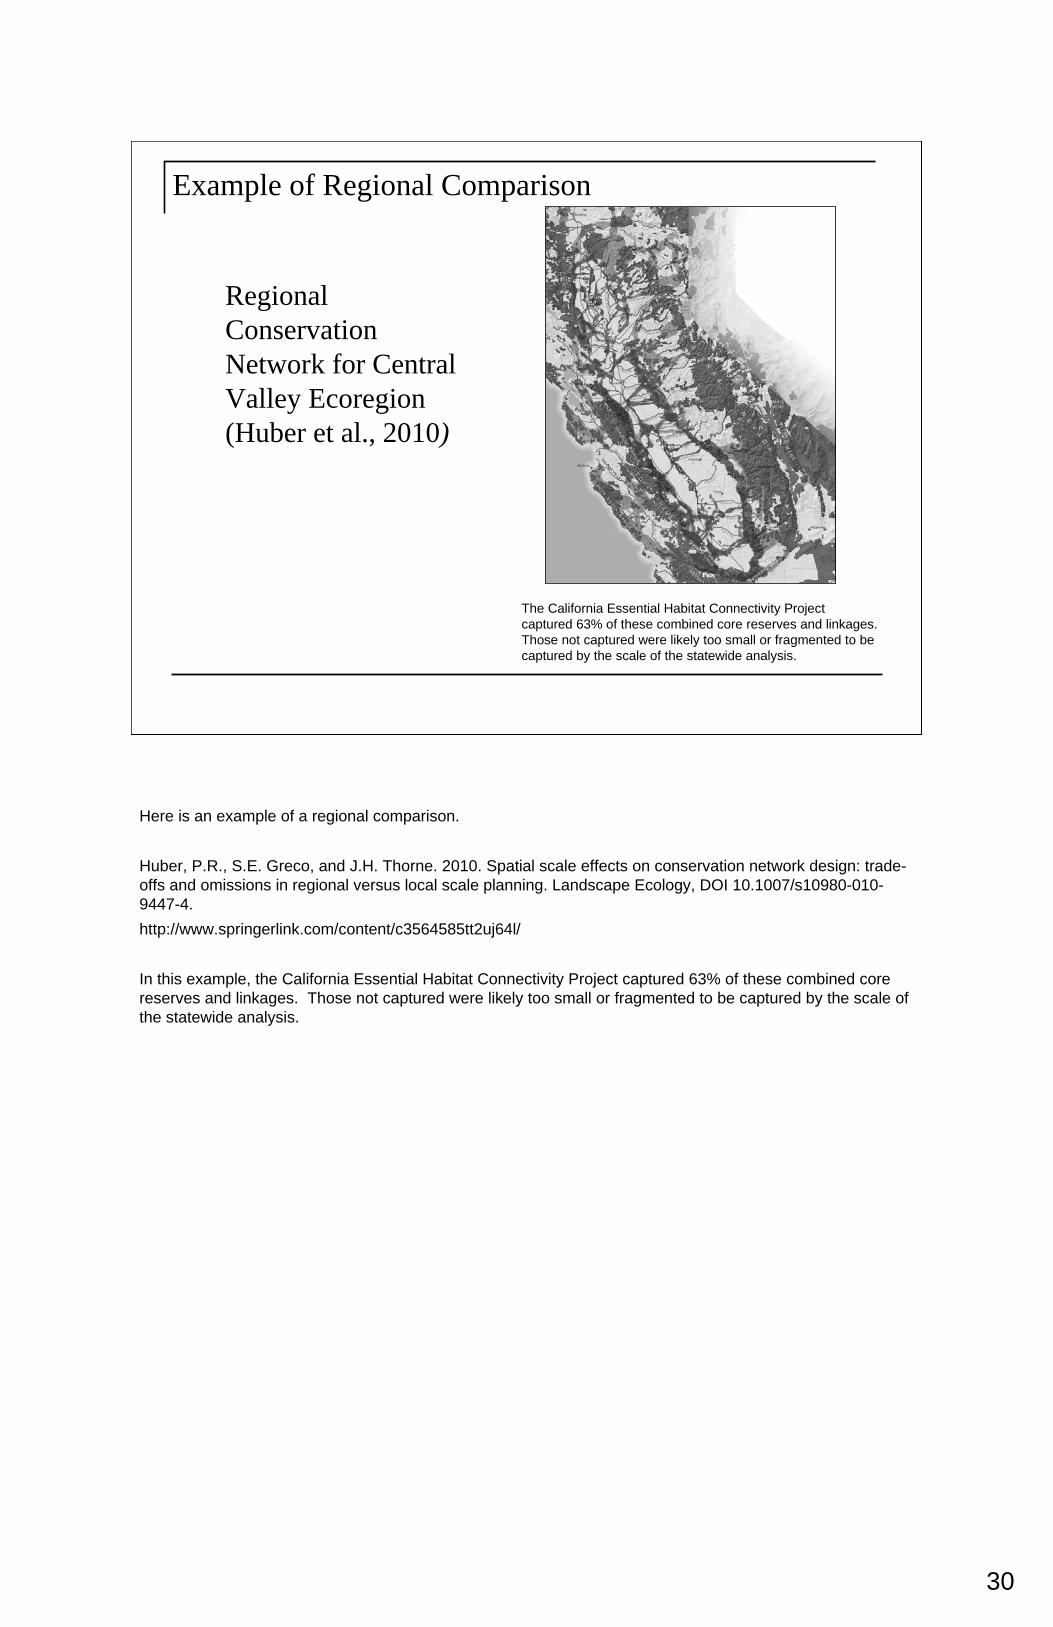
Example of Regional Comparison
Regional Conservation Network for Central Valley Ecoregion (Huber et al., 2010)
The California Essential Habitat Connectivity Project captured 63% of these combined core reserves and linkages. Those not captured were likely too small or fragmented to be captured by the scale of the statewide analysis.
Here is an example of a regional comparison.
Huber, P.R., S.E. Greco, and J.H. Thorne. 2010. Spatial scale effects on conservation network design: trade-offs and omissions in regional versus local scale planning. Landscape Ecology, DOI 10.1007/s10980-010-9447-4.http://www.springerlink.com/content/c3564585tt2uj64l/
In this example, the California Essential Habitat Connectivity Project captured 63% of these combined core reserves and linkages. Those not captured were likely too small or fragmented to be captured by the scale of the statewide analysis.
31
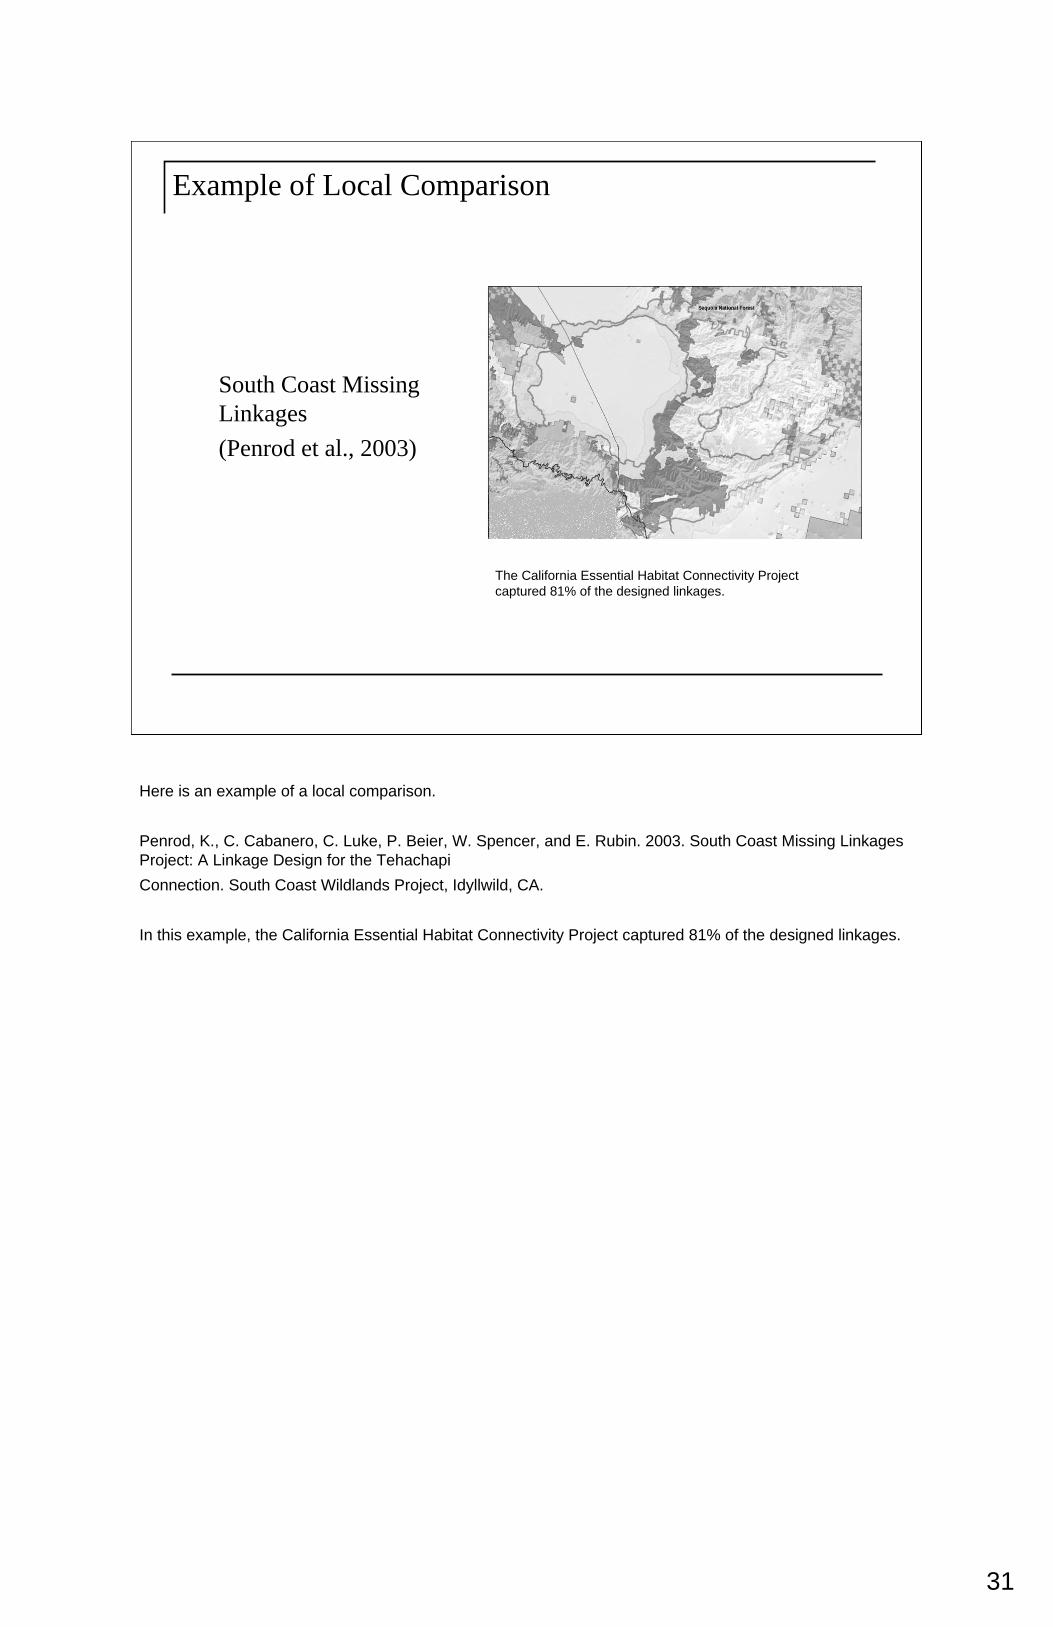
Example of Local Comparison
South Coast Missing Linkages (Penrod et al., 2003)
The California Essential Habitat Connectivity Project captured 81% of the designed linkages.
Here is an example of a local comparison.
Penrod, K., C. Cabanero, C. Luke, P. Beier, W. Spencer, and E. Rubin. 2003. South Coast Missing Linkages Project: A Linkage Design for the TehachapiConnection. South Coast Wildlands Project, Idyllwild, CA.
In this example, the California Essential Habitat Connectivity Project captured 81% of the designed linkages.
32
California Essential Habitat Connectivity Project: Products
Additional products were created.

33
California Essential Habitat Connectivity Project: Products
In addition to the statewide map …
The multi-disciplinary and technical advisory groups made it clear in the beginning that the products needed to include more than the map. They asked that the map be accompanied by a plan/report that would detail how to apply the framework/model at the statewide, regional and local levels. They also determined that having measures of biological value associated with Essential Connectivity Areas would be more useful than prioritizing them at the outset, primarily because of the different missions and goals of all the implementing agencies.
34
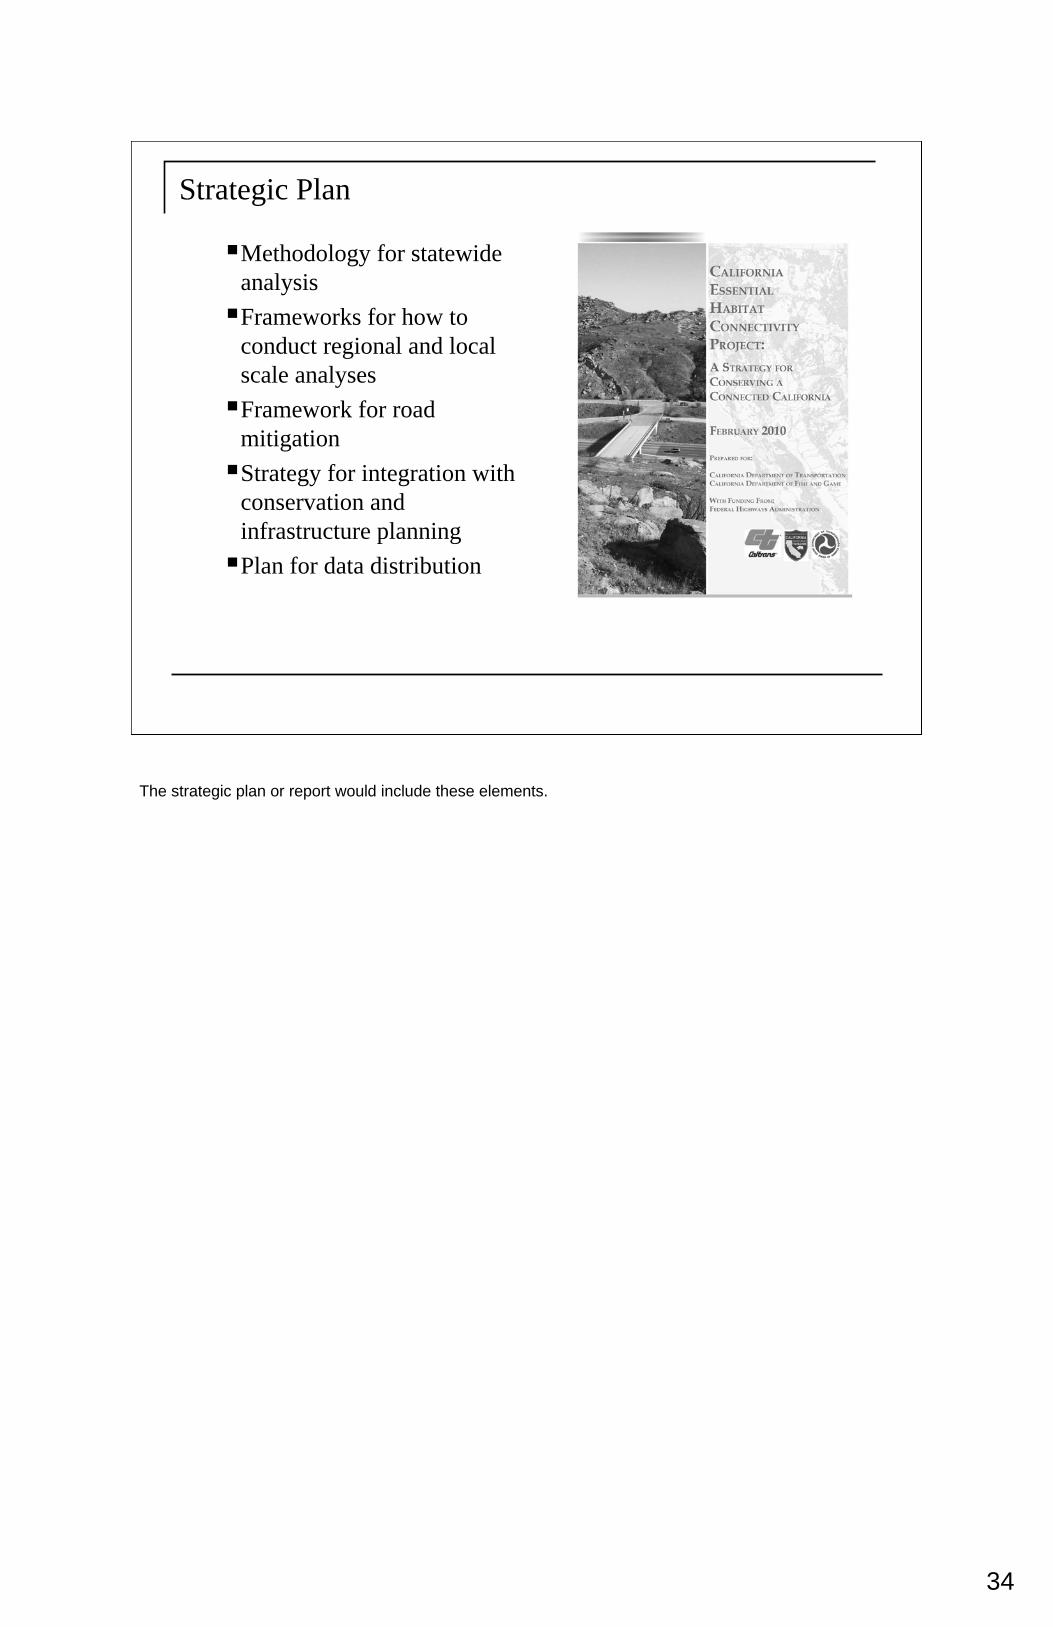
Strategic Plan
Methodology for statewide analysisFrameworks for how to conduct regional and local scale analysesFramework for road mitigationStrategy for integration with conservation and infrastructure planningPlan for data distribution
The strategic plan or report would include these elements.
35
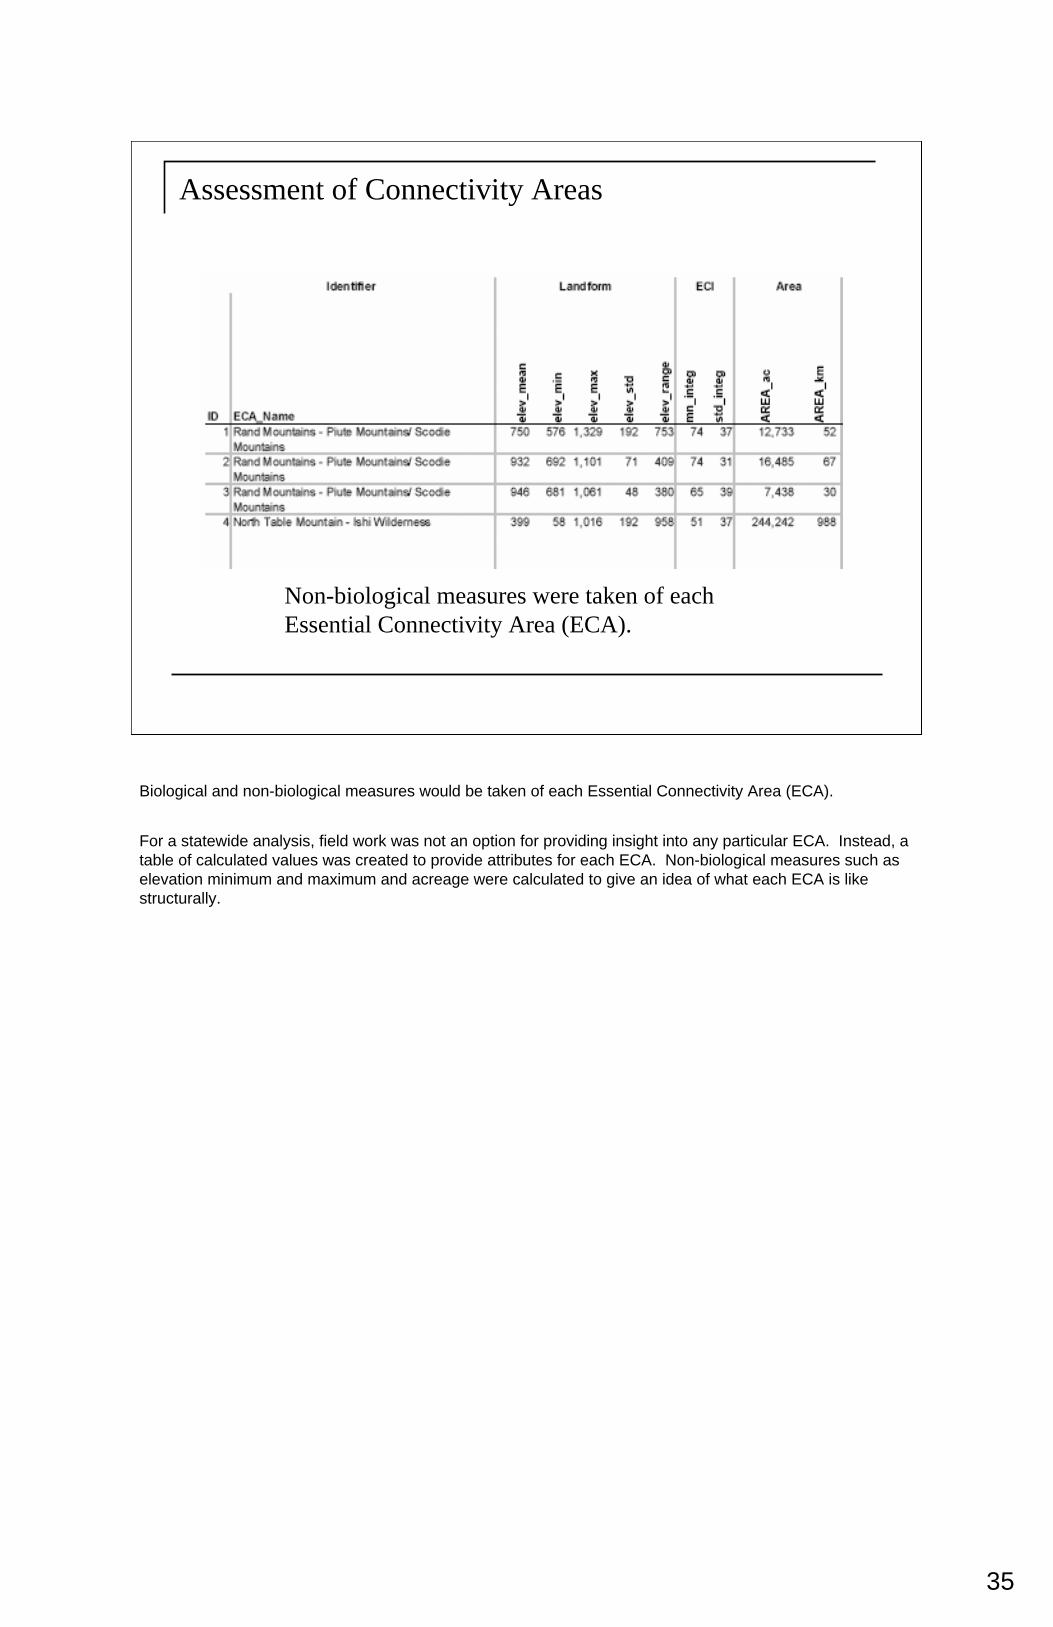
Assessment of Connectivity Areas
Non-biological measures were taken of each Essential Connectivity Area (ECA).
Biological and non-biological measures would be taken of each Essential Connectivity Area (ECA).
For a statewide analysis, field work was not an option for providing insight into any particular ECA. Instead, a table of calculated values was created to provide attributes for each ECA. Non-biological measures such as elevation minimum and maximum and acreage were calculated to give an idea of what each ECA is like structurally.

36
Assessment of Connectivity Areas
Elevation profiles were completed for each Essential Connectivity Area (ECA).
Elevation profiles were completed for each ECA to help give one indication of what the range of environmental gradients might be.
37
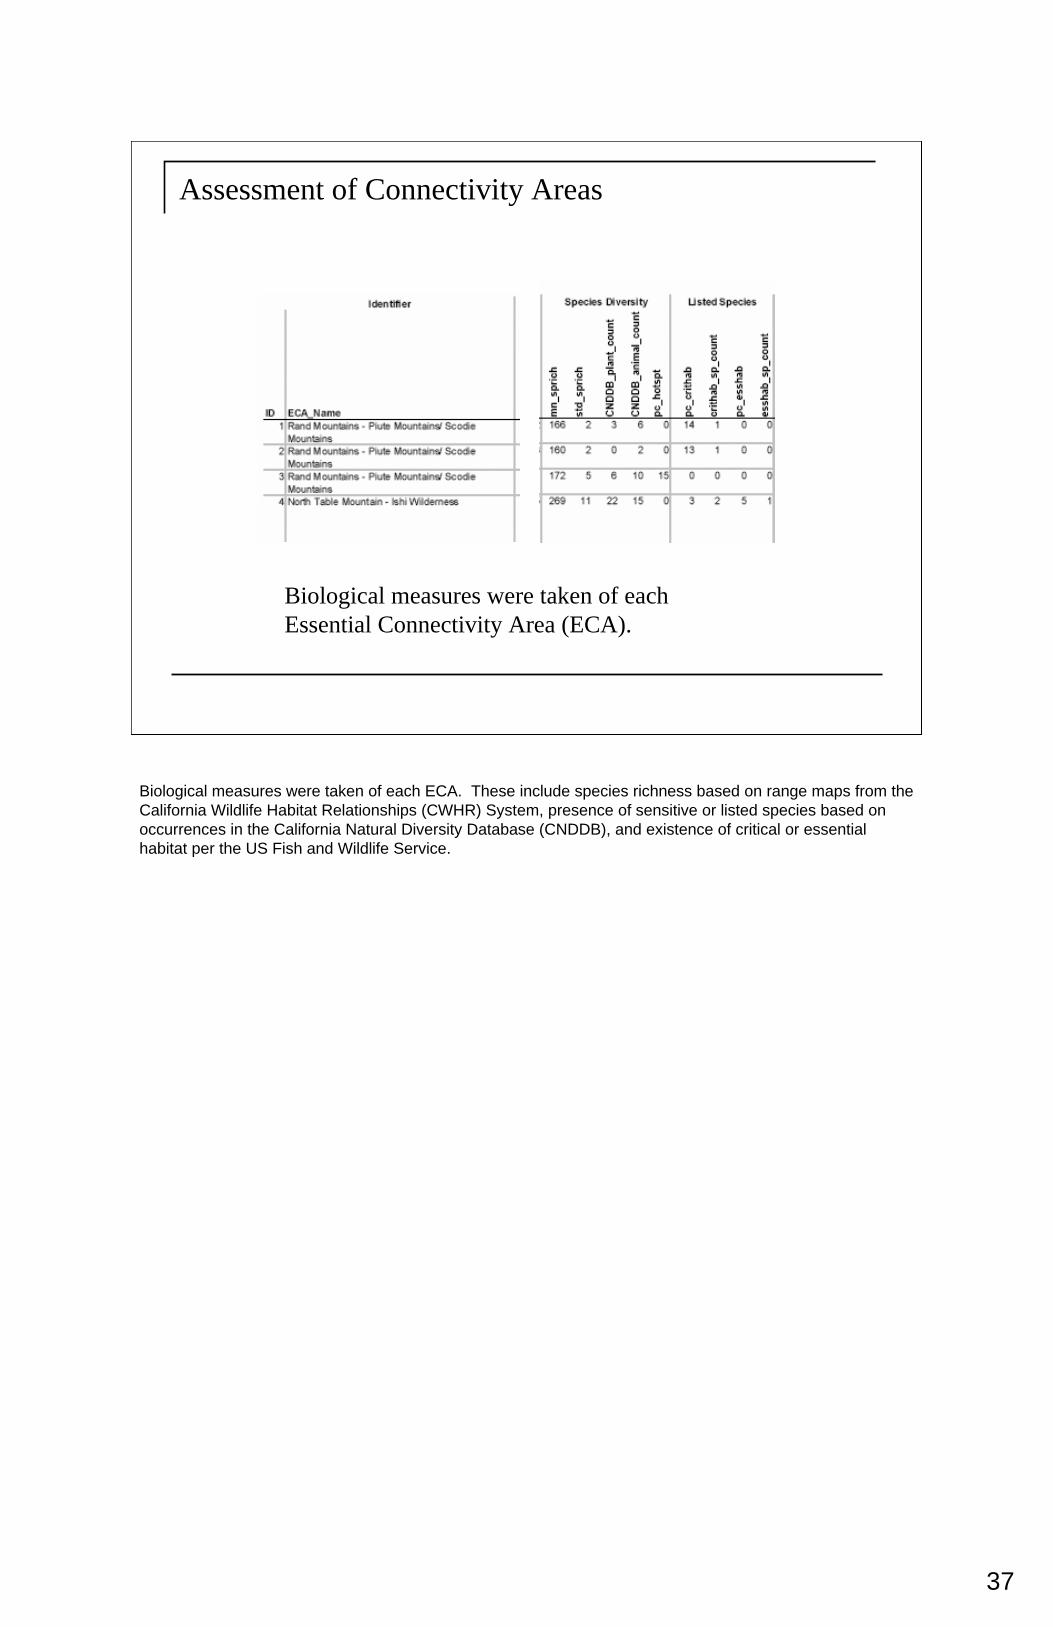
Assessment of Connectivity Areas
Biological measures were taken of each Essential Connectivity Area (ECA).
Biological measures were taken of each ECA. These include species richness based on range maps from the California Wildlife Habitat Relationships (CWHR) System, presence of sensitive or listed species based on occurrences in the California Natural Diversity Database (CNDDB), and existence of critical or essential habitat per the US Fish and Wildlife Service.
38
California Essential Habitat Connectivity Project: Intended Uses
39
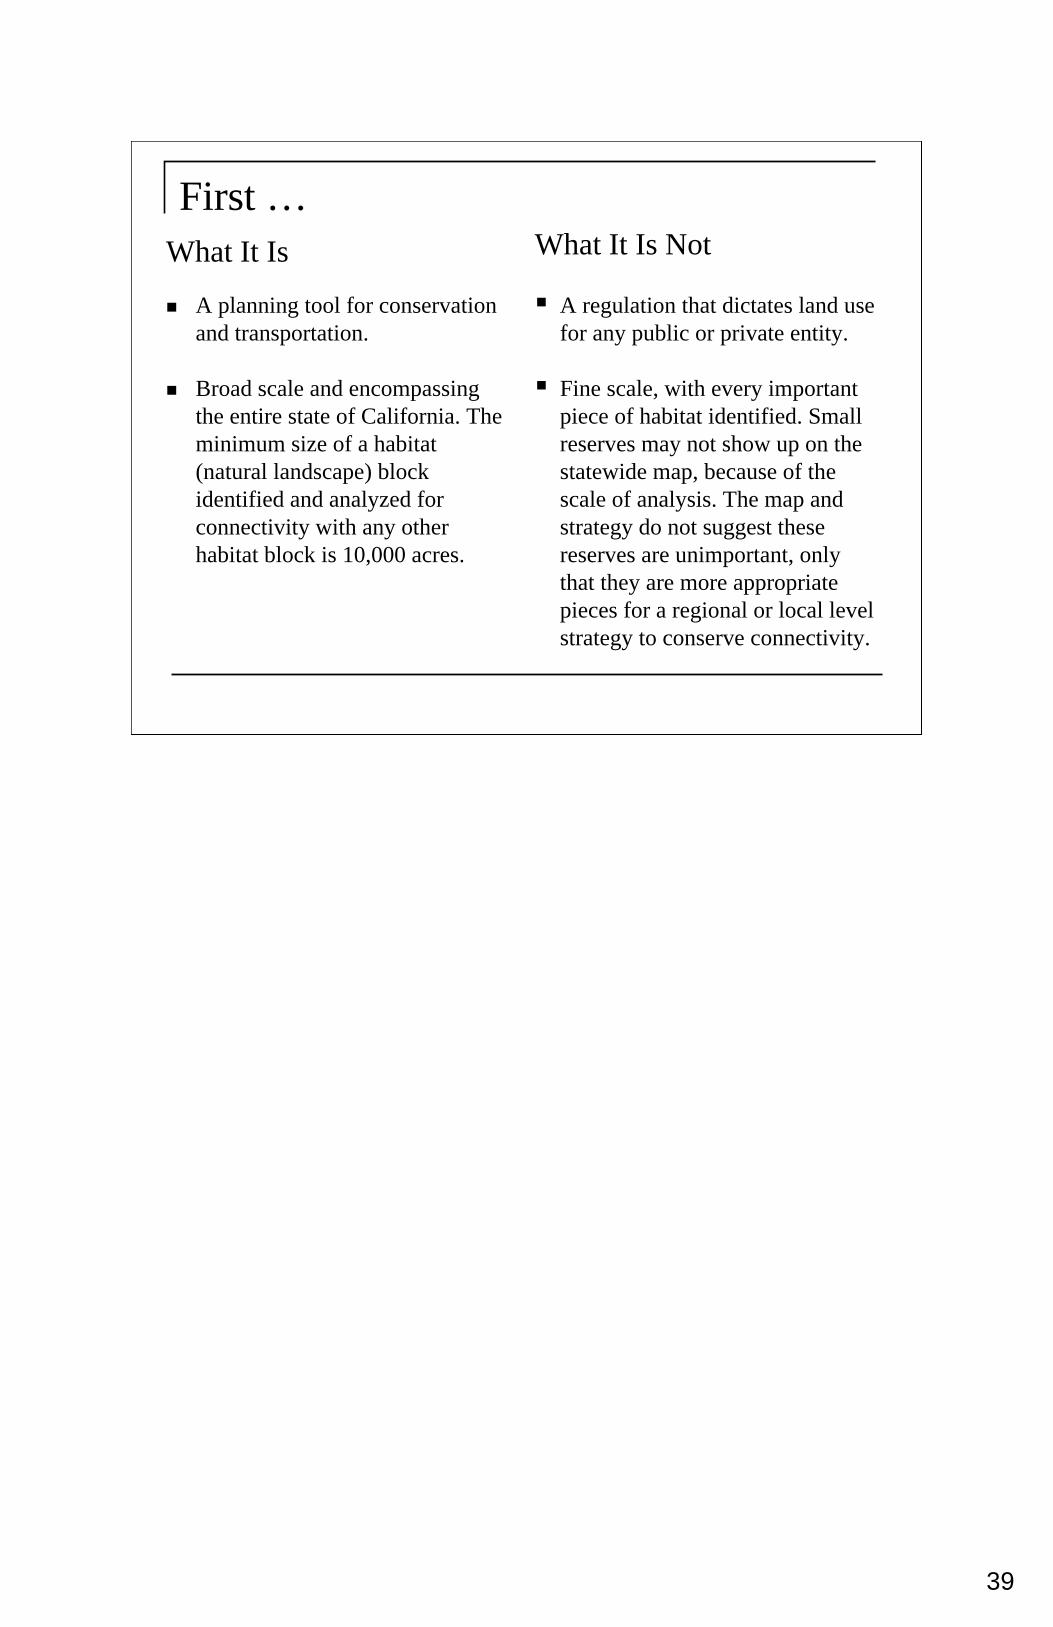
First …What It Is
A planning tool for conservation and transportation.
Broad scale and encompassing the entire state of California. The minimum size of a habitat (natural landscape) block identified and analyzed for connectivity with any other habitat block is 10,000 acres.
What It Is Not
A regulation that dictates land use for any public or private entity.
Fine scale, with every important piece of habitat identified. Small reserves may not show up on the statewide map, because of the scale of analysis. The map and strategy do not suggest these reserves are unimportant, only that they are more appropriate pieces for a regional or local level strategy to conserve connectivity.
40
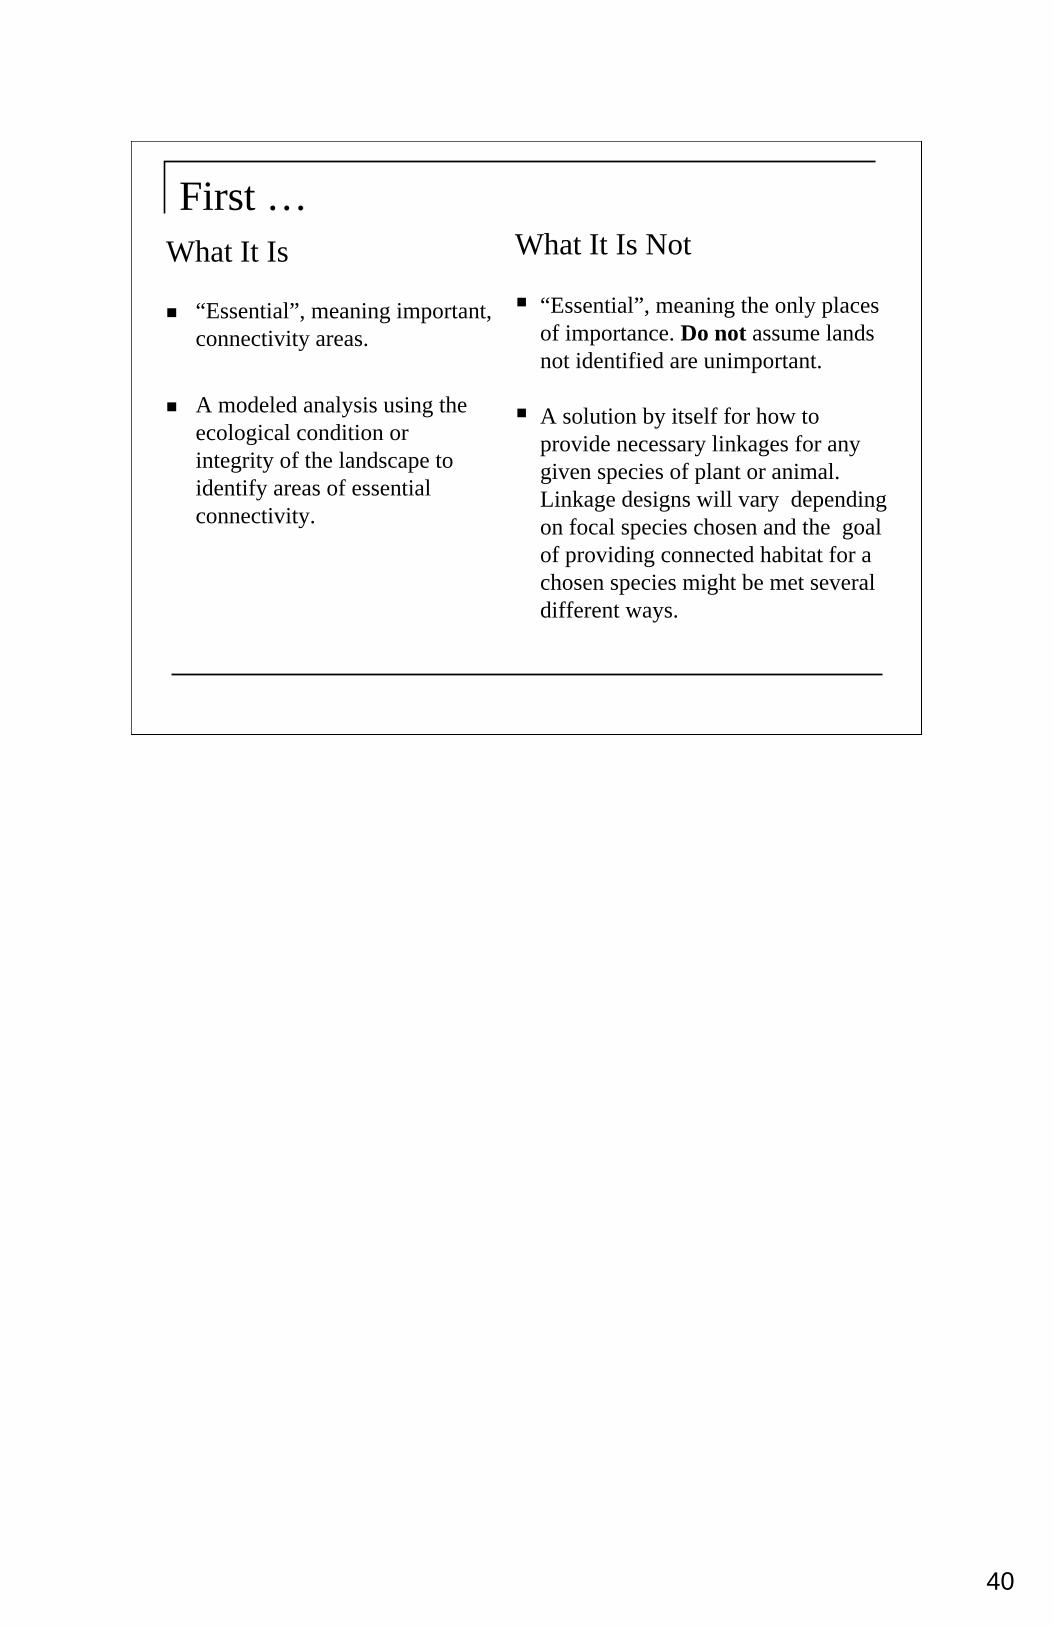
First …What It Is
“Essential”, meaning important, connectivity areas.
A modeled analysis using the ecological condition or integrity of the landscape to identify areas of essential connectivity.
What It Is Not
“Essential”, meaning the only places of importance. Do not assume lands not identified are unimportant.
A solution by itself for how to provide necessary linkages for any given species of plant or animal. Linkage designs will vary depending on focal species chosen and the goal of providing connected habitat for a chosen species might be met several different ways.
41
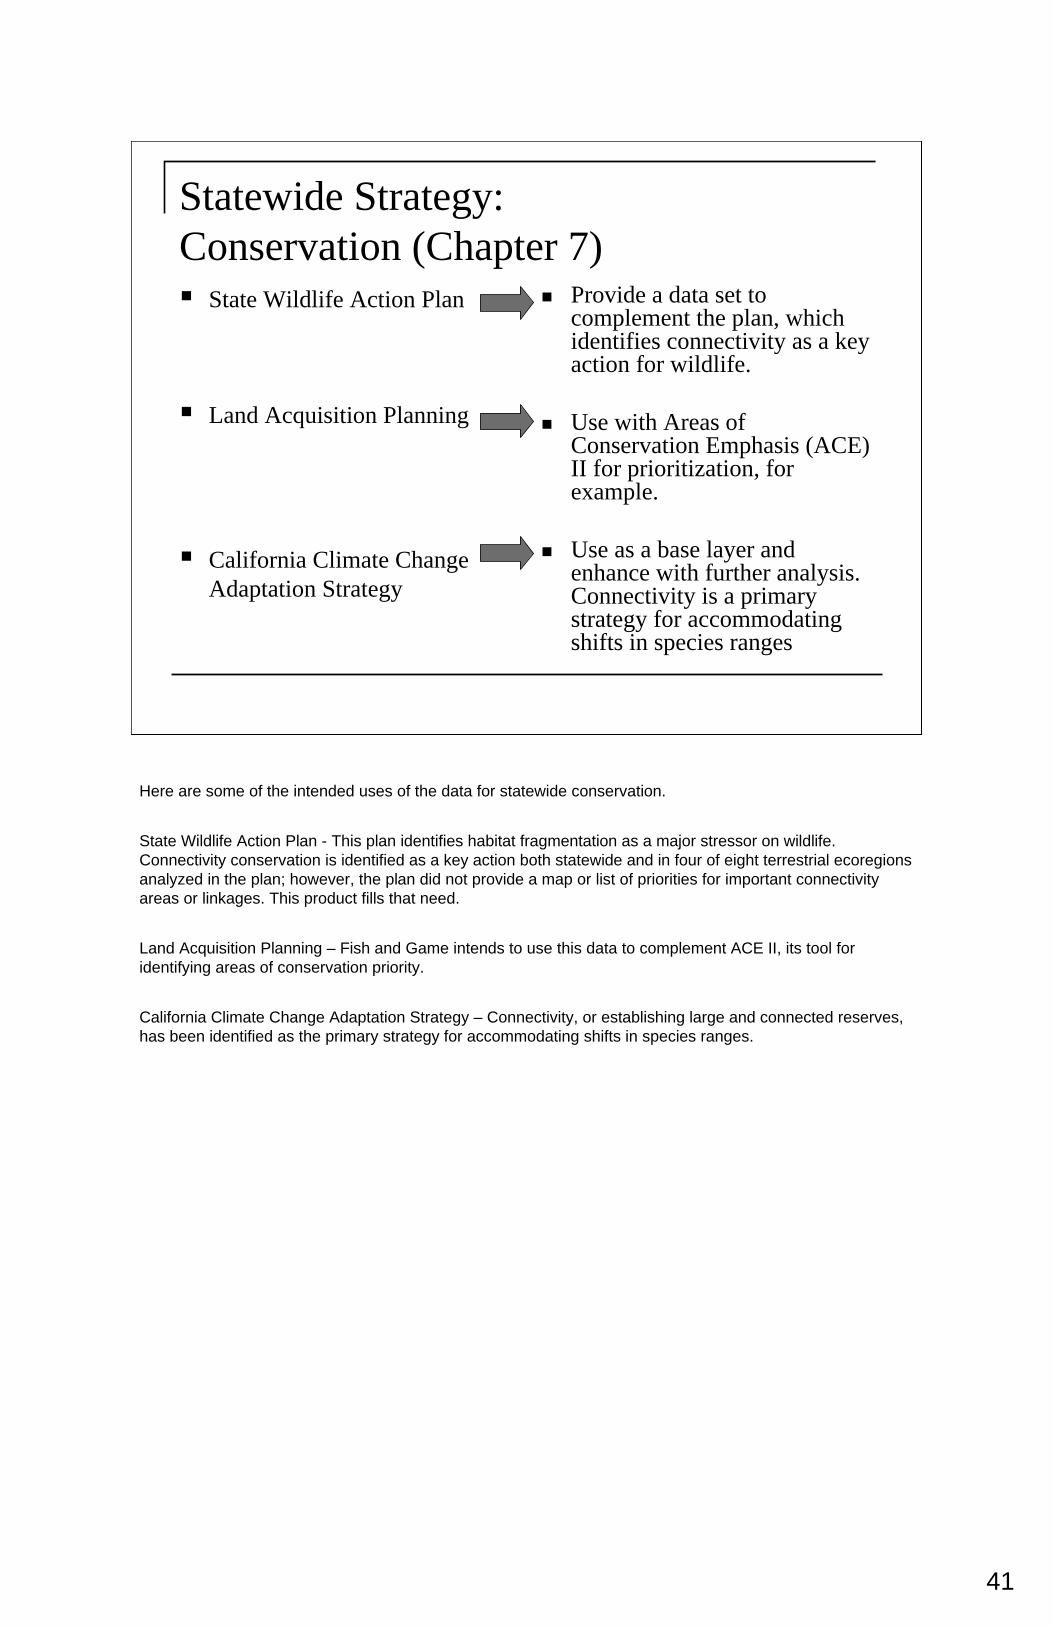
State Wildlife Action Plan
Land Acquisition Planning
California Climate Change Adaptation Strategy
Provide a data set to complement the plan, which identifies connectivity as a key action for wildlife.
Use with Areas of Conservation Emphasis (ACE) II for prioritization, for example.
Use as a base layer and enhance with further analysis. Connectivity is a primary strategy for accommodating shifts in species ranges
Statewide Strategy: Conservation (Chapter 7)
Here are some of the intended uses of the data for statewide conservation.
State Wildlife Action Plan - This plan identifies habitat fragmentation as a major stressor on wildlife. Connectivity conservation is identified as a key action both statewide and in four of eight terrestrial ecoregions analyzed in the plan; however, the plan did not provide a map or list of priorities for important connectivity areas or linkages. This product fills that need.
Land Acquisition Planning – Fish and Game intends to use this data to complement ACE II, its tool for identifying areas of conservation priority.
California Climate Change Adaptation Strategy – Connectivity, or establishing large and connected reserves, has been identified as the primary strategy for accommodating shifts in species ranges.

42
California Transportation Plan 2035 (California Interregional Blueprint)
California Water Plan
Use as a data layer for integrated infrastructure and conservation planning.
Statewide Strategy: Infrastructure (Chapter 7)
Here are some intended uses of the data for statewide infrastructure planning.
Other examples include high speed rail planning, energy project sighting, etc.

43
Natural Community Conservation Plans (NCCPs) and Habitat Conservation Plans (HCPs)
Regional Land Management Planning
Facilitate connectivity of reserves within and across planning boundaries
Focus management actions in locations where connectivity could be maintained, enhanced, or restored.
Regional and Local Strategy: Conservation (Chapter 7)
Here are some of the intended uses of the data for regional and local conservation.
NCCPs and HCPs – Both NCCPs and HCPs build connected reserve systems within planning boundaries. Connectivity of habitat beyond the boundaries of the individual plan is an additional requirement of an NCCP. This product facilitates planning for connectivity.
Regional Land Management Planning – Land management agencies such as the US Forest Service or US Bureau of Land Management can use this product to focus management actions in places where connectivity could be maintained, enhanced, or restored.

44
California Regional Blueprint Planning
Mitigation Planning
Infrastructure Improvements
Project Specific Connectivity
Use as a framework for regional and local level analyses.
Strategically site mitigation in places where it can enhance connectivity.
Inform programming, alternatives, and mitigation estimates
Reduce roadkill/operational effects.
Regional and Local Strategy: Infrastructure (Chapter 7)
Here are some intended uses for integration with regional and local infrastructure planning. These examples are transportation related. However, the planning, programming and implementing application of the products can apply to other infrastructure agencies.
California Regional Blueprint Planning - can use the regional and local level analysis frameworks outlined in the Strategic Plan to help design a green-print for connectivity in the region to inform planning scenarios.
Mitigation Planning - can be done to project needs for connectivity in a region.
Infrastructure improvements - can be planned in a way that programs adequate dollars for connectivity improvements, evaluates alternatives for avoiding and minimizing impacts to connectivity, and provides more detailed estimates for mitigation needs.
Project specific connectivity – can follow considerations outlined in Chapter 6, which should reduce roadkill and improve operational effects on highway systems.
45
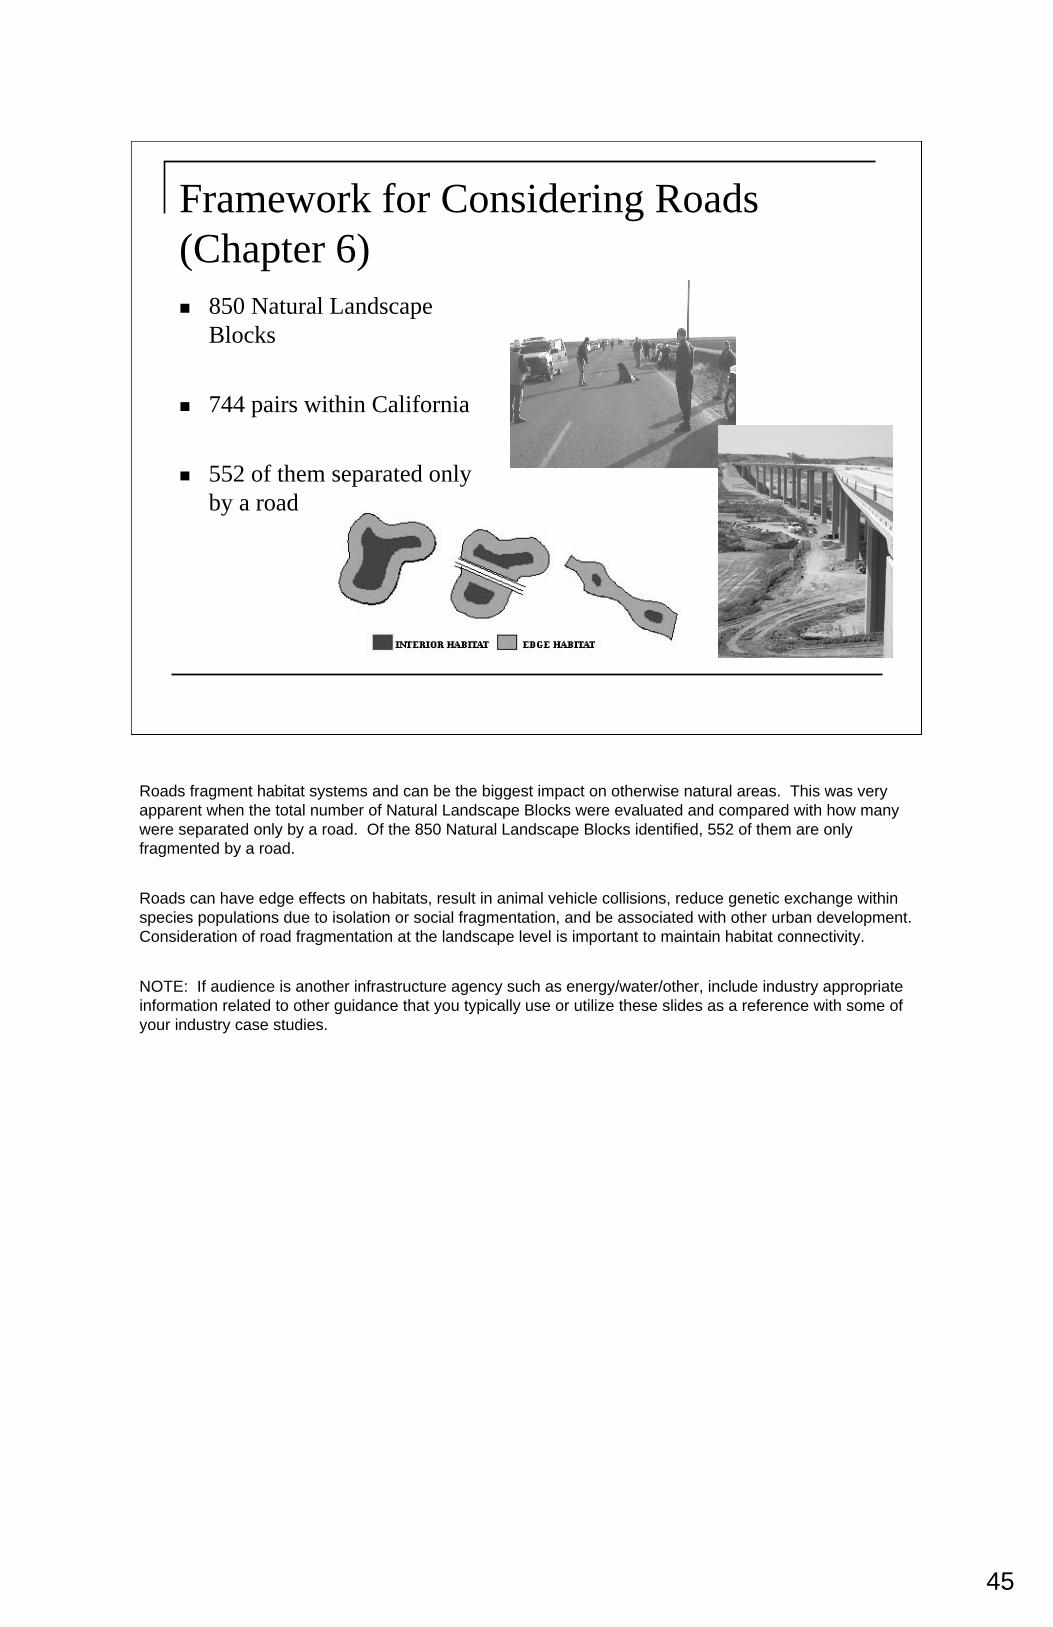
Framework for Considering Roads (Chapter 6)
850 Natural Landscape Blocks
744 pairs within California
552 of them separated only by a road
Roads fragment habitat systems and can be the biggest impact on otherwise natural areas. This was very apparent when the total number of Natural Landscape Blocks were evaluated and compared with how many were separated only by a road. Of the 850 Natural Landscape Blocks identified, 552 of them are only fragmented by a road.
Roads can have edge effects on habitats, result in animal vehicle collisions, reduce genetic exchange within species populations due to isolation or social fragmentation, and be associated with other urban development. Consideration of road fragmentation at the landscape level is important to maintain habitat connectivity.
NOTE: If audience is another infrastructure agency such as energy/water/other, include industry appropriate information related to other guidance that you typically use or utilize these slides as a reference with some of your industry case studies.

46
Framework for Considering Roads (Chapter 6): Avoidance
Initial concept Avoidance
Avoidance of intact habitat is an option (Figure B).
47
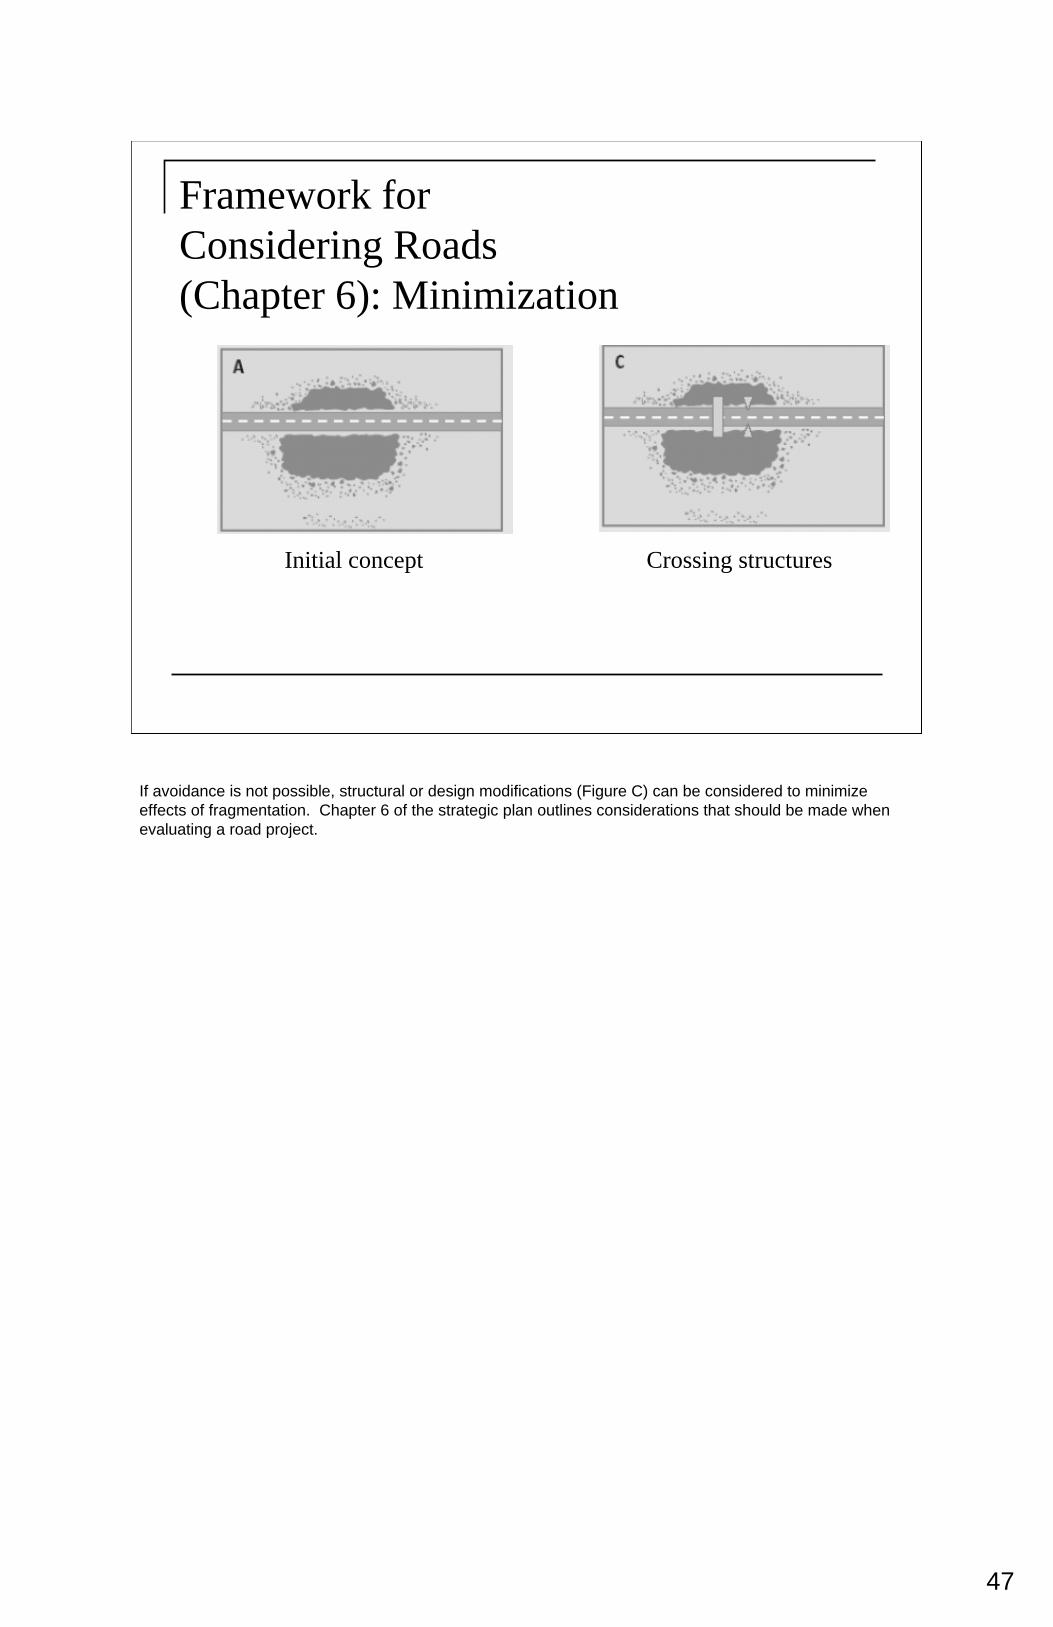
Framework for Considering Roads (Chapter 6): Minimization
Initial concept Crossing structures
If avoidance is not possible, structural or design modifications (Figure C) can be considered to minimize effects of fragmentation. Chapter 6 of the strategic plan outlines considerations that should be made when evaluating a road project.

48
Types of Crossing Structures
Good for elk and mule deer
Good for small mammals and amphibians
Good for pronghorn
When considering structural or design modification elements to maintain connectivity, it is important to consider what species you anticipate using the crossing. Above are some examples of crossing structures that offer adequate elements for specific species.
A large spanning bridge for elk/mule deer provides an ample opening that allows them to freely move beneath the highway. (top left) A vegetative overpass provides optimal visibility for species such as pronghorn, who need to be aware of predators. (right) Addition of rock in a culvert can provide refuge and safe passage for small mammals and amphibians during flood events. (bottom left)

49
Spacing of Crossing Structures
One per mile
One per quarter mile
Other considerations in design are placement and repetition within a region/corridor to provide multiple paths or opportunities for movement between natural landscape blocks.

50
Why are there many different solutions?Species Considerations
resource/access needspredator/prey relationshipssize
Site Constraintstopographywaterexisting road substrate
Design Considerationsfencinglighting
There is no one solution that will work everywhere.
Considerations related to the species you are trying to accommodate with design or structural modifications might include resource needs/access, attention to predator prey relationships, or the size of the target species.
Site constraints such as topography, water, existing infrastructure or substrate may dictate what solutions are possible.
Several different solutions may be available that are related to how a project is designed. A project proposal that minimizes lighting or increases fencing may avoid or minimize effects to wildlife movement in an area.

51
More Information:
California Essential Habitat Connectivity Project Websites
http://www.dfg.ca.gov/habcon/connectivity
http://www.dot.ca.gov/hq/env/bio/program_efforts.htm
Wildlife Crossing Guidance Manual
http://www.dot.ca.gov/hq/env/bio/wildlife_crossings.htm
More information on this an related projects is available on several websites.


![Evaluating gene flow and habitat connectivity between S ... · [Escrever o nome da empresa] Evaluating gene flow and habitat connectivity between S. salamandra lineages across heterogeneous](https://static.fdocuments.us/doc/165x107/5c04069809d3f2e5418d1357/evaluating-gene-flow-and-habitat-connectivity-between-s-escrever-o-nome.jpg)
