CALIFORNIA ENERGY COMMISSION California Energy Commission Spring 2006 Price Spike Report Media...
42
CALIFORNIA ENERGY COMMISSION California Energy Commission Spring 2006 Price Spike Report Media Briefing August 15, 2006 Joseph Desmond Undersecretary of Energy Affairs, Resources Agency
-
Upload
adela-mathews -
Category
Documents
-
view
213 -
download
0
Transcript of CALIFORNIA ENERGY COMMISSION California Energy Commission Spring 2006 Price Spike Report Media...

CALIFORNIA ENERGY COMMISSION
California Energy CommissionSpring 2006 Price Spike Report
Media Briefing
August 15, 2006
Joseph DesmondUndersecretary of Energy Affairs, Resources Agency

CALIFORNIA ENERGY COMMISSION
• Factors identified that contributed to price spike• Economic impact quantified for California consumers
and businesses• Regional extent of price spike analyzed in detail• Statewide variability of gasoline retail prices was
characterized• Financial information assessed to identify levels of
profitability for petroleum companies operating in California
• Recommendations developed to enable more thorough monitoring and analysis of California’s petroleum market
California Energy CommissionReport Results

CALIFORNIA ENERGY COMMISSION
Price Spikes and the Petroleum Market

CALIFORNIA ENERGY COMMISSION
California Retail Fuel PricesGasoline and Diesel Fuel versus
Alaska North Slope (ANS) Crude OilJanuary 2005 through July 2006
80
130
180
230
280
330
380
1/3
/20
05
2/3
/20
05
3/3
/20
05
4/3
/20
05
5/3
/20
05
6/3
/20
05
7/3
/20
05
8/3
/20
05
9/3
/20
05
10
/3/2
00
5
11
/3/2
00
5
12
/3/2
00
5
1/3
/20
06
2/3
/20
06
3/3
/20
06
4/3
/20
06
5/3
/20
06
6/3
/20
06
7/3
/20
06
8/3
/20
06
Ce
nts
Pe
r G
all
on
Gasoline
Diesel Fuel
ANS Crude Oil
Sources: Energy Information Administration (EIA) – California retail prices. Alaska crude oil prices – Wall Street Journal.
CALIFORNIA ENERGY COMMISSION
California Gasoline Monthly DemandSeasonal Increases2003-2005 Average
41.0
41.5
42.0
42.5
43.0
43.5
44.0
44.5
45.0
45.5Ja
nuar
y
Feb
ruar
y
Mar
ch
Apr
il
May
June
July
Aug
ust
Mill
ion
s o
f G
allo
ns
per
Day
Monthly AverageLinear (Monthly Average)
Source: Analysis of California State Board of Equalization taxable gasoline sales figures.
CALIFORNIA ENERGY COMMISSION
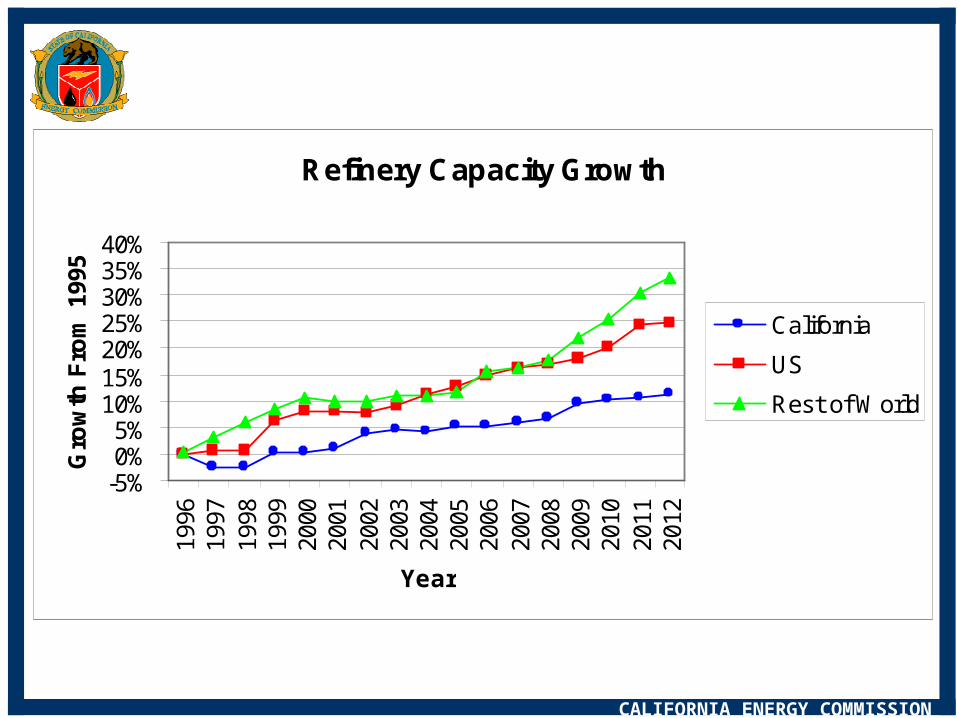
Refinery Capacity Growth
-5%0%5%
10%15%20%25%30%35%40%
1996
1997
1998
1999
2000
2001
2002
2003
2004
2005
2006
2007
2008
2009
2010
2011
2012
Year
Gro
wth
Fro
m 1
995
California
US
Rest of World
Avg Annual Growth
CA: 0.7%US: 1.5%
World: 2.0%

CALIFORNIA ENERGY COMMISSION
Refinery Count
0255075
100125150175200
1995
1996
1997
1998
1999
2000
2001
2002
2003
2004
2005
2006
Year
Nu
mb
er o
f R
efin
erie
s
Rest of US
California

CALIFORNIA ENERGY COMMISSION
Types of petroleum products that are produced by refineries are influenced by:– fuel specifications– quality of the crude oil processed– complexity of the refinery– supply/demand balance of the local petroleum
markets

CALIFORNIA ENERGY COMMISSION
California Refinery Output in 2005 by Product Type
CARB Compliant Gasoline*
43.1%
CARB Diesel11.6%
Jet Fuel12.4%
Non-California Gasoline
7.4%
EPA Diesel4.7%
*Note: Does not include ethanol.

CALIFORNIA ENERGY COMMISSION
2005 Demand for Petroleum and Alternative Fuels (millions of gallons)
53.5955
14,9633,734
2,960
Gasoline (excluding Ethanol)
Jet Fuel
DieselEthanol
Other Alternative Fuels

CALIFORNIA ENERGY COMMISSION
Market Operational Factors that Contributed to the Spring 2006 Price Spike
• Refinery unplanned outages and planned maintenance
• Refinery production of gasoline and diesel fuel• Inventory levels for petroleum products• Pipeline exports to Nevada and Arizona• Congestion of marine infrastructure operations in
Southern California• March 2006 Alaska North Slope crude oil distribution
system leak • Transition to new fuel specifications

CALIFORNIA ENERGY COMMISSION
California Refinery Events - Number of Days (First Six Months of 2005 versus 2006)
632
539
58
175
0
100
200
300
400
500
600
700
Jan-Jun 2005 Jan-Jun 2006
Day
s
Total Planned Maintenance Days
Total Unplanned Outage Days
Source: CEC Petroleum Industry Information Reporting Act (PIIRA) database.

CALIFORNIA ENERGY COMMISSION
Average Number of Days per California Refinery Event (First Six Months of 2005 versus 2006)
20.7
5.3
24.3
9.2
0
5
10
15
20
25
30
Jan-Jun 2005 Jan-June 2006
Day
s
Planned Maintenance
Unplanned Outages
Source: CEC Petroleum Industry Information Reporting Act (PIIRA) database.

CALIFORNIA ENERGY COMMISSION
Number of Event Days for California Refineries April/May 2005 versus April/May 2006
50
8476
75
0
10
20
30
40
50
60
70
80
90
April/May 2005 April/May 2006
Da
ys
Planned MaintenanceUnplanned Outages
7 Events
6 Events 6 Events
9 Events
Source: CEC Petroleum Industry Information Reporting Act (PIIRA) database.

CALIFORNIA ENERGY COMMISSION
5,000
5,500
6,000
6,500
7,000
7,500
8,000
8,500
8/5
/20
05
8/1
9/2
00
5
9/2
/20
05
9/1
6/2
00
5
9/3
0/2
00
5
10
/14
/20
05
10
/28
/20
05
11
/11
/20
05
11
/25
/20
05
12
/9/2
00
5
12
/23
/20
05
1/6
/20
06
1/2
0/2
00
6
2/3
/20
06
2/1
7/2
00
6
3/3
/20
06
3/1
7/2
00
6
3/3
1/2
00
6
4/1
4/2
00
6
4/2
8/2
00
6
5/1
2/2
00
6
5/2
6/2
00
6
6/9
/20
06
6/2
3/2
00
6
7/7
/20
06
7/2
1/2
00
6
8/4
/20
06
Th
ou
sa
nd
s o
f B
arr
els
pe
r W
ee
k
Current Year
CARB Gasoline Production(with 5-Year High-Low Band)
Source: CEC Petroleum Industry Information Reporting Act (PIIRA) database.

CALIFORNIA ENERGY COMMISSION

CALIFORNIA ENERGY COMMISSION

CALIFORNIA ENERGY COMMISSION

CALIFORNIA ENERGY COMMISSION
Weekly Gasoline Pipeline Exports from California(with 5-Year Hi-Lo Band and Retail Gasoline Price Overlay)
0
200
400
600
800
1,000
1,200
1,400
1,6007
/18
/20
05
8/1
/20
05
8/1
5/2
00
5
8/2
9/2
00
5
9/1
2/2
00
5
9/2
6/2
00
5
10
/10
/20
05
10
/24
/20
05
11
/7/2
00
5
11
/21
/20
05
12
/5/2
00
5
12
/19
/20
05
1/2
/20
06
1/1
6/2
00
6
1/3
0/2
00
6
2/1
3/2
00
6
2/2
7/2
00
6
3/1
3/2
00
6
3/2
7/2
00
6
4/1
0/2
00
6
4/2
4/2
00
6
5/8
/20
06
5/2
2/2
00
6
6/5
/20
06
6/1
9/2
00
6
7/3
/20
06
Th
ou
sa
nd
s o
f B
arr
els
pe
r W
ee
k
Shipments
Source: CEC Petroleum Industry Information Reporting Act (PIIRA) database.
CALIFORNIA ENERGY COMMISSION
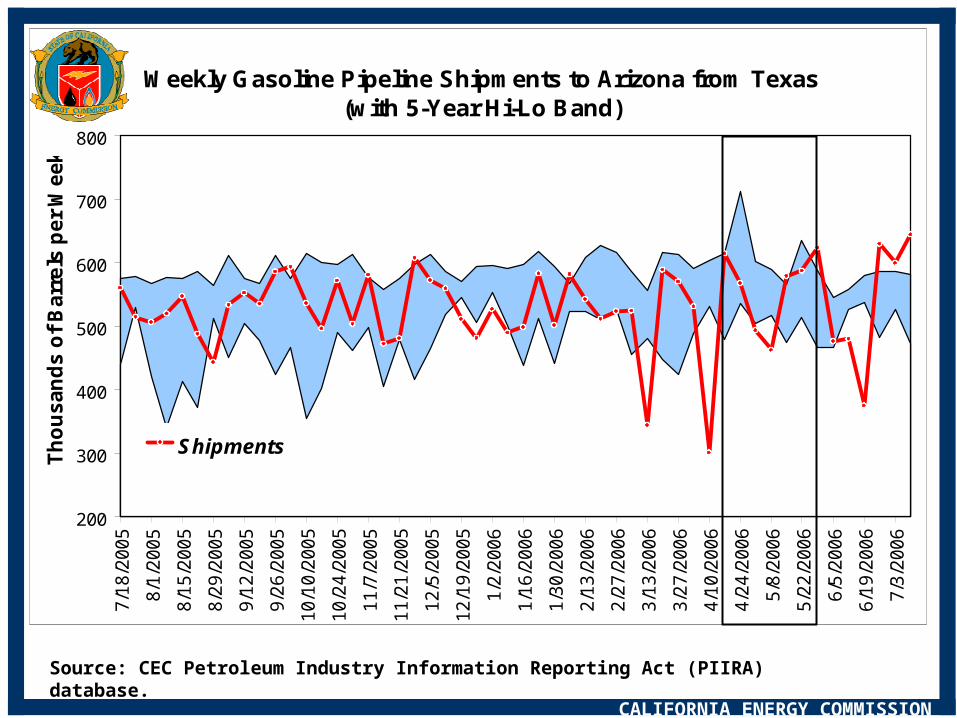
Weekly Gasoline Pipeline Shipments to Arizona from Texas(with 5-Year Hi-Lo Band)
200
300
400
500
600
700
8007
/18
/20
05
8/1
/20
05
8/1
5/2
00
5
8/2
9/2
00
5
9/1
2/2
00
5
9/2
6/2
00
5
10
/10
/20
05
10
/24
/20
05
11
/7/2
00
5
11
/21
/20
05
12
/5/2
00
5
12
/19
/20
05
1/2
/20
06
1/1
6/2
00
6
1/3
0/2
00
6
2/1
3/2
00
6
2/2
7/2
00
6
3/1
3/2
00
6
3/2
7/2
00
6
4/1
0/2
00
6
4/2
4/2
00
6
5/8
/20
06
5/2
2/2
00
6
6/5
/20
06
6/1
9/2
00
6
7/3
/20
06
Th
ou
sa
nd
s o
f B
arr
els
pe
r W
ee
k
Shipments
Source: CEC Petroleum Industry Information Reporting Act (PIIRA) database.

CALIFORNIA ENERGY COMMISSION
Source: CEC analysis of Marine Exchange of Southern California data.
Petroleum Product Tanker Arrivals/Activitiesin Southern California versus
LA Spot CARBOB Prices (April-May 2006)
0
1
2
3
4
5
6
7
8
4/1
/06
4/5
/06
4/9
/06
4/1
3/0
6
4/1
7/0
6
4/2
1/0
6
4/2
5/0
6
4/2
9/0
6
5/3
/06
5/7
/06
5/1
1/0
6
5/1
5/0
6
5/1
9/0
6
5/2
3/0
6
5/2
7/0
6
5/3
1/0
6
$1.50
$1.75
$2.00
$2.25
$2.50
$2.75
$3.00
$3.25New Arrivals in Region
Number of ActivitiesSpot CARBOB Prices

CALIFORNIA ENERGY COMMISSION

CALIFORNIA ENERGY COMMISSION
• Price spike increased gasoline costs to California consumers by $1.3 billion from April 25 through July 31, 2006
• The impact on businesses due to higher diesel fuel prices over the same period of time was approximately $170 million
• No attempt was made to quantify secondary costs for the California economy as a whole that occur when increased transportation costs are passed to consumers in the form of higher priced goods and services.
Economic Impact on California Consumers and Business

CALIFORNIA ENERGY COMMISSION
2005 and 2006 Average Weekly Retail Gasoline Price Minus Weekly Alaska North Slope (ANS) Crude Oil Price
$1.00
$1.10
$1.20
$1.30
$1.40
$1.50
$1.60
$1.70
$1.804
-Ap
r
11
-Ap
r
18
-Ap
r
25
-Ap
r
2-M
ay
9-M
ay
16
-Ma
y
23
-Ma
y
30
-Ma
y
6-J
un
13
-Ju
n
20
-Ju
n
27
-Ju
n
4-J
ul
11
-Ju
l
18
-Ju
l
25
-Ju
l
Dif
fere
nc
e p
er
Ga
llo
n (
Do
lla
rs)
2005
2006
Sources: Energy Information Administration (EIA) – California retail prices. CA BOE – taxable gasoline fuel sales. Alaska crude oil prices – Wall Street Journal.

CALIFORNIA ENERGY COMMISSION
Incremental Transportation Fuel CostsCalifornia Consumers & Business
$0
$20
$40
$60
$80
$100
$120
$140
$160
5/1
/20
06
5/8
/20
06
5/1
5/2
00
6
5/2
2/2
00
6
5/2
9/2
00
6
6/5
/20
06
6/1
2/2
00
6
6/1
9/2
00
6
6/2
6/2
00
6
7/3
/20
06
7/1
0/2
00
6
7/1
7/2
00
6
7/2
4/2
00
6
7/3
1/2
00
6
Week Ending
Mil
lio
ns
of
Do
lla
rs P
er
We
ek
Gasoline
Diesel Fuel
Sources: Energy Information Administration (EIA) – California retail prices. CA BOE – taxable gasoline fuel sales. Alaska crude oil prices – Wall Street Journal.

CALIFORNIA ENERGY COMMISSION

CALIFORNIA ENERGY COMMISSION
U.S. Annual Indices of Real Disposable Income, Vehicle Miles Traveled, Consumer Price Index (CPI-U), Average Fuel
Economy, and Real Average Retail Gasoline Prices(1978-2004, 1985=100)
0
20
40
60
80
100
120
140
160
180
200
1977
1979
1981
1983
1985
1987
1989
1991
1993
1995
1997
1999
2001
2003
Ind
ex (
1985
=10
0)
CPI-U: All Items less food and energy Real Disposable Personal Income
Real Retail Motor Gasoline Prices Vehicle Miles Traveled
24.8 MPG
25.4 MPG26.0 MPG
25.6MPG
24.7 MPG
24.5 MPG
Sources: Energy Information Administration (EIA), National Household Transportation Survey (NHTS), and Bureau of Labor Statistics (BLS).

CALIFORNIA ENERGY COMMISSION
• Price spike was not isolated to California’s market• Retail prices in neighboring states that are supplied by
California refineries demonstrated the closest correlation• States more distant from California did not demonstrate a
similar relationship• California retail distribution margins declined and were
temporarily negative during the spike in wholesale gasoline prices
Regional and Statewide Retail Gasoline Price Variations

CALIFORNIA ENERGY COMMISSION
Retail Gasoline Price Comparisons(Arizona, California, and Nevada)
200
220
240
260
280
300
320
340
36001
/05/
06
01/1
2/0
601
/19/
06
01/2
6/0
602
/02/
06
02/0
9/0
6
02/1
6/0
602
/23/
06
03/0
2/0
603
/09/
06
03/1
6/0
603
/23/
06
03/3
0/0
604
/06/
06
04/1
3/0
604
/20/
06
04/2
7/0
6
05/0
4/0
605
/11/
06
05/1
8/0
605
/25/
06
06/0
1/0
606
/08/
06
06/1
5/0
606
/22/
06
06/2
9/0
607
/06/
06
07/1
3/0
6
07/2
0/0
607
/27/
06
08/0
3/0
6
Cen
ts p
er G
allo
n Arizona California Nevada
Source: Oil Price Information Service (OPIS).

CALIFORNIA ENERGY COMMISSION
Retail Gasoline Price Comparisons(California, Montana, and Wyoming)
200
220
240
260
280
300
320
340
36001
/05/
06
01/1
2/0
601
/19/
06
01/2
6/0
602
/02/
06
02/0
9/0
602
/16/
06
02/2
3/0
603
/02/
06
03/0
9/0
603
/16/
06
03/2
3/0
603
/30/
06
04/0
6/0
604
/13/
06
04/2
0/0
604
/27/
06
05/0
4/0
605
/11/
06
05/1
8/0
605
/25/
06
06/0
1/0
606
/08/
06
06/1
5/0
606
/22/
06
06/2
9/0
607
/06/
06
07/1
3/0
607
/20/
06
07/2
7/0
608
/03/
06
Cen
ts p
er G
allo
n Wyoming California Montana
Source: Oil Price Information Service (OPIS).

CALIFORNIA ENERGY COMMISSION
California Gasoline Margins
-25
0
25
50
75
100
125
150
175
200
225
250
275
300
325
35001
/05/
06
01/1
2/0
6
01/1
9/0
6
01/2
6/0
6
02/0
2/0
6
02/0
9/0
6
02/1
6/0
6
02/2
3/0
6
03/0
2/0
6
03/0
9/0
6
03/1
6/0
6
03/2
3/0
6
03/3
0/0
6
04/0
6/0
6
04/1
3/0
6
04/2
0/0
6
04/2
7/0
6
05/0
4/0
6
05/1
1/0
6
05/1
8/0
6
05/2
5/0
6
06/0
1/0
6
06/0
8/0
6
06/1
5/0
6
06/2
2/0
6
06/2
9/0
6
07/0
6/0
6
07/1
3/0
6
07/2
0/0
6
07/2
7/0
6
08/0
3/0
6
Cen
ts p
er G
allo
n
Distribution Margin
Taxes
Refiner Margin
Crude Oil
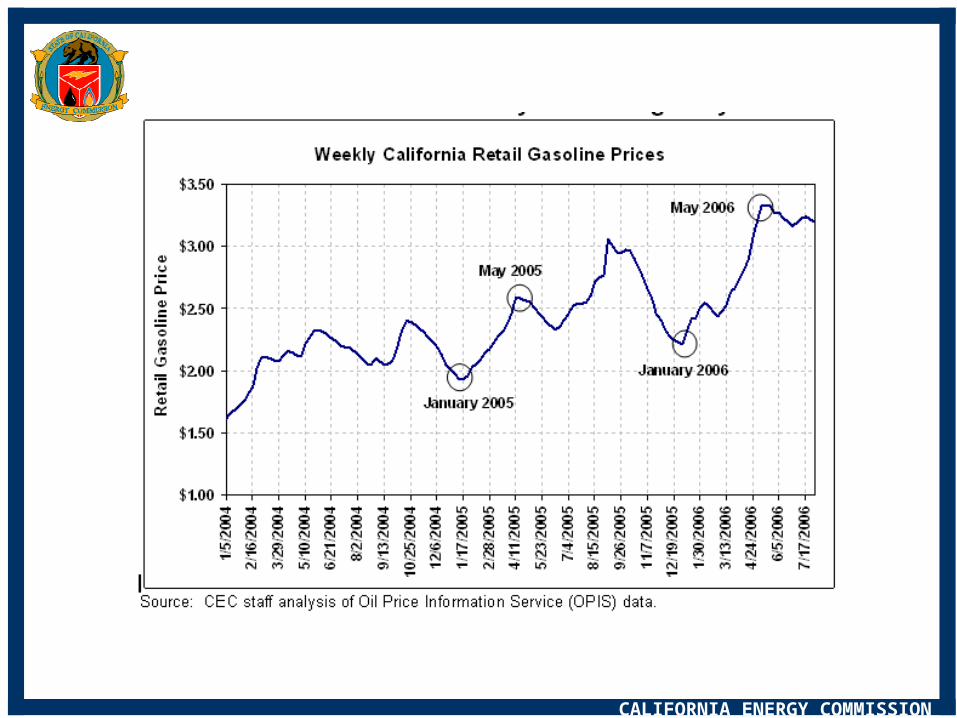
Source: CEC staff analysis Oil Price Information Service (OPIS) data.
CALIFORNIA ENERGY COMMISSION

CALIFORNIA ENERGY COMMISSION
California City Analysis of Gasoline Prices(May 2006)
$0.00
$0.02
$0.04
$0.06
$0.08
$0.10
$0.12
$0.14
$0.16
$0.18
$0.20
$2.50 $2.70 $2.90 $3.10 $3.30 $3.50 $3.70 $3.90 $4.10
Average Retail Gasoline Price
Sta
nd
ard
De
via
tio
n
High Prices, High VariabilityLow Prices, High Variability
Low Prices, Low Variability High Prices, Low Variability
Shaded area denotes 95 percent of the cities measured in the state.

CALIFORNIA ENERGY COMMISSION
Low Prices, High Variability Cities include Buttonwillow, Concord, Dixon, Marysville, Novato, Suisun City and Woodland. These cities tend to be near major roadways, and the stations can be characterized as having increased sales volumes and possibly increased competition.
High Prices, High Variability Cities such as Beverly Hills, Mill Valley, San Francisco, and South Lake Tahoe fall into this category. These cities can be characterized as having above-average land values that may affect the retail price.
Inc
reas
ing
Va
ria
bili
ty
Low Prices, Low Variability Very few areas of the state fall into the low-price, low-variability category. Cities such as Antelope, Hilmar, Frazier Park, Foresthill, and Shingle Springs fall into this category. These places may be categorized as being close to major roadways, but not directly accessible.
High Prices, Low Variability Cities in more remote regions of the state tend to have above-average prices combined with lower variability. These cities are characterized by having fewer retail outlets, lower volume sales, and higher fuel delivery costs. In some cases, these cities may have only one retail outlet. This high-price, low variability category includes such cities as Baker, Big Bear City, Mount Shasta, and Soledad.
Increasing Retail Price

CALIFORNIA ENERGY COMMISSION
• Petroleum industry has consolidated over the last 50 years• Several measures of profitability were used to compare major oil
companies with other integrated oil companies on an international level.
• The companies in the petroleum industry were grouped into the following categories: exploration & production (E&P), integrated, and refining & marketing (R&M).
Financial Data of Petroleum Companies

CALIFORNIA ENERGY COMMISSION
Source: Used with the written permission of John S. Herold, Inc.
CALIFORNIA ENERGY COMMISSION
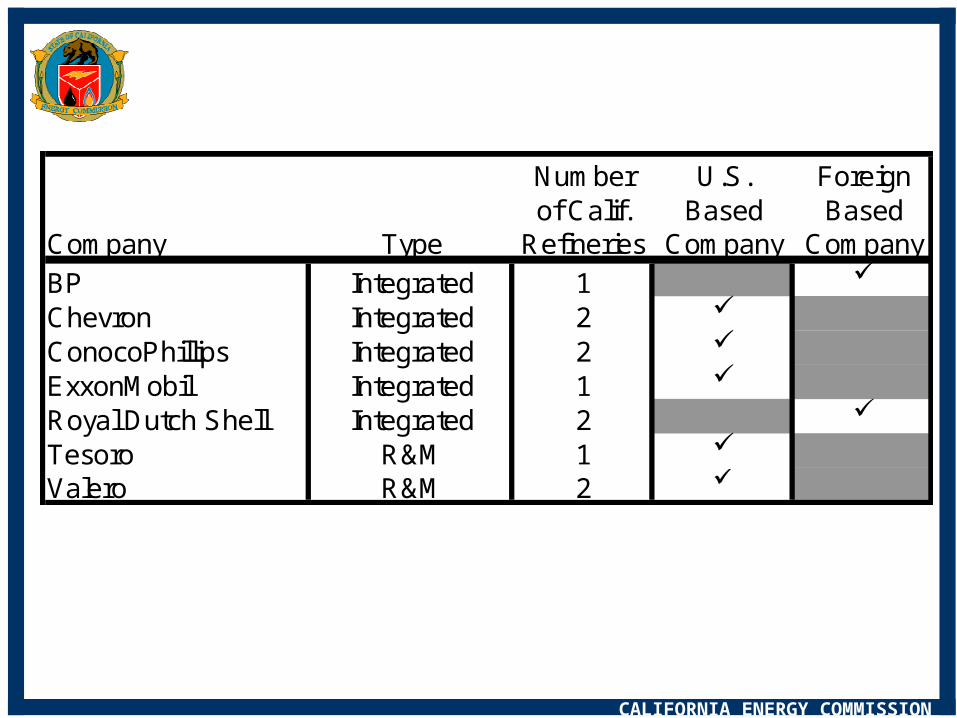
Number U.S. Foreignof Calif. Based Based
Company Type Refineries Company Company
BP Integrated 1 Chevron Integrated 2 ConocoPhillips Integrated 2 ExxonMobil Integrated 1 Royal Dutch Shell Integrated 2 Tesoro R&M 1 Valero R&M 2

CALIFORNIA ENERGY COMMISSION
Worldwide Net Income and Sources
-$2,500$0
$2,500$5,000$7,500
$10,000$12,500$15,000$17,500$20,000$22,500$25,000$27,500$30,000$32,500$35,000$37,500$40,000
BP
Ch
evr
on
Co
no
coP
hilli
ps
Exx
onM
ob
il
Sh
ell
Tes
oro
Va
lero BP
Ch
evr
on
Co
no
coP
hilli
ps
Exx
onM
ob
il
Sh
ell
Tes
oro
Va
lero BP
Ch
evr
on
Co
no
coP
hilli
ps
Exx
onM
ob
il
Sh
ell
Tes
oro
Va
lero BP
Ch
evr
on
Co
no
coP
hilli
ps
Exx
onM
ob
il
Sh
ell
Tes
oro
Va
lero
2003 2004 2005 First Half of 2006
Mill
ion
s o
f D
olla
rs
Non-Us Upstream US Upstream Non-US DownstreamUS Downstream Other Total Combined
Source: CEC analysis of company management reports, SEC 10-K, 10-Q, 20-F, and 6-K filings.

CALIFORNIA ENERGY COMMISSION
Profit Margins from Non-U.S. Operations
0%
5%
10%
15%
20%
25%
30%
35%
40%
Ch
evr
on
Co
no
co P
hill
ips
Exx
on M
ob
il
Ch
evr
on
Co
no
co P
hill
ips
Exx
on M
ob
il
Ch
evr
on
Co
no
co P
hill
ips
Exx
on M
ob
il
Ch
evr
on
Co
no
co P
hill
ips
Exx
on M
ob
il
Ch
evr
on
Co
no
co P
hill
ips
Exx
on M
ob
il
Ch
evr
on
Co
no
co P
hill
ips
Exx
on M
ob
il
Ch
evr
on
Co
no
co P
hill
ips
Exx
on M
ob
il
Ch
evr
on
Co
no
co P
hill
ips
Exx
on M
ob
il
2003 2004 2005 First Half2006
2003 2004 2005 First Half2006
Pro
fit
Mar
gin
(N
et In
co
me
/ Sal
es a
nd
Op
erat
ing
Rev
., in
cl.
inte
rseg
men
t re
v.)
Oil Exploration & Production Refining and Marketing
Source: CEC analysis of company management reports, SEC 10-K, 10-Q, 20-F, and 6-K filings.

CALIFORNIA ENERGY COMMISSION
Profit Margins from U.S. Operations
0%
5%
10%
15%
20%
25%
30%
35%
40%
45%
50%
Ch
evro
n
Co
noco
Ph
illip
s
Exx
on M
ob
il
Ch
evro
n
Co
noco
Ph
illip
s
Exx
on M
ob
il
Ch
evro
n
Co
noco
Ph
illip
s
Exx
on M
ob
il
Ch
evro
n
Co
noco
Ph
illip
s
Exx
on M
ob
il
Ch
evro
n
Co
noco
Ph
illip
s
Exx
on M
ob
il
Te
soro
Va
lero
Ch
evro
n
Co
noco
Ph
illip
s
Exx
on M
ob
il
Te
soro
Va
lero
Ch
evro
n
Co
noco
Ph
illip
s
Exx
on M
ob
il
Te
soro
Va
lero
Ch
evro
n
Co
noco
Ph
illip
s
Exx
on M
ob
il
Te
soro
Va
lero
2003 2004 2005 First Half2006
2003 2004 2005 First Half 2006
Pro
fit
Mar
gin
(N
et I
nco
me
/ S
ales
an
d O
per
atin
g R
ev.,
in
cl.
inte
rseg
men
t re
v.)
Oil Exploration & Production Refining and Marketing
Source: CEC analysis of company management reports, SEC 10-K, 10-Q, 20-F, and 6-K filings.

CALIFORNIA ENERGY COMMISSION
Summary

CALIFORNIA ENERGY COMMISSION
• Refinery Operations & Impact on Production– Gasoline production was lower due to unplanned refinery outages
• Inventory Levels– Gasoline levels were declining, but that is normal for the spring
• Pipeline Exports to Neighboring States, – Higher than 5 year average for gasoline– Higher than 5 year average for diesel fuel
• Congestion at Marine Terminals for Petroleum Imports– Increased at time of wholesale gasoline price spike
• March 2006 Alaska North Slope crude oil distribution system leak– Crude oil production declined by 100,000 barrels per day for 5 weeks
• Transition to New Fuel Specification– National transition away from MTBE (methyl tertiary butyl ether) to ethanol
increased price for important gasoline blendstock - alkylate– Switch to Ultra Low Sulfur Diesel (ULSD) on June 1, 2006 created a buildup of
inventories that were held in reserve as a precaution against startup problems for the new refinery equipment
Factors that Contributed to Price Spike


![STATE OF CALIFORNIA CALIFORNIA LAW REVISION COMMISSION · 1996] 191 STATE OF CALIFORNIA CALIFORNIA LAW REVISION COMMISSION RECOMMENDATION Unfair Competition Litigation November 1996](https://static.fdocuments.us/doc/165x107/5e087a1589d1845bbb4e6e15/state-of-california-california-law-revision-1996-191-state-of-california-california.jpg)