CALIFORNIA COMPLETE COUNT Counting 2010 and ... DEAR GOVERNOR BROWN: We are pleased to forward...
24
CALIFORNIA COMPLETE COUNT Counting 2010 and Planning for 2020 JUNE 2012 CENSUS 2010 REPORT HIGHLIGHTS
Transcript of CALIFORNIA COMPLETE COUNT Counting 2010 and ... DEAR GOVERNOR BROWN: We are pleased to forward...

C A L IFO RNI A C OMP L E T E C O UN T
Counting 2010 and Planning for 2020
JUNE 2012CENSUS 2010 REPORT HIGHLIGHTS
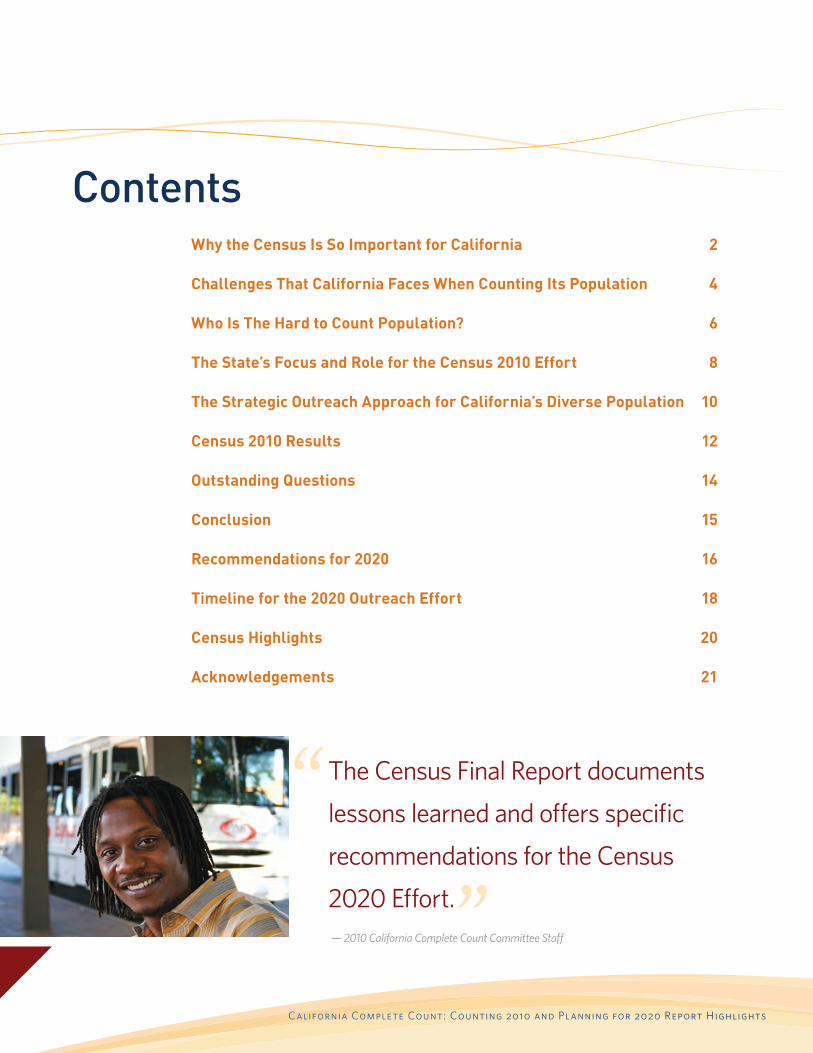
The Census Final Report documents
lessons learned and offers specifi c
recommendations for the Census
2020 Effort.
Contents
— 2010 California Complete Count Committee Staff
Why the Census Is So Important for California 2
Challenges That California Faces When Counting Its Population 4
Who Is The Hard to Count Population? 6
The State’s Focus and Role for the Census 2010 Effort 8
The Strategic Outreach Approach for California’s Diverse Population 10
Census 2010 Results 12
Outstanding Questions 14
Conclusion 15
Recommendations for 2020 16
Timeline for the 2020 Outreach Effort 18
Census Highlights 20
Acknowledgements 21
California Complete Count: Counting 2010 and Planning for 2020 Report Highlights
R
DEAR GOVERNOR BROWN:
We are pleased to forward California Complete Count: Counting 2010 and Planning for 2020, Final
Report and Highlights documents, submitted on behalf of the California Complete Count Committee
and produced by the Center for Collaborative Policy at California State University, Sacramento.
This Highlights document provides a high-level summary of the Final Report, which describes the
efforts of the Committee, appointed in 2008 by then-Governor Schwarzenegger. The Final Report
also identifi es the many lessons learned and offers detailed recommendations for the Census
2020 effort, including an argument for a greater state investment in outreach than was applied
to the 2010 efforts. Both the Final Report and this Highlights document are available at www.
californiacompletecount.org.
The California Complete Count Committee effort operated with a small budget of $2 million,
compared to $24.7 million for the 2000 Census outreach, leaving the Committee to rely heavily
on public-private partnerships to reach hard-to-count populations. The report fi nds that funding
and staffi ng constraints contributed to the decline in California’s Mail Participation Rate (MPR)
from 2000 to 2010, even as MPRs increased elsewhere in the country. California was the only
state of the fi ve largest to experience a decline in its MPR. This reduction in mail participation
implies an increase in undercounted populations because households that do not return the form
by mail must be counted by the U.S. Census Bureau in person.
California is the largest and hardest to count state. Ten of the country’s fi fty hardest to count
counties are in California – including Los Angeles, which is the single hardest to count county
in the country. It is unclear exactly how many Californians were missed in the 2010 count, but
the consequences are signifi cant. Estimates based on the 2000 Census undercount assume
that California lost over $100 million per year for 10 years (between 2002 and 2012) in federal
funding for only eight of the largest programs dependent on Census count data.
This report makes a strong argument that the return on investment to the state from Census
outreach is high and that the state should commit more resources to the 2020 effort than were
committed to the 2010 campaign.
Respectfully,
The Honorable Edmund G. Brown, Jr.
State Capitol, Suite 1173
Sacramento, CA 95814
BRIAN R. SALA, PH.D.
California Research Bureau
California State Library
DITAS KATAGUE
2010 Director
California Complete Count Committee Staff
1www.californiacompletecount.org
CENSUS 2010 | California Complete Count
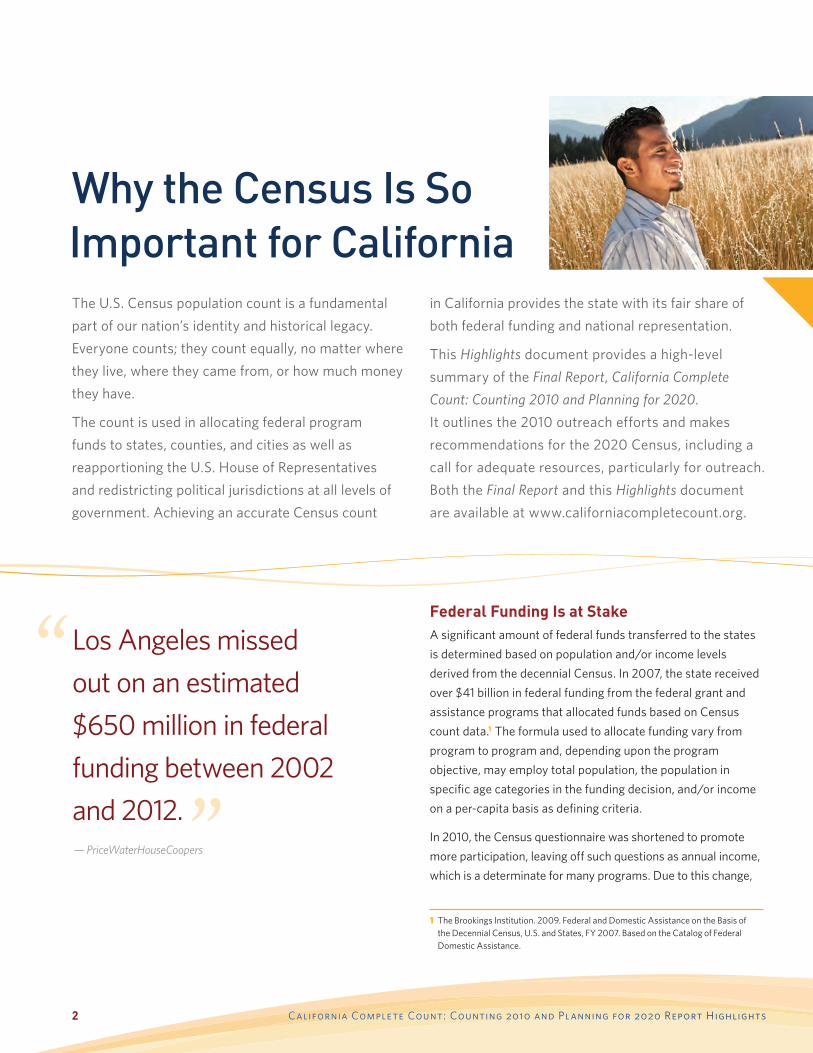
Why the Census Is So Important for California
Federal Funding Is at Stake A signifi cant amount of federal funds transferred to the states
is determined based on population and/or income levels
derived from the decennial Census. In 2007, the state received
over $41 billion in federal funding from the federal grant and
assistance programs that allocated funds based on Census
count data.1 The formula used to allocate funding vary from
program to program and, depending upon the program
objective, may employ total population, the population in
specifi c age categories in the funding decision, and/or income
on a per-capita basis as defi ning criteria.
In 2010, the Census questionnaire was shortened to promote
more participation, leaving off such questions as annual income,
which is a determinate for many programs. Due to this change,
Los Angeles missed
out on an estimated
$650 million in federal
funding between 2002
and 2012.
The U.S. Census population count is a fundamental
part of our nation’s identity and historical legacy.
Everyone counts; they count equally, no matter where
they live, where they came from, or how much money
they have.
The count is used in allocating federal program
funds to states, counties, and cities as well as
reapportioning the U.S. House of Representatives
and redistricting political jurisdictions at all levels of
government. Achieving an accurate Census count
in California provides the state with its fair share of
both federal funding and national representation.
This Highlights document provides a high-level
summary of the Final Report, California Complete
Count: Counting 2010 and Planning for 2020.
It outlines the 2010 outreach efforts and makes
recommendations for the 2020 Census, including a
call for adequate resources, particularly for outreach.
Both the Final Report and this Highlights document
are available at www.californiacompletecount.org.
1 The Brookings Institution. 2009. Federal and Domestic Assistance on the Basis of the Decennial Census, U.S. and States, FY 2007. Based on the Catalog of Federal Domestic Assistance.
— PriceWaterHouseCoopers
2 California Complete Count: Counting 2010 and Planning for 2020 Report Highlights

Total Allocation for the10 Largest Programs for
All States in 2007
$372.33 BILLION+
on an estimated $650 million in federal funding between 2002
and 2012. Since this PriceWaterHouseCoopers estimate only
looked at eight federal programs, and many more programs
use the Census for their allocations, the true loss in funding
for California based on the 2000 undercount is much higher.
Representation Is at Stake The Census also provides the population count for
apportionment of the U.S. House of Representatives and
the subsequent redistricting of state legislative bodies and
local city and county elected entities. In 2010, California
faced the possible loss of a Congressional seat based on U.S.
Census Bureau’s projected undercount. If California had lost
a Congressional seat, it would have been the fi rst time since
becoming a state. Fortunately, based on the 2010 Census,
California retained the size of its Congressional delegation.
the amount of federal funds allocation based on the 2010 or
2020 Census count is unclear. Many programs may now rely
on the annual American Communities Survey to provide data for
annual income and use the decennial Census for population data.
WHAT DOES AN UNDERCOUNT COST?
According to PriceWaterHouseCoopers,2 based on the estimated
2000 Census undercount, California lost an estimated $1.5
billion on only eight federal programs that use the Census as
the basis for allocation (these programs include Medicare, Child
Care, Development Block Grants, Foster Care, Rehabilitation
Services Basic Support, Social Services Block Grants, Adoption
Assistance, and Vocational Educational Basic Grants). Los
Angeles County took the largest loss nationally, missing out
2 PriceWaterHouseCoopers. “Effect of Census 2000 Undercount on Federal Funding to States and Selected Counties, 2002-2012”. Prepared for the U.S. Census Monitoring Board, Presidential Members. 2001.”
Graphic 1: The Ten Largest Federal Grant Programs That Allocate Funds Based on Census Count/Data The following is based on a U.S. Census Bureau Report: “Uses of Population and Income Statistics in Federal Funds Distribution – With a Focus on Census Bureau Data” which examined 2007 U.S. Catalog of Federal Domestic Assistance data. The total allocation based on Census Count/Data for all states in 2007 was $446.44 billion plus.
Health & Human Services Medical Assistance
$203.49 Billion
Education Federal Pell Grant Program
$13.66 Billion
LaborUnemployment Insurance
$35.89 Billion
Education Title I Grants to Local Agencies
$12.83 Billion
Transportation Highway Planning & Construction
$34.15 Billion
Education Special Education Grants to States
$10.78 Billion
Agriculture National School Lunch Program
$7.83 Billion
Health & Human Services Temporary Assistance forNeedy Families
$16.47 Billion
Health and Human Services Head Start
$6.86 Billion
Agriculture Supplemental Nutrition Assistance
$30.31 Billion
3www.californiacompletecount.org
CENSUS 2010 | California Complete Count
The U.S. Census Bureau operates from Census tracts that
are small, relatively permanent statistical subdivisions of a
county. Census tracts usually have between 2,500 and 8,000
people, and when fi rst delineated, they are designed to be
homogeneous with respect to population characteristics,
economic status, and living conditions. Census tracts do not
cross county boundaries. The spatial size of Census tracts
varies widely depending on population density. Census
tract boundaries are delineated with the intention of being
maintained over a long period of time so that statistical
comparisons can be made from Census to Census.
The U.S. Census Bureau deems a Census tract hard-to-count
(HTC) based on housing, demographic, and socioeconomic
variables that are correlated with the nonresponse and
undercounting from the previous Census year. A Census
tract is then given a HTC score based on these variables,
indicating the diffi culty in terms of enumerating or counting.
For the 2010 Census, the HTC analysis was done using the
characteristics of the 2000 Census tracts. According to the
California Department of Finance, California had a total of
7,049 Census tracts in the 2000 Census; the HTC score
was calculated for 7,041 (the remaining tracts were either
water tracts or tracts with no population). Of these tracts,
1,441 or 20.5 percent were HTC, meaning that 20.5 percent
of California’s populated area is considered a HTC Census
tract. For the 2010 Census, California had 8,057 Census
tracts, which will be the basis for the 2020 HTC calculation.
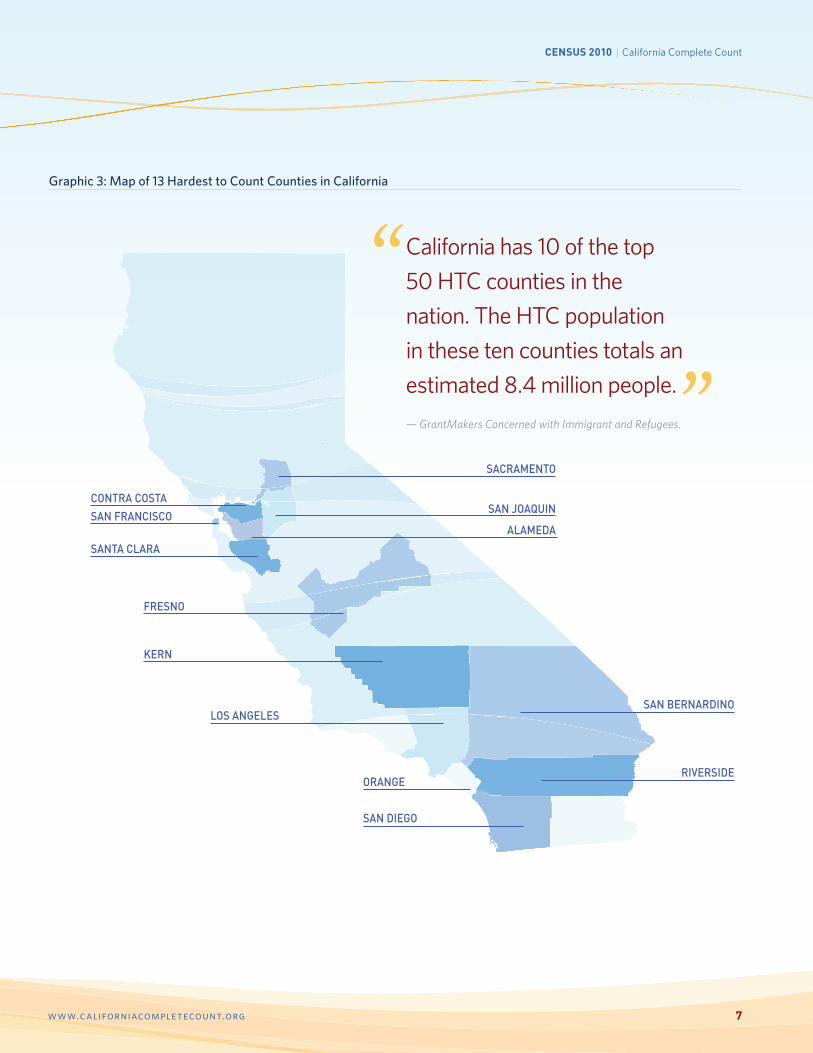
California has ten of the top 50 HTC counties in the nation.
The HTC population in these ten counties totals an estimated
8.4 million people, the approximate population of New Jersey
(the eleventh most populous state).3 Los Angeles County,
which is larger than 42 states, is considered the hardest-to-
count county in the country.
CALIFORNIA IS HARD TO COUNT
Challenges That California Faces When Counting Its PopulationWith each Census, California faces many challenges in accurately counting its population.
3 Grantmakers Concerned with Immigrants and Refugees, Proposal to Support Statewide Census Coordination. May 2009.
4 California Complete Count: Counting 2010 and Planning for 2020 Report Highlights

$ $
California faced two additional diffi culties in 2010 – the
economic downturn and the rise in immigrant fears of
participating in the Census.
The mortgage crisis and high unemployment in 2010
added challenges to reaching HTC areas. For families
facing foreclosure or unemployment, the Census seemed
inconsequential. Moreover, as families lost their jobs and
homes, they relocated, sometimes into temporary housing,
sometimes outside of California, making counting California’s
population more challenging.
In addition to the nation’s economic downturn, prior to the
Census, California faced an unprecedented budget crisis.
California’s budget defi cit limited the resources available for
the 2010 Census effort. Facing pressures to make cuts, the
state allocated only $2 million for the effort. Adding to the
diffi culties, due to the state government hiring freeze, 2010
Census staff had to be borrowed from other state agencies.
According to the Grantmakers Concerned with Immigrants and
Refugees report, California is home to 25 percent of the nation’s
undocumented immigrants. Undocumented immigrants are
among the HTC populations in California. In 2010, the Latino
Clergy Association advocated the Latino Census Boycott to
create pressure for immigration reform by excluding the large
number of undocumented residents living and working in the
U.S. from the Census.
The April 2010 passage of Arizona’s Senate Bill 1070, related to
the enforcement of federal immigration laws, also contributed
to undocumented residents’ hesitancy to respond to the
Census count. The Arizona law created fear among California’s
undocumented residents about interacting with government
workers, including Census enumerators. This concern made it
all the more important for the state and its partners to inform
residents that Census participation was safe and confi dential.
ECONOMY IMMIGRANT FEARS
HARDEST TO COUNT COUNTY IN THE NATION
LOS ANGELES
ESTIMATED LOSS ON JUST8 FEDERAL PROGRAMS*
$1.5 BILLION
*Based on 2000 Census DataReference: See footnote 2 on page 3.
Graphic 2: Census Data at a Glance
5www.californiacompletecount.org
CENSUS 2010 | California Complete Count

The U.S. Census Bureau has done considerable research
to defi ne populations who are least likely to return Census
questionnaires.4 Since 1940, scientifi c evaluations have
confi rmed that the Census misses higher proportions of racial
and ethnic minorities, low-income households, and young
children than other population segments.
The U.S. Census Bureau considers population density levels
and population co-characteristics to determine if a Census
tract is considered HTC. The higher percentage a tract has of
these characteristics, the harder the area is to count, and the
less likely that those living in the area will return their Census
questionnaires without specialized outreach or assistance.
HTC Californians disproportionately include the poor; thus,
communities that depend most on federal grant programs
(such as Title I schools) are often the same communities that
are undercounted in the Census. For example, undercounting the
community and its children can result in Title I schools receiving
less funding. Undercounting the poor also distorts statistics on
California’s income levels for individuals and families.
Who Is The Hard-to-Count Population?
HOW THE U.S. CENSUS BUREAU DEFINES HARD TO COUNT
According to the U.S. Census Bureau, HTC tracts are
based on the following:
• Immigrants and the foreign born
• Linguistically isolated individuals (non-English
speaking individuals over 14 years of age within
households)
• Non two-parent households
• Non high school graduates
• Unemployed
• Number of vacant housing units in an area
• Specifi c ethnic and minority populations
• Renters and children
• Densely populated communities with multi-unit
housing, public assistance characteristics
• American Indians living on tribal lands
4 Funders Committee for Civic Participation, Funder Census Initiative. 2009.
6 California Complete Count: Counting 2010 and Planning for 2020 Report Highlights
SACRAMENTO
ORANGE
SAN DIEGO
SAN BERNARDINO
RIVERSIDE
LOS ANGELES
KERN
SAN JOAQUIN
ALAMEDASANTA CLARA
FRESNO
CONTRA COSTASAN FRANCISCO
— GrantMakers Concerned with Immigrant and Refugees.
California has 10 of the top
50 HTC counties in the
nation. The HTC population
in these ten counties totals an
estimated 8.4 million people.
Graphic 3: Map of 13 Hardest to Count Counties in California
7www.californiacompletecount.org
CENSUS 2010 | California Complete Count

The State’s Focus and Role for the Census 2010 Effort
1 Convene With limited resources, it was important for the state to convene partners. Holding events, meetings, and other venues for partners to gather and share ideas was criticalto leveraging resources and building partnerships.
In 2000, California invested $24.7 million for the
state’s Census outreach, allowing for a sizable outreach
staff to supplement the U.S. Census Bureau’s efforts.
The state established a grassroots effort and directly
funded community-based organizations (CBOs) in the
HTC areas to promote returning the Census form. This
effort had great success in raising California’s Mail-
back Response Rate (MRR) from 1990. The effort also
established outreach best practices, which the state
Census 2010 effort leveraged.
To build on the 2000 Census effort’s success, Governor
Schwarzenegger and the California Legislature earmarked
$2 million in funding for a similar 2010 Census Outreach effort,
known as the California Complete Count. The Governor also
appointed a diverse 52-member California Complete Count
Committee (California CCC), comprised of community and
state government leaders to provide leadership and input on
the statewide outreach effort.
Since the funding for the 2010 Census outreach effort was
signifi cantly less, the 2010 effort was not able to fully duplicate
the successful grassroots effort proven from 2000. The
most noticeable cutback was staffi ng with only four full-time
employees, which created signifi cant limitations in the size
and breadth of the 2010 outreach effort.
In 2010, the state intentionally focused its resources to achieve three goals:
8 California Complete Count: Counting 2010 and Planning for 2020 Report Highlights

The most noticeable cutback
was staffi ng with only four
full-time employees.
2 3Coordinate As an intergovernmental effort between the federal, state, and local governments, the state needed to coordinate the different levels of government as well as coordinate efforts with nonprofi ts, foundations, and private sector partners.
Capacity BuildingThe Census needed to count every Californian; however, the state did not have the capacity to reach every Californian directly through outreach. The state focused resources on building partners’ capacity to do their own direct outreach. Capacity-building strategies included developing materials and toolkits.
— Ditas Katague 2010 California CCC Staff Director
9www.californiacompletecount.org
CENSUS 2010 | California Complete Count

The Strategic Outreach Approach for California’s Diverse PopulationWhile the 2010 Census effort was not able to fully duplicate the 2000 grassroots strategy, the
2010 California CCC and staff developed a multi-dimensional approach to leverage partnerships
and resources to engage California’s diverse population from many different angles. The following
describes the fi ve primary strategies used in the state’s Census 2010 effort.
Engage Trusted Messengers and Grass-tops Leaders Trusted messengers are people the
HTC consider credible and reliable.
Usually, a trusted messenger is
someone with whom the HTC identify.
Trusted messengers have existing
relationships with the HTC, and they
understand the community and know
what messages will resonate.
Grass-tops leaders have networks that
can be leveraged; they are connected
with the people in their communities.
Grass-tops leaders can identify the
community’s trusted messengers to
reach the HTC.
Use Micro-Targeted MediaThe 2000 Census campaign learned
that local advertising is much more
effective when the content is locally
created. Local advertising’s content
should be familiar and remind people
of their own story.
The 2000 campaign directly supple-
mented the U.S. Census Bureau’s
media strategy with local buys. Lacking
funding, the 2010 effort advocated
that the U.S. Census Bureau make
local media buys. The Census Bureau
allocated 51 percent of its national paid
media campaign for local, in-language
media buys. However, the content
was for a generic national audience
rather than a California-specifi c one.
In California, even if content was
developed in San Francisco, it may not
resonate with audiences in Los Angeles
or rural areas. California’s 2010 effort
had to address this gap by providing
funding to local media outlets.
Properly Place and Staff Local Assistance CentersIn 2000, the campaign directly funded
community-based organizations (CBOs)
to do outreach in HTC communities.
One of the main ways this was achieved
was through local Questionnaire
Assistance Centers (QACs), which are
physical spaces that provide a local
venue to educate, motivate, and involve
community members in the Census.
QACs provide direct in-language
assistance to community members. As
funding was not available for the state to
duplicate this effort in 2010, California
successfully advocated that the U.S.
Census Bureau take on this outreach
component of running the QACs.
10 California Complete Count: Counting 2010 and Planning for 2020 Report Highlights

Allocate Funding to Local Governments for Direct Outreach
Graphic 4: Strategic Outreach Approach for the 2010 Census
Focus on Sector Outreach California organized much of its HTC
outreach through a sector approach.
This approach focused on sectors that
intersect with target HTC populations.
Where possible, California’s 2010
Census effort coordinated with and
leveraged the U.S. Census Bureau’s
outreach to sectors. California fi lled
gaps rather than duplicated the
Census Bureau’s efforts.
The 2010 Census effort focused on: state
agencies, local and regional government,
elected offi cials, K-12 schools and higher
education, private sector businesses, and
foundations and nonprofi ts.
The 2010 effort was not able to focus
on other important sectors due to
resource limitations. However, these
are important sectors to engage
when targeting HTC populations:
unions, corporations, early education
programs (ages 0-5), faith-based
organizations, disabled communities,
and homeless communities.
Based on the effectiveness of the 2000
grassroots outreach, the 2010 effort
committed half of its $2 million budget
to directly fund county local outreach
programs. The state funded the top
13 HTC counties, with each receiving
a proportion of the funding based on
the percentage of HTC populations in
their counties. The 13 counties captured
nearly 80 percent of California’s HTC
Census tracts.
In order to receive the funding, these
counties entered into a contract with
the state and agreed to work with
CBOs to do on-the-ground outreach,
and to supplement the U.S. Census
Bureau’s outreach strategies. For
example, the counties were required
to make local investments in HTC
outreach through ethnic media buys.
Some counties found the contract
process burdensome, as many counties
have administrative limitations
regarding entering into contracts with
CBOs. In 2010, many counties were
unable to contract with the smaller,
on-the-ground CBOs, which often have
the greatest impacts. The state did not
have these limitations in 2000 when
they contracted with CBOs directly.
11www.californiacompletecount.org
CENSUS 2010 | California Complete Count

Census 2010 Results On December 21, 2010, the U.S. Census Bureau announced the fi nal population and apportionment
counts for all the states. The U.S. population on April 1, 2010, was 308,745,538. California was the
most populous state with 37,253,956 people.
What the Participation Rate Means The Mail Participation Rate (MPR) is the percentage of forms
mailed back by households that receive them. The MPR was a
new measurement developed for 2010, although the U.S.
Census Bureau was able to go back and determine the MPR for
the 2000 Census to allow for a comparison. With higher rates
of vacant housing due to foreclosures in 2010, the U.S. Census
Bureau excluded households whose forms were returned by the
U.S. Postal Service as “undeliverable.” The previous measure
used to convey the 2000 Census results was the Mail-back
Response Rate (MRR), which included all questionnaires sent
to physical addresses whether they were received or not.
The MPR includes all Census forms returned by mail until
October 2010. The MPR does not include any information
collected by door-to-door enumeration. For those who do not
return their questionnaires by mail by the April 1 deadline, the
Census Bureau enumerators are deployed as part of the Non-
Response Follow Up (NRFU) to interview people and record
their information. The information collected as part of the NRFU
operations is never counted toward the MPR percent. However,
the count collected by the door-to-door enumeration is added
to the count collected by mail to the make-up California’s total
Census count or offi cial population.
Of course not everyone is counted in the Census. Many people
are missed completely in the count; they are known as the under-
count. The U.S. Census Bureau considers the MPR to be the most
accurate count because it is self-reported. When residents cannot
be interviewed during door-to-door enumeration, U.S. Census
Bureau staff have to make estimates on how many people live
at the residence based on assumptions and averages. These
estimates can contribute to the undercount.
2010 MPR The 2010 national MPR was 74 percent, which is two percent
higher than in 2000 (72 percent). For California in 2010, the
MPR was 73 percent, ranking 28th among all states and the
District of Columbia. This rate is three percentage points lower
than California’s 2000 Census rate (76 percent). The results for
Census 2010 show while the nation improved, California’s rate
declined. Table 1 compares the 1990, 2000, and 2010 Census
response rates.
Table 1: Census 1990, 2000, and 2010 at a Glance
Census Year 1990 2000 2010
CA MRR 65% 70% N/A*
CA MPR N/A * 76% 73%
Versus Previous Census N/A +5% (MRR) -3% (MPR)
State Budget N/A ** $24 M $2M
National MPR N/A 72% 74%
(Source: U.S. Census Bureau)
* There is no MPR fi gure for the 1990 Census and no MRR fi gure for the 2010 Census.
** There was no offi cial state Census outreach effort in 1990; therefore, a budget fi gure is not available.
12 California Complete Count: Counting 2010 and Planning for 2020 Report Highlights
MPR
+3% 0% +1% -3%0%MPR MPR MPR
ILLINOIS
MPR
FLORIDA TEXAS CALIFORNIA
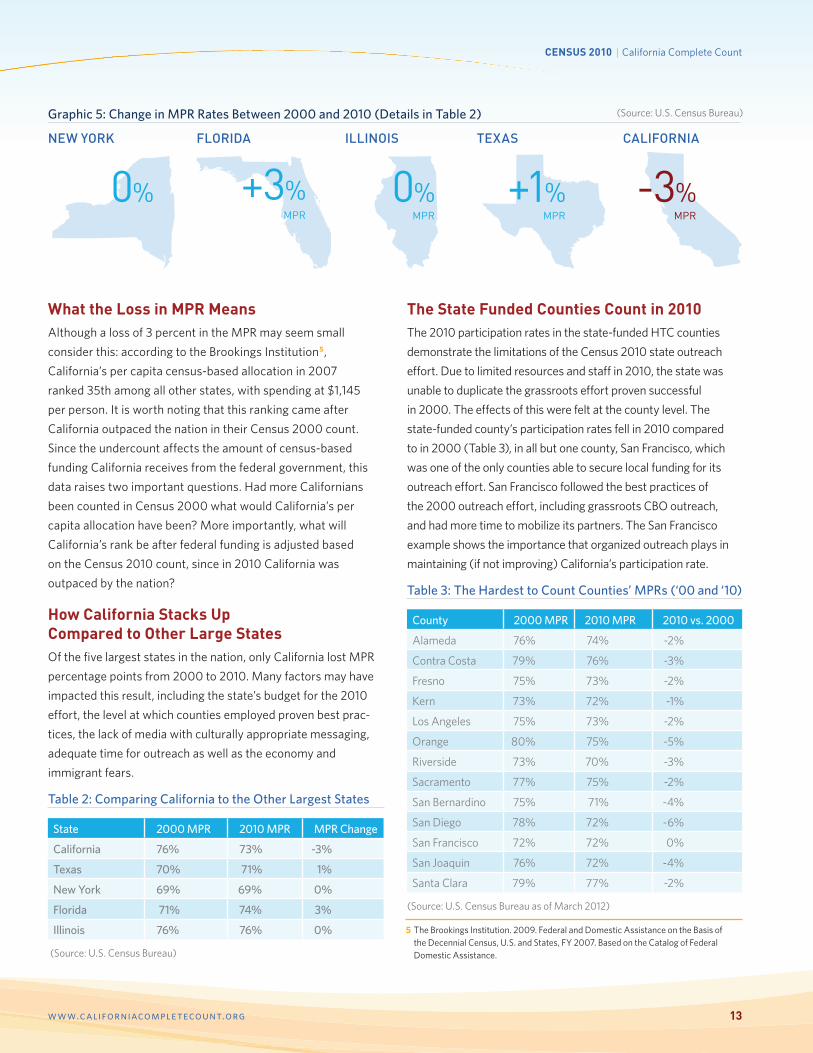
Graphic 5: Change in MPR Rates Between 2000 and 2010 (Details in Table 2) (Source: U.S. Census Bureau)
What the Loss in MPR MeansAlthough a loss of 3 percent in the MPR may seem small
consider this: according to the Brookings Institution5,
California’s per capita census-based allocation in 2007
ranked 35th among all other states, with spending at $1,145
per person. It is worth noting that this ranking came after
California outpaced the nation in their Census 2000 count.
Since the undercount affects the amount of census-based
funding California receives from the federal government, this
data raises two important questions. Had more Californians
been counted in Census 2000 what would California’s per
capita allocation have been? More importantly, what will
California’s rank be after federal funding is adjusted based
on the Census 2010 count, since in 2010 California was
outpaced by the nation?
How California Stacks Up Compared to Other Large States Of the fi ve largest states in the nation, only California lost MPR
percentage points from 2000 to 2010. Many factors may have
impacted this result, including the state’s budget for the 2010
effort, the level at which counties employed proven best prac-
tices, the lack of media with culturally appropriate messaging,
adequate time for outreach as well as the economy and
immigrant fears.
Table 2: Comparing California to the Other Largest States
State 2000 MPR 2010 MPR MPR Change
California 76% 73% -3%
Texas 70% 71% 1%
New York 69% 69% 0%
Florida 71% 74% 3%
Illinois 76% 76% 0%
(Source: U.S. Census Bureau)
5 The Brookings Institution. 2009. Federal and Domestic Assistance on the Basis of the Decennial Census, U.S. and States, FY 2007. Based on the Catalog of Federal Domestic Assistance.
The State Funded Counties Count in 2010The 2010 participation rates in the state-funded HTC counties
demonstrate the limitations of the Census 2010 state outreach
effort. Due to limited resources and staff in 2010, the state was
unable to duplicate the grassroots effort proven successful
in 2000. The effects of this were felt at the county level. The
state-funded county’s participation rates fell in 2010 compared
to in 2000 (Table 3), in all but one county, San Francisco, which
was one of the only counties able to secure local funding for its
outreach effort. San Francisco followed the best practices of
the 2000 outreach effort, including grassroots CBO outreach,
and had more time to mobilize its partners. The San Francisco
example shows the importance that organized outreach plays in
maintaining (if not improving) California’s participation rate.
Table 3: The Hardest to Count Counties’ MPRs (‘00 and ‘10)
County 2000 MPR 2010 MPR 2010 vs. 2000
Alameda 76% 74% -2%
Contra Costa 79% 76% -3%
Fresno 75% 73% -2%
Kern 73% 72% -1%
Los Angeles 75% 73% -2%
Orange 80% 75% -5%
Riverside 73% 70% -3%
Sacramento 77% 75% -2%
San Bernardino 75% 71% -4%
San Diego 78% 72% -6%
San Francisco 72% 72% 0%
San Joaquin 76% 72% -4%
Santa Clara 79% 77% -2%
(Source: U.S. Census Bureau as of March 2012)
NEW YORK
13www.californiacompletecount.org
CENSUS 2010 | California Complete Count

Outstanding QuestionsAlthough the Census 2010 count is now completed, many unanswered questions remain. Finding
answers will be critical for developing an effective outreach strategy for the 2020 Census.
The question of undercount will be offi cially answered by a
government body. The U.S. Census Bureau determines the
offi cial accuracy of the Census through a post-enumeration
survey called the Census Coverage Measurement (CCM).
This survey estimates the accuracy based on undercount
(persons missed or not counted) and over count (persons
doubled or over counted).
A government body does not offi cially address the potential
fi nancial and representation impacts from the Census
undercount. Typically, after the undercount estimates are
How close did California come to gaining an additional seat in the U.S. House of Representatives? If a larger percentage of the undercounted population had been counted, would California have gained a seat?
The most important question is what does the drop in California’s MPR mean?
How many people were missed in California’s count?
What does the undercount mean in terms of lost federal funding?
released, think tanks estimate the amount of federal funding
that states with high undercounts, such as California, missed.
As mentioned earlier, PriceWaterHouseCoopers provided
one such report to Congress about the impacts of the 2000
Census undercount. There is no guarantee that anyone will
answer the questions about the 2010 undercount’s funding and
representation impacts. Both California’s undercount estimates
and the estimates of fi nancial and representation impacts due
to the undercount will be vital information for the 2020 Census
effort to analyze.
14 California Complete Count: Counting 2010 and Planning for 2020 Report Highlights

Conclusion The 2000 Census results demonstrate the value of a state-coordinated Census effort; the 2010
results demonstrate the need to invest state funding in outreach coordination.
The state made a sizable investment in 2000, which allowed
California to build an effective outreach strategy. In 2000 the
state faced a projected federal funding loss of $5 billion, which
motivated the Legislature and the Governor’s Offi ce to invest
$24.7 million in Census outreach. This investment resulted in
an improved Census participation rate, which outpaced the
national participation rate, allowing the state to collect more
in federal funding. The return on a Census outreach investment
is signifi cant, as counting more people directly correlates to
more federal funding for California.
The Census can substantially bolster the state’s resources.
It is not an obligation, but an opportunity. California has this
opportunity every ten years to obtain more funding for the
vital programs Californians depend on, and potentially to
gain representation in Washington D.C.
To achieve these goals and to treat the Census as the
opportunity that it is, the effort must be adequately funded,
adequately staffed, and given an adequate amount of time
to do the necessary work. These measures, combined with
an effort that builds upon best practices from 2000 and the
recommendations put forth from 2010, will result in a Census
2020 effort that is organized, competent, and effective.
15www.californiacompletecount.org
CENSUS 2010 | California Complete Count
$
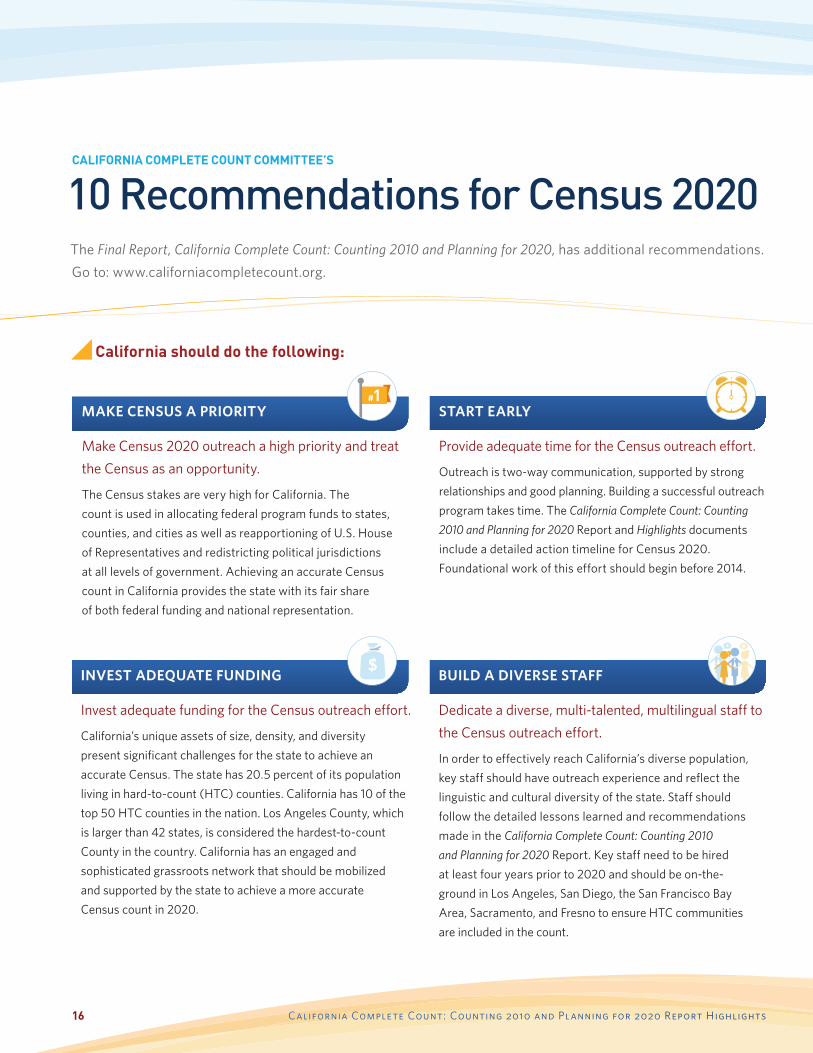
#1MAKE CENSUS A PRIORITY
Make Census 2020 outreach a high priority and treat
the Census as an opportunity.
The Census stakes are very high for California. The
count is used in allocating federal program funds to states,
counties, and cities as well as reapportioning of U.S. House
of Representatives and redistricting political jurisdictions
at all levels of government. Achieving an accurate Census
count in California provides the state with its fair share
of both federal funding and national representation.
INVEST ADEQUATE FUNDING
Invest adequate funding for the Census outreach effort.
California’s unique assets of size, density, and diversity
present signifi cant challenges for the state to achieve an
accurate Census. The state has 20.5 percent of its population
living in hard-to-count (HTC) counties. California has 10 of the
top 50 HTC counties in the nation. Los Angeles County, which
is larger than 42 states, is considered the hardest-to-count
County in the country. California has an engaged and
sophisticated grassroots network that should be mobilized
and supported by the state to achieve a more accurate
Census count in 2020.
START EARLY
Provide adequate time for the Census outreach effort.
Outreach is two-way communication, supported by strong
relationships and good planning. Building a successful outreach
program takes time. The California Complete Count: Counting
2010 and Planning for 2020 Report and Highlights documents
include a detailed action timeline for Census 2020.
Foundational work of this effort should begin before 2014.
BUILD A DIVERSE STAFF
Dedicate a diverse, multi-talented, multilingual staff to
the Census outreach effort.
In order to effectively reach California’s diverse population,
key staff should have outreach experience and refl ect the
linguistic and cultural diversity of the state. Staff should
follow the detailed lessons learned and recommendations
made in the California Complete Count: Counting 2010
and Planning for 2020 Report. Key staff need to be hired
at least four years prior to 2020 and should be on-the-
ground in Los Angeles, San Diego, the San Francisco Bay
Area, Sacramento, and Fresno to ensure HTC communities
are included in the count.
CALIFORNIA COMPLETE COUNT COMMITTEE’S
10 Recommendations for Census 2020
California should do the following:
The Final Report, California Complete Count: Counting 2010 and Planning for 2020, has additional recommendations.
Go to: www.californiacompletecount.org.
16 California Complete Count: Counting 2010 and Planning for 2020 Report Highlights

?
SUPPORT HTC COMMUNITIES
Provide support to the State’s HTC communities early
in the process and directly at the local grassroots level.
This support includes engaging community leaders; properly
placing and staffi ng local Questionnaire Assistance Centers;
providing grants to counties and community organizations
to create and implement their strategic outreach plans; and
making ethnic media buys to promote the Census message.
Ethnic media outreach is most effective when culturally
relevant and refl ective of the local market.
ENGAGE STATE AGENCIES
Provide clear direction to state agencies
and departments.
To create buy-in, direction should come from the Governor to
establish expectations of state agencies and departments. The
Census 2020 effort should be located in a large State agency
capable of assisting with administrative and contracting tasks.
COLLABORATE WITH THEU.S. CENSUS BUREAU
Collaborate with the U.S. Census Bureau early
in the process to continue building a strong
relationship and advocate on California’s behalf.
An important role of the state is to identify and fi ll gaps
that may exist in the Census Bureau’s outreach strategy.
California’s Census 2020 effort should also encourage
a high level of coordination between the Census Bureau
and California local communities.
COORDINATE WITH PARTNERS
Coordinate with partners around the state and
provide customized materials and messages to
conduct their outreach.
California’s Census 2020 staff should build a Strategic
Outreach Plan focusing on the sectors that intersect most
with the target HTC populations, including but not limited to:
CREATE DYNAMIC OUTREACH TOOLS
Ensure outreach materials and tools are fl exible and
refl ect both emerging technologies and face-to-face
options for reaching target audiences.
California’s Census website should be in place early in the
Census 2020 outreach effort, allowing partners to connect
to the effort and share best practices and tools.
CONSIDER OUTSTANDING QUESTIONS
Estimates of fi nancial and representation impacts due
to the 2010 undercount are not offi cially answered by
the federal government.
The state should consider analyses done by third-party think
tanks or academics on the impacts of 2010 as it will be vital
information for the Census 2020 effort.
• Regional and local government
• Elected offi cials
• Education including, K-12
schools, higher education,
and early education
programs (ages 0-5)
• Private sector businesses and corporations
• Foundations and nonprofi ts
• Unions
• Faith-based organizations
• Disabled communities
• Homeless communities
17www.californiacompletecount.org
CENSUS 2010 | California Complete Count
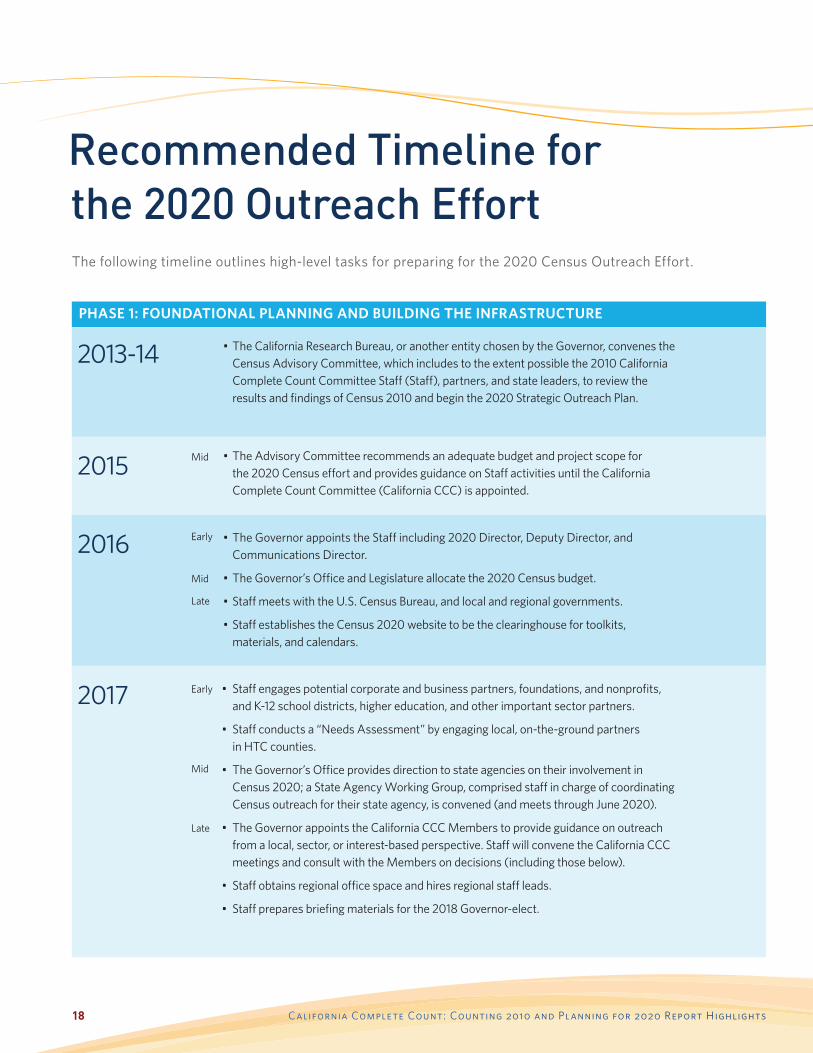
Recommended Timeline for the 2020 Outreach Effort
• The California Research Bureau, or another entity chosen by the Governor, convenes the Census Advisory Committee, which includes to the extent possible the 2010 California Complete Count Committee Staff (Staff), partners, and state leaders, to review the results and fi ndings of Census 2010 and begin the 2020 Strategic Outreach Plan.
The following timeline outlines high-level tasks for preparing for the 2020 Census Outreach Effort.
PHASE 1: FOUNDATIONAL PLANNING AND BUILDING THE INFRASTRUCTURE
• The Advisory Committee recommends an adequate budget and project scope for the 2020 Census effort and provides guidance on Staff activities until the California Complete Count Committee (California CCC) is appointed.
• The Governor appoints the Staff including 2020 Director, Deputy Director, and Communications Director.
• The Governor’s Offi ce and Legislature allocate the 2020 Census budget.
• Staff meets with the U.S. Census Bureau, and local and regional governments.
• Staff establishes the Census 2020 website to be the clearinghouse for toolkits, materials, and calendars.
2015
2016
2013-14
Early
Mid
Mid
Late
• Staff engages potential corporate and business partners, foundations, and nonprofi ts, and K-12 school districts, higher education, and other important sector partners.
• Staff conducts a “Needs Assessment” by engaging local, on-the-ground partners in HTC counties.
• The Governor’s Offi ce provides direction to state agencies on their involvement in Census 2020; a State Agency Working Group, comprised staff in charge of coordinating Census outreach for their state agency, is convened (and meets through June 2020).
• The Governor appoints the California CCC Members to provide guidance on outreach from a local, sector, or interest-based perspective. Staff will convene the California CCC meetings and consult with the Members on decisions (including those below).
• Staff obtains regional offi ce space and hires regional staff leads.
• Staff prepares briefi ng materials for the 2018 Governor-elect.
2017 Early
Mid
Late
18 California Complete Count: Counting 2010 and Planning for 2020 Report Highlights

2018
2019
2020
PHASE 2: ENGAGE STATEWIDE PARTNERS
• Staff holds the “Regional Readiness Assessment” with local community leaders to help them develop their outreach plans.
• Staff holds the fi rst California CCC meeting, inviting the U.S. Census Bureau to participate. (California CCC meets quarterly through summer 2020.)
• Staff distributes funding to the HTC counties.
• Staff holds training for Assembly Budget Committee, Legislative Analyst’s Offi ce, and Department of Finance.
• Staff holds workshops for local and state elected offi cials’ staff on providing Census outreach materials.
• Staff holds “Big Tent” regional events for local leaders to present their local outreach plans to their communities and the U.S. Census Bureau.
PHASE 3: CRITICAL OUTREACH PERIOD
• Staff convenes statewide experts to analyze the 2010 MPR and discuss how to allocate remaining resources.
• Staff is retained through the Non-Response Follow-Up period.
• Staff is retained to write fi nal report to the Governor.
Early
Early
Early
Mid
Mid
Mid
Late
19www.californiacompletecount.org
CENSUS 2010 | California Complete Count
#1 $
?
5 2
??
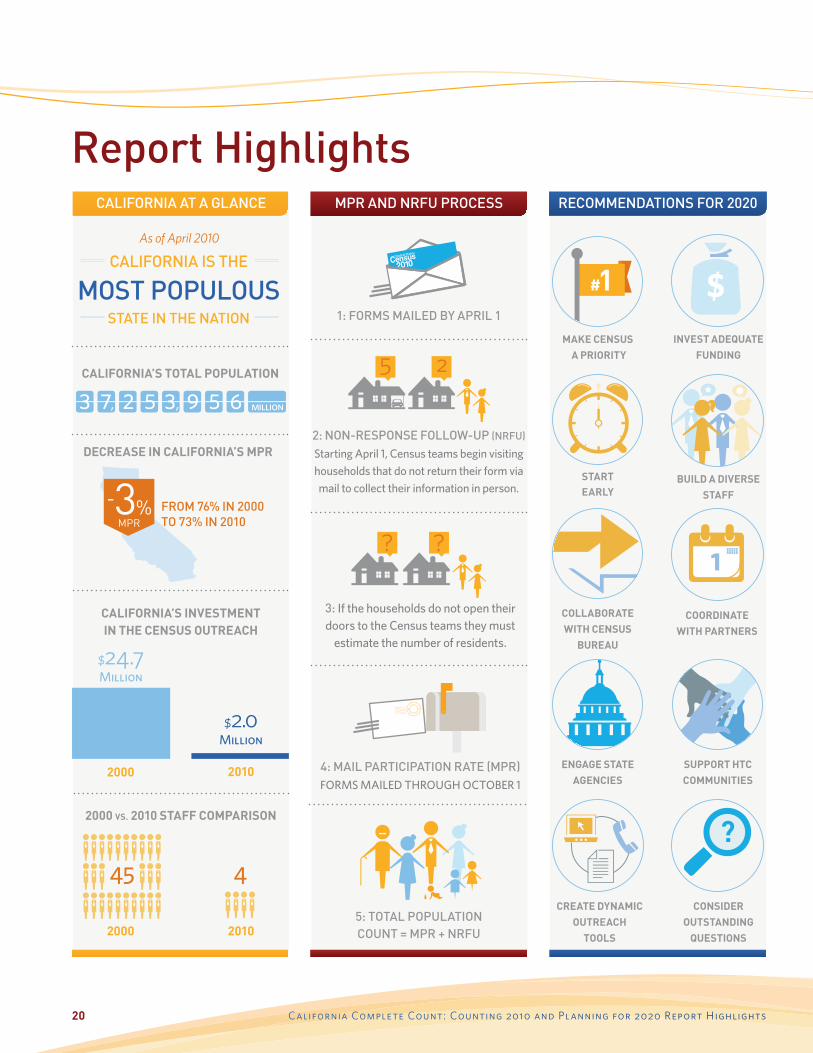
Report Highlights
DECREASE IN CALIFORNIA’S MPR
CALIFORNIA’S TOTAL POPULATION
CALIFORNIA’S INVESTMENT IN THE CENSUS OUTREACH
2: NON-RESPONSE FOLLOW-UP (NRFU)
Starting April 1, Census teams begin visiting
households that do not return their form via
mail to collect their information in person.
4: MAIL PARTICIPATION RATE (MPR) FORMS MAILED THROUGH OCTOBER 1
3: If the households do not open their doors to the Census teams they must
estimate the number of residents.
FROM 76% IN 2000 TO 73% IN 2010MPR
-3%
MPR AND NRFU PROCESSCALIFORNIA AT A GLANCE RECOMMENDATIONS FOR 2020
As of April 2010
CALIFORNIA IS THE
MOST POPULOUS STATE IN THE NATION
3 7 , 2 5 3, 9 5 6 million
2000 2010
$24.7Million
$2.0 Million
2000 VS. 2010 STAFF COMPARISON
2000 2010
45 4
SUPPORT HTC COMMUNITIES
1: FORMS MAILED BY APRIL 1
5: TOTAL POPULATION COUNT = MPR + NRFU
COORDINATEWITH PARTNERS
ENGAGE STATE AGENCIES
BUILD A DIVERSE STAFF
COLLABORATE WITH CENSUS
BUREAU
MAKE CENSUS A PRIORITY
CONSIDER OUTSTANDING
QUESTIONS
INVEST ADEQUATE FUNDING
STARTEARLY
CREATE DYNAMIC OUTREACH
TOOLS
20 California Complete Count: Counting 2010 and Planning for 2020 Report Highlights
Acknowledgements FINAL REPORT TEAM Author: Charlotte Chorneau (Center for Collaborative Policy,
California State University, Sacramento)
Research and Review: Mindy Meyer (Center for Collaborative Policy, California State University, Sacramento)
Highlights Editor: Jan Agee
Report Design: Tina Chen, Eric Grotenhuis, Sara Kunz, (Page Design Group)
Review Team: Ditas Katague (California CCC Staff)
Brian R. Sala (California Research Bureau)
Susan Sherry (Center for Collaborative Policy, California State University, Sacramento)
Louis Stewart (California CCC Staff)
CALIFORNIA CCC STAFFDitas Katague (Director), Eric Alborg (Deputy Director, Phase I), Louis Stewart
(Deputy Director, Phase II), Jessica Cohagan (Manager), Lan Dahn (Manger,
Phase I), Regina Wilson (Manager)
GOVERNOR’S OFFICE OF PLANNING AND RESEARCH STAFFCynthia Bryant (OPR Director, Phase I), Cathleen Cox Stugard (OPR Director,
Phase II), Margie Walker (Administrative Assistant, Phase II)
CALIFORNIA CCC MEMBERSElected Offi cials: Karen Bass (Speaker of the California State Assembly),
Sam Blakeslee (California State Assembly Minority Leader), Debra Bowen
(California Secretary of State), Edmund G. Brown Jr. (California Attorney
General), John Chiang (California State Controller), Felipe Fuentes (California
State Assembly member), John Garamendi (California Lieutenant Governor),
Dennis Hollingsworth (California State Senate Minority Leader), Bill Lockyer
(California State Treasurer), Margaret Mims Fresno County Sheriff),
Gloria Negrete McLeod (California State Senator), Jack O’Connell (State
Superintendent of Public Instruction), Steve Poizner (California Insurance
Commissioner), Darrell Steinberg (President pro Tem California State
Senate), Betty T. Yee (Chair California State Board of Equalization)
Organizations: Access California Services (Nahla Kayali), AARP California
(David Pacheco), American Federation of Television and Radio Artists
(William Thomas), Asian Pacifi c American Legal Center of Southern
California (Stewart Kwoh), Asian Pacifi c Islander American Public Affairs
(C.C. Yin), California Black Media (Larry Lee), California Cable and
Telecommunications Association (Carolyn McIntyre), California Catholic
Conference (Stephen Pehanich), California Community Colleges
(Lance Izumi), California Community Foundation (Antonia Hernandez),
California Conference of Carpenters (Daniel Curtin),
California Indian Manpower Consortium (Lorenda Sanchez), California
Retailers Association (Bill Dombrowski), California State Association of
Counties (Paul McIntosh), California State Parent Teacher Association
(Pam Brady), California State University Chancellor’s Offi ce (Jorge Haynes),
California Teachers Association (David Sanchez), California Volunteers
(Karen Baker), Center for Disability Issues and Health Professions (Brenda
Premo), Congregation Kol Ami (Denise Eger), Consejo de Federaciones
Mexicanes en Norteamerica (Arturo Carmona), Ed Voice (Rae Belisle),
Equality California (Cary Davidson), Greenlining Institute (Orson Aguilar), La
Coopertiva Campesina de California (Candy Pulliam), La Opinion (Monica
Lozano), Mexican American Legal Defense and Educational Fund (Nancy
Ramirez), National Association for the Advancement of Colored People (Alice
Huffman), National Association of Latino Elected and Appointed Offi cials
(Laura Barrera), New America Media (Sandy Close), Offi ce of Governor
Arnold Schwarzenegger, Governor’s Offi ce of Planning and Research (Cynthia
Bryant and Cathleen Cox Stugard), Pacifi c Gas and Electric Corporation
(Nancy McFadden), Silicon Valley Leadership Group (Carl Guardino), The Los
Angeles Urban League (Blair Taylor), United Way of California (Judith Darnell),
University of Southern California School of Policy, Planning, and Development
(Dowell Myers), University of California, Offi ce of the President (Judy Sakaki)
U.S. CENSUS BUREAU PARTNERS Mike Burns, Jamey Christy, Ralph Lee, Barbara Ferry, E. Lia Bolden, Luz
Castillo, Elaine Dempsey, Elizabeth Cantu, and Zehara Levin
CENTER FOR COLLABORATIVE POLICY, CALIFORNIA STATE UNIVERSITY, SACRAMENTO FACILITATION TEAMCharlotte Chorneau (Project Manager, Report Author), Mindy Meyer
(Southern California Project Lead), Lisa Beutler (Strategic Advisor, Phase I),
Susan Sherry (Strategic Advisor, Phase II), Tina Chen (Graphic Designer) and
Statewide Readiness Assessment Facilitators: Carolyn Lott, Dale Schaffer, and
Mary Selkirk
DEPARTMENT OF FINANCE Nancy Gemignani, Mary Heim, Julie Hoang
CALIFORNIA RESEARCH BUREAUBrian R. Sala
SPECIAL THANK YOUMargie Estrada (Senate Majority Caucus), Gigi Barsoum (The California
Endowment), Mona Pasquil (Acting Lieutenant Governor), Jim Wisley
(California State Assembly Speaker’s Offi ce)
*This report recognizes individuals and their affi liations during the 2010 Census Outreach Effort; many individuals are no longer affi liated with their stated organizations or positions.
Thank You! Organizations, Continued:
21www.californiacompletecount.org
CENSUS 2010 | California Complete Count

R