California City of Escondido
188
City of Escondido California Comprehensive Annual Financial Report Fiscal Year Ended June 30, 2019
Transcript of California City of Escondido

City of EscondidoCalifornia
Comprehensive Annual Financial Report
Fiscal Year Ended June 30, 2019


Paul McNamaraMayor
Consuelo MartinezDeputy Mayor
District 1
John MassonCouncil Member
District 2
Olga DiazCouncil Member
District 3
Michael MorascoCouncil Member
District 4
Comprehensive Annual Financial Report CITY OF ESCONDIDO - CALIFORNIA
Fiscal Year Ended June 30, 2019
CITY MANAGERJeffrey R. Epp
Prepared by the Finance Department
ASSISTANT CITY MANAGERJay Petrek
DEPUTY CITY MANAGERWilliam Wolfe
DEPUTY CITY MANAGERSheryl Bennett

Page
INTRODUCTORY SECTION:
Principal Officers 1
Table of Contents 3
Organization Chart 7
Letter of Transmittal 8
Certificate of Achievement for Excellence in Financial Reporting 13
FINANCIAL SECTION:
Independent Auditors’ Report on the Financial Statements 15
Management’s Discussion and Analysis (Unaudited) 19
Basic Financial Statements:
Government-wide Financial Statements:
Statement of Net Position 32
Statement of Activities 34
Fund Financial Statements:
Governmental Funds:
Balance Sheet 36
Reconciliation of the Balance Sheet to the Statement of Net Position 37
Statement of Revenues, Expenditures, and Changes in Fund Balances 38
39
Proprietary Funds:
Statement of Net Position 40
Statement of Revenues, Expenses, and Changes in Fund Net Position 42
Statement of Cash Flows 44
Reconciliation of the Statement of Revenues, Expenditures, and Changes in
Fund Balances of Governmental Funds to the Statement of Activities
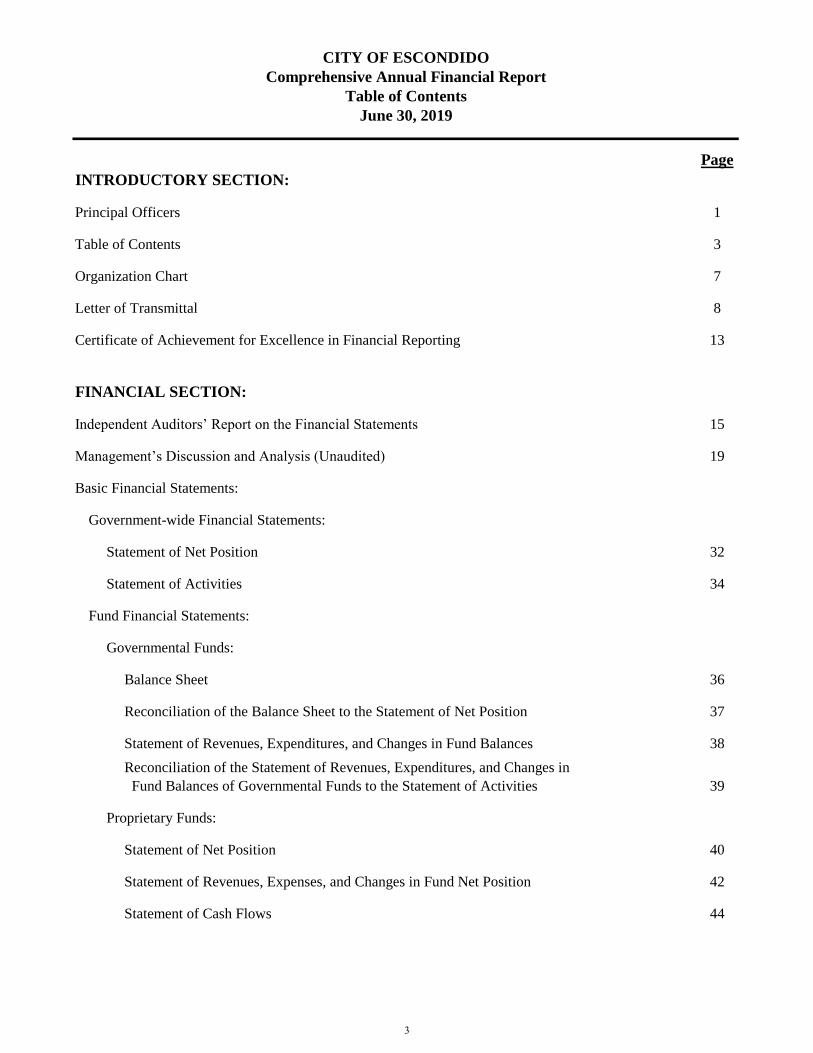
CITY OF ESCONDIDO
Comprehensive Annual Financial Report
Table of Contents
June 30, 2019
3

Page
FINANCIAL SECTION (Continued):
Basic Financial Statements:
Fund Financial Statements:
Fiduciary Funds:
Statement of Fiduciary Net Position 46
Statement of Changes in Fiduciary Net Position 47
Notes to Basic Financial Statements 48
Required Supplementary Information (Unaudited):
Budgetary Comparison Schedules:
General Fund 102
Successor Agency Housing Fund 104
Schedule of Changes in Net Position Liability and Related Ratios - Miscellaenous Plan 105
Schedule of Changes in Net Position Liability and Related Ratios - Safety Plan 106
Schedule of Plan Contributions - Miscellaenous Plan 107
Schedule of Plan Contributions - Safety Plan 108
Notes to Required Supplementary Information 109
Supplementary Information:
Nonmajor Governmental Funds:
Combining Balance Sheet 114
Combining Statement of Revenues, Expenditures, and Changes in Fund Balances 119
Budgetary Comparison Schedules:
Certain Special Revenue Funds:
Street Fund 124
Community Services Fund 125
Community Development Block Grant Fund 126
Landscape and Assessment District Fund 127
Comprehensive Annual Financial Report
Table of Contents (Continued)
June 30, 2019
CITY OF ESCONDIDO
4

Page
FINANCIAL SECTION (Continued):
Supplementary Information:
Budgetary Comparison Schedules:
Certain Special Revenue Funds:
Law Enforcement Fund 128
HOME Fund 129
Miscellaneous Fund 130
Vehicle Parking District Fund 131
Debt Service Fund:
General Obligation Debt Service Fund 132
Golf Course Fund 133
Internal Service Funds:
Combining Statement of Net Position 135
Combining Statement of Revenues, Expenses and Changes in Fund Net Position 137
Combining Statement of Cash Flows 139
Agency Funds:
Combining Statement of Assets and Liabilities 144
Combining Statements of Changes in Assets and Liabilities 146
STATISTICAL SECTION (Unaudited):
Financial Trends Information:
Net Position by Component – Last Ten Fiscal Years 152
Changes in Net Position – Last Ten Fiscal Years 154
Fund Balances of Governmental Funds – Last Ten Fiscal Years 158
Changes in Fund Balances of Governmental Funds – Last Ten Fiscal Years 160
CITY OF ESCONDIDO
Comprehensive Annual Financial Report
Table of Contents (Continued)
June 30, 2019
5

Page
STATISTICAL SECTION (Unaudited) (Continued):
Revenue Capacity Information:
Assessed Value and Estimated Actual Value of Taxable Property – Last Ten Fiscal Years 162
Direct and Overlapping Property Tax Rates – Last Ten Fiscal Years 163
Principal Property Taxpayers – Current Year and Nine Years Ago 164
Property Tax Levies and Collections – Last Ten Fiscal Years 165
Top 25 Sales Tax Producers 166
Taxable Sales by Category 167
Debt Capacity Information:
Ratios of Outstanding Debt by Type – Last Ten Fiscal Years 169
Ratio of General Bonded Debt Outstanding – Last Ten Fiscal Years 171
Direct and Overlapping Debt 172
Legal Debt Margin Information – Last Ten Fiscal Years 173
Pledged-Revenue Coverage – Last Ten Fiscal Years 175
Demographic and Economic Information:
Demographic and Economic Statistics – Last Ten Calendar Years 178
Principal Employers – Current Year and Nine Years Ago 179
Operating Information:
Full-time and Part-time City Employees by Function – Last Ten Fiscal Years 180
Operating Indicators by Function – Last Ten Fiscal Years 181
Capital Asset Statistics by Function – Last Ten Fiscal Years 183
June 30, 2019
CITY OF ESCONDIDO
Comprehensive Annual Financial Report
Table of Contents (Continued)
6

City Attorney
Communications & Community
ServicesEngineering
Fire Department Utilities
June 30, 2019
Police Department
Electorate
City Treasurer
City Council
CITY OF ESCONDIDO
Community Development
Public Works
Successor Agency-RedevelopmentMobile Home Rent Review Board
City ManagerAssistant City
ManagerDeputy City
Manager
Administrative Services
Information Systems
Economic Development
Organization Chart
City Clerk
7

December 13, 2019
Honorable Mayor, Members of the City Council, and Residents of the City of Escondido, California:
We are pleased to present the Comprehensive Annual Financial Report (CAFR) of the City of Escondido for the fiscal year ended June 30, 2019.
This report consists of management's representations concerning the finances of the City of Escondido. Consequently, management assumes full responsibility for the completeness and reliability of all of the information presented in this report. To provide a reasonable basis for making these representations, management of the City of Escondido has established a comprehensive internal control framework that is designed both to protect the government's assets from loss, theft, or misuse and to compile sufficient reliable information for the preparation of the City of Escondido's financial statements in conformity with Generally Accepted Accounting Principles (GAAP). Because the cost of internal controls should not outweigh their benefits, the City of Escondido's comprehensive framework of internal controls has been designed to provide reasonable rather than absolute assurance that the financial statements will be free from material misstatement. As management, we assert that to the best of our knowledge and belief, this financial report is complete and reliable in all material respects.
The City of Escondido's financial statements have been audited by The Pun Group, a firm of licensed certified public accountants. The goal of the independent audit was to provide reasonable assurance that the financial statements of the City of Escondido for the fiscal year ended June 30, 2019, are free of material misstatement. The independent auditor concluded, based upon the audit, that there was a reasonable basis for rendering an unmodified opinion that the City of Escondido's financial statements for the fiscal year ended June 30, 2019, are fairly presented in conformity with GAAP. The Independent Auditors’ Report is presented as the first component of the financial section of this report.
In addition, The Pun Group audited the City's major program expenditures of federal funds for compliance with the Federal Single Audit Act Amendments of 1996, the Office of Management and Budget Uniform Guidance regulating Single Audits, and the standards applicable to financial audits contained in Government Auditing Standards issued by the Comptroller General of the United States. The report of the Single Audit is published separately from this CAFR and may be obtained upon request from the City's Finance Department.
Management has provided a narrative introduction, overview, and analysis to accompany the basic financial statements in the form of Management's Discussion and Analysis (MD&A). This Letter of Transmittal is designed to complement the MD&A and should be read in conjunction with it. The City of Escondido's MD&A can be found immediately following the Independent Auditors’ Report.
CITY OF ESCONDIDO PROFILE
The City of Escondido is located in north San Diego County, approximately 30 miles north of the City of San Diego, California. Escondido is an established community incorporated on October 8, 1888 under the general laws of the State of California. The City’s current population is estimated to be 152,213. Within the 37 square miles that comprise the City, there are many residential communities; the largest enclosed regional mall in San Diego County; 1 regional hospital; 15 hotels; an auto center; many office, industrial, and commercial centers; and civic, cultural, and recreational facilities.
8

CITY OF ESCONDIDO Letter of Transmittal
The City operates under a Council-Manager form of government. Policymaking and legislative authority are vested in the City Council, which consists of a Mayor and a four-member Council. The City Council is elected by districts on a staggered basis for a term of four years. The Mayor is directly elected at large for a four-year term. The City Treasurer is also elected to a four-year term. The City Council appoints the City Manager and the City Attorney. The City Manager is responsible for carrying out the policies and ordinances of the City Council, for overseeing the day-to-day operations of the City, and for appointing heads of departments. The operating departments include Administrative Services, City Clerk, Community Development, Community Services, Fire, Information Systems, Police, Public Works, and Utilities.
The City of Escondido is a full service City providing the following services to its residents and visitors: police and fire protection, building safety regulation and inspection, circulation and public facility capital improvement construction, street and park maintenance, planning and zoning, a full range of recreational programs for citizen participation, a senior center, a library, and water and wastewater services. Escondido continues to establish itself as the “City of Choice” for businesses, developments, and families who are seeking a quality environment in which to live, work and play.
The City is financially accountable for two legally separate entities that are included as an integral part of the City's financial statements. These component units include the Vehicle Parking District, established for the purpose of acquiring and improving parking lots in Escondido, and the Escondido Joint Powers Financing Authority, an entity created to issue debt to finance City projects.
Discretely presented component units are reported in a separate column in the combined financial statements to emphasize that they are legally separate from the City and to differentiate their financial position, results of operations and cash flows from those of the City. The California Center for the Arts, Escondido Foundation is a discretely presented component unit.
A key element of the City's financial management process is the development and approval of an annual budget. The City Manager is required to prepare and submit to the City Council an annual proposed budget. Budget hearings are held and a final budget is adopted before July 1, which is the start of the new fiscal year. The legal level of budgetary control is at the fund level. The City Manager is authorized to transfer budgeted amounts between departments within a fund. The budget is regularly monitored and the City Council receives quarterly financial updates. Budget-to-actual comparisons are provided in this report for each major governmental fund for which an annual budget has been adopted.
ECONOMIC CONDITION AND OUTLOOK
Escondido's economy is one of the most diversified in North San Diego County. Industries such as healthcare, specialty food and beverage manufacturing, agriculture, professional services and precision manufacturing all call Escondido home. Retail sales are among the highest in San Diego County due to the presence of the Escondido Auto Park and Westfield North County. Palomar Medical Center, which opened its doors in the Escondido Research and Technology Center in 2012, is the centerpiece of the region's health care system and is recognized as one of the most technologically advanced hospitals in the world. Escondido is home to dozens of innovative companies and entrepreneurs, with one of the highest numbers of recorded patents per capita in the nation.
In the immediate future, Escondido’s economy remains healthy. The City adopted a balanced budget for fiscal year 2019-20 with the assumption of moderate growth in the City’s three major General Fund revenue categories of sales tax, property taxes, and franchise fees. Sales tax revenue is projected to grow by 2% due to positive leading economic indicators in San Diego County including low unemployment, high consumer confidence, and a high total number of persons employed. Property tax revenue is also projected to grow by 3% due to an increase in the assessed value of taxable property within the City. Due to the restructuring of the City’s contract with Escondido Disposal, franchise fees are projected to increase. The combined total of sales tax, property tax, and franchise fee revenue make up 71% of total General Fund operating revenue.
9

CITY OF ESCONDIDO Letter of Transmittal
Approximately 84% of the City’s budget is devoted to employee related costs because the City of Escondido serves its citizens primarily by services. Public safety represents the bulk of the City’s core services with Police, Fire, and Public Works. These three essential services make up approximately 76% of the General Fund Budget. Rising labor and retirements costs present future budget challenges for the City. It is projected that CalPERS pension contributions will total $21.4 million in 2019-20. Actuarial estimates show that the required contribution will grow to $35.1 million in ten years. City staff are actively pursuing new revenue opportunities to offset these costs. Without new sources of revenue, the impact will be to reduce the number of dollars available for other services, including the core services.
FINANCIAL INFORMATION
The City has adopted budgetary and financial policies over various program and activities for many benefits, some of which are the safeguarding of resources and providing guidance for the development and administration of the operating budget and long-term financial plan.
Investment Policy. The City utilizes a pooled investments approach in investing excess funds in accordance with the investment strategies and standards set forth in the Escondido Investment Policy. This policy is reviewed and approved by the City Council on an annual basis, and defines the prioritized objectives of investment selection as safety of principal and sufficiency of liquidity. To meet these objectives, the City attempts to obtain the highest yield on its investments consistent with the preservation of principal and liquidity. Quarterly investment reports are submitted to the City Manager and City Council that provide summary information on the status of the portfolio, including the par, book, and market values of each security by investment type, detail of major portfolio transactions occurring during the period and investment yield information.
Debt Management Policy. The City Council has adopted a debt management policy in compliance with Senate Bill 1029 to improve public debt financial transparency. The objective of the debt policy is to achieve sound administration of City debt by minimizing debt service and issuance costs, maintaining the highest reasonable credit rating, and ensuring complete financial disclosure and compliance with tax code, securities regulations, and State and Federal laws.
Fund Balance Policy. The City has implemented a Fund Balance Policy that allows the City Council to commit General Fund Balance for specific purposes by taking formal action, these committed amounts cannot be used for any other purpose unless the City Council removes or changes the specific use through the same formal action to establish the commitment. In addition, the City Council established a target General Fund Reserve balance of 25 percent of General Fund operating revenues in order to maintain adequate levels of fund balance to mitigate current and future risks and adequately provide for cash flow requirements and contingencies for unseen operating or capital needs of the City.
Other Financial Policies. Additional policies adopted by City Council can be found within the City's current year adopted budget located on the City website at: https://www.escondido.org/city-financial-policies.aspx.
SUBSEQUENT EVENTS
In November 2019, Standard and Poor’s Ratings Services assigned its ‘AA-‘ long-term rating to the Escondido Joint Powers Authority series 2019A and 2019B (taxable) water system revenue refunding bonds and affirmed its ‘AA-‘ long-term rating and underlying rating on the water system’s outstanding obligations. The stable outlook reflects Standard & Poor’s opinion that the enterprise and financial risk profile for the Escondido Water System remains strong.
10

CITY OF ESCONDIDO Letter of Transmittal
AWARDS AND ACKNOWLEDGMENTS
The Government Finance Officers Association (GFOA) awarded a Certificate of Achievement for Excellence in Financial Reporting to the City of Escondido for its Comprehensive Annual Financial Report (CAFR) for the fiscal year ended June 30, 2018. In order to be awarded a Certificate of Achievement, the City published an easily readable and efficiently organized CAFR. This report satisfied both GAAP and applicable legal requirements. Certificate of Achievement is valid for a period of one year only. We believe that our current CAFR continues to meet the Certificate of Achievement program's requirements and we are submitting it to the GFOA to determine its eligibility for another certificate.
The preparation of this report would not have been possible without the efficient and dedicated services of the entire staff of the Finance Department. We would like to express our appreciation to all members of the department who assisted and contributed to the preparation of this report. We would like to extend our appreciation to the Mayor, City Council, City Manager, and each City department for their cooperation and support in conducting the fiscal operations of the City.
Respectfully submitted,
Joan Ryan Director of Finance
11

12

13

Financial Section
14

INDEPENDENT AUDITORS’ REPORT To the Honorable Mayor and Members of the City Council
of the City of Escondido Escondido, California Report on Financial Statements We have audited the accompanying financial statements of the governmental activities, the business-type activities, the aggregate discretely presented component units, each major fund, and the aggregate remaining fund information of the City of Escondido, California (the “City”), as of and for the year ended June 30, 2019, and the related notes to the financial statements, which collectively comprise the City’s basic financial statements as listed in the table of contents. Management’s Responsibility for the Financial Statements Management is responsible for the preparation and fair presentation of these financial statements in accordance with accounting principles generally accepted in the United States of America; this includes the design, implementation, and maintenance of internal control relevant to the preparation and fair presentation of financial statements that are free from material misstatement, whether due to fraud or error. Auditors’ Responsibility Our responsibility is to express opinions on these financial statements based on our audit. We did not audit the financial statements of California Center for the Arts, Escondido Foundation (the “Foundation”), which represent 100%, 100%, and 100%, respectively, of the assets, net position, and revenues of the aggregate discretely presented component. Those statements were audited by other auditors whose report has been furnished to us, and our opinion, insofar as it relates to the amounts included for the Foundation, is based solely on the report of the other auditors. We conducted our audit in accordance with auditing standards generally accepted in the United States of America and the standards applicable to financial audits contained in Government Auditing Standards, issued by the Comptroller General of the United States. Those standards require that we plan and perform the audit to obtain reasonable assurance about whether the financial statements are free of material misstatement. An audit involves performing procedures to obtain audit evidence about the amounts and disclosures in the financial statements. The procedures selected depend on the auditor’s judgment, including the assessment of the risks of material misstatement of the financial statements, whether due to fraud or error. In making those risk assessments, the auditor considers internal control relevant to the City’s preparation and fair presentation of the financial statements in order to design audit procedures that are appropriate in the circumstances, but not for the purpose of expressing an opinion on the effectiveness of the City’s internal control. Accordingly, we express no such opinion. An audit also includes evaluating the appropriateness of accounting policies used and the reasonableness of significant accounting estimates made by management, as well as evaluating the overall presentation of the financial statements. We believe that the audit evidence we have obtained is sufficient and appropriate to provide a basis for our audit opinions.
4365 Executive Drive, Suite 710, San Diego, California 92121 Tel: 858-242-5100 • Fax: 858-242-5150
www.pungroup.com
3939352 Pun & McGeady_L_final.pdf 2 1/14/14 3:48 PM
15

To the Honorable Mayor and Members of the City Council of the City of Escondido
Escondido, California Page 2
16
Opinions In our opinion, based on our audit and the report of other auditors, the financial statements referred to above present fairly, in all material respects, the respective financial position of the governmental activities, the business-type activities, the aggregate discretely presented component units, each major fund, and the aggregate remaining fund information of the City as of June 30, 2019, and the respective changes in financial position, and, where applicable, cash flows thereof for the year then ended in accordance with accounting principles generally accepted in the United States of America. Other Matters Required Supplementary Information Accounting principles generally accepted in the United States of America require that the Management’s Discussion and Analysis, Budgetary Comparison Schedules, Schedules of Changes in Net Pension Liability and Related Ratios, and Schedules of Plan Contributions on pages 19 through 30 and 102 through 108 be presented to supplement the basic financial statements. Such information, although not a part of the basic financial statements, is required by the Governmental Accounting Standards Board who considers it to be an essential part of financial reporting for placing the basic financial statements in an appropriate operational, economic, or historical context. We have applied certain limited procedures to the Required Supplementary Information in accordance with auditing standards generally accepted in the United States of America, which consisted of inquiries of management about the methods of preparing the information and comparing the information for consistency with management’s responses to our inquiries, the basic financial statements, and other knowledge we obtained during our audit of the basic financial statements. We do not express an opinion or provide any assurance on the information because the limited procedures do not provide us with sufficient evidence to express an opinion or provide any assurance. Other Information Our audit was conducted for the purpose of forming opinions on the financial statements that collectively comprise the City’s basic financial statements. The Introductory Section, Combining and Individual Nonmajor Fund Financial Statements and Budgetary Comparison Schedules, and Statistical Section, are presented for purposes of additional analysis and are not a required part of the basic financial statements. The Combining and Individual Nonmajor Fund Financial Statements and Budgetary Comparison Schedules are the responsibility of management and were derived from and relate directly to the underlying accounting and other records used to prepare the basic financial statements. Such information has been subjected to the auditing procedures applied in the audit of the basic financial statements and certain additional procedures, including comparing and reconciling such information directly to the underlying accounting and other records used to prepare the basic financial statements or to the basic financial statements themselves, and other additional procedures in accordance with auditing standards generally accepted in the United States of America. In our opinion, the Combining and Individual Nonmajor Fund Financial Statements and Budgetary Comparison Schedules are fairly stated in all material respects in relation to the basic financial statements as a whole. The Introductory and Statistical Sections have not been subjected to the auditing procedures applied in the audit of the basic financial statements, and accordingly, we do not express an opinion or provide any assurance on them.
16
cholmes
Text Box
16 16

To the Honorable Mayor and Members of the City Council of the City of Escondido
Escondido, California Page 3
17
Other Reporting Required by Government Auditing Standards
In accordance with Government Auditing Standards, we have also issued our report dated December 13, 2019, on our consideration of the City’s internal control over financial reporting and on our tests of its compliance with certain provisions of laws, regulations, contracts, and grant agreements and other matters. The purpose of that report is solely to describe the scope of our testing of internal control over financial reporting and compliance and the results of that testing, and not to provide an opinion on the effectiveness of the City’s internal control over financial reporting or on compliance. That report is an integral part of an audit performed in accordance with Government Auditing Standards in considering the City’s internal control over financial reporting and compliance.
San Diego, California December 13, 2019
17
cholmes
Text Box
16 17

18
This page intentionally left blank.
18
cholmes
Text Box
16 18

CITY OF ESCONDIDO Management’s Discussion and Analysis
As management of the City of Escondido (City), we offer readers of the financial statements this narrative overview and analysis of the financial activities of the City for the fiscal year ended June 30, 2019. We encourage readers to consider the information presented here in conjunction with additional information furnished in our Letter of Transmittal at the front of this report and the accompanying Basic Financial Statements.
Overview of the Financial Statements
This discussion and analysis is intended to serve as an introduction to the City’s basic financial statements. These financial statements are comprised of three components: 1) government-wide financial statements, 2) fund financial statements, and 3) notes to the financial statements. In addition to the basic financial statements, this report also contains other supplementary information.
Government-wide financial statements. The government-wide financial statements are designed to provide readers with a broad overview of the City’s finances, in a manner similar to a private-sector business.
The statement of net position presents information on the City’s assets, deferred outflow of resources, and liabilities plus deferred inflows of resources, with the difference between the two reported as net position using the accrual basis of accounting, which is similar to the accounting used by most private-sector companies. All of the current year’s revenues and expenses are taken into account regardless of when cash is received or paid. Over time, increases or decreases in net position may serve as a useful indicator of whether the financial position of the City is improving or deteriorating.
The statement of activities presents information showing how the government’s net position changed during the most recent fiscal year. All changes in net position are reported as soon as the underlying event giving rise to the change occurs, regardless of the timing of related cash flows. Thus, revenues and expenses are reported in this statement for some items that will only result in cash flows in future fiscal periods (e.g., uncollected taxes and earned but unused vacation leave).
The government-wide financial statements distinguish governmental functions of the City, which are mainly supported by taxes and intergovernmental revenues, from the business-type functions that are intended to recover all or a significant portion of their costs through user fees and charges. The governmental activities of the City include general government, public safety, community services, public works, and community development. The business-type activities of the City include Water and Wastewater services.
The government-wide financial statements include not only the City itself (known as the primary government), but also two legally separate component units: the Escondido Vehicle Parking District and the Escondido Joint Powers Financing Authority. The component unites have been “blended” into the City’s financial statements because the governing board (although legally separate from the City) is substantially the same as the City’s.
As of February 1, 2012, a Successor Agency was created to replace the Escondido Community Development Commission (CDC). The Successor Agency is considered a separate legal entity under Assembly Bill (AB) 1484 for financial statement presentation purposes and is reported as a Private Purpose Trust Fund.
Also presented in the government-wide financial statements is a discretely presented component unit, the California for the Arts, Escondido Foundation (Foundation). It is included as a discretely presented component unit because the Foundation is fiscally dependent on the City; the City has assumed the obligation to provide financial support to the organization including the Center’s management fee, facility, and additional funding as needed based on annual operations. The City issued bonds in 1992 for the construction of the facility and was obligated for those payments. In addition, all land and buildings used by the Foundation is legally owned by the City. Financial information for this component unit is reported separately from the financial information presented for the primary government in a separate column on the government-wide financial statements as well as throughout the notes to the financial statements.
19

CITY OF ESCONDIDO Management’s Discussion and Analysis
Fund financial statements. A fund is a grouping of related accounts that is used to maintain control over resources that have been segregated for specific activities or objectives. The City, like other state and local governments, uses fund accounting to ensure and demonstrate compliance with finance-related legal requirements. All of the funds of the City of Escondido can be divided into three categories: governmental funds, proprietary funds, and fiduciary funds.
Governmental funds. Governmental funds are used to account for essentially the same functions reported as governmental activities in the government-wide financial statements. However, unlike the government-wide financial statements, governmental fund financial statements focus on near-term inflows and outflows of spendable resources, as well as on balances of spendable resources available at the end of the fiscal year by using an accounting method called modified accrual accounting which measures cash and all other financial assets that can readily be converted to cash. Such information may be useful in evaluating a government’s near-term financing requirements.
Because the focus of governmental funds is narrower than that of the government-wide financial statements, it is useful to compare the information presented for governmental funds with similar information presented for governmental activities in the government-wide financial statements. By doing so, readers may better understand the long-term impact of the government’s near-term financing decisions. Both the governmental fund balance sheet and the governmental fund statement of revenues, expenditures, and changes in fund balances provide a reconciliation to facilitate this comparison between governmental funds and governmental activities.
The City maintains 18 individual governmental funds. Information is presented separately in the governmental fund balance sheet and in the governmental fund statement of revenues, expenditures, and changes in fund balances for the General Fund and the Successor Agency Housing Special Revenue Fund, which are considered to be major funds. Data from the other 16 governmental funds are combined into a single, aggregated presentation. Individual fund data for each of these nonmajor governmental funds are provided in the form of combining statements elsewhere in this report.
The City adopts an annual appropriated budget which reflects its priorities and informs the public how the City’s funds are being spent. Budgetary comparison schedules for the General Fund and the Successor Agency Housing Special Revenue Fund have been provided in the required supplementary information of this report. These demonstrate compliance with the budget, and also reflect in what areas actual results deviated from expected budgetary estimates. Budgetary combining schedules for the other nonmajor governmental funds are provided after the combining statements.
Proprietary funds. The City maintains two different types of proprietary funds, the Enterprise and the Internal Service Funds. The Enterprise funds are used to report the same functions presented as business-type activities in the government-wide financial statements. The enterprise funds are used to account for its Water and Wastewater Funds. The Internal service funds are an accounting device used to accumulate and allocate costs internally among the City’s various functions. The City uses internal service funds to account for its Building Maintenance, Vehicle and Equipment Maintenance, Central Services, Network and Systems Administration, Workers' Compensation, General Liability, and Insurance Funds. Since these services predominantly benefit governmental rather than business-type functions, they have been included within governmental activities in the government-wide financial statements.
Proprietary funds provide the same type of information as the government-wide financial statements, only in more detail. The proprietary fund financial statements provide detailed information for the Water and Wastewater Funds, both of which are considered to be major funds. Conversely, all internal service funds are combined into a single, aggregated presentation in the proprietary fund financial statements. Individual fund data for the internal service funds are provided in the form of combining statements elsewhere in this report.
Fiduciary funds. Fiduciary funds are used to account for resources held for the benefit of parties outside the government. Fiduciary funds are not reflected in the government-wide financial statements because the resources of those funds are not available to support the City’s own programs.
20

CITY OF ESCONDIDO Management’s Discussion and Analysis
Notes to the financial statements. The notes provide additional information that is essential for a full understanding of the data provided in the government-wide and fund financial statements
Other information. In addition to the basic financial statements and accompanying notes, this report also presents certain required supplementary information concerning the City’s progress in funding its obligation to provide pension benefits to its employees as well as budgetary comparison statements for major governmental funds. The combining statements referred to earlier, in connection with nonmajor governmental funds and internal service funds are presented immediately following the required supplementary information.
Financial Analysis of Government-Wide Financial Statements
This section focuses on the City’s net position and changes in net position of its governmental and business-type activities for the fiscal year ending June 30, 2019. At the close of the most recent fiscal year, the City’s assets plus deferred outflows of resources exceeded liabilities plus deferred inflows of resources by $427,422,070, an increase of $7.1 million or 1.7 percent.
The largest portion of the City’s net position (96.9 percent or $414.5 million) is its net investment in capital assets such as land, buildings, infrastructure, and vehicles, less any related outstanding debt that was used to acquire those assets. The City uses these capital assets to provide a variety of services to its citizens. Accordingly, these assets are not available for future spending. Although the City’s investment in capital assets is reported net of related debt, it should be noted that the resources used to repay this debt must be provided from other sources, since the capital assets themselves cannot be used to liquidate these liabilities.
The restricted portion of the City’s net position (27.3 percent or $116.6 million) represent resources that are subject to external restrictions on how they may be used.
2019 2018 2019 2018 2019 2018
Current and other assets 196,049$ 184,634$ 78,280$ 82,967$ 274,329$ 267,601$ Capital assets 292,307 295,303 307,522 302,296 599,829 597,599
Total Assets 488,356 479,937 385,802 385,263 874,158 865,200
Deferred outflows of resources 35,924 52,977 8,052 11,940 43,976 64,917
Long-term liabilities outstanding 299,300 300,486 163,704 164,036 463,004 464,522 Other liabilities 13,599 19,683 12,169 24,164 25,768 43,847
Total Liabilities 312,899 320,169 175,873 188,200 488,772 508,369
Deferred inflows of resources 1,440 1,093 499 302 1,939 1,395
Net position:Net investment in capital assets 218,871 218,992 195,706 183,765 414,577 402,757 Restricted 115,517 104,852 1,096 3,642 116,613 108,494 Unrestricted (124,447) (112,192) 20,680 21,294 (103,767) (90,898)
Total net position 209,941$ 211,652$ 217,482$ 208,701$ 427,423$ 420,353$
City of Escondido's Summary of Net PositionAs of June 30, 2019 and 2018
(Amounts expressed in thousands)
Total Primary Governmentactivities activities
Governmental Business-type
21

CITY OF ESCONDIDO Management’s Discussion and Analysis
Unrestricted net position can be used to finance day-to-day operations without constraints established by debt covenants or other legal requirements or restrictions. At June 30, 2019, unrestricted net position was a deficit of ($103.8) million primarily due to the recording of the net pension liability as part of the implementation of Government Accounting Standards Board (GASB) No. 68 and 71 in fiscal year ending June 30, 2015.
The City’s net pension liability at June 30, 2019, is $243.2 million, compared to $251.9 million at June 30, 2018, a decrease of $8.7 million. Changes in the various components associated with the pension pronouncement affected current year expenses, deferred outflows and inflows, as well as the pension liability for the year for both governmental and business type activities.
The City has entered into a Section 115 Trust to help address the City’s pension obligations by accumulating assets to reduce the net pension liability. Although the assets held in the Section 115 Trust are not considered to have the present service capacity as pension plan assets, these assets will be considered pension plan assets at the time they are transferred out of the Trust and into the pension plan. At June 30, 2019, the Section 115 Trust balance amounted to approximately $7.0 million held in restricted cash and investments in the General Fund.
In the current fiscal year, the City is able to report positive balances in all categories of net position as a whole except for unrestricted net position. Components of the $7.1 million increase in total net position are discussed in the following sections for governmental activities and business‐type activities.
Analysis of Changes in Net Position – Governmental activities
The following analysis focuses on the net position and changes in net position of the City’s Governmental Activities, presented in the Government‐wide Statement of Net Position and Statement of Activities.
Governmental activities decreased the City’s net position by $1,711,635 and is predominantly attributed to the net pension liability and related deferred inflows and outflows recorded during the fiscal year discussed above. Restricted net position of the governmental activities was increased by the additional $5.0 million transferred to the Section 115 Pension Trust Fund.
2019 2018Increase /
(Decrease)
Current and other assets 196,049$ 184,634$ 11,415$ Capital assets 292,307 295,303 (2,996)
Total Assets 488,356 479,937 8,419
Deferred outflows of resources 35,924 52,977 (17,053)
Long-term liabilities outstanding 299,300 300,486 (1,186)Other liabilities 13,599 19,683 (6,084)
Total Liabilities 312,899 320,169 (7,270)
Deferred inflows of resources 1,440 1,093 347
Net position:Net investment in capital assets 218,871 218,992 (121)Restricted 115,517 104,852 10,665 Unrestricted (124,447) (112,192) (12,255)
Total net position 209,941$ 211,652$ (1,711)$
Governmental ActivitiesNet Position at June 30
(Amounts expressed in thousands)
22

CITY OF ESCONDIDO Management’s Discussion and Analysis
Governmental activities – Revenues
Governmental activities are generally financed through taxes, intergovernmental revenues, and other non-exchange revenues. Total governmental revenues increased by $8,788,757 or 6.7 percent during the current fiscal year resulting in total revenues of $140.5 million.
Key elements of this change are discussed below.
Overall sales tax revenue increased by $2.5 million, or 5.9 percent, compared to the prior year. General Fund sales tax revenues were $1.3 million higher than the previous year, or up about 3.5%. This was in line with Fiscal Year 2018/19 projected sales tax growth. This increase over the prior year is mainly due to growth in sales tax collected on building materials wholesale and service stations. These gains were offset by declines in sales tax collected from new auto sales and general retail.
Property tax revenue increased by $1,462,930 over the prior fiscal year or 4.4 percent. The assessed value growth for Escondido was up about 5.0 percent compared to the prior year.
Other tax revenue is composed of franchise, transient occupancy, business license, transfer station, and refuse taxes. All categories contributed to an overall decrease in other tax revenue by $487,800, or 4.4 percent. The majority of this decrease is from the franchise in lieu payment we receive from SDG&E. This revenue has declined by about $550,000 compared to the prior year due to less natural gas being used at the power plant. This decrease was offset by business license fee increases of $121,000.
Overall charges for services increased by $839,000 or 4.4 percent. Public safety charges for services increased by $511,000 due to a decrease in the number of Medicare and Medi-Cal transports resulting in less contractual write-offs of paramedic transport fees. Public Works and Engineering fees are up about $365,000 compared to the prior year due to increased residential construction projects.
Operating grants and contributions increased by $5.0 million, or 50.3 percent. This is due to a $1.9 million increase in Road Maintenance and Rehabilitation (SB1) funds, a gas tax increase that went into effect November 1, 2017, and new vehicle registration fees that began on January 1, 2018. In addition, the City received $1.2 million in State Grant funding for the Housing and Community Development projects.
Capital grants and contributions decreased by $1.9 million, or 20.0 percent, compared to the prior year, due to a decrease in park development fees and capital contributions from developers.
Revenues by Source 2019 2018Increase /
(Decrease)
Program revenues:Charges for services $ 19,848 $ 19,009 $ 839 Operating grants and contributions 15,009 9,980 5,029 Capital grants and contributions 7,654 9,565 (1,911)
Total program revenues 42,511 38,554 3,957
General revenues:Sales tax 44,602 42,100 2,502 Property taxes 34,572 33,109 1,463 Other taxes 10,536 11,024 (488)Other 8,268 6,913 1,355
Total general revenues 97,978 93,146 4,832
Total Revenues $ 140,489 $ 131,700 $ 8,789
Governmental Activities - RevenuesFor the Year Ended June 30(Amounts expressed in thousands)
23

CITY OF ESCONDIDO Management’s Discussion and Analysis
Governmental activities – Revenues by Source
The chart below presents revenues by source for Governmental Activities. Sales tax, Property tax and other various taxes make up a combined 65% of the total sources of revenue for the City. Other categories of revenue include charges for services, intergovernmental revenue for both operating and capital purposes, fines and forfeitures, permit and license fees, as well as income from interest and property.
Governmental activities – Expenses
The table below presents a comparison of fiscal year 2019 and fiscal year 2018 expenses by function, along with interest and other expenses.
Sales Tax32%
Property Taxes25%
Other Taxes8%
Charges for Service14%
Operating Grants and Contributions
11%
Capital Grants and Contributions
5%
Investment Earnings5%
Miscellaneous1%
2019 2018Increase /
(Decrease)Expenses:
General government $ 11,594 $ 11,320 $ 274 Public safety 80,834 80,848 (14)Community services 14,394 13,453 941 Public works 27,320 25,876 1,444 Community development 5,388 5,516 (128)Interest and fiscal charges 2,695 2,850 (155)
Total expenses 142,225 139,863 2,362
Increase (decrease) in net position before transfers (1,736) (8,163) 6,427
Transfers 25 50 (25)
Increase (decrease) in net position after transfers (1,711) (8,113) 6,402
Net position – July 1 211,652 219,765 (8,113)
Net position – June 30 $ 209,941 $ 211,652 $ (1,711)
Governmental Activities
(Amounts expressed in thousands)
Expenses and Change in Net Position for the Year Ended June 30
24

CITY OF ESCONDIDO Management’s Discussion and Analysis
Governmental activities expenses increased by $2.3 million, or 1.7 percent, in fiscal year 2018/19. This is primarily attributable to increases to salaries, CalPERS contributions, and software costs. Capital projects expenditures for the Community Services and Public Works departments also increased from the prior year by $940,000 and $1.4 million, respectively.
The chart below presents current year expenses by function for Governmental Activities. Capital outlays are not included as those are added to the City’s capital assets.
The City’s programs include General Government, Public Safety (Fire and Police), Community Services, Public Works, and Community Development. Each program’s net cost (total cost less revenues generated by the activities) is presented in the Statement of Activities. The table below compares program expenses to program revenues depicting the extent to which these programs generate revenue from fees and grants.
General Government8%
Public Safety57%
Community Services10%
Public Works19%
Community Development
4%
Interest and Fiscal Charges
2%
$11,594
$80,834
$14,395
$27,320
$5,388 $2,598
$14,182 $9,487
$14,742
$1,501
$-
$10,000
$20,000
$30,000
$40,000
$50,000
$60,000
$70,000
$80,000
$90,000
General Government Public Safety Community Services Public Works Community Development
Expenses Program Revenues
25

CITY OF ESCONDIDO Management’s Discussion and Analysis
Analysis of Changes in Net Position – Business-type activities
The following analysis focuses on the net position and changes in net position of the City’s Business‐type Activities presented in the Government‐wide Statement of Net Position and Statement of Activities. The table below presents the revenues and expenses for each of the City’s Business‐type Activities or Enterprise Funds. Business-type activities increased the City’s net position by $8,780,698.
The Water Fund ended the year with a change in net position of $930,000, about the same amount as the prior year. This was the result of a decrease in water charges for services of $4.1 million compared to the prior year mainly due to decreased water consumption as a result of a wet winter. This amount was offset by decreased total water operating expenses of $2.1 million mainly due to decreased purchased water costs that were offset by increased salaries, pension costs, and utilities.
The Wastewater Fund ended the year with a change in net position of $8.1 million. This was the result of an increase in total wastewater operating costs of about $825,000 due to increases in salaries, pension costs, professional services, and utilities. Wastewater charges for services increased by $1.3 million due to increased sewer service charges. Total investment income also increased by $2.7 million due to interest earnings on the fund’s cash balance.
2019 2018Increase /
(Decrease)Program revenues:
Charges for services $ 93,276 $ 96,015 (2,739)$ Operating grants and contributions 152 143 9 Capital grants and contributions 4,860 8,229 (3,369)
Other general revenues 4,474 1,526 2,948
Total revenues 102,762 105,913 (3,151)
Expenses:Water 60,286 62,431 (2,145)$ Wastewater 33,670 32,843 827
Total expenses 93,956 95,274 (1,318)
Increase (decrease) in net position before transfers 8,806 10,639 (1,833)
Transfers (25) (50) 25
Increase (decrease) in net position after transfers 8,781 10,589 (1,808)
Net position – July 1 208,701 198,111 10,590 Net position – June 30 $217,482 $208,700 $ 8,782
For the Year Ended June 30(Amounts expressed in thousands)
Business-type Activities - Change in Net Position
26

CITY OF ESCONDIDO Management’s Discussion and Analysis
Financial Analysis of the Government’s Funds
As noted earlier, the City uses fund accounting to ensure and demonstrate compliance with finance-related legal requirements.
Governmental funds. The focus of the City’s governmental funds is to provide information on near-term inflows, outflows, and balances of spendable resources. Such information is useful in assessing the City’s financing requirements. In particular, unassigned fund balance may serve as a useful measure of a government’s net resources available for spending at the end of the fiscal year.
As of the end of the current fiscal year, the City’s governmental funds reported combined ending fund balances of $125,340,291, an increase of $3,821,485 in comparison with the prior year. Of this amount, 4.3 percent or $5,469,597 represents non-spendable assets, advances and loans receivable, which are not expected to be converted to cash until future periods.
Approximately 77.8 percent of this total amount or $97,545,500 is not available for new spending because it is legally restricted by external third parties. In addition, $20,486,444 or 16.3 percent of ending fund balance has either been committed by the City Council to be spent for specific purposes or has been assigned by the City Manager to meet specific expenditures in subsequent years.
The remaining fund balance of $1,838,750 is comprised of unassigned funds in the General Fund of $1,888,896 and deficit fund balances in non-major special revenue funds of $50,146. The unassigned General Fund balance, which is unrestricted in use, is anticipated to be designated by City Council for specific purposes at a future City Council meeting. Non-major special revenue fund deficits are due to the timing of grants and reimbursements from outside agencies where funds are spent in advance and reimbursed at a later date.
General Fund Financial Highlights. The General Fund is the chief operating fund of the City. At the end of the current fiscal year, committed fund balance of the General Fund includes $17,392,319 in Reserves available to fund one-time unanticipated expenditures while total fund balance is $33,779,102. As a measure of the General Fund’s liquidity, it may be useful to compare the Reserve fund balance and total fund balance to total fund expenditures. The Reserve fund balance represents 17.1 percent of total General Fund expenditures, while total fund balance represents 33.1 percent of that same amount.
The restricted portion of the fund balance of the General Fund of $7,013,035 is the total value of assets held in the Section 115 Pension Trust Fund discussed above.
During the current fiscal year, the fund balance of the City’s General Fund decreased by $204,698, or 0.6 percent, compared to the prior year. This decrease is primarily due to certain operating revenues not meeting budgeted expectations. Other taxes are down $469,000 compared to the prior year. The majority of this decrease is from the franchise in lieu payment receive from SDG&E which has declined by about $550,000 compared to the prior year due to less natural gas being used at the power plant.
General Fund Budgetary Highlights
The original General Fund operating budget approved by Council was balanced with no use of reserves or significant one time transfers in from other funds. This was achieved with estimated revenues and transfers in of $106.9 million and estimated expenditures and transfers out of $106.9 million.
Management monitors revenues during the year and updates estimated revenue figures when new information is received by the City. General Fund revenue estimates were modified moderately during the year as compared to the originally budgeted estimates. A comparison of the original general fund budgeted operating revenue of $101 million to the final general fund budgeted revenue of $102.8 million results in a net increase in budgeted revenue of $1.8 million.
The primary reason for the increase to budgeted revenue is due to a $1.2 million increase in fire department reimbursements received for assisting with fire events outside the city limits. Charge for services for engineering were also increased by about $728,000. The remaining budget adjustments were due to various operating grants received during the fiscal year.
27

CITY OF ESCONDIDO Management’s Discussion and Analysis
Comparison of the fiscal year original general fund budgeted expenditures of $102.7 million to the final General Fund budgeted expenditures of $104.5 million results in a net increase in budgeted expenditures of $1.8 million. A $1.4 million budget adjustment was allocated to the fire department to cover costs for strike team incidents and grant funded training. Funding for these increases was provided from fire mutual aid and the Urban Area Security Initiative training grant.
Actual General Fund revenues were $657,000 greater than final budgeted amounts and expenditures were $2.5 million less than final budgeted amounts. Year-end actual expenditures were less than the budgeted amounts due to salary and benefit savings from empty positions that were not filled during the fiscal year.
Proprietary funds. The City’s proprietary funds provide the same type of information found in the government-wide financial statements, but in more detail.
At the end of the current fiscal year, the unrestricted net position of the Water and Wastewater Fund amounted to $4,433,056, and $17,942,900 respectively. Both the Water and Wastewater funds have set up an Operating, Debt, and Capital Reserve that will be used to ensure that both funds have adequate cash reserves to meet operating, capital and debt service requirements. The monies in this reserve can be used to meet emergency cash flow requirements, fund future capital projects, and provide protection from default on annual debt service payments.
Factors concerning the finances of these two funds have been addressed in the discussion of the City’s business-type activities above.
Capital Asset and Debt Administration
Capital assets. As of June 30, 2019, the City’s investments in capital assets for its governmental and business-type activities are $599,829,600, (net of accumulated depreciation). This investment in capital assets includes land, buildings, land improvements, machinery and equipment, motorized vehicles, park facilities, roads, bridges, water and wastewater systems, and a golf course. The total increase in the City’s investment in capital assets for the current fiscal year is 0.3 percent; this represents a 1.4 percent decrease for governmental activities and a 1.7 percent increase for business-type activities.
2019 2018 2019 2018 2019 2018
Land 52,704$ 52,704$ 3,138$ 2,979$ 55,842$ 55,683$ Buildings and systems 97,003 102,096 10,820 10,874 107,823 112,970 Improvements other than buildings 13,963 13,339 756 728 14,719 14,067 Machinery and equipment 14,018 14,731 2,543 2,395 16,561 17,126 Infrastructure 101,825 94,915 259,681 219,740 361,506 314,655 Construction in progress 12,794 17,519 30,584 65,580 43,378 83,099 Total $ 292,307 $ 295,304 $ 307,522 $ 302,296 $ 599,829 $ 597,600
City of Escondido’s Capital Assets(net of depreciation / in thousands)
Governmental Business-typeactivities activities Total
28

CITY OF ESCONDIDO Management’s Discussion and Analysis
Governmental Activities. Major capital asset events for governmental activities during the current fiscal year included the following:
Construction in progress decreased by a net $4.7 million due to current year additions of $7,508,253 and transfers of construction in progress of $12,233,430. Current year additions include several street projects; continued work on the El Norte Parkway project which adds a second bridge over Escondido Creek to allow widening of the roadway to its classified major road width, continued Tulip Street Improvements and continued work on the Citracado Parkway expansion project. The City is in process of upgrading the Phone System throughout the City.
Current year transfers of construction in progress included several completed projects. The major projects include completion of the East Valley Parkway project near Valley Center Road, which expanded a two-lane road to four-lanes. Also completed was the Escondido Creek Bikeway Missing Link project which connected the bikeway along the creek from North Broadway to Center City Pkwy. Several improvements were also made to Washington Park through a Housing Related Parks Program.
Machinery and equipment decreased by a net $256,353. The City entered into a new contract with a vendor to surplus vehicles and equipment in fiscal year 2018-19, no auctioning was done in fiscal year 2017-18 so a large amount of disposals took place this fiscal year. The Police and Fire Headquarters dispatch center equipment was upgraded this fiscal year from an Urban Area Security Initiative grant. There were also several servers purchased by Central Services.
Motorized vehicles decreased by a net $704,258 due to current year additions, deletions, and contributions between funds. The City has a vehicle replacement schedule that predetermines vehicles that will need replacement in the near future. Several vehicles were auctioned this fiscal year, since none were auctioned in the prior year. Some of the significant purchases during the fiscal year were a Freightliner asphalt truck, an Isuzu flatbed Crane truck, two Medix ambulances, twenty Ford trucks and fifteen Chevy trucks.
Additions and transfers to infrastructure totaled $11.5 million. These additions were streets, signalized lights, and storm drain contributed by developers and the completed infrastructure from the East Valley Parkway and Missing Link project.
Business-type Activities. Major capital asset events for business-type activities during the current fiscal year included the following:
Construction in progress decreased by a net $35 million due to current year additions of $13,429,401 and transfers of construction in progress of $48,425,920. Current year major additions to CIP include the Brine Line project, Recycled Water Easterly Main tank and pump station project, and pipeline replacement projects.
Current year transfers of construction in progress included several completed projects. The Water department completed the Onsite Chlorine Generation project at the Water Treatment Plant and they completed the Vista Verde Reservoir replacement project. The Wastewater department completed upgrades at the Hale Avenue Resource Recovery Facility.
Land increased by $159,000 due to purchases for the San Pasqual Undergrounding project and the Habitat Remediation project at Spruce. Machinery and equipment increased by a net $881,047 due to the purchase of various pumps and actuators, along with other equipment. A Bobcat Skid Steer Loader and a Chevy Silverado were purchased in the amount of $106,154, but were contributed to the Fleet Department to maintain.
Net additions to the water system totaled $29.7 million with transfers from CIP. Contributions of $193,436 are the water lines that were installed as part of the East Valley Parkway project and additions of $515,509 are water lines contributed by developers. Net additions to the sewer system totaled $18.7 million with transfers from CIP. Contributions of $5,373 are the sewer lines that were installed as part of the East Valley Parkway project and additions of $86,237 are sewer lines contributed by developers.
29

CITY OF ESCONDIDO Management’s Discussion and Analysis
Long-term debt. At the end of the current fiscal year, the City has total long-term debt outstanding of $451 million, a decrease of $14 million. Changes to the City’s outstanding debt during the current fiscal year are due to routine principal payments on amounts outstanding and changes in the pension liability for the year for both governmental and business type activities discussed earlier.
Factors Affecting Next Year’s Budget
The fiscal year 2019-20 General Fund operating budget has been balanced without relying on the use of reserves for the ninth year in a row. Available General Fund resources are anticipated to be $110.2 million. The proposed fiscal year 2019-20 General Fund revenue estimate is $105.4 million. This represents an increase of $2.5 million or 2.4 percent over the fiscal year 2018-19 amended revenue projection. The remaining balance of funding is comprised of $2.1 million in transfers from other funds, amounts on deposit from PEG fees and the Joslyn Trust and $2.7 million from the advance payback from the Successor Agency – Redevelopment Fund. Additional information regarding the economic outlook for the City is discussed in the accompanying Transmittal Letter.
Requests for Information
This financial report is designed to provide a general overview of the City’s finances for all those with an interest in the government’s finances and to demonstrate the city’s accountability for the money it receives. Questions concerning any of the information provided in this report or requests for additional financial information should be addressed to the City of Escondido, Finance Department, 201 North Broadway, Escondido, CA 92025, or online at www.escondido.org.
2019 2018 2019 2018 2019 2018
Compensated absences 6,854 6,535 1,318 1,288 8,172 7,823 Net pension liability 202,553 209,418 40,686 42,507 243,239 251,925 Claims payable 17,614 16,823 - - 17,614 16,823 Loans payable 2,675 3,086 11,306 11,840 13,981 14,926 Capital leases 1,893 2,348 - - 1,893 2,348 Connection rights payable - - 12,988 13,156 12,988 13,156 Certificates of participation - - 24,615 25,255 24,615 25,255 Revenue Bonds - - 68,445 70,635 68,445 70,635 Lease Revenue Bonds 3,515 3,750 - - 3,515 3,750 General Obligation Bonds 56,810 58,680 - - 56,810 58,680
$291,914 $300,640 $159,358 $ 164,681 $451,272 $465,321
(Amounts expressed in thousands)
Governmental Business-typeactivities activities Total
City of Escondido's Outstanding Debt
30

Basic Financial Statements
31

Component
Unit
California
Center for the
Governmental Business-type Arts, Escondido
Activities Activities Total Foundation
ASSETS
Cash and investments 85,515,711$ 65,632,911$ 151,148,622$ 1,994,769$
Receivables, net of allowances 27,374,862 11,418,096 38,792,958 116,672
Loans receivable 53,801,099 431,837 54,232,936 -
Due from Successor Agency 14,441,939 - 14,441,939 -
Internal balances 600,522 (600,522) - -
Due from other governments 4,390,030 200,611 4,590,641 -
Inventory, at cost 550,076 6,769 556,845 33,329
Deposits 379,873 - 379,873 -
Prepaid expenses 12,357 - 12,357 251,199
Prepaid bond insurance - 94,028 94,028 -
Land held for resale 1,969,237 - 1,969,237 -
Assets held in charitable remainder trust - - - 94,643
Restricted assets:
Investment in Section 115 Trust 7,013,035 - 7,013,035 -
Cash and investments with fiscal agent 15 1,095,891 1,095,906 -
Capital assets:
Not being depreciated 75,030,088 33,722,329 108,752,417 -
Being depreciated, net 217,277,034 273,800,149 491,077,183 418,211
Total Assets 488,355,878 385,802,099 874,157,977 2,908,823
DEFERRED OUTFLOWS OF RESOURCES
Deferred outflows of resources related to pensions 35,885,688 6,194,486 42,080,174 -
Deferred loss on refundings 38,273 1,857,469 1,895,742 -
Total Deferred Outflows of Resources 35,923,961 8,051,955 43,975,916 -
CITY OF ESCONDIDO
Statement of Net Position
June 30, 2019
Primary Government
See Accompanying Notes to Basic Financial Statements.
32

Component
Unit
California
Center for the
Governmental Business-type Arts, Escondido
Activities Activities Total Foundation
LIABILITIES
Accounts payable 4,839,423 4,310,987 9,150,410 237,599
Retentions payable 831,069 5,111,405 5,942,474 -
Accrued interest payable 1,051,787 1,459,721 2,511,508 -
Deposits payable 3,592,266 759,119 4,351,385 -
Accrued expenses 2,935,968 526,657 3,462,625 249,346
Unearned revenue 348,746 - 348,746 858,486
Long-term debt:
Due within one year 8,302,593 5,463,080 13,765,673 100,597
Due in more than one year:
Aggregate net pension liability 202,553,525 40,686,640 243,240,165 -
Other long-term debt 88,444,081 117,555,627 205,999,708 283,279
Total Liabilities 312,899,458 175,873,236 488,772,694 1,729,307
DEFERRED INFLOWS OF RESOURCES
Deferred inflows of resources related to pensions 1,075,205 499,216 1,574,421 -
Deferred gain on refundings 364,705 - 364,705 -
Total Deferred Inflows of Resources 1,439,910 499,216 1,939,126 -
NET POSITION
Net investment in capital assets 218,870,698 195,706,168 414,576,866 193,806
Restricted for:
General government 7,555,580 - 7,555,580 -
Low and moderate income housing 77,545,628 - 77,545,628 -
Community services 4,490,571 - 4,490,571 -
Debt service 3,279,495 1,095,891 4,375,386 -
Capital projects 2,921,062 - 2,921,062 -
Public safety 403,946 - 403,946 -
Public works 12,307,978 - 12,307,978 -
Investment in Section 115 Trust 7,013,035 - 7,013,035 -
Total restricted net position 115,517,295 1,095,891 116,613,186 -
Unrestricted (deficit) (124,447,522) 20,679,543 (103,767,979) 985,710
Total net position 209,940,471$ 217,481,602$ 427,422,073$ 1,179,516$
Primary Government
Statement of Net Position (Continued)
June 30, 2019
CITY OF ESCONDIDO
See Accompanying Notes to Basic Financial Statements.
33

Operating Capital
Charges for Grants and Grants and
Functions/Programs Expenses Services Contributions Contributions
Primary Government:
Governmental Activities:
General government 11,594,163$ 700,526$ 635,202$ 1,262,651$
Public safety 80,834,482 11,701,922 2,479,144 -
Community services 14,394,666 3,668,178 5,119,521 700,408
Public works 27,320,553 2,276,458 6,774,865 5,691,211
Community development 5,388,553 1,501,441 - -
Interest and fiscal charges 2,695,321 - - -
Total Governmental Activities 142,227,738 19,848,525 15,008,732 7,654,270
Business-type activities:
Water 60,286,760 57,495,553 - 862,402
Wastewater 33,669,077 35,780,554 152,007 3,997,128
Total Business-type Activities 93,955,837 93,276,107 152,007 4,859,530
Total Primary Government 236,183,575$ 113,124,632$ 15,160,739$ 12,513,800$
Component Unit:
California Center for the Arts,
Escondido Foundation 12,284,957$ 5,211,156$ 6,523,332$ -$
Program Revenues
CITY OF ESCONDIDO
Statement of Activities
For the Year Ended June 30, 2019
See Accompanying Notes to Basic Financial Statements.
34

Component Unit
Unit
California
Center for the
Governmental Business-type Arts, Escondido
Functions/Programs Activities Activities Total Foundation
Primary Government:
Governmental Activities:
General government (8,995,784)$ -$ (8,995,784)$ -$
Public safety (66,653,416) - (66,653,416) -
Community services (4,906,559) - (4,906,559) -
Public works (12,578,019) - (12,578,019) -
Community development (3,887,112) - (3,887,112) -
Interest and fiscal charges (2,695,321) - (2,695,321) -
Total Governmental Activities (99,716,211) - (99,716,211) -
Business-type activities:
Water - (1,928,805) (1,928,805) -
Wastewater - 6,260,612 6,260,612 -
Total Business-type Activities - 4,331,807 4,331,807 -
Total Primary Government (99,716,211) 4,331,807 (95,384,404) -
Component Unit:
California Center for the Arts,
Escondido Foundation - - - (550,469)
General Revenues:
Sales tax 44,601,539 - 44,601,539 -
Property tax 34,572,128 - 34,572,128 -
Franchise tax 6,083,566 - 6,083,566 -
Transient occupancy tax 1,749,516 - 1,749,516 -
Business license tax 1,948,935 - 1,948,935 -
Transfer station tax 666,839 - 666,839 -
Refuse collection tax 89,144 - 89,144 -
Investment earnings 7,221,048 4,078,342 11,299,390 68,414
Gain on sale of capital assets 465,008 - 465,008 -
Miscellaneous 581,853 395,549 977,402 211,679
Total general revenues 97,979,576 4,473,891 102,453,467 280,093
Transfers 25,000 (25,000) - -
Total general revenues and transfers 98,004,576 4,448,891 102,453,467 280,093
Change in net position (1,711,635) 8,780,698 7,069,063 (270,376)
Net position:
Beginning of year 211,652,106 208,700,904 420,353,010 1,449,892
End of year 209,940,471$ 217,481,602$ 427,422,073$ 1,179,516$
Primary Government
CITY OF ESCONDIDO
Statement of Activities (Continued)
For the Year Ended June 30, 2019
Changes in Net Position
Net (Expense) Revenue and
See Accompanying Notes to Basic Financial Statements.
35

Successor Nonmajor Total
Agency Governmental Governmental
General Housing Funds Funds
ASSETS
Cash and investments 16,478,557$ 6,645,440$ 33,137,254$ 56,261,251$
Receivables (net):
Accounts 3,615,059 - 495,942 4,111,001
Interest 133,320 9,381,485 5,547,301 15,062,106
Taxes 7,954,905 - 42,068 7,996,973
Loans 200,000 35,711,236 17,889,863 53,801,099
Due from other governments 707,612 - 3,682,418 4,390,030
Due from Successor Agency 13,487,986 - 953,953 14,441,939
Inventory, at cost - - 20,793 20,793
Prepaid expenditures - - 12,358 12,358
Deposits - - 67,273 67,273
Land held for resale - 1,969,237 - 1,969,237
Advances to other funds - - 245,000 245,000
Restricted assets:
Cash and investments 7,013,035 - - 7,013,035
Cash and investments with fiscal agent - - 15 15
Total Assets 49,590,474$ 53,707,398$ 62,094,238$ 165,392,110$
LIABILITIES, DEFERRED INFLOWS OF
RESOURCES, AND FUND BALANCES
Liabilities:
Accounts payable 1,387,614$ 42,776$ 2,456,968$ 3,887,358$
Deposits payable 1,211,681 7,500 2,373,085 3,592,266
Retentions payable - - 831,069 831,069
Accrued expenditures 2,661,057 8,350 106,816 2,776,223
Unearned revenue - - 348,746 348,746
Advances from other funds 245,000 - - 245,000
Total Liabilities 5,505,352 58,626 6,116,684 11,680,662
Deferred Inflows of Resources:
Unavailable revenue 10,306,020 9,347,296 8,717,841 28,371,157
Total Deferred Inflows of Resources 10,306,020 9,347,296 8,717,841 28,371,157
Fund Balances:
Nonspendable 5,187,424 - 282,173 5,469,597
Restricted 7,013,035 44,301,476 46,230,989 97,545,500
Committed 17,392,319 - 796,697 18,189,016
Assigned 2,297,428 - - 2,297,428
Unassigned (deficit) 1,888,896 - (50,146) 1,838,750
Total Fund Balances 33,779,102 44,301,476 47,259,713 125,340,291
Total Liabilities, Deferred Inflows of
Resources, and Fund Balances 49,590,474$ 53,707,398$ 62,094,238$ 165,392,110$
Major Funds
CITY OF ESCONDIDO
Balance Sheet
Governmental Funds
June 30, 2019
See Accompanying Notes to Basic Financial Statements.
36

Fund balances for governmental funds 125,340,291$
Capital assets used in governmental activities are not current financial resources and, therefore, are
not reported in the governmental funds.
Amount reported in government-wide statement of net position:
Capital assets, not being depreciated $ 75,030,088
Capital assets, being depreciated, net 217,277,034
Less: amount reported in internal services fund (8,220,572)
284,086,550
A portion of the unavailable revenue is not available to pay for current-period expenditures and,
therefore, is not recognized in the funds. 28,371,157
Internal service funds are used by management to charge the costs of activities involved in rendering
services to departments within the City. The assets and liabilities of the internal service funds are
included in the Statement of Net Position.
Total internal service fund net position 10,061,867$
Adjustment to reflect the consolidation of internal service fund activities
related to enterprise funds 600,522
10,662,389
Noncurrent liabilities, including bonds payable, are not due and payable in the current period and
therefore are not reported in the funds. Noncurrent liabilities allocated from internal service funds
are included in the internal service fund adjustment above.
Compensated absences (6,853,951)$
Claims payable (17,613,800)
Loans (2,674,999)
Leases (1,892,577)
Bonds (60,325,000)
Bond premium 6,423
Bond discount (7,392,770)
Deferred gain on refunding (364,705)
Deferred loss on refunding 38,273
Less: amount reported in internal services fund 18,477,723
(78,595,383)
Net pension liability is not due and payable in the current period and therefore is not reported in the
governmental funds. The net pension liability allocated from internal service funds are included in
the internal service fund adjustment above.
Aggregate net pension liability (202,553,525)
Less: amount reported in internal services fund 10,253,902
(192,299,623)
Deferred outflows and deferred inflows of resources related to pensions are not available for current
period and, therefore, are deferred in the governmental funds or not recorded in the governmental
funds
Deferred outflows of resources related to pensions 35,885,688
Deferred inflows of resources related to pensions (1,075,205)
Less: amount reported in internal services fund (1,383,606)
33,426,877Interest payable on noncurrent liabilities is not accrued in governmental funds, but rather is
recognized as an expenditure when due. (1,051,787)
Net position of governmental activities 209,940,471$
CITY OF ESCONDIDO
Reconciliation of the Governmental Funds Balance Sheet
to the Government-Wide Statement of Net Position
June 30, 2019
Amounts reported for governmental activities in the statement of net position are different because:
See Accompanying Notes to Basic Financial Statements.
37

Successor Nonmajor Total
Agency Governmental Governmental
General Fund Housing Funds Funds
Revenues:
Sales tax 38,678,931$ -$ -$ 38,678,931$
Property taxes 27,957,109 - 4,801,714 32,758,823
Other taxes 12,362,304 - 5,922,608 18,284,912
Licenses and permits 888,019 - - 888,019
Fines and forfeits 1,257,729 - - 1,257,729
Intergovernmental 3,612,476 - 14,419,436 18,031,912
Charges for services 12,996,241 - 2,441,870 15,438,111
Special assessments - - 831,574 831,574
Lease income 3,827,550 171,379 - 3,998,929
Investment income 1,521,540 492,885 1,116,410 3,130,835
Miscellaneous 428,545 210,143 185,582 824,270
Total Revenues 103,530,444 874,407 29,719,194 134,124,045
Expenditures:
Current:
General government 6,325,852 - 78,280 6,404,132
Public safety 68,630,159 - 1,553,168 70,183,327
Public works 12,678,893 - 7,904,741 20,583,634
Community services 9,604,323 - 3,377,848 12,982,171
Community development 4,008,638 427,240 341,620 4,777,498
Capital outlay 91,680 - 7,515,154 7,606,834
Debt service:
Principal retirements 528,413 - 2,174,096 2,702,509
Interest and fiscal charges 109,268 - 3,024,542 3,133,810
Total Expenditures 101,977,226 427,240 25,969,449 128,373,915
Excess (Deficiency) of Revenues
Over Expenditures 1,553,218 447,167 3,749,745 5,750,130
Other Financing Sources (Uses):
Transfers in 2,080,000 954,046 1,022,383 4,056,429
Transfers (out) (3,837,916) - (2,147,158) (5,985,074)
Total Other Financing Sources (Uses) (1,757,916) 954,046 (1,124,775) (1,928,645)
Net Change in Fund Balance (204,698) 1,401,213 2,624,970 3,821,485
Fund Balances:
Beginning of Year 33,983,800 42,900,263 44,634,743 121,518,806
End of Year 33,779,102$ 44,301,476$ 47,259,713$ 125,340,291$
For the Year Ended June 30, 2019
Major Funds
CITY OF ESCONDIDO
Statement of Revenues, Expenditures, and Changes in Fund Balances
Governmental Funds
See Accompanying Notes to Basic Financial Statements.
38

Net change in fund balances - total governmental funds: 3,821,485$
Amounts reported for governmental activities in the statement of activities are different because:
Governmental funds report capital outlays as expenditures. However, in the statement of activities
the cost of these assets are allocated over their estimated useful lives and reported as depreciation
expense. This is the amount by which capital outlays, contributed capital assets, retirements, and
capital related expenditures exceeded depreciation in the current period. Capital asset activity from
internal service funds are reported in the internal service activity below.
Capital outlay 7,606,834$
Depreciation, net of $2,847,281 from Internal Service Funds (12,442,637)
Contributed capital assets 2,308,333
Capital assets contributions from business-type activities, net (92,655)
Less: amount reported in internal services fund (244,548)
(2,864,673)
Revenues in the statement of activities that do not provide current financial resources are not
reported as revenues in the funds. 2,207,681
Internal service funds are used by management to charge the costs of activities involved in rendering
services to departments within the City. The net revenue of internal service funds was reported with
governmental activities.
Total internal service fund net position 2,195,545$
Adjustment to reflect the consolidation of internal service fund activities related to
enterprise funds 205,271
2,400,816$
The issuance of long-term debt provides current financial resources to governmental funds, while
the repayment of the principal of long-term debt consumes the current financial resources of
governmental funds. Neither transaction however, has any effect on net assets.
Change in compensated absences (358,157)$
Change in pension liability (10,089,915)
Principal retirements 2,702,509
Accrued interest 468,619
(7,276,944)
Change in net position of governmental activities (1,711,635)$
CITY OF ESCONDIDO
Reconciliation of the Governmental Funds Statement of Revenues, Expenditures, and
Changes in Fund Balances to the Government-Wide Statement of Activities
For the Year Ended June 30, 2019
See Accompanying Notes to Basic Financial Statements.
39

Governmental
Activities
Internal
Water Wastewater Total Service Funds
ASSETS
Current Assets:
Cash and investments 25,861,245$ 39,771,666$ 65,632,911$ 29,254,460$
Receivables (Net):
Accounts 8,284,728 2,777,852 11,062,580 53,953
Interest 131,532 223,984 355,516 150,829
Loans - 64,803 64,803 -
Due from other governments 100,013 100,598 200,611 -
Inventory - 6,769 6,769 529,283
Deposits - - - 312,600
Total Current Assets 34,377,518 42,945,672 77,323,190 30,301,125
Noncurrent Assets:
Restricted cash and investments 375 1,095,516 1,095,891 -
Loans receivables - 367,034 367,034 -
Prepaid bond insurance 94,028 - 94,028 -
Capital assets:
Not being depreciated 8,855,063 24,867,266 33,722,329 698
Being depreciated, net 116,272,393 157,527,756 273,800,149 8,219,874
Total Noncurrent Assets 125,221,859 183,857,572 309,079,431 8,220,572
Total Assets 159,599,377 226,803,244 386,402,621 38,521,697
DEFERRED OUTFLOWS OF RESOURCES
Deferred outflows of resources related to pensions 2,886,331 3,308,155 6,194,486 1,503,057
Deferred loss on refundings 774,633 1,082,836 1,857,469 -
Total Deferred Outflows of Resources 3,660,964 4,390,991 8,051,955 1,503,057
Major Funds
CITY OF ESCONDIDO
Statement of Net Position
Proprietary Funds
June 30, 2019
See Accompanying Notes to Basic Financial Statements.
40

Governmental
Activities
Internal
Water Wastewater Total Service Funds
LIABILITIES
Current Liabilities:
Accounts payable 2,086,955 2,224,032 4,310,987 952,065
Retention payable 4,686,066 425,339 5,111,405 -
Accrued expenses 267,671 258,986 526,657 159,746
Due to other funds - - - -
Accrued interest 830,002 629,719 1,459,721 -
Long-term debt, due within one year 1,643,015 3,820,065 5,463,080 3,820,307
Total Current Liabilities 9,513,709 7,358,141 16,871,850 4,932,118
Noncurrent Liabilities:
Deposits payable 615,048 144,071 759,119 -
Aggregate net pension liabilities 18,992,085 21,694,555 40,686,640 10,253,902
Long-term debt, due in more than one year 65,019,548 52,536,079 117,555,627 14,657,416
Total Noncurrent Liabilities 84,626,681 74,374,705 159,001,386 24,911,318
Total Liabilities 94,140,390 81,732,846 175,873,236 29,843,436
DEFERRED INFLOWS OF RESOURCES
Deferred inflows of resources related to pensions 232,873 266,343 499,216 119,451
Total Deferred Inflows of Resources 232,873 266,343 499,216 119,451
NET POSITION
Net investment in capital assets 64,454,022 131,252,146 195,706,168 7,550,890
Unrestricted 4,433,056 17,942,900 22,375,956 2,510,977
Total Net Position 68,887,078$ 149,195,046$ 218,082,124 10,061,867$
Adjustment to reflect the consolidation of internal service fund
activities to related enterprise funds (600,522)
Net position of business-type activities 217,481,602$
CITY OF ESCONDIDO
Statement of Net Position (Continued)
Proprietary Funds
June 30, 2019
Major Funds
See Accompanying Notes to Basic Financial Statements.
41

Governmental
Activities
Internal
Service
Water Wastewater Total Funds
Operating Revenues:
Charges for services 57,044,241$ 35,780,554$ 92,824,795$ 31,707,182$
Total Operating Revenues 57,044,241 35,780,554 92,824,795 31,707,182
Operating Expenses:
Personnel services 12,067,358 12,071,011 24,138,369 5,605,595
Purchased water 24,017,147 - 24,017,147 -
Administrative expenses 6,128,265 3,085,398 9,213,663 1,982,285
Benefit claims - - - 2,180,806
Supplies 2,639,917 1,298,286 3,938,203 370,148
Repairs and maintenance 1,974,600 1,797,026 3,771,626 1,396,935
Depreciation 4,082,758 5,917,467 10,000,225 2,847,281
Utilities 3,580,720 3,149,504 6,730,224 1,389,351
Fuel - - - 1,137,514
Professional services 1,182,011 2,806,974 3,988,985 3,885,238
Insurance premiums 578,240 480,240 1,058,480 11,718,889
Rent 459,440 284,745 744,185 2,825
Other 721,199 532,715 1,253,914 769,329
Total Operating Expenses 57,431,655 31,423,366 88,855,021 33,286,196
Operating Income (Loss) (387,414) 4,357,188 3,969,774 (1,579,014)
Business-Type Activities
CITY OF ESCONDIDO
Statement of Revenues, Expenses, and Changes in Fund Net Position
Proprietary Funds
For the Year Ended June 30, 2019
See Accompanying Notes to Basic Financial Statements.
42

Governmental
Activities
Internal
Service
Water Wastewater Total Funds
Nonoperating Revenues (Expenses):
Investment income 1,079,560 1,591,515 2,671,075 973,913
Rents and concessions 1,304,432 - 1,304,432 -
Interest and fiscal charges (2,722,427) (2,173,118) (4,895,545) (30,130)
Miscellaneous 341,737 156,648 498,385 640,182
Total Nonoperating Revenues (Expenses) 3,302 (424,955) (421,653) 1,583,965
Income Before Transfers and Capital Contributions (384,112) 3,932,233 3,548,121 4,951
Transfers in - - - 2,173,000
Transfers (out) - (25,000) (25,000) (219,355)
Capital Contributions:
Connection fees 451,312 1,004,415 1,455,727 -
Intergovernmental 153,456 3,053,110 3,206,566 -
Developer contributions 708,945 91,610 800,555 236,949
Total Transfers and Capital Contributions 1,313,713 4,124,135 5,437,848 2,190,594
Changes in Net Position 929,601 8,056,368 8,985,969 2,195,545
Net Position at Beginning of Year 67,957,477 141,138,678 209,096,155 7,866,322
Net Position at End of Year 68,887,078$ 149,195,046$ 218,082,124$ 10,061,867$
Change in Net Position 8,985,969$
Adjustment to reflect the consolidation of internal
service fund activities to related enterprise funds (205,271)
Change in net position of business-type activities 8,780,698$
CITY OF ESCONDIDO
Statement of Revenues, Expenses, and Changes in Fund Net Position (Continued)
Proprietary Funds
For the Year Ended June 30, 2019
Business-Type Activities
See Accompanying Notes to Basic Financial Statements.
43

Governmental
Activities
Internal
Service
Water Wastewater Total Funds
Cash Flows from Operating Activities:
Cash received from customers 59,179,053$ 35,637,675$ 94,816,728$ 31,678,447$
Cash paid to employees for services (11,048,881) (10,986,639) (22,035,520) (7,173,513)
Cash paid to suppliers for goods or services (47,129,051) (14,245,529) (61,374,580) (22,096,399)
Cash for rents and concessions 1,304,432 - 1,304,432 -
Cash from other sources 341,737 217,689 559,426 175,174
Net Cash Provided by Operating Activities 2,647,290 10,623,196 13,270,486 2,583,709
Cash Flows from Noncapital Financing Activities:
Cash received from (paid to) other funds - (25,000) (25,000) 1,953,645
Net Cash Provided by (Used in) Noncapital
Financing Activities - (25,000) (25,000) 1,953,645
Cash Flows from Capital and Related
Financing Activities:
Purchase and construction of capital assets (3,159,805) (12,066,577) (15,226,382) (2,683,012)
Construction in progress reimbursement 53,443 2,952,512 3,005,955 -
Sale of capital assets - - - 494,491
Payments on connection rights 304,961 982,543 1,287,504 -
Cash received for connection fees 708,945 91,610 800,555 -
Capital lease payment - - (190,376)
Principal payments on bonds (1,185,000) (1,645,000) (2,830,000) -
Interest payments on bonds (2,519,497) (1,930,999) (4,450,496) -
Principal payments on loans (243,395) (440,544) (683,939) (94,601)
Interest payments on loans (68,213) (384,764) (452,977) (14,585)
Net Cash (Used in) Capital and
Related Financing Activities (6,108,561) (12,441,219) (18,549,780) (2,488,083)
Cash Flows from Investing Activities:
Investment income received 1,061,295 1,542,786 2,604,081 937,506
Net Cash Provided by Investing Activities 1,061,295 1,542,786 2,604,081 937,506
Net increase (decrease) in cash and
cash equivalents (2,399,976) (300,237) (2,700,213) 2,986,777
Cash and cash equivalents:
Beginning of year 28,261,596 41,167,419 69,429,015 26,267,683
End of year 25,861,620$ 40,867,182$ 66,728,802$ 29,254,460$
Reconciliation of Cash Equivalents to
the Statement of Net Position:
Cash and investments 25,861,245$ 39,771,666$ 65,632,911$ 29,254,460$
Restricted cash and investments 375 1,095,516 1,095,891 -
Total cash and cash equivalents $ 25,861,620 $ 40,867,182 $ 66,728,802 $ 29,254,460
Business-Type Activities
CITY OF ESCONDIDO
Statement of Cash Flows
Proprietary Funds
For the Year Ended June 30, 2019
See Accompanying Notes to Basic Financial Statements.
44

Governmental
Activities
Internal
Service
Water Wastewater Total Funds
Reconciliation of Operating Income (Loss) to Net
Cash Provided by Operating Activities:
Operating income (loss) (387,414)$ 4,357,188$ 3,969,774$ (1,579,014)$
Adjustment to reconcile operating income (loss) to
net cash provided by operating activities:
Depreciation 4,082,758 5,917,467 10,000,225 2,847,281
Pension expense 1,004,759 1,049,518 2,054,277 464,362
Cash from rent and concessions 1,304,432 - 1,304,432 -
Cash from other sources 341,737 156,648 498,385 175,174
Changes in assets, deferred outflows of resources,
deferred inflows of resources, and liabilities:
Accounts receivable 2,127,944 (142,879) 1,985,065 (28,735)
Inventories - (1,614) (1,614) (99,030)
Loans receivable - 61,041 61,041 -
Accounts payable (2,445,238) (1,135,448) (3,580,686) 52,918
Retentions payable (3,402,274) 326,421 (3,075,853) -
Accrued expenses 7,403 11,426 18,829 (292)
Compensated absences 6,315 23,428 29,743 (39,355)
Customer deposits 6,868 - 6,868 -
Estimated claims payable - - - 790,400
Total adjustments 3,034,704 6,266,008 9,300,712 4,162,723
Net Cash Provided by Operating Activities $ 2,647,290 $ 10,623,196 $ 13,270,486 $ 2,583,709
Noncash Investing, Capital and Financing
Activities:
Contributed property, plant and equipment 135,456$ (42,801)$ 92,655$ 236,949$
Bond amortization 63,445 271,731 335,176 -
Total noncash investing, capital and financing
activities 198,901$ 228,930$ 427,831$ 236,949$
Business-Type Activities
CITY OF ESCONDIDO
Statement of Cash Flows
Proprietary Funds
For the Year Ended June 30, 2019
See Accompanying Notes to Basic Financial Statements.
45

Private
Purpose
Trust Fund
Successor
Agency Agency of the
Funds Former CDC
ASSETS
Cash and investments 12,180,904$ 4,565,034$
Cash and investments with fiscal agent 348,780 -
Receivables:
Interest 5,139 9,889
Taxes 9,291 -
Loans - 245,424
Total Assets 12,544,114$ 4,820,347
LIABILITIES
Accounts payable 180,995$ -
Deposits payable 10,735,861 -
Due to bondholders 1,627,258 -
Long-term liabilities:
Due within one year - 3,322,326
Due in more than one year - 11,119,613
Total Liabilities 12,544,114$ 14,441,939
NET POSITION
Held in trust for other purposes (9,621,592)
Total Net Position (9,621,592)$
CITY OF ESCONDIDO
Statement of Fiduciary Net Position
Fiduciary Funds
June 30, 2019
See Accompanying Notes to Basic Financial Statements.
46

Private
Purpose
Trust Fund
Successor
Agency of the
Former CDC
ADDITIONS:
Taxes 6,217,805$
Interest and change in fair value of investments 22,305
Total Additions 6,240,110
DEDUCTIONS:
Administrative expenses 249,245
Reduction in due from other governments 469,988
Interest expense 150,447
Total Deductions 869,680
Changes in Net Position 5,370,430
NET POSITION:
Beginning of year (14,992,022)
End of year (9,621,592)$
CITY OF ESCONDIDO
Statement of Changes in Fiduciary Net Position
Fiduciary Funds
For the Year Ended June 30, 2019
See Accompanying Notes to Basic Financial Statements.
47

CITY OF ESCONDIDO Notes to Basic Financial Statements For the Year Ended June 30, 2019
Note 1 – Summary of Significant Accounting Policies Financial statement presentation follows the recommendations promulgated by the Governmental Accounting Standards Board (“GASB”) commonly referred to as accounting principles generally accepted in the United States of America (“U.S. GAAP”). GASB is the accepted standard-setting body for establishing government accounting and financial reporting standards. A. Reporting Entity
The City of Escondido (City) was incorporated in 1888 and operates under a Council/Manager form of government. The Council is composed of five members. As required by U. S. GAAP, the financial statements present the government and its component units for which the government is considered financially accountable. The inclusion of an organization within the scope of the reporting entity of the City of Escondido is based on the provisions of GASB Statement No. 14 and amended with GASB Statement No. 61. The following criteria were used in the determination of the blended component units:
The members of the City Council also act as the governing body of the Escondido Vehicle Parking District (District) and the Escondido Joint Power Financing Authority (Authority).
The District and the Authority are managed by employees of the City. The District and the Authority are financially interdependent. They provide financial benefit/burden to
the City.
Blended Component Units The following blended component units, although legally separate entities, are, in substance, part of the government’s operations and so data from these units are combined with data of the primary government. Each blended component unit as described below has a June 30-year end.
Escondido Vehicle Parking District The Escondido Vehicle Parking District (District) was established in 1962 for the purpose of acquiring and improving parking lots in Escondido. The City Council acts as the District's governing board and exerts significant influence over its operations. The funds of the District have been included in the governmental activities of the financial statements. Separate financial statements are not prepared for this blended component unit. Escondido Joint Powers Financing Authority The City and Commission formed the Escondido Joint Powers Financing Authority (Authority). The Authority was established in 1991 for the purpose of providing for the financing of public capital improvements for the Members through the issuance of bonds by the Authority and the leasing of the public capital improvements to the members and/or the acquisition of obligations pursuant to which public capital improvements are financed by or for the benefit of the members. The City Council acts as the Authority's governing board and exerts significant influence over its operations. The funds of the Authority have been included in the governmental activities of the financial statements. Separate financial statements are not prepared for this blended component unit.
48
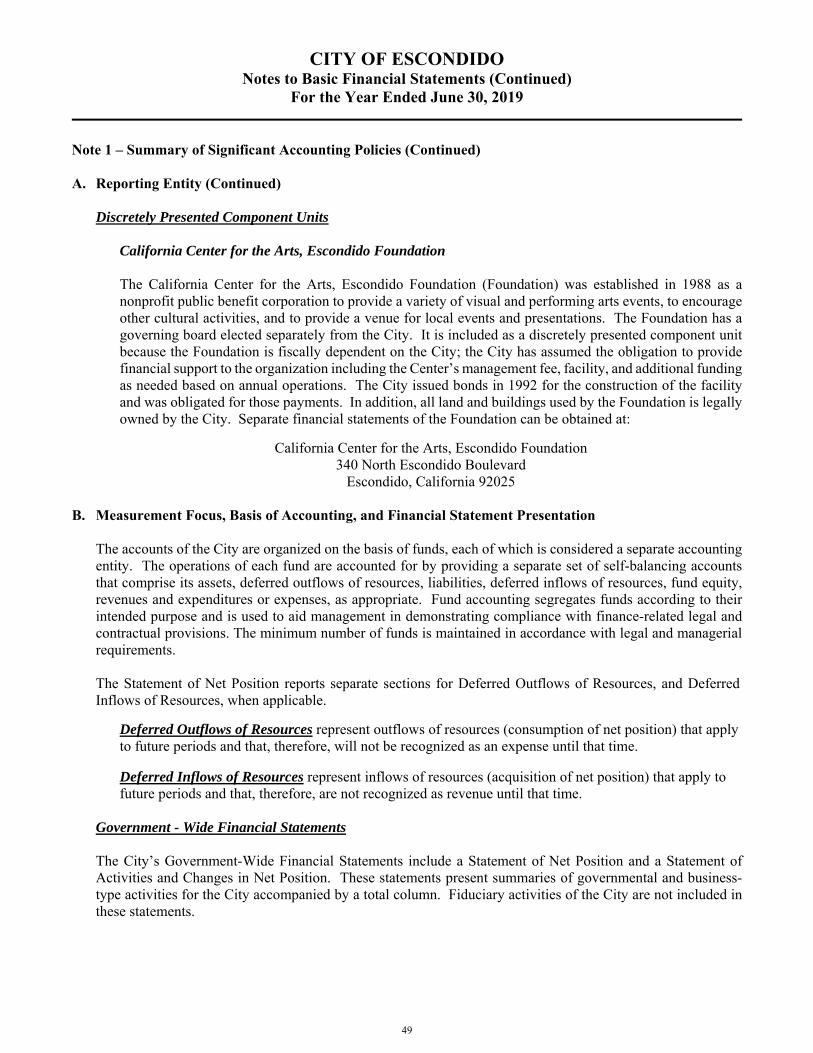
CITY OF ESCONDIDO Notes to Basic Financial Statements (Continued)
For the Year Ended June 30, 2019
Note 1 – Summary of Significant Accounting Policies (Continued) A. Reporting Entity (Continued)
Discretely Presented Component Units
California Center for the Arts, Escondido Foundation
The California Center for the Arts, Escondido Foundation (Foundation) was established in 1988 as a nonprofit public benefit corporation to provide a variety of visual and performing arts events, to encourage other cultural activities, and to provide a venue for local events and presentations. The Foundation has a governing board elected separately from the City. It is included as a discretely presented component unit because the Foundation is fiscally dependent on the City; the City has assumed the obligation to provide financial support to the organization including the Center’s management fee, facility, and additional funding as needed based on annual operations. The City issued bonds in 1992 for the construction of the facility and was obligated for those payments. In addition, all land and buildings used by the Foundation is legally owned by the City. Separate financial statements of the Foundation can be obtained at:
California Center for the Arts, Escondido Foundation 340 North Escondido Boulevard
Escondido, California 92025
B. Measurement Focus, Basis of Accounting, and Financial Statement Presentation The accounts of the City are organized on the basis of funds, each of which is considered a separate accounting entity. The operations of each fund are accounted for by providing a separate set of self-balancing accounts that comprise its assets, deferred outflows of resources, liabilities, deferred inflows of resources, fund equity, revenues and expenditures or expenses, as appropriate. Fund accounting segregates funds according to their intended purpose and is used to aid management in demonstrating compliance with finance-related legal and contractual provisions. The minimum number of funds is maintained in accordance with legal and managerial requirements. The Statement of Net Position reports separate sections for Deferred Outflows of Resources, and Deferred Inflows of Resources, when applicable.
Deferred Outflows of Resources represent outflows of resources (consumption of net position) that apply to future periods and that, therefore, will not be recognized as an expense until that time. Deferred Inflows of Resources represent inflows of resources (acquisition of net position) that apply to future periods and that, therefore, are not recognized as revenue until that time.
Government - Wide Financial Statements The City’s Government-Wide Financial Statements include a Statement of Net Position and a Statement of Activities and Changes in Net Position. These statements present summaries of governmental and business-type activities for the City accompanied by a total column. Fiduciary activities of the City are not included in these statements.
49

CITY OF ESCONDIDO Notes to Basic Financial Statements (Continued)
For the Year Ended June 30, 2019
Note 1 – Summary of Significant Accounting Policies (Continued)
B. Measurement Focus, Basis of Accounting, and Financial Statement Presentation (Continued)
Government - Wide Financial Statements (Continued) These financial statements are presented on an “economic resources” measurement focus and the accrual basis of accounting. Accordingly, all of the City’s assets and liabilities, including capital assets, as well as infrastructure assets, and long-term liabilities, are included in the accompanying Statement of Net Position. The Statement of Activities presents changes in Net Position. Under the accrual basis of accounting, revenues are recognized in the period in which they are earned while expenses are recognized in the period in which the liability is incurred. Certain types of transactions are reported as program revenues for the City in three categories:
Charges for services Operating grants and contributions Capital grants and contributions
Certain eliminations have been made in regards to interfund activities, payables and receivables. All internal balances in the Statement of Net Position have been eliminated except those representing balances between the governmental activities and the business-type activities, which are presented as internal balances and eliminated in the total primary government column. In the Statement of Activities and Changes in Net Position, internal service fund transactions have been eliminated; however, those transactions between governmental and business-type activities have not been eliminated. The following interfund activities have been eliminated:
Due to/from other funds Advances to/from other funds Transfers in/out
Governmental Fund Financial Statements Governmental Fund Financial Statements include a Balance Sheet and a Statement of Revenues, Expenditures and Changes in Fund Balances for all major governmental funds and nonmajor funds aggregated. An accompanying schedule is presented to reconcile and explain the differences in Net Position as presented in these statements to the Net Position presented in the Government-Wide Financial Statements. The City has presented all major funds that met the applicable criteria.
All governmental funds are accounted for on a spending or "current financial resources" measurement focus and the modified accrual basis of accounting. Accordingly, only current assets and current liabilities are included on the Balance Sheet. The Statement of Revenues, Expenditures and Changes in Fund Balances presents increases (revenues and other financing sources) and decreases (expenditures and other financing uses) in net current assets. Under the modified accrual basis of accounting, revenues are recognized in the accounting period in which they become both measurable and available to finance expenditures of the current period.
50
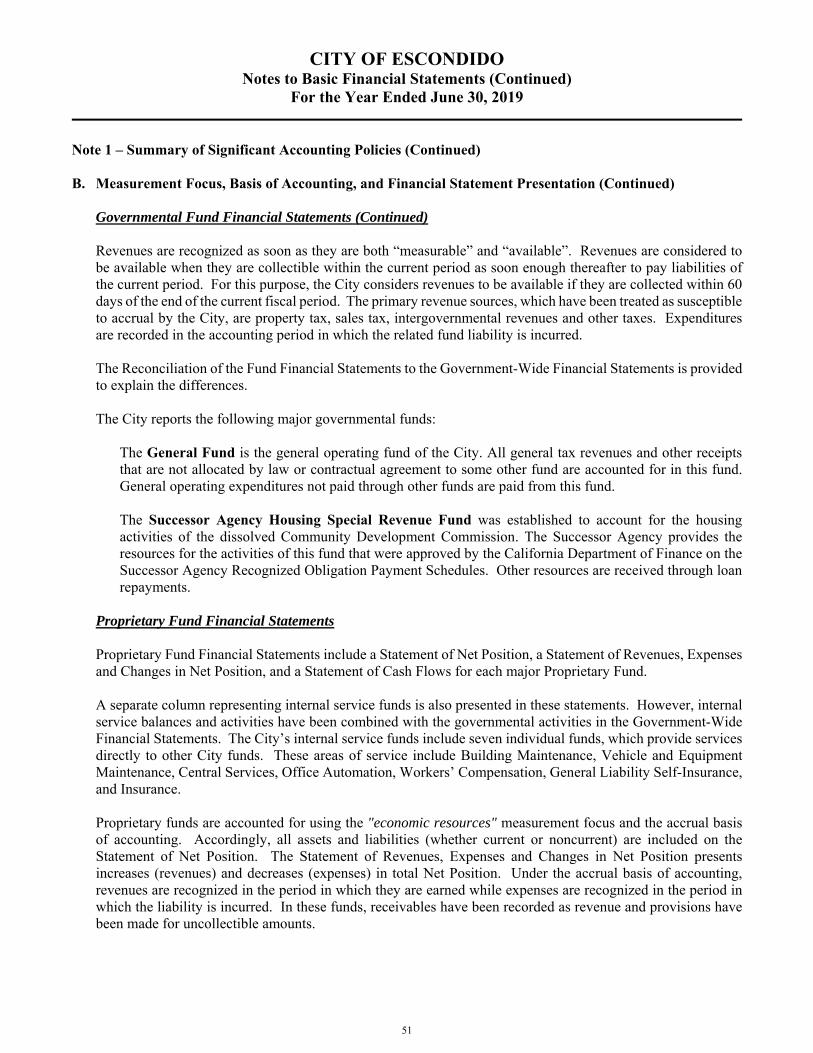
CITY OF ESCONDIDO Notes to Basic Financial Statements (Continued)
For the Year Ended June 30, 2019
Note 1 – Summary of Significant Accounting Policies (Continued)
B. Measurement Focus, Basis of Accounting, and Financial Statement Presentation (Continued)
Governmental Fund Financial Statements (Continued) Revenues are recognized as soon as they are both “measurable” and “available”. Revenues are considered to be available when they are collectible within the current period as soon enough thereafter to pay liabilities of the current period. For this purpose, the City considers revenues to be available if they are collected within 60 days of the end of the current fiscal period. The primary revenue sources, which have been treated as susceptible to accrual by the City, are property tax, sales tax, intergovernmental revenues and other taxes. Expenditures are recorded in the accounting period in which the related fund liability is incurred. The Reconciliation of the Fund Financial Statements to the Government-Wide Financial Statements is provided to explain the differences. The City reports the following major governmental funds:
The General Fund is the general operating fund of the City. All general tax revenues and other receipts that are not allocated by law or contractual agreement to some other fund are accounted for in this fund. General operating expenditures not paid through other funds are paid from this fund. The Successor Agency Housing Special Revenue Fund was established to account for the housing activities of the dissolved Community Development Commission. The Successor Agency provides the resources for the activities of this fund that were approved by the California Department of Finance on the Successor Agency Recognized Obligation Payment Schedules. Other resources are received through loan repayments.
Proprietary Fund Financial Statements Proprietary Fund Financial Statements include a Statement of Net Position, a Statement of Revenues, Expenses and Changes in Net Position, and a Statement of Cash Flows for each major Proprietary Fund. A separate column representing internal service funds is also presented in these statements. However, internal service balances and activities have been combined with the governmental activities in the Government-Wide Financial Statements. The City’s internal service funds include seven individual funds, which provide services directly to other City funds. These areas of service include Building Maintenance, Vehicle and Equipment Maintenance, Central Services, Office Automation, Workers’ Compensation, General Liability Self-Insurance, and Insurance. Proprietary funds are accounted for using the "economic resources" measurement focus and the accrual basis of accounting. Accordingly, all assets and liabilities (whether current or noncurrent) are included on the Statement of Net Position. The Statement of Revenues, Expenses and Changes in Net Position presents increases (revenues) and decreases (expenses) in total Net Position. Under the accrual basis of accounting, revenues are recognized in the period in which they are earned while expenses are recognized in the period in which the liability is incurred. In these funds, receivables have been recorded as revenue and provisions have been made for uncollectible amounts.
51

CITY OF ESCONDIDO Notes to Basic Financial Statements (Continued)
For the Year Ended June 30, 2019
Note 1 – Summary of Significant Accounting Policies (Continued)
B. Measurement Focus, Basis of Accounting, and Financial Statement Presentation (Continued)
Proprietary Fund Financial Statements (Continued) Operating revenues in the proprietary funds are those revenues that are generated from the primary operations of the fund. All other revenues are reported as nonoperating revenues. Operating expenses are those expenses that are essential to the primary operations of the fund. All other expenses are reported as nonoperating expenses. The City reports the following major proprietary funds:
The Water Enterprise Fund is used to account for the financial activity of the City's water utility. The costs of providing these services to the general public are financed or recovered primarily through user charges. The Wastewater Enterprise Fund is used to account for the financial activity of the City's sewer utility. The costs of providing these services to the general public are financed or recovered primarily through user charges.
Fiduciary Fund Financial Statements Fiduciary fund financial statements include a Statement of Net Position and a Statement of Changes in Fiduciary Net Position. The City’s fiduciary funds represent agency funds and private purpose trust funds. Both agency funds and the private purpose trust funds are accounted for on the full accrual basis of accounting. Fiduciary fund types are accounted for according to the nature of the fund.
The City’s Agency funds (Hidden Trails Community Facilities District, Eureka Ranch Community Facilities District, Auto Parkway Assessment District, Rancho San Pasqual, and Deposit Trust) are used to account for money and property held by the City as trustee or custodian. These funds include refundable deposits and also account for the collection of special assessments levied on various assessment districts for the payment of debt service on no commitment debt. These funds are purely custodial in nature (assets equal liabilities) and thus do not involve measurement of results of operations. The City elected to serve as the successor agency for its former redevelopment agency, which was dissolved by state law. The successor agency activity is accounted for in a private purpose trust fund used by the City to account for assets, liabilities and activities of the Successor Agency to the former Commission and is allocated revenue to pay estimated installment payments of enforceable obligations until obligations of the former Commission are paid in full and assets have been liquidated.
C. Cash, Cash Equivalents and Investments
The City pools its available cash for investment purposes. The City considers pooled cash and investment amounts, with original maturities of three months or less, to be cash equivalents.
52

CITY OF ESCONDIDO Notes to Basic Financial Statements (Continued)
For the Year Ended June 30, 2019
Note 1 – Summary of Significant Accounting Policies (Continued)
C. Cash, Cash Equivalents and Investments (Continued)
Highly liquid market investments with maturities of one year or less at time of purchase are stated at amortized cost. All other investments are stated at fair value. Market value is used as fair value for those securities for which market quotations are readily available. The statement of cash flows requires presentation of “cash and cash equivalents”. For the purposes of the statement of cash flows, the City considers all proprietary fund pooled cash and investments as “cash and cash equivalents”, as such, funds are available to the various funds as needed. Certain disclosure requirements, if applicable, for Deposits and Investment Risks in the following areas:
Interest Rate Risk Credit Risk
- Overall - Custodial Credit Risk - Concentration of Credit Risk
Foreign Currency Risk
In addition, other disclosures are specified including use of certain methods to present deposits and investments, highly sensitive investments, credit quality at year-end and other disclosures. U. S. GAAP defines fair value, establishes a framework for measuring fair value and establishes disclosures about fair value measurement. Investments, unless otherwise specified, recorded at fair value in the Statements of Net Position or Balance Sheet, are categorized based upon the level of judgment associated with the inputs used to measure their fair value. Levels of inputs are as follows:
Level 1 – Inputs are unadjusted, quoted prices for identical assets or liabilities in active markets at the measurement date. Level 2 – Inputs, other than quoted prices included in Level 1, which are observable for the assets or liabilities through corroboration with market data at the measurement date. Level 3 – Unobservable inputs that reflect management’s best estimate of what market participants would use in pricing the assets or liabilities at the measurement date.
D. Cash and Investments with Fiscal Agents
The City has monies held by trustees or fiscal agents pledged to the payment or security of certain bonds. The California Government Code provides that these monies, in the absence of specific statutory provisions governing the issuance of bonds, may be invested in accordance with the ordinance, resolutions or indentures specifying the types of investments its trustees or fiscal agents may make. These ordinances, resolutions, and indentures are generally more restrictive than the City's investment policy.
53

CITY OF ESCONDIDO Notes to Basic Financial Statements (Continued)
For the Year Ended June 30, 2019
Note 1 – Summary of Significant Accounting Policies (Continued) E. Interfund Transactions
Activities between funds that are representative of lending/borrowing arrangements outstanding at the end of the fiscal year are referred to as either "due to/from other funds" (i.e., the current portion of interfund loans) or "advances to/from other funds" (i.e., the non-current portion of interfund loans). All other outstanding balances between funds are reported as "due to/from other funds." Any residual balances outstanding between the governmental activities and business-type activities are reported in the government-wide financial statements as "internal balances." Advances between funds, as reported in the fund financial statements, are offset by a nonspendable fund balance account in applicable governmental funds to indicate that they are not available for appropriation and are not expendable available financial resources.
F. Due From Other Governments The amounts recorded as a receivable due from other governments include amounts collected or provided by Federal, State and County governments and not remitted to the City at year end.
G. Property Taxes Property taxes attach as an enforceable lien on property as of January 1. Taxes are levied on July 1 and are payable in two installments on December 10 and April 10. The County of San Diego (County) bills and collects the property taxes and remits them to the City in installments during the year. City property tax revenues are recognized when levied to the extent that they result in current receivables.
The County is permitted by State Law (Proposition 13) to levy taxes at 1% of full market value (at time of purchase) and can increase the property tax value base no more than 2% per year. The City receives a share of this basic levy proportionate to what it received in the 1976 to 1978 period.
H. Inventories Inventories within the various fund types consist of fuel, supplies and equipment valued at cost, which approximates market, on the first-in, first-out basis. The costs of governmental fund type inventories are recorded as expenditures when consumed rather than when purchased.
I. Land Held for Resale Land held for resale is valued at lower of cost or net realizable value. The reported amount is classified as restricted net position in the low and moderate income housing fund and the County Transportation Street Projects Fund since the proceeds from the sale of the land held for resale will be restricted for a specific purpose. The land held for resale primarily consists of lots in two mobile home parks that the City owns and is holding until sold. It is anticipated that these lots could take several years to sell.
54

CITY OF ESCONDIDO Notes to Basic Financial Statements (Continued)
For the Year Ended June 30, 2019
Note 1 – Summary of Significant Accounting Policies (Continued)
J. Capital Assets
Capital assets, which include property, plant, equipment and infrastructure assets, are reported in the applicable governmental or business-type activities columns in the government-wide financial statements. Such assets are recorded at historical cost or estimated historical cost if purchased or constructed. Donated assets are valued at the fair value of the assets on the date on which they were contributed. Donated works of art and similar items, and capital assets received in a service concession arrangement are reported at acquisition value rather than fair value. The costs of normal maintenance and repairs that do not add to the value of the asset or materially extend assets lives are not capitalized. The City utilizes a capitalization threshold of $5,000 - $10,000 depending on asset type. Depreciation is charged to operations using the straight-line method over the estimated useful lives of the assets as follows:
Land improvements 5-40 years Buildings 30-40 years Machinery and equipment 5-30 years Motorized vehicles 5-15 years Infrastructure 30-50 years Golf course 30 years Water system 40 years Electrical system 40 years Sewer system 40 years Recycled water system 40 years
For all infrastructure systems, the City elected to use the Basic Approach as defined by GASB Statement No. 34 for infrastructure reporting. The City defines infrastructure as the basic physical assets that allow the City to function. The assets include the streets, water purification and distribution system, sewer collection and treatment system, parks and recreation, lands and improvement system, storm water conveyance system, and buildings combined with the site amenities such as parking and landscaped areas used by the City in the conduct of its business. Each major infrastructure system can be divided into subsystems. For example, the street system can be subdivided into pavement, curb and gutters, sidewalks, medians, streetlights, traffic control devices (signs, signals and pavement markings), landscaping and land. These subsystems were not delineated in the basic financial statements. The appropriate operating department maintains information regarding the subsystems. Interest accrued during capital assets construction, if any, is capitalized for the business-type and proprietary funds as part of the asset cost.
K. Compensated Absences – Employee Leave Benefits Depending upon length of employment, City employees earn 12 to 27 vacation days a year. Sick leave is accrued at the rate of 12 days per year except for Fire Safety which earns six twenty-four hour shifts. Employees can carry forward to subsequent two to three years’ worth of earned but unused vacation leave benefits depending on employee group. Upon termination, the City is obligated to compensate employees for all earned but unused vacation days. The earned but unused sick leave benefits are not payable in the event of employee termination. These benefits are considered to be contingent liabilities subject to the continuation of the employee relationship. Such sick leave benefits are therefore not recorded as liabilities in the accompanying basic financial statements.
55

CITY OF ESCONDIDO Notes to Basic Financial Statements (Continued)
For the Year Ended June 30, 2019
Note 1 – Summary of Significant Accounting Policies (Continued)
K. Compensated Absences – Employee Leave Benefits (Continued)
In government-wide financial statements and the proprietary fund financial statements, compensated absences are recorded as expenses and liabilities as incurred. In governmental fund financial statements, compensated absences are recorded as expenditures in the years paid, as it is the City’s policy to liquidate any unpaid vacation or sick leave at year-end from future resources rather than currently available and expendable resources. The General Fund is typically used to liquidate compensated absences. The California Center for the Arts, Escondido Foundation (Foundation) provides Paid Time Off (PTO) benefits to all full-time employees. The accrual begins immediately upon hire and is determined based on length of employment, employees earn approximately 10-25 days of PTO. The Foundation allows employees to carry over all accrued available PTO to the following calendar year, and upon termination, is mandated to compensate employees for all earned but unused vacation days. Part time employees accrue one hour of sick time for every 30 hours worked. The Foundation allows employees to carry over all accrued paid sick days to the following calendar year of employment. Paid sick accrues until it reaches a maximum cap of 48 hours. Upon termination, employees are not compensated for unused paid sick time.
L. Long-Term Debt Government-Wide Financial Statements and Proprietary Fund Financial Statements Long-term debt and other financial obligations are reported as liabilities in the appropriate funds. Bond premiums and discounts are deferred and amortized over the life of the bonds using straight line method. Bonds payable are reported net of the applicable premium or discount. Issuance costs are expensed when incurred. Gains or losses on bond refunding are reported as either deferred outflows of resources or deferred inflows of resources and amortized over the term of the related debt. Governmental Fund Financial Statements The governmental fund financial statements do not present long-term debt but are shown in the Reconciliation of the Governmental Funds Balance Sheet to the Government-Wide Statement of Net Position. Governmental fund types recognize bond premiums and discounts during the current period. The face amount of debt issued is reported as other financing sources. Premiums received on debt issuances are reported as other financing sources while discounts on debt issuances are reported as other financing uses. Debt issuance costs, whether or not withheld from the actual debt proceeds received, are reported as debt service expenditures.
M. Claims and Judgments
The City records a liability for litigation, judgments and claims when it is probable that an asset has been impaired or a liability has been incurred prior to year-end and the probable amount of loss (net of any insurance coverage) can be reasonably estimated. This liability is recorded in the internal service funds, which account for the City's self-insurance activities.
56

CITY OF ESCONDIDO Notes to Basic Financial Statements (Continued)
For the Year Ended June 30, 2019
Note 1 – Summary of Significant Accounting Policies (Continued)
N. Unearned Revenues
Unearned revenue recorded in the Government-Wide Statement of Net Position for governmental activities and the governmental fund financial statements consist of federal and state capital grants, representing voluntary nonexchange transactions, for which advance payments have been received from the provider for which eligibility requirements, other than timing requirements, have not been satisfied. Unearned revenue recorded in the Government-Wide Statement of Net Position for business-type activities and the proprietary fund financial statements generally consist of program fees collected from customers prior to the statement of net position date for recreation programs that begin in the next fiscal year or donations for capital or work projects, for which the related expenses have not yet been incurred.
O. Pensions For purposes of measuring the net pension liability, deferred outflows of resources and deferred inflows of resources related to pensions, and pension expense, information about the fiduciary net position of the plans and additions to/deductions from the plans’ fiduciary net position have been determined on the same basis as they are reported by the plans (Note 13). For this purpose, benefit payments (including refunds of employee contributions) are recognized when due and payable in accordance with benefit terms. Investments are reported at fair value. The following timeframes are used for pension reporting:
CalPERS: Valuation Date June 30, 2017 Measurement Date June 30, 2018 Measurement Period July 1, 2017 to June 30, 2018
Gains and losses related to changes in total pension liability and fiduciary net position are recognized in pension expense systematically over time. The first amortized amounts are recognized in pension expense for the year the gain or loss occurs. The remaining amounts are categorized as deferred outflows and deferred inflows of resources related to pensions and are to be recognized in future pension expense. The amortization period differs depending on the source of the gain or loss. The difference between projected and actual earnings is amortized straight-line over 5 years. All other amounts are amortized straight-line over the average expected remaining service lives of all members that are provided with benefits (active, inactive, and retired) as of the beginning of the measurement period.
P. Net Position In governmental-wide and proprietary fund financial statements, net position is categorized as follows:
Net Investment in Capital Assets – This component of net position consists of capital assets, net of accumulated depreciation, reduced by the outstanding balances of debt that are attributable to the acquisition, construction, or improvement of those assets.
Restricted – This component of net position consists of restricted assets reduced by liabilities and deferred inflows of resources related to those assets.
57

CITY OF ESCONDIDO Notes to Basic Financial Statements (Continued)
For the Year Ended June 30, 2019
Note 1 – Summary of Significant Accounting Policies (Continued) P. Net Position (Continued)
Unrestricted – This component of net position is the amount of the assets, deferred outflows of resources, liabilities, and deferred inflows of resources that are not included in the determination of net investment in capital assets or the restricted component of net position.
Q. Fund Balance
In governmental fund financial statements, fund balances are categorized as follows:
Nonspendable – Items that cannot be spent because they are not in spendable form, such as prepaid items and inventories, items that are legally or contractually required to be maintained intact, such as principal of an endowment or revolving loan funds. Restricted – Restricted fund balances encompass the portion of net fund resources subject to externally enforceable legal restrictions. This includes externally imposed restrictions by creditors, such as through debt covenants, grantors, contributors, laws or regulations of other governments, as well as restrictions imposed by law through constitutional provisions or enabling legislation. Committed – Committed fund balances encompass the portion of net fund resources, the use of which is constrained by limitations that the government imposes upon itself at its highest level of decision making, normally the governing body and that remain binding unless removed in the same manner. Adoption of a resolution by the City Council is required to commit resources or rescind the commitment. The action that constitutes the most binding constraint (i.e. ordinance) of the City’s highest level of decision-making authority, City Council, commits fund balance for specific purposes. Commitments may be changed or lifted only by the City taking the same formal action that imposed the constraint originally. Assigned – Assigned fund balances encompass the portion of net fund resources reflecting the government’s intended use of resources. Assignment of resources can be done by the highest level of decision making or by a committee or official designated for that purpose. The Administrative Services Director is authorized to assign amounts to a specific purpose, which was established by the governing body by resolution. Unassigned – This amount is for any portion of the fund balances that do not fall into one of the above categories. The General Fund is the only fund that reports a positive unassigned fund balance amount. In other governmental funds, it is not appropriate to report a positive unassigned fund balance amount. However, in governmental funds other than General Fund, if expenditures incurred for specific purposes exceed the amounts that are restricted, committed, or assigned to those purposes, it may be necessary to report a negative unassigned fund balance in that fund.
Included in the General Fund’s committed fund balance, the City Council has approved a reserve stabilization arrangement to be used to fund one-time unanticipated expenditure requirements, local disasters, or when actual revenue received is less than the amount budgeted resulting in an operating deficit in the General Fund. City Council action is required to add or spend the funds and, if used, the method for replenishing deficiencies including the source of funding and time period of replenishment to occur will be defined in the resolution. At June 30, 2019, the balance totaled $17,921,319.
58

CITY OF ESCONDIDO Notes to Basic Financial Statements (Continued)
For the Year Ended June 30, 2019
Note 1 – Summary of Significant Accounting Policies (Continued)
R. Spending Policy
Government-Wide Financial Statements and the Proprietary Fund Financial Statements When an expense is incurred for purposes for which both restricted and unrestricted Net Position are available, the City’s policy is to apply restricted Net Position first. Governmental Fund Financial Statements When expenditures are incurred for purposes where only unrestricted fund balances are available, the City uses the unrestricted resources in the following order: committed, assigned, and unassigned.
S. Implementation of New GASB Pronouncements During the fiscal year ended June 30, 2019, the City implemented the following Governmental Accounting Standards Board (GASB) standards:
GASB Statement No. 83 – In November 2016, GASB issued Statement No. 83, Certain Asset Retirement Obligations. This Statement establishes criteria for determining the timing and pattern of recognition of a liability and a corresponding deferred outflow of resources for asset retirement obligations (ARO). This Statement requires that recognition occur when the liability is both incurred and reasonably estimable. The determination of when the liability is incurred should be based on the occurrence of external laws, regulations, contracts, or court judgments, together with the occurrence of an internal event that obligates a government to perform asset retirement activities. Laws and regulations may require governments to take specific actions to retire certain tangible capital assets at the end of the useful lives of those capital assets, such as decommissioning nuclear reactors and dismantling and removing sewage treatment plants. Other obligations to retire tangible capital assets may arise from contracts or court judgments. Internal obligating events include the occurrence of contamination, placing into operation a tangible capital asset that is required to be retired, abandoning a tangible capital asset before it is placed into operation, or acquiring a tangible capital asset that has an existing ARO. Application of this statement did not have a significant effect on the City’s financial statements. GASB Statement No. 88 – In April 2018, GASB issued Statement No. 88, Certain Disclosures Related to Debt, including Direct Borrowings and Direct Placements. The primary objective of this statement is to improve the information that is disclosed in notes to government financial statements related to debt, including direct borrowings and direct placements. It also clarifies which liabilities governments should include when disclosing information related to debt. This pronouncement did not have a significant effect on the City’s financial statements, except for additional disclosures relating to debt as discussed in Note 8 of the City’s financial statements for the year ended June 30, 2019.
59

CITY OF ESCONDIDO Notes to Basic Financial Statements (Continued)
For the Year Ended June 30, 2019
Note 2 – Stewardship, Compliance and Accountability
A. Excess of Expenditures Over Appropriations There was no excess of expenditures over appropriations for the year ended June 30, 2019.
B. Deficit Fund Equity The following funds reported a deficit fund balance/net position as of June 30, 2019:
At June 30, 2019, the City had an unrestricted net position deficit of $(124,447,522) on the Government-wide Statement of Net Position that was increased due to the recording of the Net Pension Liability. The City expects to eliminate the deficit via pension contributions as required by the City’s pension administrator (CalPERS). The ($50,146) deficit in the Law Enforcement fund is the result of unreimbursed funds and will be eliminated with future grant reimbursements. Internal service fund deficits for the Building Maintenance, Network and Systems Administration, and Workers Compensation funds are due to the impact from recording the Net Pension Liability items. The deficits are expected to be funded by future internal service charges to other City funds.
Note 3 – Cash and Investments
Cash and investments as of June 30, 2019, are classified in the accompanying financial statements as follows:
Fund Fund Type Amount
Unrestricted Net Position Governmental Activities (124,447,522)
Law Enforcement Special Revenue Fund (50,146)
Building Maintenance Internal Service Fund (1,254,273)
Network and Systems Administration Internal Service Fund (1,530,470)
Workers' Compensation Internal Service Fund (5,106,725)
Governmental Business-type Component FiduciaryActivities Activities Unit Funds Total
Cash and investments 85,515,711$ 65,632,911$ 1,994,769$ 16,745,938$ 169,889,329$ Investment in Section 115 Trust 7,013,035 - - - 7,013,035 Cash and investments with fiscal agent 15 1,095,891 - 348,780 1,444,686
Total 92,528,761$ 66,728,802$ 1,994,769$ 17,094,718$ 178,347,050$
60

CITY OF ESCONDIDO Notes to Basic Financial Statements (Continued)
For the Year Ended June 30, 2019
Note 3 – Cash and Investments (Continued) At June 30, 2019, cash and investments, including cash and investments with fiscal agent, are reported at fair value. The following table presents the fair value measurements of the investments recognized in the accompanying statement of net position and balance sheet measured at fair value on a recurring basis and the levels within GASB 72 fair value hierarchy in which fair value measurement fall at June 30, 2019:
A. Demand Deposits The carrying amount of the City’s cash deposits were $5,282,845 at June 30, 2019. Bank balances before reconciling items were $7,286,747 at that date, the total amount of which was insured or collateralized with securities held by the pledging financial institutions in the City’s name as discussed below. The California Government Code requires California banks and savings and loan associations to secure the City’s cash deposits by pledging securities as collateral. This Code states that collateral pledged in this manner shall have the effect of perfecting a security interest in such collateral superior to those of a general creditor. Thus, collateral for cash deposits is considered to be held in the City's name. The market value of pledged securities must equal at least 110% of the City's cash deposits. California law also allows institutions to secure City deposits by pledging first trust deed mortgage notes having a value of 150% of the City’s total cash deposits. The City may waive collateral requirements for cash deposits, which are fully insured up to $250,000 by the Federal Deposit Insurance Corporation. The City, however, has not waived the collateralization requirements. The City follows the practice of pooling cash and investments of all funds, except for funds required to be held by fiscal agents under the provisions of bond indentures. Interest income earned on pooled cash and investments is allocated on an accounting period basis to the various funds based on the period-end cash and investment balances. Interest income from cash and investments with fiscal agents is credited directly to the related fund.
FairValue Level 1 Level 2 Level 3 Uncategorized
Cash on hand 12,300$ -$ -$ -$ 12,300$ Demand deposits 5,282,845 - - - 5,282,845 Investments:
U. S. Treasury Obligations 13,597,084 - 13,597,084 - - U. S. Corporate Bonds 21,476,283 - 21,476,283 - - U. S. Municipal Bonds 7,780,897 - 7,780,897 - - Federal Agency Securities 43,128,527 - 43,128,527 - - Negotiable Certificates of Deposit 5,923,400 - - - 5,923,400 Placement Service Deposits 15,028,396 - - - 15,028,396 State Investment Pool (LAIF) 57,659,595 - - - 57,659,595
Subtotal 164,594,182 - 85,982,791 - 78,611,391 Held by fiscal agent:
U.S. Treasury Obligations 366,040 - 366,040 - - Money Market Funds 774,645 - 774,645 - - State Investment Pool (LAIF) 304,000 - - - 304,000
Subtotal 1,444,685 - 1,140,685 - 304,000
Investment in Section 115 Trust 7,013,038 - - - 7,013,038
Total 178,347,050$ -$ 87,123,476$ -$ 91,223,574$
Measurement Input
61

CITY OF ESCONDIDO Notes to Basic Financial Statements (Continued)
For the Year Ended June 30, 2019
Note 3 – Cash and Investments (Continued) B. Investments
Investments Authorized by the California Government Code and the City's Investment Policy The table below identifies the investment types that are authorized for the City by the California Government Code and the City's investment policy. The table also identifies certain provisions of the California Government Code (or the City's investment policy, if more restrictive) that address interest rate risk and concentration of credit risk. This table does not address investments of debt proceeds held by bond trustee (i.e. fiscal agent) that are governed by the provisions of debt agreements of the City rather than the general provisions of the California Government Code or the City's investment policy. The City Treasurer may waive the collateral requirement for deposits that are fully insured up to $250,000 by the FDIC.
Investment types Authorized by State Law
Authorized by Investment
Policy *Maximum Maturity
*Maximum Percentage of
Portfolio
*Maximum Investment in
One Issuer
Local Agency Bonds No 5 years None NoneU.S. Treasury Obligations Yes 5 years None NoneU.S. Agency Securities Yes 5 years None 30%Municipal Securities Yes 5 years 40% 5%Banker's Acceptance Yes 180 days 30% 5%Commercial Paper Yes 270 days 25% 5%Negotiable Certificates of Deposit Yes 5 years 30% 5%Placement Service Deposits Yes 5 years 30% 30%Repurchase Agreements Yes 1 year None NoneReverse Repurchase Agreements No 92 days 20% of base value NoneMedium-Term Notes Yes 5 years 30% 5%Mutual Funds No N/A 20% 10%Money Market Funds Yes N/A 20% 20%Mortgage Pass-Through/Asset Backed Securities Yes 5 years 20% 5%Local Government Investment Pools Yes N/A None NoneLocal Agency Investment Fund (LAIF) Yes N/A $65 million NoneSupranational Obligations Yes 5 years 30% 30%
*Based on state law requirements or investment policy requirements, whichever is more restrictive.
62

CITY OF ESCONDIDO Notes to Basic Financial Statements (Continued)
For the Year Ended June 30, 2019
Note 3 – Cash and Investments (Continued)
B. Investments (Continued)
Investments Authorized by Debt Agreements Investment of debt proceeds held by bond trustee (i.e. fiscal agent) are governed by provisions of the debt agreements, rather than the general provisions of the California Government Code or the City's investment policy. The table below identifies the investment types that are generally authorized for investments held by bond trustee. The table also identifies certain provisions of these debt agreements that address interest rate risk and concentration of credit risk.
C. Investments in Local Agency Investment Fund The City is a participant in LAIF which is regulated by California Government Code Section 16429 under the oversight of the Treasurer of the State of California. The City’s investments in LAIF included a portion of pool funds invested in Structure Notes and Asset-Backed Securities:
Structured Notes are debt securities (other than asset-backed securities) whose cash-flow characteristics (coupon rate, redemption amount, or stated maturity) depend upon one or more indices and/or that have embedded forwards or options. Asset-Backed Securities, the bulk of which are mortgage-backed securities, entitle their purchasers to receive a share of the cash flows from pool of assets such as principal and interest repayments from a pool of mortgages (such as Collateralized Mortgage Obligations) or credit card receivables.
As of June 30, 2019, the City had $57,963,595 invested in LAIF, which had invested 1.77% of the pool investment funds in Structured Notes and Asset-Back Securities. LAIF determines fair value on its investment portfolio based on market quotations for those securities where market quotations are readily available and based on amortized cost or best estimate for those securities where market value is not readily available. The credit quality rating of LAIF is unrated as of June 30, 2019. The balance available for withdrawal is based on the accounting records maintained by LAIF, which are recorded on an amortized cost basis.
Authorized Investment Type Maximum Maturity
Maximum Percentage
Allowed
*Maximum Investment in
One Issuer
U.S. Treasury Obligations None None NoneU.S. Agency Securities 365 days None NoneBanker's Acceptance 360 days None NoneCommercial Paper 270 days None NoneMoney Market Mutual Funds N/A None NoneRepurchase Agreements None None NoneInvestment Contracts 30 years None NoneState or Municipal Obligations None None NoneState Pooled Investment Fund None None None
63
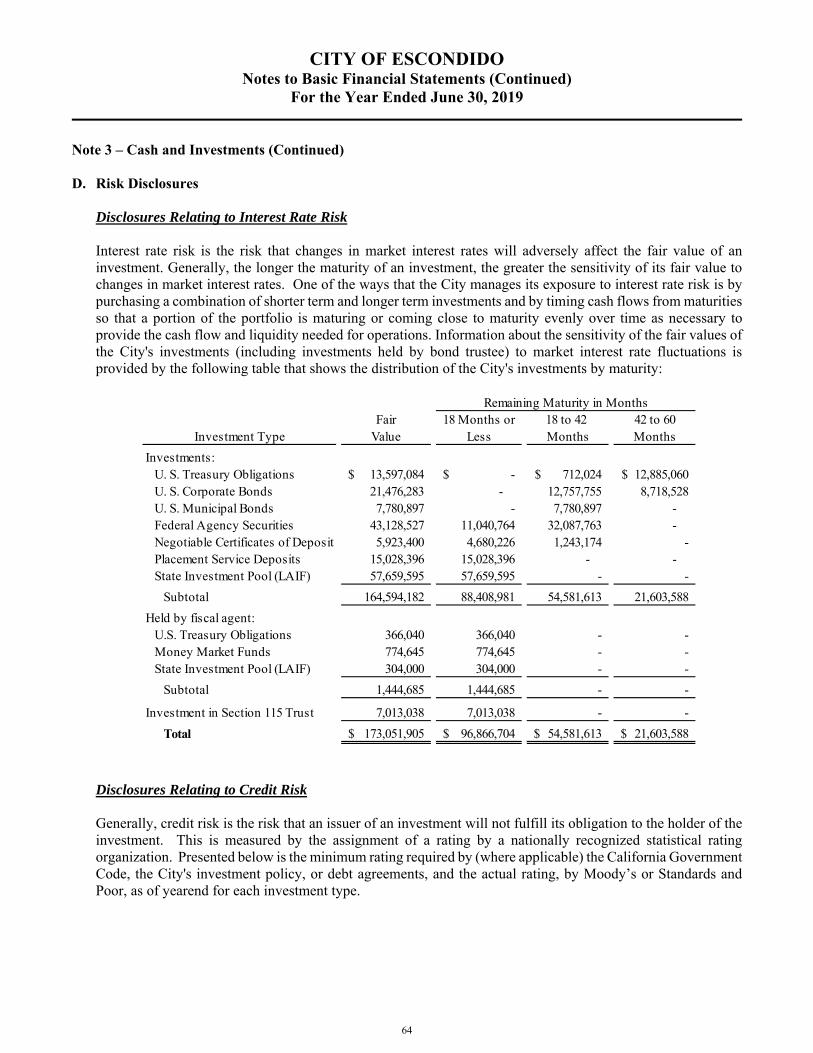
CITY OF ESCONDIDO Notes to Basic Financial Statements (Continued)
For the Year Ended June 30, 2019
Note 3 – Cash and Investments (Continued) D. Risk Disclosures
Disclosures Relating to Interest Rate Risk Interest rate risk is the risk that changes in market interest rates will adversely affect the fair value of an investment. Generally, the longer the maturity of an investment, the greater the sensitivity of its fair value to changes in market interest rates. One of the ways that the City manages its exposure to interest rate risk is by purchasing a combination of shorter term and longer term investments and by timing cash flows from maturities so that a portion of the portfolio is maturing or coming close to maturity evenly over time as necessary to provide the cash flow and liquidity needed for operations. Information about the sensitivity of the fair values of the City's investments (including investments held by bond trustee) to market interest rate fluctuations is provided by the following table that shows the distribution of the City's investments by maturity:
Disclosures Relating to Credit Risk Generally, credit risk is the risk that an issuer of an investment will not fulfill its obligation to the holder of the investment. This is measured by the assignment of a rating by a nationally recognized statistical rating organization. Presented below is the minimum rating required by (where applicable) the California Government Code, the City's investment policy, or debt agreements, and the actual rating, by Moody’s or Standards and Poor, as of yearend for each investment type.
Fair 18 Months or 18 to 42 42 to 60Investment Type Value Less Months Months
Investments:U. S. Treasury Obligations 13,597,084$ -$ 712,024$ 12,885,060$ U. S. Corporate Bonds 21,476,283 - 12,757,755 8,718,528 U. S. Municipal Bonds 7,780,897 - 7,780,897 - Federal Agency Securities 43,128,527 11,040,764 32,087,763 - Negotiable Certificates of Deposit 5,923,400 4,680,226 1,243,174 - Placement Service Deposits 15,028,396 15,028,396 - - State Investment Pool (LAIF) 57,659,595 57,659,595 - -
Subtotal 164,594,182 88,408,981 54,581,613 21,603,588
Held by fiscal agent:U.S. Treasury Obligations 366,040 366,040 - - Money Market Funds 774,645 774,645 - - State Investment Pool (LAIF) 304,000 304,000 - -
Subtotal 1,444,685 1,444,685 - -
Investment in Section 115 Trust 7,013,038 7,013,038 - -
Total 173,051,905$ 96,866,704$ 54,581,613$ 21,603,588$
Remaining Maturity in Months
64

CITY OF ESCONDIDO Notes to Basic Financial Statements (Continued)
For the Year Ended June 30, 2019
Note 3 – Cash and Investments (Continued) D. Risk Disclosures
Disclosures Relating to Credit Risk (Continued)
Disclosures Relating to Concentration of Credit Risk Investments in any one issuer (other than U.S. Treasury securities, mutual funds, and external investment pools) that represent 5% or more of total City investments are as follows:
Disclosures Relating to Custodial Credit Risk Custodial credit risk for deposits is the risk that, in the event of the failure of a depository financial institution, a government will not be able to recover its deposits or will not be able to recover collateral securities that are in the possession of an outside party. The custodial credit risk for investments is the risk that, in the event of the failure of the counterparty (e.g., broker-dealer) to a transaction, a government will not be able to recover the value of its investment or collateral securities that are in the possession of another party. The California Government Code and the City's investment policy do not contain legal or policy requirements that would limit the exposure to custodial credit risk for deposits or investments, other than the following provision for deposits. For investments identified herein as held by bond trustee, the bond trustee provides the City with investment options that are authorized under the terms of the applicable trust agreement, acquires the investment as directed, and holds the investment on behalf of the reporting government.
MinimumFair Legal Exempt from
Investment Type Value Rating Disclosures Not Rated
Investments:U. S. Treasury Obligations 13,597,084$ N/A -$ 13,597,084$ -$ -$ -$ -$ U. S. Corporate Bonds 21,476,283 A - 1,997,040 952,404 5,021,047 11,354,366 2,151,426 U. S. Municipal Bonds 7,780,897 A - - - 5,772,371 2,008,526 - Federal Agency Securities 43,128,527 N/A - 36,271,239 6,857,288 - - - Negotiable Certificates of Deposit 5,923,400 N/A 5,923,400 - - - - - Placement Service Deposits 15,028,396 N/A - - - - - 15,028,396 State Investment Pool (LAIF) 57,659,595 N/A - - - - - 57,659,595
Subtotal 164,594,182 5,923,400 51,865,363 7,809,692 10,793,418 13,362,892 74,839,417
Held by fiscal agent:U.S. Treasury Obligations 366,040 N/A - - - - - 366,040 Money Market Funds 774,645 N/A - - - - - 774,645 State Investment Pool (LAIF) 304,000 N/A - - - - - 304,000
Subtotal 1,444,685 - - - - - 1,444,685
Investment in Section 115 Trust 7,013,038 N/A - - - - - 7,013,038
Total 173,051,905$ 5,923,400$ 51,865,363$ 7,809,692$ 10,793,418$ 13,362,892$ 83,297,140$
Rating as of Year EndAA to AA- / Aa2 to Aa3
A+ to A / A1 to A3AAA/Aaa AA+/Aa1
ReportedIssuer Amount
Federal Home Loan Bank 15,433,555$ Federal Home Loan Mortgage Corp. 10,708,137 Federal Farm Credit Bank 10,698,222 U.S. Treasury 13,597,084
Federal Agency Securities
Investment Type
U.S. Treasury Obligations
Federal Agency SecuritiesFederal Agency Securities
65

CITY OF ESCONDIDO Notes to Basic Financial Statements (Continued)
For the Year Ended June 30, 2019
Note 4 – Allowance for Uncollectible Receivables Governmental and Business-type Activities receivables are shown net of an allowance for uncollectibles, which at June 30, 2019 is as follows:
The governmental activities allowance is recorded in the General Fund for paramedic and general accounts receivable activities. The uncollectible accounts related to accounts receivable at June 30, 2019 are $204,742 for the Water Fund and $124,159 for the Wastewater Fund. Note 5 – Loans Receivable The City and Housing Successor Agency engage in programs designed to encourage construction and improvement in low-to-moderate income housing and other projects. Under these programs, loans are provided under favorable terms to homeowners or developers who agree to spend these funds in accordance with the City’s or Housing Successor Agency’s terms. At June 30, 2019, the loans receivable was reported in the accompanying basic financial statements as follows:
The loans at June 30, 2019, consisted of the following:
Governmental Business-typeActivities Activities Total
Accounts receivable 29,581,228$ 11,746,997$ 41,328,225$ Allowance for doubtful accounts (2,206,366) (328,901) (2,535,267)
Total 27,374,862$ 11,418,096$ 38,792,958$
Governmental Funds 53,801,099$ Proprietary Funds 431,837 Fiduciary Funds 245,424
Total 54,478,360$
City of Escondido:HOME grant fund loans 17,433,799$ National Golf Operations 200,000 CDBG notes receivable 231,659 Public Facilities 224,405 Notes receivable 431,837
Successor Agency Housing Special Revenue Funds:Loans given to developers and non-profits 30,834,229 Mobile home loan program 2,213,076 First-time homebuyer program 2,288,931 HOME loans 375,000
Successor Agency to the Former CDC:First-time homebuyer program 159,395 Mobile home loan program 86,029
Total 54,478,360$
66

CITY OF ESCONDIDO Notes to Basic Financial Statements (Continued)
For the Year Ended June 30, 2019
Note 6 – Capital Assets A. Governmental Activities
Summary of changes in capital assets for the governmental activities for the year ended June 30, 2019, is as follows:
Depreciation expense was charged to the following functions:
Balance Transfers of Contributions BalanceJuly 1, 2018 CIP Between Funds Additions Deletions June 30, 2019
Capital assets, not being depreciated:Art and historical treasures 9,532,194$ -$ -$ -$ -$ 9,532,194$ Land 52,704,126 - - - - 52,704,126 Construction in progress 17,518,945 (12,034,621) (198,809) 7,508,253 - 12,793,768
Total capital assets, not being depreciated 79,755,265 (12,034,621) (198,809) 7,508,253 - 75,030,088
Capital assets, being depreciated:Land improvements 38,779,048 1,245,808 - 21,414 - 40,046,270 Buildings 222,330,637 592,337 - - - 222,922,974 Machinery and equipment 31,948,665 912,484 - 260,613 (1,429,450) 31,692,312 Motorized vehicles 29,329,681 - 106,154 2,338,143 (3,148,555) 28,625,423 Infrastructure 305,218,408 9,283,992 - 2,286,919 - 316,789,319 Golf Course 4,326,835 - - - - 4,326,835 Radio Rights 3,230,225 - - - - 3,230,225
Total capital assets, being depreciated 635,163,499 12,034,621 106,154 4,907,089 (4,578,005) 647,633,358
Less accumulated depreciationLand improvements (37,039,985) - - (498,901) - (37,538,886) Buildings (120,234,982) - - (5,685,376) - (125,920,358) Machinery and equipment (26,270,312) - - (1,746,750) 1,413,194 (26,603,868) Motorized vehicles (23,184,037) - - (2,392,479) 3,135,327 (22,441,189) Infrastructure (210,303,656) - - (4,660,629) - (214,964,285) Golf Course (2,258,933) - - (144,272) - (2,403,205) Radio Rights (323,022) - - (161,511) - (484,533)
Total accumulated depreciation (419,614,927) - - (15,289,918) 4,548,521 (430,356,324)
Total capital assets, being depreciated, net 215,548,572 12,034,621 106,154 (10,382,829) (29,484) 217,277,034
Total Governmental Activities capital assets, net 295,303,837$ -$ (92,655)$ (2,874,576)$ (29,484)$ 292,307,122$
General government 3,675,761$ Public safety 2,856,210 Public works 5,009,515 Community services 781,053 Community development 120,098 Internal service funds 2,847,281
Total 15,289,918$
67

CITY OF ESCONDIDO Notes to Basic Financial Statements (Continued)
For the Year Ended June 30, 2019
Note 6 – Capital Assets (Continued) B. Business-type Activities
Summary of changes in capital assets for the business-type activities for the year ended June 30, 2019, is as follows:
Depreciation expense was charged to the following functions:
Balance Transfers of Contributions BalanceJuly 1, 2018 CIP Between Funds Additions Deletions June 30, 2019
Capital assets, not being depreciated:Land 2,979,397$ 159,000$ -$ -$ -$ 3,138,397$ Construction in progress 65,580,451 (48,425,920) - 13,429,401 - 30,583,932
Total capital assets, not being depreciated 68,559,848 (48,266,920) - 13,429,401 - 33,722,329
Capital assets, being depreciated:Land improvements 1,035,020 - - 57,081 - 1,092,101 Buildings 31,285,254 420,629 - - - 31,705,883 Machinery and equipment 10,839,019 136,107 - 981,963 (237,023) 11,720,066 Motorized vehicles - - (106,154) 106,154 - - Water system 136,620,201 29,035,215 193,436 515,509 - 166,364,361 Electrical system 3,609,179 - - - - 3,609,179 Sewer system 189,064,623 18,674,969 5,373 86,237 - 207,831,202 Recycled water system 24,163,391 - - - - 24,163,391
Total capital assets, being depreciated 396,616,687 48,266,920 92,655 1,746,944 (237,023) 446,486,183
Less accumulated depreciationLand improvements (306,856) - - (29,365) - (336,221) Buildings (20,411,458) - - (474,368) - (20,885,826) Machinery and equipment (8,444,121) - - (926,880) 194,403 (9,176,598) Water system (49,873,899) - - (3,316,626) - (53,190,525) Electrical system (3,285,182) - - (49,270) - (3,334,452) Sewer system (71,945,856) - - (4,596,833) - (76,542,689) Recycled water system (8,612,840) - - (606,883) - (9,219,723)
Total accumulated depreciation (162,880,212) - - (10,000,225) 194,403 (172,686,034)
Total capital assets, being depreciated, net 233,736,475 48,266,920 92,655 (8,253,281) (42,620) 273,800,149
Total Business-type Activities capital assets, net 302,296,323$ -$ 92,655$ 5,176,120$ (42,620)$ 307,522,478$
Water 4,082,758$ Wastewater 5,917,467
Total 10,000,225$
68

CITY OF ESCONDIDO Notes to Basic Financial Statements (Continued)
For the Year Ended June 30, 2019
Note 6 – Capital Assets (Continued) C. Component Unit
Summary of changes in capital assets for the component unit for the year ended June 30, 2019, is as follows:
Depreciation expense for the year ended June 30, 2019 was $48,506.
Note 7 – Interfund Transactions A. Due To and From Other Funds
At June 30, 2019, due from and to other funds balances are as follows:
(1) The Former Community Development Commission had received monies from the General Fund for use in its operations and capital improvement projects. For more information, see Note 8C.
(2) The Former Community Development Commission had received monies from the Street Special Revenue Fund for use in its capital improvement projects. For more information, see Note 8C.
Balance BalanceJuly 1, 2018 Additions Deletions June 30, 2019
Capital assets, being depreciated:Leasehold improvements 119,645$ 49,300$ -$ 168,945$ Machinery and equipment 698,579 271,082 - 969,661
Total capital assets, being depreciated 818,224 320,382 - 1,138,606
Less accumulated depreciationLeasehold improvements (15,709) (1,570) - (17,279) Machinery and equipment (656,180) (46,936) (703,116)
Total accumulated depreciation (671,889) (48,506) - (720,395)
Total capital assets, being depreciated, net 146,335 271,876 - 418,211
Total Component Unit capital assets, net 146,335$ 271,876$ -$ 418,211$
Due From Other Funds Due To Other Funds Amounts
Successor Agency of the Former CDC - General Fund Private Purpose Trust Fund 13,487,986 (1)
Streets Special Revenue Fund - Successor Agency of the Former CDC - Nonmajor Governmental Funds Private Purpose Trust Fund 953,953 (2)
69

CITY OF ESCONDIDO Notes to Basic Financial Statements (Continued)
For the Year Ended June 30, 2019
Note 7 – Interfund Transactions (Continued) B. Advances To and From Other Funds
At June 30, 2019, advances to and from other fund balances are as follows:
The advances were used for the following: (1) The General Fund entered into an agreement with the Street Improvement Capital Projects fund in the
amount of $200,000 for improvements to the Vineyard Golf Course. (2) The General Fund entered into an agreement with the Public Facilities Capital Project Fund for an advance
to reconstruct Fire Station #4. At June 30, 2019, the amount of $45,000 remained outstanding. C. Transfers In and Out
For the year ended June 30, 2019, interfund transfers are as follows:
Transfers are used to: (1) move revenues from the fund that statute or budget requires to collect them to the fund that statute or budget requires to expend them, (2) move receipts restricted to debt service from the funds collecting the receipts to the debt service fund as debt service payments become due, and (3) use unrestricted revenues collected in the general fund to finance various programs accounted for in other funds in accordance with budgetary authorizations.
Advances To Other Funds Advances From Other Funds Amounts
Street Improvement Capital Projects Fund - Nonmajor Governmental Funds General Fund 200,000 (1)
Public Facilities Capital Projects Fund - Nonmajor Governmental Funds General Fund 45,000 (2)
Successor Nonmajor InternalGeneral Agency Governmental Service
Transfer Out Fund Housing Funds Funds Total
General Fund -$ 954,046$ 710,870$ 2,173,000$ 3,837,916$ Nonmajor Governmental 2,055,000 - 92,158 - 2,147,158 Enterprise:
Wastewater 25,000 - - 25,000 Internal Service Funds - - 219,355 - 219,355
Total 2,080,000$ 954,046$ 1,022,383$ 2,173,000$ 6,229,429$
Transfers In
70

CITY OF ESCONDIDO Notes to Basic Financial Statements (Continued)
For the Year Ended June 30, 2019
Note 8 – Long-Term Debt A. Governmental Activities
Summary of changes in long-term liabilities for Governmental Activities as of June 30, 2019, are as follows:
Compensated Absences - Employee Leave Benefits Payable The City's policies relating to employee leave benefits are described in Note 1. The balance at June 30, 2019, is $6,853,951. This liability will be paid in future years from future resources primarily from the General Fund. Claims Payable The balance of claims payable at June 30, 2019, is $17,613,800. For more information, see Note 10. Loans Payable In 2004, the City was granted an energy conservation loan from the California Energy Commission to fund various energy conservation projects. The term of the loan is 15 years with an annual interest rate of 3.95%. The outstanding balance at June 30, 2019, is $299,681. The annual debt service requirements are as follows:
Balance Balance Due within Due in MoreJuly 1, 2018 Additions Deletions June 30, 2019 One Year Than One Year
Compensated absences 6,535,150$ 1,645,593$ (1,326,792)$ 6,853,951$ 1,684,352$ 5,169,599$
Claims payable 16,823,400 3,365,936 (2,575,536) 17,613,800 3,522,760 14,091,040
Loans payable 3,085,997 - (410,998) 2,674,999 416,661 2,258,338
Capital leases 2,348,520 - (455,943) 1,892,577 468,820 1,423,757
2015 Refunding General Obligation Bonds 58,680,000 - (1,870,000) 56,810,000 1,965,000 54,845,000
Unamortized bond premium 7,823,417 - (430,647) 7,392,770 - 7,392,770
2013A Lease Revenue Bonds 3,750,000 - (235,000) 3,515,000 245,000 3,270,000
Unamortized bond discount (6,969) - 546 (6,423) - (6,423)
Total 99,039,515$ 5,011,529$ (7,304,370)$ 96,746,674$ 8,302,593$ 88,444,081$
Year EndedJune 30, Principal Interest Total
2020 95,995$ 10,929$ 106,924$ 2021 99,851 7,072 106,923 2022 103,835 3,089 106,924
Total 299,681$ 21,090$ 320,771$
71

CITY OF ESCONDIDO Notes to Basic Financial Statements (Continued)
For the Year Ended June 30, 2019
Note 8 – Long-Term Debt (Continued) A. Governmental Activities (Continued)
Loans Payable (Continued) In 2011, the City was granted five loans from the San Diego Gas and Electric Company to fund various energy conservation projects including the City Hall, CFA 921, EVCC, and the Park Avenue Community Center (PACC). The term of the loan is 8 years of monthly installment payments with no interest. The outstanding balances at June 30, 2019, are $22,658.
The annual debt service requirements are as follows:
The City of Escondido, County of San Diego, and multiple participating agencies are involved in a Regional Communication System; the multi-year agreement expired in 2016. As a continuation of the program, the City entered into a new 20-year agreement with the County and participating agencies. The agreement obligated the City to share in the infrastructure costs with the County and to purchase radios and support devices. In 2017, the City entered into a loan agreement with the County of San Diego for the City’s share of the infrastructure costs. The infrastructure is financed over a ten-year period with an annual interest rate of 2.79%. The outstanding balance at June 30, 2019, is $2,352,660. The annual debt service requirements are as follows:
Year EndedJune 30, City Hall CFA 921 EVCC Total
2020 2,262$ 4,225$ 4,752$ 11,239$ 2021 2,262 2,111 5,185 9,558 2022 566 - 1,295 1,861
Total 5,090$ 6,336$ 11,232$ 22,658$
Principals
Year EndedJune 30, Principal Interest Total
2020 308,994$ 65,639$ 374,633$ 2021 317,615 57,018 374,633 2022 326,477 48,156 374,633 2023 335,585 39,048 374,633 2024 344,949 29,685 374,634
2025-2027 719,040 30,230 749,270
Total 2,352,660$ 269,776$ 2,622,436$
72

CITY OF ESCONDIDO Notes to Basic Financial Statements (Continued)
For the Year Ended June 30, 2019
Note 8 – Long-Term Debt (Continued) A. Governmental Activities (Continued)
Capital Leases In September 2014, the City entered into a lease agreement with Leasing 2, Inc. to acquire a Sutphen aerial ladder fire truck. Per the lease agreement, the annual payments of $190,375 are due in August of each year with the final payment due in August 2020. The outstanding balance at June 30, 2019, was $364,911. The net carrying amount of assets acquired under the capital lease totaled $107,450 at June 30, 2019 and is classified as motorized vehicles within capital assets. The amortization of the leased assets are included as part of depreciation expense. The future minimum lease and the net present value of these minimum lease payments as of June 30, 2019, are as follows:
In 2018, the City entered into a lease-purchase agreement for the purchase of the mobile radios and support devices. The equipment is financed over a seven-year period with an annual interest rate of 2.79%. The outstanding balance at June 30, 2019, is $1,527,666. The net carrying amount of the capital assets, classified as machinery and equipment, acquired under the capital lease totaled $2,000,582 at June 30, 2019. The amortization of the leased assets are included as part of depreciation expense. The future minimum lease and the net present value of these minimum lease payments as of June 30, 2019, are as follows:
Year EndedJune 30, Principal Interest Total
2020 179,865$ 10,510$ 190,375$ 2021 185,046 5,329 190,375
Total 364,911$ 15,839$ 380,750$
Year EndedJune 30, Principal Interest Total
2020 288,955$ 42,617$ 331,572$ 2021 297,016 34,556 331,572 2022 305,302 26,271 331,573 2023 313,820 17,754 331,574 2024 322,573 8,999 331,572
Total 1,527,666$ 130,197$ 1,657,863$
73

CITY OF ESCONDIDO Notes to Basic Financial Statements (Continued)
For the Year Ended June 30, 2019
Note 8 – Long-Term Debt (Continued) A. Governmental Activities (Continued)
2015 Refunding General Obligation Bonds
On August 1, 2006, the City issued General Obligation Bonds, election of 2004, Series A amounting to $84,350,000 to construct, upgrade, and acquire land for City fire stations, an emergency response training center, and a combined police and fire headquarters facility. The bonds mature serially on September 1, beginning 2007 through 2036 in amounts ranging from $1,170,000 to $5,225,000 and pay interest at rates varying from 3.55% to 4.75%. Interest is payable semiannually on March 1 and September 1 of each year, commencing on March 1, 2007. No reserve fund is required. The General Obligation Bonds, election of 2004, Series A were defeased with the issuance of the General Obligation Refunding Bonds, Series 2015, and the liability has been removed from the long-term debt. On May 12, 2015, the City issued $61,520,000 of General Obligation Refunding Bonds Series 2015. Proceeds from the Bonds were used to refund the General Obligation Bonds, election 2004, Series A, fund a debt service reserve fund and pay the costs of issuance. The Bonds bear interest ranging from 3.00% to 5.00% per annum payable on March 1 and September 1 of each year commencing March 1, 2015. The Bonds mature starting September 1, 2016 and end on September 1, 2036. At June 30, 2018, the outstanding balance of the Bonds was $56,810,000 and unamortized bond premium was $7,392,770. The net proceeds of $70.2 million of the General Obligation Bonds, Series 2015 (after a premium of $9.1 million and payment of $.4 million in underwriting fees, insurance, and other issuance costs) were used to refund the General Obligation Bonds, election of 2004, Series A and were deposited in an irrevocable trust with an escrow agent to provide for all future debt service payments on the refunded General Obligation Bonds, election of 2004, Series A. As a result, the refunded bonds are considered to be defeased and the liability of the General Obligation Bonds, election of 2004, Series A has been removed from long-term debt. The refunding decreased the total debt service payment by $10.3 million over the next 22 years and resulted in an economic gain of $7.4 million. The annual debt service requirements are as follows:
Year EndedJune 30, Principal Interest Total
2020 1,965,000$ 2,840,500$ 4,805,500$ 2021 2,065,000 2,742,250 4,807,250 2022 2,165,000 2,639,000 4,804,000 2023 2,275,000 2,530,750 4,805,750 2024 2,390,000 2,417,000 4,807,000
2025-2029 14,085,000 10,153,750 24,238,750 2030-2034 18,360,000 6,225,000 24,585,000 2035-2037 13,505,000 1,373,750 14,878,750
Total 56,810,000$ 30,922,000$ 87,732,000$
74

CITY OF ESCONDIDO Notes to Basic Financial Statements (Continued)
For the Year Ended June 30, 2019
Note 8 – Long-Term Debt (Continued) A. Governmental Activities (Continued)
2013A Lease Revenue Bonds
In March 2013, the City of Escondido issued $4,830,000 in Lease Revenue Bonds to currently refund the outstanding Escondido Joint Powers Financing Authority 2001 Lease Revenue Bonds and to pay the costs incurred in connection with the issuance of the Escondido Joint Powers Financing Authority Lease Revenue Refunding Bonds, Series 2013A. The principal is due annually on October 1 in amounts ranging from $205,000 to 355,000, commencing 2013 and ending 2030. Interest is payable semi-annually on April 1 and October 1 of each year commencing October 1, 2013, at rates ranging from 2.00% to 4.00%. At June 30, 2019, the outstanding balance of these bonds was $3,515,000 and unamortized bond discount was $6,423. The annual debt service requirements are as follows:
B. Business-Type Activities
Summary of changes in long-term liabilities for Business-type Activities as of June 30, 2019, are as follows:
Year EndedJune 30, Principal Interest Total
2020 245,000$ 118,644$ 363,644$ 2021 250,000 111,219 361,219 2022 260,000 103,568 363,568 2023 265,000 95,694 360,694 2024 275,000 87,250 362,250
2025-2029 1,525,000 282,828 1,807,828 2030-2031 695,000 27,887 722,887
Total 3,515,000$ 827,090$ 4,342,090$
Balance Balance Due within Due in MoreJuly 1, 2018 Additions Deletions June 30, 2019 One Year Than One Year
Connection rights payable 13,155,991$ -$ (168,223)$ 12,987,768$ -$ 12,987,768$
Compensated absences 1,288,822 280,675 (250,933) 1,318,564 329,640 988,924
Loans payable 11,839,767 1,641,349 (2,175,290) 11,305,826 2,183,440 9,122,386
2007 Water Revenue COP 25,255,000 - (640,000) 24,615,000 670,000 23,945,000 Unamortized bond premium 158,865 - (8,252) 150,613 - 150,613
2012 Water Revenue Bonds 28,740,000 - (545,000) 28,195,000 565,000 27,630,000
Unamortized bond premium 1,316,028 - (55,192) 1,260,836 - 1,260,836
2015A Wastewater Refunding Revenue Bonds 11,620,000 - (1,045,000) 10,575,000 1,100,000 9,475,000
Unamortized bond premium 1,744,371 - (213,597) 1,530,774 - 1,530,774
2015B Wastewater Refunding Revenue Bonds 3,765,000 - (435,000) 3,330,000 440,000 2,890,000
Unamortized bond discount (39,742) - 4,866 (34,876) - (34,876)
2012 Wastewater Revenue Bonds 26,510,000 - (165,000) 26,345,000 175,000 26,170,000
Unamortized bond premium 1,502,202 - (63,000) 1,439,202 - 1,439,202
Total 137,249,799$ 1,922,024$ (5,759,621)$ 123,018,707$ 5,463,080$ 117,555,627$
75

CITY OF ESCONDIDO Notes to Basic Financial Statements (Continued)
For the Year Ended June 30, 2019
Note 8 – Long-Term Debt (Continued) B. Business-Type Activities (Continued)
Connection Rights Payable In 1982, the City raised funds for water and sewer improvements by selling in advance rights to connect to the utility system. The holders of those rights could sell or transfer those rights to others. The value of the rights resulted from the ability of the holder to redeem the rights to the City in order to connect to the system. The amounts collected represent connection fees collected in advance of the connection. The amounts collected are recorded as a liability until earned at the time of connection. The purchase price for sewer connection rights sold was $1,500 per right. Per the contract, the rights increased in value 10% per year until May 31, 2007. As of that date, a sewer right was valued at $21,872. The purchase price for water connection rights sold was $900 per right. Per the contract, the rights increased in value 10% per year until July 1, 1993. At that time, each right was valued at $3,230.
There was no limit to the number of rights purchased under a contract or the number of contracts an individual might purchase. Both contracts allowed several options to the purchaser. These options were: 1) The rights could be used by the purchaser at the time of pulling building permits, thus waiving the current fee being charged by the Building Department; 2) if the owner of the rights sold the property for which the rights were originally purchased, the rights could be transferred to the new owner; 3) the last option was to turn in the right to the City of Escondido for the purpose of resale on a "first come, first served" basis. Resales are paid based on receipts from current connection fees on building permits. Interest on connection rights represents the increase in the obligation of the City to the holders of the rights as a result of rates of increase stipulated in the City's agreement with the holders of the rights. The outstanding balance at June 30, 2019 is $12,987,768.
Compensated Absences – Employee Leave Benefits Payable The City's policies relating to employee leave benefits are described in Note 1 of the Notes to Basic Financial Statements. This liability will be paid in future years from future resources. The balance at June 30, 2019, is $1,318,564. Loans Payable In 1999, the City entered into an agreement with the State Water Resources Control Board (State Board) for a revolving fund loan program. The fund was established with a combination of Federal Clean Water Act funds and State matching funds. The proceeds were used to construct a Tertiary Treatment Facility for local wastewater and a delivery system for recycled water to a specified number of local users. There are two phases in the Tertiary Treatment Facility project, and the loan was set up with sub-loan amounts for each phase. The City is obligated to repay the State Board on the Federal Disbursement Amount as principal and the Local Match Amount as interest on the loan. The Federal Disbursement portion is 83.33% and the Local Match portion is 16.67% of the total loan balance.
76

CITY OF ESCONDIDO Notes to Basic Financial Statements (Continued)
For the Year Ended June 30, 2019
Note 8 – Long-Term Debt (Continued)
B. Business-Type Activities (Continued)
Loans Payable (Continued)
The first phase of the Tertiary Treatment Facility project was completed on May 25, 2001 for a total project cost of $8,149,808. The second phase of the project was completed on April 1, 2003 and included two sub-loan amounts of $16,461,971and $19,754,444. The principal and interest on the first phase loan is due annually on May 25 for $488,990 commencing 2002 and ending 2021. The principal and interest on the second phase loan is due annually on April 1 for $1,728,852 commencing 2004 and ending 2023. Principal and interest payments on the loans are payable from the Wastewater Fund consisting of sewer rates, fees, and charges. The outstanding balance at June 30, 2019, is $6,577,797. The annual debt service requirements are as follows:
In 2002, the City entered into an agreement with the Department of Water Resources for a loan program. The funds were provided in part from the Federal Capitalization Grant for Drinking Water State Revolving Funds program. The proceeds were used to construct the Gravity Float Line Capital Project. Repayment of the total amount issued of $2,048,125 began on January 1, 2005, with semi-annual payments of $65,459 with varying interest rates from 1.94% to 3.16%. The repayment ends on July 1, 2024. Principal and interest payments on the loans are payable from the Water Fund consisting of water rates, fees, and charges. The outstanding balance at June 30, 2019, is $611,537. The annual debt service requirements are as follows:
Year EndedJune 30, Phase I Phase II Phase III Total
2020 407,490$ 823,099$ 617,606$ 1,848,195$ 2021 407,490 823,099 617,606 1,848,195 2022 - 823,098 617,606 1,440,704 2023 - 823,098 617,605 1,440,703
Total 814,980$ 3,292,394$ 2,470,423$ 6,577,797$
Principals
Year EndedJune 30, Principal Interest Total
2020 116,276$ 14,643$ 130,919$ 2021 119,216 11,703 130,919 2022 122,231 8,688 130,919 2023 125,322 5,596 130,918 2024 128,492 2,427 130,919
Total 611,537$ 43,057$ 654,594$
77

CITY OF ESCONDIDO Notes to Basic Financial Statements (Continued)
For the Year Ended June 30, 2019
Note 8 – Long-Term Debt (Continued)
B. Business-Type Activities (Continued)
Loans Payable (Continued) In 2005, the City entered into an agreement with the Department of Water Resources for a loan program. The funds were provided in part from the Federal Capitalization Grants for Clean Water State Revolving Funds program. The proceeds of $1,572,306 were used for the HARRF Aeration Blower Replacement Project. Principal and interest is due annually on December 30 in the amount of $98,817 commencing 2005 and ending 2025. The project was completed as of June 30, 2006. Principal and interest payments on the loans are payable from the Wastewater Fund consisting of sewer rates, fees, and charges. The outstanding balance at June 30, 2019, is $546,119. The annual debt service requirements are as follows:
In October 2009, the City entered into an agreement with the State Department of Public Health for funding of construction of the Alexander Area Phase II Water Line. The agreement provided for the loan funding, up to a maximum loan amount of $6,500,000, under the provisions of the California Safe Drinking Water State Revolving Fund Loan Program and the American Recovery and Reinvestment Act of 2009. A total of $5,626,469 in project costs were incurred and submitted to the State for reimbursement. As per the terms of the agreement, fifty percent of each disbursement was forgiven by the State and not added to the principal amount of the loan. Upon project completion in October 2012, final loan principal to be repaid amounted to $2,813,324. Repayment began March 1, 2012, with semi-annual payments of principal and interest of $89,816, including interest at the rate of 2.5017%. The repayment period ends on September 1, 2031. Principal and interest payments on the loans are payable from the Water Fund consisting of water rates, fees, and charges. The outstanding balance at June 30, 2019, is $1,929,022. The annual debt service requirements are as follows:
Year EndedJune 30, Principal Interest Total
2020 85,709$ 13,107$ 98,816$ 2021 87,767 11,050 98,817 2022 89,873 8,943 98,816 2023 92,030 6,786 98,816 2024 94,239 4,577 98,816 2025 96,501 2,317 98,818
Total 546,119$ 46,780$ 592,899$
Year EndedJune 30, Principal Interest Total
2020 133,260$ 47,430$ 180,690$ 2021 136,614 44,075 180,689 2022 140,053 40,636 180,689 2023 143,580 37,111 180,691 2024 147,193 33,496 180,689
2025-2029 793,630 110,000 903,630 2030-2032 434,692 16,444 451,136
Total 1,929,022$ 329,192$ 2,258,214$
78

CITY OF ESCONDIDO Notes to Basic Financial Statements (Continued)
For the Year Ended June 30, 2019
Note 8 – Long-Term Debt (Continued)
B. Business-Type Activities (Continued)
Loans Payable (Continued) In October 2017, the City entered a construction installment sale agreement with the State Water Resources Control Board for funding of up to $5 million for the construction of the Brine Line to Broadway to the Hale Avenue Resource Recovery Facility Project. This project extends the existing, 15-inch brine transmission pipeline from the Broadway crossing of Escondido Creek (near Grape Day Park) to the HARRF. In June 2019, the City’s Wastewater Fund received the first disbursement. The interest rate on the loan is 1.8% and the repayment period for the loan is 30 years, beginning one year after completion of construction of the project, which is currently projected for October 2019. The outstanding balance at June 30, 2019, is $1,491,349. In October 2017, the City entered into a construction installment sale agreement with the State Water Resources Control Board for funding of up to $8 million for the Recycled Water Easterly Main and Tanks Project. This project extends the existing transmission pipeline from the Broadway crossing of Escondido Creek to the Hale Avenue Resource and Recovery Facility. A portion of the principal amount, $2,500,000, is funded by Proposition 1 – the Water Quality, Supply, and infrastructure Improvement Act of 2014 and the Clean Water State Revolving Fund and is anticipated to be forgiven contingent on the City’s performance of its obligations under the agreement. The interest rate on the loan is 1.8% and the repayment period for the loan is 30 years, beginning one year after completion of construction of the project, which is currently projected for May 2020. The loan will be funded from revenues of the Wastewater Fund. As of June 30, 2019, no funds had been disbursed to the City. In June 2019, the City of Escondido entered into an installment sale agreement with the California Infrastructure and Economic Development Bank (IBank) for the Lindley Reservoir Tank Replacement Project. The IBank loan is provided through IBank’s Infrastructure State Revolving Fund (ISRF) Loan Program. The loan amount approved is $15 million with a term of 30 years at an annual interest rate of 3.00%. Repayment of the loan will begin in August 2020, with semi-annual payments of interest and principal of approximately $780,000. The estimated project completion date is May 2022. The loan will be funded from revenues of the Water Fund. The outstanding balance at June 30, 2019, is $150,000.
2007 Water Revenue Certificates of Participation In September 2007, the City issued $30,440,000 in Revenue Certificates of Participation to finance certain capital projects and to advance refund $12,450,000 of outstanding Revenue Certificates of Participation, series 2000A, which were originally issued to finance the cost of construction of certain replacements to water lines and other capital improvements to the water system. The principal is due annually on September 1 in amounts ranging from $430,000 to $990,000, commencing 2008 and ending 2025 with interest rates varying from 3.5% to 4.375%. In addition, $5,775,000 and $13,325,000 term certificates are due September 1, 2030 and September 2037, respectively.
79

CITY OF ESCONDIDO Notes to Basic Financial Statements (Continued)
For the Year Ended June 30, 2019
Note 8 – Long-Term Debt (Continued) B. Business-Type Activities (Continued)
2007 Water Revenue Certificates of Participation (Continued) The $5,775,000 term certificates pay interest at 5.0% and the $13,325,000 term certificates pay interest at 4.75%. Interest is payable semi-annually on March 1 and September 1 of each year, commencing on March 1, 2008. The certificates maturing on or after September 1, 2018, are subject to optional prepayment prior to their respective maturities, as a whole or in part on any date in the order of maturity as directed by the City in a Written Request provided to the Trustee at least 45 days prior to the prepayment date and by lot within each maturity in integral multiples of $5,000, on or after September 1, 2007, from amounts prepaid by the City pursuant to the Installment Purchase Agreement at a Prepayment Price equal to 100% of the principal amount of such Certificates to be prepaid. Additionally, the term certificates maturing on September 1, 2030 and 2037 are subject to mandatory prepayment in part (by lot) on each September 1 on and after September 1, 2026 and 2031, respectively, in integral multiple of $5,000 at a prepayment price as described in the Certificate covenants. The outstanding balance at June 30, 2019 was $24,615,000 and unamortized bond premium was $150,613. The annual debt service requirements are as follows:
2012 Water Revenue Bonds
In March 2012, the City issued $31,660,000 in Revenue Water System Financing Bonds to finance certain capital projects and to refund a portion of the $9,830,000 of outstanding Revenue Certificates of Participation, series 2000, and $8,585,000 of outstanding Revenue Certificates of Participation, series 2002. The principal for the $10,845,000 serial bonds is due annually on September 1 in amounts ranging from $285,000 to $815,000 commencing 2012 and ending 2029 with interest at rates varying from 1.0% to 4.0%. In addition, Term bonds are due in the amounts of $2,485,000, $4,025,000, and $14,305,000 September 1, 2031, 2033 and 2041 respectively. Term certificates pay interest at 5.0%, and require sinking fund deposits or principal installment payments due annually on September 1 in amounts ranging from $840,000 to $3,840,000, commencing 2030 and ending 2041. Interest is payable semi-annually on March 1 and September 1 of each year, commencing on September 1, 2012.
Year EndedJune 30, Principal Interest Total
2020 670,000$ 1,138,650$ 1,808,650$ 2021 695,000 1,111,350 1,806,350 2022 725,000 1,082,497 1,807,497 2023 755,000 1,051,972 1,806,972 2024 790,000 1,019,612 1,809,612
2025-2029 5,170,000 4,451,319 9,621,319 2030-2034 3,810,000 3,187,130 6,997,130 2035-2038 12,000,000 1,173,724 13,173,724
Total 24,615,000$ 14,216,254$ 38,831,254$
80

CITY OF ESCONDIDO Notes to Basic Financial Statements (Continued)
For the Year Ended June 30, 2019
Note 8 – Long-Term Debt (Continued)
B. Business-Type Activities (Continued)
2012 Water Revenue Bonds (Continued)
Bonds with stated maturities on or after September 1, 2022 will be subject to optional redemption prior to their respective stated maturities, as a whole or in part, on any date as directed by the City provided at least a 30-day notice is mailed by the Trustee to bondholders, and by lot within each maturity in integral multiples of $5,000, on or after March 1, 2022 at a price without premium, equal to the principal amount plus accrued interest to the redemption date. Additionally, the term certificates, maturing on September 1, 2031, 2033, and 2041 are subject to mandatory sinking fund redemption in part on each September 1, on and after September 1, 2030, 2032, and 2038 respectively, in integral multiples of $5,000, at a redemption price without premium, equal to the principal amount plus accrued interest to the redemption date, in accordance with the schedules contained in the covenants. The rate covenant requires net revenues during each Fiscal Year to be sufficient to equal 120% of the Debt Service payable in such Fiscal Year. The outstanding balance at June 30, 2018, was $28,195,000 and the unamortized bond premium was $1,260,836. A reserve fund is not established. The annual debt service requirements are as follows:
2015A Wastewater Refunding Revenue Bonds
On April 29, 2015, the City issued $14,645,000 of Refunding Revenue Bonds (Wastewater System), Series 2015A. Proceeds from the issuance were used to refund the 2004A COP Bonds and pay the costs of issuing the Bonds. The Bonds bear interest ranging from 2.00% to 5.00% per annum payable on March 1 and September 1 of each year commencing on September 1, 2015. The Bonds mature September 1, 2015 through September 1, 2026 and are limited obligations of the City payable solely from net revenues of the City’s Wastewater System remaining after payment of operation and maintenance costs. At June 30, 2019, the outstanding balance of the Bonds was $10,575,000 and unamortized bond premium was $1,530,774.
Year EndedJune 30, Principal Interest Total
2020 565,000$ 1,326,656$ 1,891,656$ 2021 585,000 1,303,656 1,888,656 2022 610,000 1,279,756 1,889,756 2023 635,000 1,258,031 1,893,031 2024 645,000 1,232,381 1,877,381
2025-2029 3,525,000 5,731,733 9,256,733 2030-2034 7,325,000 4,668,550 11,993,550 2035-2039 3,320,000 3,493,250 6,813,250 2040-2042 10,985,000 841,627 11,826,627
Total 28,195,000$ 21,135,640$ 49,330,640$
81

CITY OF ESCONDIDO Notes to Basic Financial Statements (Continued)
For the Year Ended June 30, 2019
Note 8 – Long-Term Debt (Continued)
B. Business-Type Activities (Continued)
2015A Wastewater Refunding Revenue Bonds (Continued)
The net proceeds of $16.8 million of the Refunding Revenue Bonds (Wastewater System), Series 2015A (after a premium of $2.4 million and payment of $0.2 million in underwriting fees, insurance, and other issuance costs) were used to refund the Certificates of Participation, Series 2004A and were deposited in an irrevocable trust with an escrow agent to provide for all future debt service payments on the refunded Certificates of Participation, Series 2004A. As a result, the refunded bonds are considered to be defeased and the liability of the Certificates of Participation, Series 2004A has been removed from long-term debt. The refunding decreased the total debt service payment by $5.0 million over the next 12 years and resulted in an economic gain of $2.4 million. The annual debt service requirements are as follows:
2015B Wastewater Refunding Revenue Bonds
On April 29, 2015, the City issued $5,060,000 of Refunding Revenue Bonds (Wastewater System), Series 2015B. Proceeds from the issuance were used to refund the 2004B Certificates of Participation and pay the costs of issuing the Bonds. The Bonds bear interest ranging from 0.40% to 3.25% per annum payable on March 1 and September 1 of each year commencing on September 1, 2015. The Bonds mature September 1, 2015 through September 1, 2025. The 2015 Bonds are limited obligations of the City payable solely from net revenues of the City’s Wastewater System remaining after payment of operation and maintenance costs. At June 30, 2018, the outstanding balance of the Bonds was $3,765,000 and unamortized bond discount was $39,742. The net proceeds of $5.0 million of the Refunding Revenue Bonds (Wastewater System), Series 2015B were used to refund the Certificates of Participation, Series 2004B and were deposited in an irrevocable trust with an escrow agent to provide for all future debt service payments on the refunded Certificates of Participation, Series 2004B. As a result, the refunded bonds are considered to be defeased and the liability of the Certificates of Participation, Series 2004B has been removed from long-term debt. The refunding decreased the total debt service payment by $3.9 million over the next 11 years and resulted in an economic gain of $1.1 million.
Year EndedJune 30, Principal Interest Total
2020 1,100,000$ 501,250$ 1,601,250$ 2021 1,160,000 444,750 1,604,750 2022 1,215,000 385,375 1,600,375 2023 1,280,000 323,000 1,603,000 2024 1,350,000 257,250 1,607,250
2025-2027 4,470,000 342,750 4,812,750
Total 10,575,000$ 2,254,375$ 12,829,375$
82

CITY OF ESCONDIDO Notes to Basic Financial Statements (Continued)
For the Year Ended June 30, 2019
Note 8 – Long-Term Debt (Continued)
B. Business-Type Activities (Continued)
2015B Wastewater Refunding Revenue Bonds (Continued)
The annual debt service requirements are as follows:
2012 Wastewater Revenue Bonds
In March 2012, the City issued $27,390,000 in Revenue Wastewater System Financing Bonds to finance certain capital projects and to current refund a portion of the $9,830,000 of outstanding Water Revenue Certificates of Participation, series 2000. The principal for the $4,070,000 serial bonds is due annually on September 1 in amounts ranging from $130,000 to $1,410,000 commencing 2013 and ending 2031 with interest at rates varying from 1.0% to 4.0%. In addition, Term bonds are due in the amounts of $2,375,000, $2,615,000, $3,000,000, $5,075,000 and $10,225,000 on September 1, 2028, 2030, 2033, 2036, and 2041 respectively. The term certificates pay interest at rates of 4.25% and 5.0%, and require sinking fund deposits or principal installment payments due annually on September 1 in amounts ranging from $475,000 to $2,255,000, commencing 2027 and ending 2041. Interest is payable semi-annually on March 1 and September 1 of each year, commencing on September 1, 2013. Bonds with stated maturities on or after September 1, 2022 will be subject to optional redemption prior to their respective stated maturities, as a whole or in part, on any date as directed by the City provided at least a 30-day notice is mailed by the Trustee to bondholders, and by lot within each maturity in integral multiples of $5,000, on or after March 1, 2022 at a price without premium, equal to the principal amount plus accrued interest to the redemption date. Additionally, the term certificates, maturing on September 1, 2028, 2030, 2033, 2036 and 2041 are subject to mandatory sinking fund redemption in part on each September 1, on and after September 1, 2027 2029, 2032, 2034, and 2034 respectively, in integral multiples of $5,000, at a redemption price without premium, equal to the principal amount plus accrued interest to the redemption date, in accordance with the schedules contained in the covenants. The rate covenant requires net revenues during each Fiscal Year to be sufficient to equal 115% of the Debt Service payable in such Fiscal Year. The outstanding balance at June 30, 2019, was $26,245,000 and unamortized bond premium is $1,439,202. A reserve fund is not established.
Year EndedJune 30, Principal Interest Total
2020 440,000$ 85,525$ 525,525$ 2021 450,000 76,063 526,063 2022 460,000 65,250 525,250 2023 475,000 52,969 527,969 2024 485,000 39,162 524,162
2025-2026 1,020,000 32,681 1,052,681
Total 3,330,000$ 351,650$ 3,681,650$
83

CITY OF ESCONDIDO Notes to Basic Financial Statements (Continued)
For the Year Ended June 30, 2019
Note 8 – Long-Term Debt (Continued)
B. Business-Type Activities (Continued)
2012 Wastewater Revenue Bonds (Continued)
The annual debt service requirements are as follows:
Pledged Revenue The City and its component units have a number of debt issuances outstanding that are collateralized by the pledging of certain revenues. The amount and term of the remainder of these commitments are indicated in the debt service to maturity tables presented in the accompanying notes. The purposes for which the proceeds of the related debt issuances were utilized are disclosed in the debt descriptions in the accompanying notes. For the current year, debt service payments as a percentage of the pledged gross revenue are indicated in the table below. These percentages also approximate the relationship of debt service to pledged revenue for the remainder of the term of the commitment.
Year EndedJune 30, Principal Interest Total
2020 175,000$ 1,266,981$ 1,441,981$ 2021 185,000 1,259,781 1,444,781 2022 185,000 1,252,381 1,437,381 2023 195,000 1,244,781 1,439,781 2024 205,000 1,236,781 1,441,781
2025-2029 3,045,000 5,972,153 9,017,153 2030-2034 7,025,000 4,651,375 11,676,375 2035-2039 8,880,000 2,747,000 11,627,000 2040-2042 6,450,000 494,250 6,944,250
Total 26,345,000$ 20,125,483$ 46,470,483$
Description of Pledged Revenue
Annual Amount of Pledged Revenue (net of expenses, where required)
Annual Debt Service Payments
(of all debt secured by this revenue)
Debt Service as a Percentage of Pledged
Revenue
Charges for services 21,953,895$ 9,788,675$ 44.59%Loan repayment revenue 360,844 360,844 100.00%
84

CITY OF ESCONDIDO Notes to Basic Financial Statements (Continued)
For the Year Ended June 30, 2019
Note 8 – Long-Term Debt (Continued)
B. Business-Type Activities (Continued)
Rate Covenants Under various debt issues, the City has agreed to set charges for water and wastewater services each year at rates sufficient to produce net revenues (after paying operating and maintenance expenses, excluding depreciation and interest) of at least 1.20 and 1.15 times the debt service on the bonds for that year for the Water and Wastewater Fund, respectively. For the year ended June 30, 2019, the City met this requirement, as follows:
C. Fiduciary Funds Summary of changes in long-term liabilities for Fiduciary Funds as of June 30, 2019, are as follows:
Water WastewaterGross revenues, excluding
intergovernmental revenue and developer contributions 60,221,282$ 38,533,132$
Operating and maintenance expenses,excluding depreciation, interest and transfers 52,344,138 24,456,381
Net revenues 7,877,144 14,076,751
Amount required:Debt service payments 4,016,652 5,772,023 Coverage required 1.20 1.15
Amount required 4,819,982 6,637,826
Excess of net revenues 3,057,162$ 7,438,925$
Balance Balance Due within Due in MoreJuly 1, 2018 Additions Deletions June 30, 2019 One Year Than One Year
Advances from the City of Escondido 18,981,545$ 155,622$ (4,695,228)$ 14,441,939$ 3,322,326$ 11,119,613$
2007 A & B Lease Revenue Bonds 7,070,000 - (7,070,000) - - - Unamortized bond premium 102,131 - (102,131) - - -
Total 26,153,676$ 155,622$ (11,867,359)$ 14,441,939$ 3,322,326$ 11,119,613$
85

CITY OF ESCONDIDO Notes to Basic Financial Statements (Continued)
For the Year Ended June 30, 2019
Note 8 – Long-Term Debt (Continued)
C. Fiduciary Funds (Continued) Advances from the City of Escondido The Community Development Commission Debt Service Fund had received monies from the General Fund and Street Special Revenue Fund for use in its operations and capital improvement projects. These advances were absorbed by the Successor Agency at February 1, 2012, and recorded on the ROPS to be an enforceable obligation. At June 30, 2019, the outstanding balance of the advance from the Street Special Revenue Fund totaled $953,953. In accordance with AB X1 26 which dissolves redevelopment agencies, the California State Department of Finance determined that Advances made between the General Fund and the former Community Development Commission were disallowed and not an enforceable obligation. On April 26, 2017, the Department of Finance approved the City of Escondido Successor Agency Oversight Board Resolution making a finding that city loans were for legitimate redevelopment purposes and eligible for reinstatement. As a result, $9,832,652 of principal and accumulated interest are recorded as a Loan to the Successor Agency from the General Fund. Repayments began in the fiscal year ending June 30, 2019. At June 30, 2019, the outstanding balance of the advance from the General Fund totaled $13,487,986. 2007 A&B Lease Revenue Bonds In January 2007, the Escondido Joint Powers Financing Authority issued $40,025,000 2007A Lease Revenue Refunding Bonds and $16,525,000 2007B Taxable Lease Revenue Refunding Bonds to refund the 1995 Certificates of Participation (COP) Lease Revenue Bonds. The 2007A Lease Revenue Refunding Bonds bear interest rates between 3.6% to 4.02% payable semiannually on March 1 and September 1 of each year. The 2007A Lease Revenue Refunding Bonds mature between September 1, 2009 and September 1, 2018, in amounts ranging from $850,000 to $5,025,000. The 2007B Taxable Lease Revenue Refunding Bonds mature on September 1, 2018 at 5.53% rate. The 2007B bonds are subject to mandatory redemption from a sinking fund account in amounts ranging from $930,000 to $2,045,000 commencing September 1, 2009. Both 2007A and 2007B bonds are subject to mandatory redemption as a whole or in part on any date without premium, from unused insurance or condemnation proceed as described in the bond covenants. The reserve for 2007A and 2007B bonds was in form of surety bond and fully funded. The final debt service payments were made in September 2018, the outstanding balance at June 30, 2019, was $0 and unamortized bond premium was $0.
D. Component Unit
Summary of changes in long-term liabilities for Component Unit as of June 30, 2019, are as follows:
Balance Balance Due within Due in MoreJuly 1, 2018 Additions Deletions June 30, 2019 One Year Than One Year
Compensated absences 121,581$ 41,679$ (3,789)$ 159,471$ 50,000$ 109,471$ Note Payable to the City of Escondido - 261,500 (37,095) 224,405 50,597 173,808
Total 121,581$ 303,179$ (40,884)$ 383,876$ 100,597$ 283,279$
86
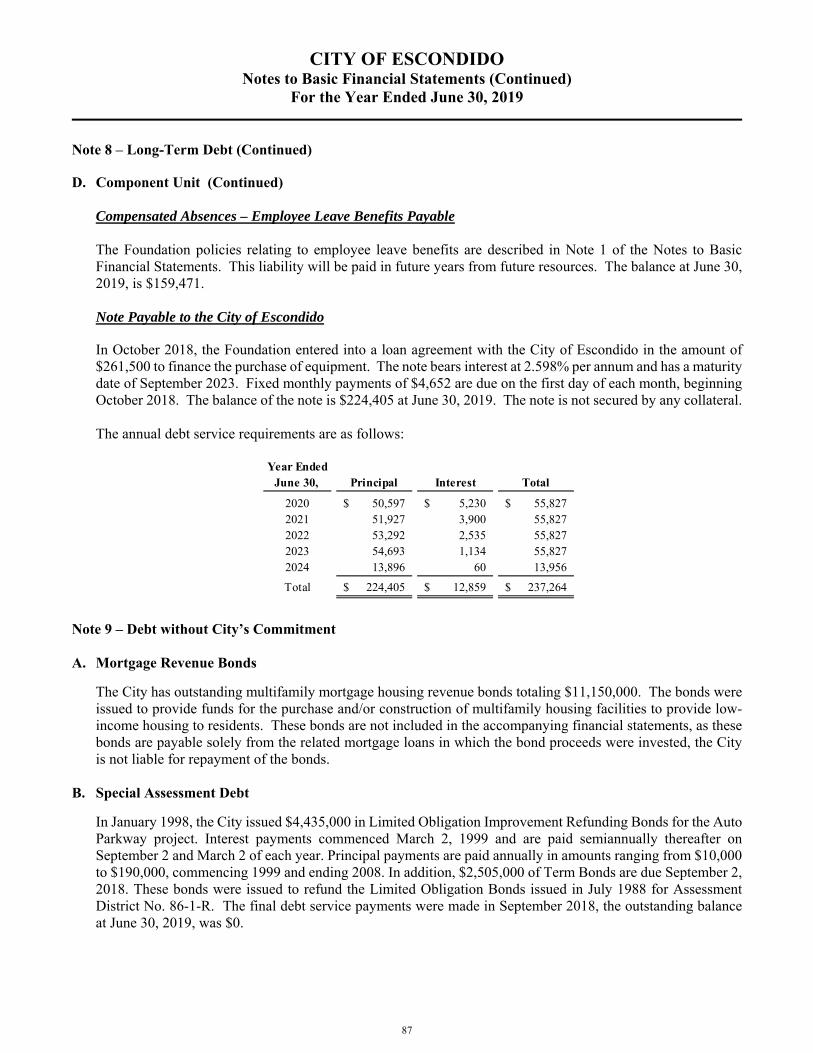
CITY OF ESCONDIDO Notes to Basic Financial Statements (Continued)
For the Year Ended June 30, 2019
Note 8 – Long-Term Debt (Continued)
D. Component Unit (Continued) Compensated Absences – Employee Leave Benefits Payable The Foundation policies relating to employee leave benefits are described in Note 1 of the Notes to Basic Financial Statements. This liability will be paid in future years from future resources. The balance at June 30, 2019, is $159,471. Note Payable to the City of Escondido
In October 2018, the Foundation entered into a loan agreement with the City of Escondido in the amount of $261,500 to finance the purchase of equipment. The note bears interest at 2.598% per annum and has a maturity date of September 2023. Fixed monthly payments of $4,652 are due on the first day of each month, beginning October 2018. The balance of the note is $224,405 at June 30, 2019. The note is not secured by any collateral. The annual debt service requirements are as follows:
Note 9 – Debt without City’s Commitment A. Mortgage Revenue Bonds
The City has outstanding multifamily mortgage housing revenue bonds totaling $11,150,000. The bonds were issued to provide funds for the purchase and/or construction of multifamily housing facilities to provide low-income housing to residents. These bonds are not included in the accompanying financial statements, as these bonds are payable solely from the related mortgage loans in which the bond proceeds were invested, the City is not liable for repayment of the bonds.
B. Special Assessment Debt
In January 1998, the City issued $4,435,000 in Limited Obligation Improvement Refunding Bonds for the Auto Parkway project. Interest payments commenced March 2, 1999 and are paid semiannually thereafter on September 2 and March 2 of each year. Principal payments are paid annually in amounts ranging from $10,000 to $190,000, commencing 1999 and ending 2008. In addition, $2,505,000 of Term Bonds are due September 2, 2018. These bonds were issued to refund the Limited Obligation Bonds issued in July 1988 for Assessment District No. 86-1-R. The final debt service payments were made in September 2018, the outstanding balance at June 30, 2019, was $0.
Year EndedJune 30, Principal Interest Total
2020 50,597$ 5,230$ 55,827$ 2021 51,927 3,900 55,827 2022 53,292 2,535 55,827 2023 54,693 1,134 55,827 2024 13,896 60 13,956
Total 224,405$ 12,859$ 237,264$
87

CITY OF ESCONDIDO Notes to Basic Financial Statements (Continued)
For the Year Ended June 30, 2019
Note 9 – Debt without City’s Commitment (Continued)
B. Special Assessment Debt (Continued)
In August 1998, the City issued $5,105,000 in Limited Obligation Refunding Bonds for Assessment District No. 98-1 (Rancho San Pasqual). Interest payments commenced March 2, 1999 and are paid semiannually thereafter on March 2 and September 2. Principal payments are paid annually in amounts ranging from $80,000 to $165,000 commencing September 2, 1999 and ending September 2, 2013. In addition, $3,040,000 of Term Bonds are due September 2, 2026. These bonds were issued to refund the Limited Obligation Improvements Bonds issued in September 1995 for Rancho San Pasqual Assessment District No. 95-1. On June 30, 2019, the 98-1 Limited Obligation Refunding Bonds outstanding were $2,125,000.
In May 2015, the City issued $13,745,000 in Special Tax Refunding Bonds for Community Facility District No. 2006-01 (Eureka Ranch). These bonds were issued to refund the 2006 Series Special Tax Bonds for Community Facility District No. 2006-01 (Eureka Ranch). The bonds were issued to finance various public improvements needed to develop property located within Community Facilities District No. 2006-01 (Eureka Ranch). The May 2015 issuance of the Special Tax Refunding Bonds fully defeased the 2006 Special Tax Bonds. Interest payments for the Special Tax Refunding Bonds, Series 2015 commenced March1, 2016 and are paid semiannually thereafter on September 1 and March 1 of each year. Principal is paid annually in amounts ranging from $285,000 to $985,000, commencing September 1, 2016 and ending September 1, 2036. In addition, $2,965,000 and $3,875,000 of Term Bonds are due September 1, 2036. On June 30, 20198, the 2006-01 Special Tax Bonds outstanding were $12,545,000.
In July 2013, the City issued $2,355,000 in Special Tax Refunding Bonds for Community Facility District No. 2000-01 (Hidden Trails). These bonds were issued to refund the 2001 Series Special Tax Bonds issued to finance various public improvements needed to develop property located within Community Facility District No. 2000-01 (Hidden Trails). The July 2013 issuance of the Special Tax Refunding Bonds fully defeased the 2001 Special Tax bonds. Interest payments for the Special Tax Refunding Bonds, Series 2013 commenced March 1, 2014, and are paid semiannually thereafter on September 1 and March 1 of each year. Principal payments are paid annually in amounts ranging from $95,000 to $185,000, commencing September 1, 2014 and ending September 1, 2031. On June 30, 2019, the outstanding principal of Community Facilities District No. 2000-01 (Hidden Trails) Special Tax Refunding bonds, Series 2013 was $1,840,000. The bonds are secured by and payable from the proceeds of annual special assessment taxes levied and collected on the property within the Districts. The bonds are not general or special obligations of the City of Escondido. The City is not obligated in any manner for the payment of debt service in the event of default by the property owners but is only acting as an agent for the property owners in collecting the assessments, forwarding the collections to bondholders, and initiating foreclosure proceedings, if appropriate. Neither the faith and credit nor taxing power of the City is pledged to the payment of these bonds. Accordingly, no liability for these bond issuances has been recorded and all debt service transactions have been recorded as an agency fund.
88

CITY OF ESCONDIDO Notes to Basic Financial Statements (Continued)
For the Year Ended June 30, 2019
Note 10 – Self-Insurance The City is a member of the San Diego Pooled Insurance Program Authority (SANDPIPA) which provides liability coverage to its members. As a member, the City carries a self-insured retention of $500,000 and is insured through SANDPIPA from $500,000 to $2,500,000. In addition, SANDPIPA has purchased excess insurance coverage above $2,500,000 to $44,500,000 for all of its members, including the City. The Board of Directors elects three members (including a President and Vice President) to the Executive Committee, which has the responsibility for overseeing all operations of SANDPIPA, including preparation and submission of the annual operating budget to the Board of Directors for its approval and modification, if deemed necessary. Annual premiums are approved by the Board of Directors and are adjusted each year based on the following criteria:
SANDPIPA’s overall funding requirement Exposure base = general liability exposure – DE 6 payroll total for each member; plus automobile liability
– the number of vehicles by major type for each member Loss experience = Each members’ share of total incurred SANDPIPA layer losses for
5 years – 100% of paid losses and 20% of reserves; all losses capped at $750,000 Historical contributions = each members’ historical contribution less dividends paid (percentage of total
contributions of all members) Assessments are recommended by the Underwriting Committee and approved by the Board of Directors and are determined by:
Identifying the claims leading to the shortfall Amounts apportioned by the insurance year Each members’ percentage applied to the overall assessment Assessment amount determined for program year Administrative fees and excess insurance are not included
SANDPIPA’s pooled liability will go into run off on July 1, 2015, adding no new years of claims liabilities. SANDPIPA will continue to exist for the purpose of disposing of all claims, distribution of assets proportionate to each city’s cash contributions, and all other functions necessary to wind down the affairs of the Joint Powers Authority (JPA). Effective July 1, 2015, SANDPIPA will purchase coverage from member self-insured retentions to $50 million with the California State Association of Counties Excess Insurance Authority (CSAC-EIA).
As of June 30, 2019, the City has recorded general self-insurance and workers' compensation liabilities of $2,830,800 and $14,783,000 respectively, for a total of $17,613,800. The City is self-insured for workers' compensation up to $500,000, but has purchased outside insurance coverage for individual claims in excess of $500,000 up to a maximum of $5,000,000 per claim through the CSAC Excess Insurance Authority, a risk management joint powers authority, with additional reinsurance of $300,000,000 per occurrence. Only the probable amounts of loss as estimated by legal counsel and the City, including an estimate for incurred but not reported losses, have been recorded as liabilities in the accompanying financial statements.
89

CITY OF ESCONDIDO Notes to Basic Financial Statements (Continued)
For the Year Ended June 30, 2019
Note 10 – Self-Insurance (Continued) Increases and decreases in claim liabilities for changes in estimates are charged to expense in the period in which the estimates are adjusted. For the past three years, no settlements or claims payments have exceeded the amount of the applicable insurance coverage. Changes in the City's liability for claims payable for the past three fiscal years are summarized as follows:
Note 11 – Restricted Net Position
The restricted component of net position are assets that are subject to constraints either (1) externally imposed by creditors (such as debt covenants), grantors, or laws or regulations of other governments or (2) imposed by law through constitutional provisions or enabling legislation. At June 30, 2019, restricted net position consisted of the followings:
Fiscal YearBeginning
Balance
Claims Incurred and Charges in Estimates
Less Claim Payments
Ending Balance
2016-17 15,749,700 886,500 (268,800) 16,367,400 2017-18 16,367,400 3,377,317 (2,921,317) 16,823,400 2018-19 16,823,400 3,365,936 (2,575,536) 17,613,800
Governmental Business-typeActivities Activities Total
General government 7,555,580$ -$ 7,555,580$ Low and moderate income housing 77,545,628 - 77,545,628 Community services 4,490,571 - 4,490,571 Debt service 3,279,495 1,095,891 4,375,386 Capital projects 2,921,062 - 2,921,062 Public safety 403,946 - 403,946 Public works 12,307,978 - 12,307,978 Investment in Section 115 Trust 7,013,035 - 7,013,035
Total restricted net position 115,517,295$ 1,095,891$ 116,613,186$
90
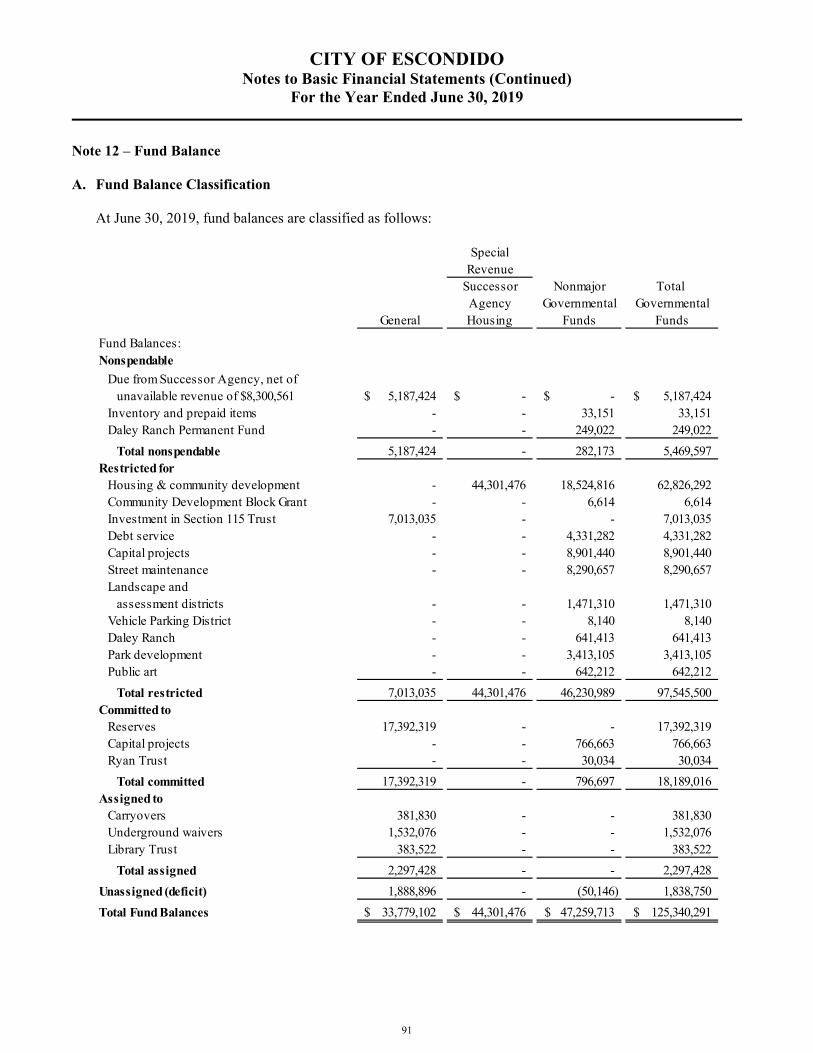
CITY OF ESCONDIDO Notes to Basic Financial Statements (Continued)
For the Year Ended June 30, 2019
Note 12 – Fund Balance A. Fund Balance Classification At June 30, 2019, fund balances are classified as follows:
SpecialRevenue
Successor Nonmajor Total Agency Governmental Governmental
General Housing Funds Funds
Fund Balances:Nonspendable
Due from Successor Agency, net of unavailable revenue of $8,300,561 5,187,424$ -$ -$ 5,187,424$ Inventory and prepaid items - - 33,151 33,151 Daley Ranch Permanent Fund - - 249,022 249,022
Total nonspendable 5,187,424 - 282,173 5,469,597 Restricted for
Housing & community development - 44,301,476 18,524,816 62,826,292 Community Development Block Grant - - 6,614 6,614 Investment in Section 115 Trust 7,013,035 - - 7,013,035 Debt service - - 4,331,282 4,331,282 Capital projects - - 8,901,440 8,901,440 Street maintenance - - 8,290,657 8,290,657 Landscape and
assessment districts - - 1,471,310 1,471,310 Vehicle Parking District - - 8,140 8,140 Daley Ranch - - 641,413 641,413 Park development - - 3,413,105 3,413,105 Public art - - 642,212 642,212
Total restricted 7,013,035 44,301,476 46,230,989 97,545,500 Committed to
Reserves 17,392,319 - - 17,392,319 Capital projects - - 766,663 766,663 Ryan Trust - - 30,034 30,034
Total committed 17,392,319 - 796,697 18,189,016 Assigned to
Carryovers 381,830 - - 381,830 Underground waivers 1,532,076 - - 1,532,076 Library Trust 383,522 - - 383,522
Total assigned 2,297,428 - - 2,297,428
Unassigned (deficit) 1,888,896 - (50,146) 1,838,750
Total Fund Balances 33,779,102$ 44,301,476$ 47,259,713$ 125,340,291$
91

CITY OF ESCONDIDO Notes to Basic Financial Statements (Continued)
For the Year Ended June 30, 2019
Note 12 – Fund Balance (Continued) B. General Fund Reserve
The General Fund Reserves portion of fund balance is committed by City Council to maintain adequate levels of fund balance to mitigate current and future risks and to provide for cash flow requirements and contingencies for unseen operating or capital needs the City. The Reserve balance is available to fund one-time unanticipated expenditure requirements, local disasters, or when actual revenue received is less than the amount budgeted resulting in an operating deficit in the General Fund. City Council action by Resolution is required to adjust the Reserve level.
Note 13 – City Employees Retirement Plan A. CalPERS
Plan Description
The City of Escondido contributes to the California Public Employees Retirement System (PERS), an agent multiple-employer public employee defined benefit pension plan. CalPERS acts as a common investment and administrative agent for participating public entities within the State of California. Benefit provisions and all other requirements are established by state statute and City ordinance. A full description of the pension plan regarding number of employees covered, benefit provisions, assumptions (for funding, but not accounting purposes), and membership information are listed in the June 30, 2017 Annual Actuarial Valuation Report. This report and CalPERS’ audited financial statements are publicly available reports that can be obtained at CalPERS’ website under Forms and Publications.
Benefits Provided
CalPERS provides service retirement and disability benefits, annual cost of living adjustments and death benefits to plan members, who must be public employees and beneficiaries.
The plans’ provisions and benefits in effect at June 30, 2019, are summarized as follows:
Tier 1 * Tier 2 * PEPRA (Tier 3)
Hire date Prior to December 23, 2012 December 23, 2012 and after January 1, 2013 and after
Benefit formula 3% @ 60 2% @ 60 2.0% @ 62
Benefit vesting schedule 5 years service 5 years service 5 years service
Benefit payments monthly for life monthly for life monthly for life
Retirement age minimum 50 yrs minimum 50 yrs minimum 52 yrs
Monthly benefits, as a % of eligible compensation
2.000% - 3.000%, 50 yrs - 60+ yrs,
respectively
1.092% - 2.418%, 50 yrs - 63+ yrs,
respectively
1.000% - 2.500%, 52 yrs - 67+ yrs,
respectively
Required employee contribution rates
8.000% 7.000% 6.250%
Required employer contribution rates
30.801% 30.801% 30.801%
* Plan is closed to new entrants
Miscellaneous Plan
92

CITY OF ESCONDIDO Notes to Basic Financial Statements (Continued)
For the Year Ended June 30, 2019
Note 13 – City Employees Retirement Plan (Continued) A. CalPERS (Continued)
Benefits Provided (continued)
Tier 1 * Tier 2 * PEPRA (Tier 3)
Hire date Fire - prior to May 27, 2012, Police - prior to September
30, 2012
Fire - May 27, 2012 and after Police - September 30, 2012
and after
January 1, 2013 and after
Benefit formula 3% @ 50 2% @ 50 2.7% @ 57
Benefit vesting schedule 5 years service 5 years service 5 years service
Benefit payments monthly for life monthly for life monthly for life
Retirement age minimum 50 yrs minimum 50 yrs minimum 52 yrs
Monthly benefits, as a % of eligible compensation
3.000% - 3.000%, 50 yrs - 55+ yrs,
respectively
2.000% - 2.700%, 50 yrs - 55+ yrs,
respectively
2.000% - 2.700%, 50 yrs - 57+ yrs,
respectively
Required employee contribution rates
9.000% 9.000% 12.250%
Required employer contribution rates
37.787% 37.787% 37.787%
* Plan is closed to new entrants
Safety Plan
Employees Covered by Benefit Terms
At June 30, 2018, the following employees were covered by the benefit terms of the plan:
Contribution Description
Section 20814(c) of the California Public Employees’ Retirement Law (PERL) requires that the employer contribution rates for all public employers be determined on an annual basis by the actuary and shall be effective on the July 1 following notice of a change in the rate. The total plan contributions are determined through the CalPERS’ annual actuarial valuation process. The actuarially determined rate is based on the estimated amount necessary to pay the Plan’s allocated share of the risk pool’s costs of benefits earned by employees during the year, and any unfunded accrued liability. The employer is required to contribute the difference between the actuarially determined rate and the contribution rate of employees.
Description Miscellaneous Safety
Active members 548 249 Transferred members 311 69 Terminated members 378 47 Retired members and beneficiaries 689 314
Total Members 1,926 679
Number of members
93

CITY OF ESCONDIDO Notes to Basic Financial Statements (Continued)
For the Year Ended June 30, 2019
Note 13 – City Employees Retirement Plan (Continued) A. CalPERS (Continued)
Net Pension Liability Actuarial Methods and Assumptions Used to Determine Total Pension Liability
For the measurement period ended June 30, 2018, the total pension liability was determined by rolling forward the June 30, 2017 total pension liability. The June 30, 2018 total pension liabilities were based on the following actuarial methods and assumptions:
All other actuarial assumptions used in the June 30, 2017 valuation were based on the results of an actuarial experience study for the period from 1997 to 2011, including updates to salary increase, mortality and retirement rates. The Experience Study report can be obtained at CalPERS’ website under Forms and Publications.
Change in Assumption The CalPERS Board has approved reducing the discount rate from 7.15 percent to 7.00 percent for the City’s fiscal year ending June 30, 2020. Discount Rate
The discount rate used to measure the total pension liability was 7.15 percent. To determine whether the municipal bond rate should be used in the calculation of a discount rate for each plan, CalPERS stress tested plans that would most likely result in a discount rate that would be different from the actuarially assumed discount rate. Based on the testing of the plans, the tests revealed the assets would not run out. Therefore, the current 7.15 percent discount rate is appropriate and the use of the municipal bond rate calculation is not deemed necessary. The long-term expected discount rate of 7.15 percent is applied to all plans in the Public Employees Retirement Fund. The stress test results are presented in a detailed report called “GASB Crossover Testing Report” that can be obtained at CalPERS’ website under the GASB 68 section.
Miscellaneous Plan Safety Plan
Actuarial Cost Method Entry Age Normal Entry Age NormalActuarial Assumptions
Discount Rate 7.15% 7.15%Inflation 2.75% 2.75%Salary Increases Varies by Entry Age and Service Varies by Entry Age and Service Investment Rate of Return 7.50% Net of Pension Plan Investment and
Administrative Expenses; includes Inflation 7.50% Net of Pension Plan Investment and Administrative Expenses; includes Inflation
Mortality Rate Table (1) Derived using CalPERS’ Membership Data for all Funds
Derived using CalPERS’ Membership Data for all Funds
Post Retirement Benefit Increase
Contract COLA up to 2.75% until Purchasing Power Protection Allowance Floor on Purchasing Power applies, 2.75% thereafter
Contract COLA up to 2.75% until Purchasing Power Protection Allowance Floor on Purchasing Power applies, 2.75% thereafter
(1) The mortality table used was developed based on CalPERS’ specific data. The table includes 20 years of mortality improvements using Society of Actuaries Scale BB. For more details on this table, please refer to the 2014 experience study report.
94

CITY OF ESCONDIDO Notes to Basic Financial Statements (Continued)
For the Year Ended June 30, 2019
Note 13 – City Employees Retirement Plan (Continued) A. CalPERS (Continued)
Net Pension Liability (Continued) Discount Rate (continued) The long-term expected rate of return on pension plan investments was determined using a building-block method in which best-estimate ranges of expected future real rates of return (expected returns, net of pension plan investment expense and inflation) are developed for each major asset class. In determining the long-term expected rate of return, staff took into account both short-term and long-term market return expectations as well as the expected pension fund (Public Employees’ Retirement Fund) cash flows. Such cash flows were developed assuming that both members and employers will make their required contributions on time and as scheduled in all future years. Using historical returns of all the funds’ asset classes, expected compound (geometric) returns were calculated over the short-term (first 10 years) and the long-term (11-60 years) using a building-block approach. Using the expected nominal returns for both short-term and long-term, the present value of benefits was calculated for each fund. The expected rate of return was set by calculating the single equivalent expected return that arrived at the same present value of benefits for cash flows as the one calculated using both short-term and long-term returns. The expected rate of return was then set equivalent to the single equivalent rate calculated above and rounded down to the nearest one quarter of one percent. The table below reflects long-term expected real rate of return by asset class. The rate of return was calculated using the capital market assumptions applied to determine the discount rate and asset allocation. The target allocation shown was adopted by the Board effective on July 1, 2014.
New Strategic Real Return Real ReturnAssets Class Allocation Years 1 - 10 (1) Years 11+ (2)
Global Equity 50.00% 4.80% 5.98%Global Fixed Income 28.00% 1.00% 2.62%Inflation Sensitive 0.00% 77.00% 1.81%Private Equity 8.00% 6.30% 7.23%Real Assets 13.00% 3.70% 4.93%Liquidity 1.00% -0.92%
(1) An expected inflation of 2.0% used for this period
(2) An expected inflation of 2.92% used for this period
95

CITY OF ESCONDIDO Notes to Basic Financial Statements (Continued)
For the Year Ended June 30, 2019
Note 13 – City Employees Retirement Plan (Continued) A. CalPERS (Continued)
Changes in Net Pension Liability
The following table shows the changes in net pension liability recognized over the measurement period.
Miscellaneous Plan
Total Pension Liability
(a)
Plan Fiduciary Net Position
(b)
Net Pension Liability/(Assets)
(c)=(a)-(b)
Balance at: 6/30/2017 (Valuation Date) (1)
412,473,215$ 277,837,855$ 134,635,360$ Changes Recognized for the Measurement Period:
Service Cost 7,086,737 - 7,086,737 Interest on the Total Pension Liability 28,726,687 - 28,726,687 Changes of Assumptions (2,390,700) - (2,390,700) Difference between Expected and Actual Experience (1,867,216) - (1,867,216) Plan to Plan Resource Movement - (684) 684 Contribution from the Employer - 11,929,230 (11,929,230) Contributions from Employees - 2,810,647 (2,810,647)
Net Investment Income (2)
- 23,296,317 (23,296,317) Benefit Payments including Refunds of Employee Contributions (19,973,641) (19,973,641) - Administrative Expense - (432,948) 432,948 Other Miscellaneous Income/(Expense) - (822,175) 822,175
Net Changes During 2017-18 11,581,867 16,806,746 (5,224,879)
Balance at: 6/30/2018 (Measurement Date) (1)
424,055,082$ 294,644,601$ 129,410,481$
Safety Plan
Total Pension Liability
(a)
Plan Fiduciary Net Position
(b)
Net Pension Liability/(Assets)
(c)=(a)-(b)
Balance at: 6/30/2017 (Valuation Date) (1)
385,539,591$ 268,250,106$ 117,289,485$ Changes Recognized for the Measurement Period:
Service Cost 7,860,653 - 7,860,653 Interest on the Total Pension Liability 26,945,680 - 26,945,680 Changes of Assumptions (1,803,722) - (1,803,722) Difference between Expected and Actual Experience (1,997,161) - (1,997,161) Plan to Plan Resource Movement - (661) 661 Contribution from the Employer - 10,527,707 (10,527,707) Contributions from Employees - 2,757,287 (2,757,287)
Net Investment Income (2)
- 22,392,729 (22,392,729) Benefit Payments including Refunds of Employee Contributions (17,612,750) (17,612,750) - Administrative Expense - (418,008) 418,008 Other Miscellaneous Income/(Expense) - (793,803) 793,803
Net Changes During 2017-18 13,392,700 16,852,501 (3,459,801)
Balance at: 6/30/2018 (Measurement Date) (1)
398,932,291$ 285,102,607$ 113,829,684$
(1)
(2) Net of administrative expenses.
Increase (Decrease)
The fiduciary net position includes receivables for employee service buybacks, deficiency reserves, fiduciary self-insurance and OPEB expense. This may differ from the plan assets reported in the funding actuarial valuation report
96

CITY OF ESCONDIDO Notes to Basic Financial Statements (Continued)
For the Year Ended June 30, 2019
Note 13 – City Employees Retirement Plan (Continued) A. CalPERS (Continued)
Changes in Net Pension Liability (Continued) Sensitivity of the Net Pension Liability to Changes in the Discount Rate
The following presents the net pension liability of the Plan as of the measurement date, calculated using the discount rate of 7.15 percent, as well as what the net pension liability would be if it were calculated using a discount rate that is 1 percentage-point lower (6.15 percent) or 1 percentage-point higher (8.15 percent) than the current rate:
Pension Plan Fiduciary Net Position
Detailed information about the plan’s fiduciary net position is available in the separately issued CalPERS financial report.
Pension Expense and Deferred Outflows and Deferred Inflows of Resources Related to Pensions
For the measurement period ending June 30, 2018, the City incurred a pension expense of $11,929,225 and $10,527,706 for Miscellaneous and Safety plans, respectively.
As of measurement date of June 30, 2018, the City has deferred outflows and deferred inflows of resources related to pensions as follows:
The amounts above are net of outflows and inflows recognized in the 2017-18 measurement period expense.
Discount Rate - 1% (6.15% )
Current Discount Rate (7.15% )
Discount Rate +1%(8.15% )
Miscellaneous Plan 183,436,597$ 129,410,481$ 84,472,753$ Safety Plan 170,085,808 113,829,684 67,860,205
Total Plans 353,522,405$ 243,240,165$ 152,332,958$
Deferred Outflows Deferred Inflows Deferred Outflows Deferred Inflows
of Resources of Resources of Resources of Resources
Pension contributions made after measurement date 13,300,378$ -$ 11,295,735$ -$
Changes of Assumptions 5,322,682 - 10,230,674 -
Differences between Expected and Actual Experiences - (1,574,421) 91,632 - Net Difference between Projected and Actual Earnings on Pension Plan Investments 776,638 - 1,062,435 -
19,399,698$ (1,574,421)$ 22,680,476$ -$
Miscellaneous Plan Safety Plan
97

CITY OF ESCONDIDO Notes to Basic Financial Statements (Continued)
For the Year Ended June 30, 2019
Note 13 – City Employees Retirement Plan (Continued) A. CalPERS (Continued)
Pension Expense and Deferred Outflows and Deferred Inflows of Resources Related to Pensions (Continued) The expected average remaining service lifetime (“EARSL”) is calculated by dividing the total future service years by the total number of plan participants (active, inactive, and retired). The EARSL for the miscellaneous plan and safety plan for the 2015-16 measurement period is 3.0 and 4.7 years, which was obtained by dividing the total service years of 5,237 and 2,992 (the sum of remaining service lifetimes of the active employees) by 1,763 and 639 (the total number of participants: active, inactive, and retired), respectively.
The $6,099,320 and $11,384,741 reported as deferred outflows of resources related to pension resulting from the City’s contributions subsequent to the measurement date during the year ended June 30, 2019 will be recognized as a reduction of the net pension liability in the year ended June 30, 2020. Other amounts reported as deferred outflows and deferred inflows of resources related to pensions will be recognized in future pension expense as follows:
B. Defined Contribution Plan In accordance with the Federal Omnibus Budget Reconciliation Act of 1990, the City established pension benefits for all of its part-time employees through Public Agency Retirement Services (PARS) which is a private administrator of pension plans that administers for the City a defined contribution plan, qualifying under sections 401 and 501 of the Internal Revenue Code. PARS acts as a common investment and administrative agent for participating public entities within the State of California. In a defined contribution plan, benefits depend solely on amounts contributed to the plan plus investment earnings. The City by Council action and agreements with labor bargaining units has the authority to establish or amend the plan provisions and contribution requirements, subject to the constraints and limitations imposed by PARS as a part of the plan design options it offers to participating employers. For the year ended June 30, 2019, the City's total covered payroll was $2,090,762. The City made employer contributions of $0, and employees contributed $156,810 (7.5 percent of covered payroll). All eligible employees are covered by the plan and are fully vested. Employer liabilities are limited to the amount of current contributions. The plan covers part-time, seasonal, or temporary employees, and all employees not covered by another retirement system, subject to the requirements of Section 3121 of the Internal Revenue Code.
Deferred DeferredMeasurement Outflows/(Inflows) Outflows/(Inflows)Period Ended of Resources of Resources
June 30: Miscellaneous Plan Safety Plan
2019 8,682,832$ 8,133,381$ 2020 (606,569) 5,572,729 2021 (2,814,198) (1,141,175) 2022 (737,166) (1,180,194) 2023 - -
Thereafter - -
Total 4,524,899$ 11,384,741$
98

CITY OF ESCONDIDO Notes to Basic Financial Statements (Continued)
For the Year Ended June 30, 2019
Note 14 – Developer Agreement with Palomar Pomerado Health (Hospital) On February 8, 2006, the City entered into a developer agreement with Palomar Pomerado Health (Hospital). The Hospital made a onetime payment to the City in the amount of $13 million (deposit) for the City to construct certain Citracado Parkway improvements (project). The deposit is to be jointly controlled by the City and the Hospital. The City is entitled to draw from the deposit so long as the funds are used exclusively on the project. At June 30, 2019, the balance is $10,087,925. Note 15 – Contingencies and Commitments A. Litigation
Various claims and suits have been filed against the City in the normal course of business. Although the outcome of these matters is not presently determinable in the opinion of legal counsel, the city believes that the resolutions of these matters will not have a material adverse effect on the financial condition of the City.
B. Grants
Amounts received or receivable from granting agencies are subject to audit and adjustments by grantor agencies. While no matters of non-compliance were disclosed by the audit of the financial statements or single audit of the Federal programs, grantor agencies may subject grant programs to additional compliance tests, which may result in disallowed costs. In the opinion of management, future disallowances of current or prior grant expenditures, if any, would not have material adverse effect on the financial position of the City.
C. Construction Commitments The City has several outstanding or planned construction projects as of June 30, 2019. These projects are evidenced by contractual commitments with contractors. As of June 30, 2019, the City’s outstanding commitments are as follows:
Project Name Contract Amount
Expenditures to date as of June 30, 2019
Remaining Commitments
Construction of Brine pipeline from Broadway to the HARRF 6,101,371$ $ 5,599,936 501,435$
Recycled Water Easterly Main and Tanks Project 9,652,000 2,481,504 7,170,496
2018 Street Rehabilitation and Maintenance Project 5,536,819 4,895,313 641,506
Storm Drain Lining and Rehabilitation 841,310 - 841,310
Spruce Street Channel Improvement Project and Escondido Transit Center Active Transportation Connections Project 3,523,810 - 3,523,810
99

CITY OF ESCONDIDO Notes to Basic Financial Statements (Continued)
For the Year Ended June 30, 2019
Note 16 – Subsequent Events 2019 Water System Revenue Refunding Bonds – Series A & B On October 23, 2019, the City Council and Joint Powers Financing Authority approved the issuance and sale of the Water System Revenue Refunding Bonds, Series 2019A, in an amount not to exceed $26,000,000, and the Water System Revenue Refunding Taxable Bonds, Series 2019B, in an amount not to exceed $30,000,000. The net proceeds of the Water System Refunding Revenue Bonds, Series 2019A are being used to redeem the entirety of the 2007 Water Revenue Certificates of Participation outstanding issues, pay administrative and issuance costs associated with the refunding bonds, and fund any necessary reserves. The net proceeds of the taxable Water System Refunding Revenue Bonds, Series 2019B are being used to redeem the entirety of the 2012 Revenue Water System Financing Bonds outstanding issues, pay administrative and issuance costs associated with the refunding bonds, and fund any necessary reserves. The Preliminary Offering Statement was released in November 2019 with an anticipated total net present value savings of $7.9 million.
100

Required Supplementary Information
101

Original Final Variance
Budget Budget Over
Amounts Amounts Actual (Under)
REVENUES:
Sales tax 38,519,970$ 38,223,750$ 38,678,931$ 455,181$
Property taxes 27,489,000 27,737,000 27,957,109 220,109
Other taxes 13,641,000 12,870,000 12,362,304 (507,696)
Licenses and permits 1,319,000 1,024,000 888,019 (135,981)
Fines and forfeits 1,151,000 1,231,000 1,257,729 26,729
Intergovernmental 3,584,000 4,199,000 3,612,476 (586,524)
Charges for services 10,879,500 12,908,715 12,996,241 87,526
Lease income 3,844,000 3,844,000 3,827,550 (16,450)
Investment income 235,000 465,000 1,521,540 1,056,540
Miscellaneous 370,000 370,000 428,545 58,545
Total revenues 101,032,470 102,872,465 103,530,444 657,979
EXPENDITURES:
General Government
City council 305,535 305,535 281,655 (23,880)
City manager 1,022,775 1,181,890 1,181,855 (35)
City attorney 162,080 191,355 179,004 (12,351)
City clerk 568,790 599,160 536,930 (62,230)
City treasurer 282,465 282,465 197,406 (85,059)
Finance 1,301,225 1,445,030 1,041,288 (403,742)
Human resources 613,725 623,980 526,360 (97,620)
Information systems 1,688,465 1,874,310 1,618,475 (255,835)
Other general government 1,655,910 877,245 762,879 (114,366)
Public Safety
Police 43,022,578 43,134,683 42,975,496 (159,187)
Fire 24,294,960 25,656,755 25,654,663 (2,092)
Public Works
Public works 12,477,834 12,831,484 12,678,893 (152,591)
Community Services
Library 3,401,520 3,515,750 3,359,360 (156,390)
Community services 6,477,725 6,480,770 6,212,963 (267,807)
Community relations 92,170 92,170 32,000 (60,170)
Community Development
Planning 2,338,250 2,352,160 1,817,858 (534,302)
Code enforcement 1,263,355 1,233,915 1,179,402 (54,513)
Building 1,070,870 1,074,610 1,011,378 (63,232)
Capital Outlay 91,680 91,680 91,680 -
Debt Service:
Principal retirements 527,985 527,985 528,413 428
Interest and fiscal charges 108,690 108,690 109,268 578
Total expenditures 102,768,587 104,481,622 101,977,226 (2,504,396)
CITY OF ESCONDIDO
Required Supplementary Information
General Fund
Budgetary Comparison Schedule
For the Year Ended June 30, 2019
102

Original Final Variance
Budget Budget Over
Amounts Amounts Actual (Under)
EXCESS (DEFICIENCY) OF REVENUES
OVER EXPENDITURES (1,736,117) (1,609,157) 1,553,218 3,162,375
OTHER FINANCING SOURCES (USES)
Sale of capital assets 100,000 - - -
Transfers in 2,080,000 2,080,000 2,080,000 -
Transfers (out) (4,256,805) (3,837,916) (3,837,916) -
Total other financial sources (uses) (2,076,805) (1,757,916) (1,757,916) -
NET CHANGE IN FUND BALANCE (3,812,922) (3,367,073) (204,698) 3,162,375
FUND BALANCE:
Beginning of Year 33,983,800 33,983,800 33,983,800 -
End of Year 30,170,878$ 30,616,727$ 33,779,102$ 3,162,375$
CITY OF ESCONDIDO
Required Supplementary Information
General Fund
Budgetary Comparison Schedule (Continued)
For the Year Ended June 30, 2019
103

Original Final Variance
Budget Budget Over
Amounts Amounts Actual (Under)
REVENUES:
Lease income 184,750$ 184,750$ 171,379$ (13,371)$
Investment income - - 492,885 492,885
Miscellaneous - - 210,143 210,143
Total revenues 184,750 184,750 874,407 689,657
EXPENDITURES:
Current:
Community development 480,290 480,290 427,240 (53,050)
Total expenditures 480,290 480,290 427,240 (53,050)
EXCESS (DEFICIENCY) OF REVENUES
OVER EXPENDITURES (295,540) (295,540) 447,167 742,707
OTHER FINANCING SOURCES (USES)
Transfers in 954,046 954,046 954,046 -
Total other financing sources (uses) 954,046 954,046 954,046 -
NET CHANGE IN FUND BALANCE 658,506 658,506 1,401,213 742,707
FUND BALANCE:
Beginning of Year 42,900,263 42,900,263 42,900,263 -
End of Year 43,558,769$ 43,558,769$ 44,301,476$ 742,707$
CITY OF ESCONDIDO
Required Supplementary Information
Successor Agency Housing Fund
Budgetary Comparison Schedule
For the Year Ended June 30, 2019
104
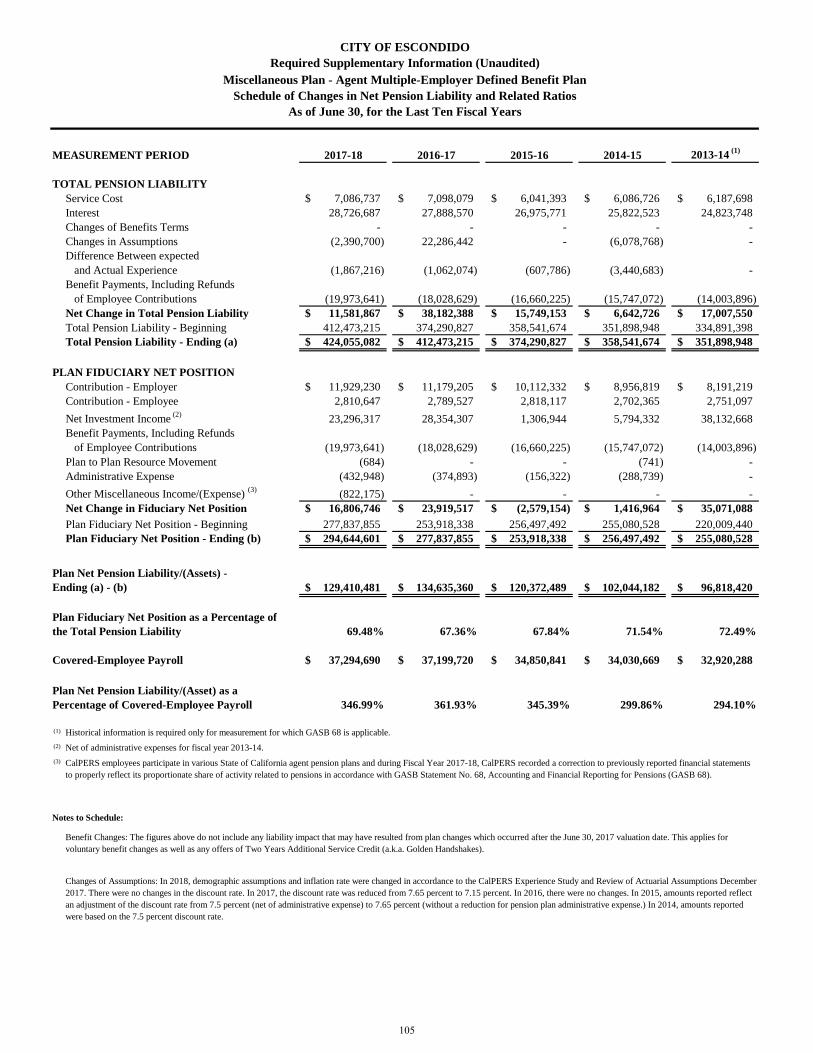
MEASUREMENT PERIOD 2017-18 2016-17 2015-16 2014-15 2013-14 (1)
TOTAL PENSION LIABILITY
Service Cost 7,086,737$ 7,098,079$ 6,041,393$ 6,086,726$ 6,187,698$
Interest 28,726,687 27,888,570 26,975,771 25,822,523 24,823,748
Changes of Benefits Terms - - - - -
Changes in Assumptions (2,390,700) 22,286,442 - (6,078,768) -
Difference Between expected
and Actual Experience (1,867,216) (1,062,074) (607,786) (3,440,683) -
Benefit Payments, Including Refunds
of Employee Contributions (19,973,641) (18,028,629) (16,660,225) (15,747,072) (14,003,896)
Net Change in Total Pension Liability 11,581,867$ 38,182,388$ 15,749,153$ 6,642,726$ 17,007,550$
Total Pension Liability - Beginning 412,473,215 374,290,827 358,541,674 351,898,948 334,891,398
Total Pension Liability - Ending (a) 424,055,082$ 412,473,215$ 374,290,827$ 358,541,674$ 351,898,948$
PLAN FIDUCIARY NET POSITION
Contribution - Employer 11,929,230$ 11,179,205$ 10,112,332$ 8,956,819$ 8,191,219$
Contribution - Employee 2,810,647 2,789,527 2,818,117 2,702,365 2,751,097
Net Investment Income (2)
23,296,317 28,354,307 1,306,944 5,794,332 38,132,668
Benefit Payments, Including Refunds
of Employee Contributions (19,973,641) (18,028,629) (16,660,225) (15,747,072) (14,003,896)
Plan to Plan Resource Movement (684) - - (741) -
Administrative Expense (432,948) (374,893) (156,322) (288,739) -
Other Miscellaneous Income/(Expense) (3)
(822,175) - - - -
Net Change in Fiduciary Net Position 16,806,746$ 23,919,517$ (2,579,154)$ 1,416,964$ 35,071,088$
Plan Fiduciary Net Position - Beginning 277,837,855 253,918,338 256,497,492 255,080,528 220,009,440
Plan Fiduciary Net Position - Ending (b) 294,644,601$ 277,837,855$ 253,918,338$ 256,497,492$ 255,080,528$
129,410,481$ 134,635,360$ 120,372,489$ 102,044,182$ 96,818,420$
69.48% 67.36% 67.84% 71.54% 72.49%
Covered-Employee Payroll 37,294,690$ 37,199,720$ 34,850,841$ 34,030,669$ 32,920,288$
346.99% 361.93% 345.39% 299.86% 294.10%
(1) Historical information is required only for measurement for which GASB 68 is applicable.
(2) Net of administrative expenses for fiscal year 2013-14.
(3)
Notes to Schedule:
Plan Net Pension Liability/(Asset) as a
Percentage of Covered-Employee Payroll
Benefit Changes: The figures above do not include any liability impact that may have resulted from plan changes which occurred after the June 30, 2017 valuation date. This applies for
voluntary benefit changes as well as any offers of Two Years Additional Service Credit (a.k.a. Golden Handshakes).
Changes of Assumptions: In 2018, demographic assumptions and inflation rate were changed in accordance to the CalPERS Experience Study and Review of Actuarial Assumptions December
2017. There were no changes in the discount rate. In 2017, the discount rate was reduced from 7.65 percent to 7.15 percent. In 2016, there were no changes. In 2015, amounts reported reflect
an adjustment of the discount rate from 7.5 percent (net of administrative expense) to 7.65 percent (without a reduction for pension plan administrative expense.) In 2014, amounts reported
were based on the 7.5 percent discount rate.
CITY OF ESCONDIDO
Required Supplementary Information (Unaudited)
Miscellaneous Plan - Agent Multiple-Employer Defined Benefit Plan
Schedule of Changes in Net Pension Liability and Related Ratios
As of June 30, for the Last Ten Fiscal Years
Plan Fiduciary Net Position as a Percentage of
the Total Pension Liability
CalPERS employees participate in various State of California agent pension plans and during Fiscal Year 2017-18, CalPERS recorded a correction to previously reported financial statements
to properly reflect its proportionate share of activity related to pensions in accordance with GASB Statement No. 68, Accounting and Financial Reporting for Pensions (GASB 68).
Plan Net Pension Liability/(Assets) -
Ending (a) - (b)
105

MEASUREMENT PERIOD 2017-18 2016-17 2015-16 2014-15 2013-14 (1)
TOTAL PENSION LIABILITY
Service Cost 7,860,653$ 7,712,365$ 6,945,677$ 6,321,850$ 5,878,133$
Interest 26,945,680 26,029,723 25,001,133 23,398,715 22,099,344
Changes of Benefits Terms - - - - -
Changes in Assumptions (1,803,722) 22,546,727 - (5,933,256) -
Difference Between expected
and Actual Experience (1,997,161) (1,522,544) 5,753,055 2,817,273 -
Benefit Payments, Including Refunds
of Employee Contributions (17,612,750) (16,796,782) (15,432,111) (14,245,717) (13,505,688)
Net Change in Total Pension Liability 13,392,700$ 37,969,489$ 22,267,754$ 12,358,865$ 14,471,789$
Total Pension Liability - Beginning 385,539,591 347,570,102 325,302,348 312,943,483 298,471,694
Total Pension Liability - Ending (a) 398,932,291$ 385,539,591$ 347,570,102$ 325,302,348$ 312,943,483$
PLAN FIDUCIARY NET POSITION
Contribution - Employer 10,527,707$ 9,490,834$ 9,136,622$ 9,066,062$ 7,687,967$
Contribution - Employee 2,757,287 2,397,909 2,460,227 2,322,205 2,079,491
Net Investment Income (2)
22,392,729 27,240,685 1,283,251 5,455,063 36,944,486
Benefit Payments, Including Refunds
of Employee Contributions (17,612,750) (16,796,782) (15,432,111) (14,245,717) (13,505,688)
Plan to Plan Resource Movement (661) - - - -
Administrative Expense (418,008) (363,617) (151,743) (280,190) -
Other Miscellaneous Income/(Expense) (3)
(793,803) - - - -
Net Change in Fiduciary Net Position 16,852,501$ 21,969,029$ (2,703,754)$ 2,317,423$ 33,206,256$
Plan Fiduciary Net Position - Beginning 268,250,106 246,281,077 248,984,831 246,667,408 213,461,153
Plan Fiduciary Net Position - Ending (b) 285,102,607$ 268,250,106$ 246,281,077$ 248,984,831$ 246,667,409$
113,829,684$ 117,289,485$ 101,289,025$ 76,317,517$ 66,276,074$
71.47% 69.58% 70.86% 76.54% 78.82%
Covered-Employee Payroll 25,864,216$ 25,070,264$ 25,315,004$ 23,096,046$ 20,583,139$
440.10% 467.84% 400.11% 330.44% 321.99%
(1) Historical information is required only for measurement for which GASB 68 is applicable.
(2) Net of administrative expenses for fiscal year 2013-14.
(3)
Notes to Schedule:
Benefit Changes: The figures above do not include any liability impact that may have resulted from plan changes which occurred after the June 30, 2017 valuation date. This applies for
voluntary benefit changes as well as any offers of Two Years Additional Service Credit (a.k.a. Golden Handshakes).
Changes of Assumptions: In 2018, demographic assumptions and inflation rate were changed in accordance to the CalPERS Experience Study and Review of Actuarial Assumptions
December 2017. There were no changes in the discount rate. In 2017, the discount rate was reduced from 7.65 percent to 7.15 percent. In 2016, there were no changes. In 2015, amounts
reported reflect an adjustment of the discount rate from 7.5 percent (net of administrative expense) to 7.65 percent (without a reduction for pension plan administrative expense.) In 2014,
amounts reported were based on the 7.5 percent discount rate.
Plan Net Pension Liability/(Asset) as a
Percentage of Covered-Employee Payroll
CITY OF ESCONDIDO
Required Supplementary Information (Unaudited) (Continued)
Safety Plan - Agent Multiple-Employer Defined Benefit Plan
Schedule of Changes in Net Pension Liability and Related Ratios
As of June 30, for the Last Ten Fiscal Years
Plan Fiduciary Net Position as a Percentage of
the Total Pension Liability
CalPERS employees participate in various State of California agent pension plans and during Fiscal Year 2017-18, CalPERS recorded a correction to previously reported financial statements
to properly reflect its proportionate share of activity related to pensions in accordance with GASB Statement No. 68, Accounting and Financial Reporting for Pensions (GASB 68).
Plan Net Pension Liability/(Assets) -
Ending (a) - (b)
106
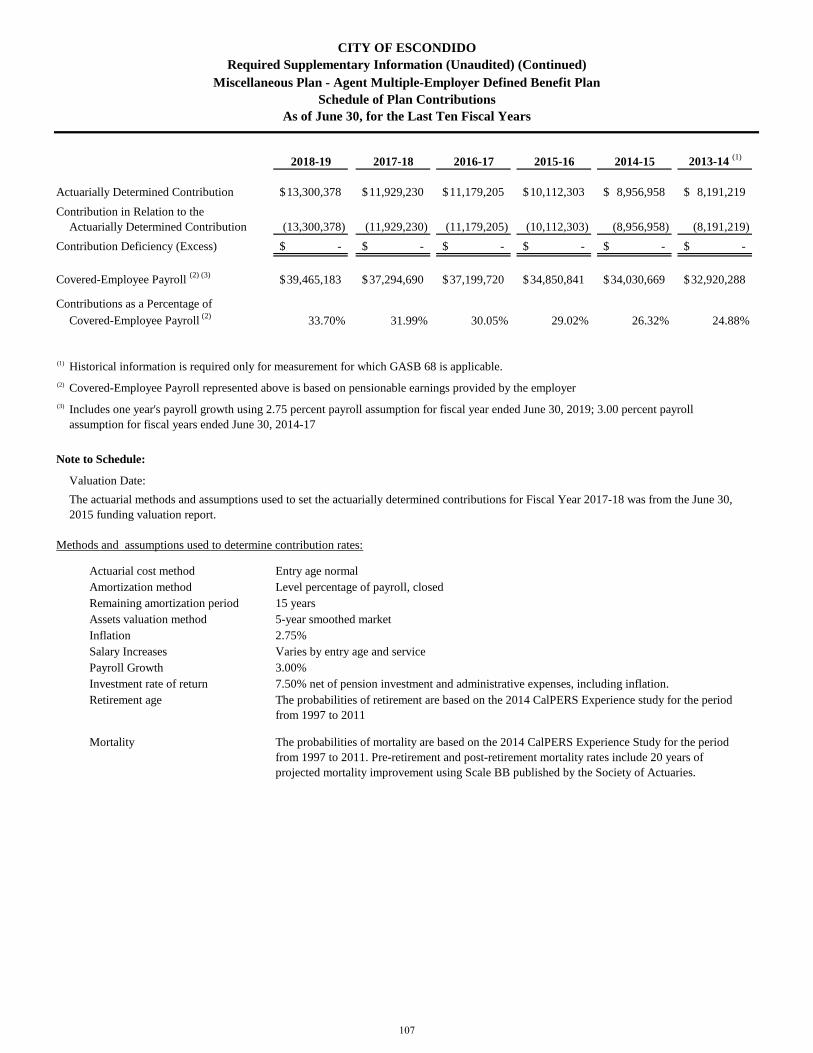
2018-19 2017-18 2016-17 2015-16 2014-15 2013-14 (1)
Actuarially Determined Contribution 13,300,378$ 11,929,230$ 11,179,205$ 10,112,303$ 8,956,958$ 8,191,219$
Contribution in Relation to the
Actuarially Determined Contribution (13,300,378) (11,929,230) (11,179,205) (10,112,303) (8,956,958) (8,191,219)
Contribution Deficiency (Excess) -$ -$ -$ -$ -$ -$
Covered-Employee Payroll (2) (3)
39,465,183$ 37,294,690$ 37,199,720$ 34,850,841$ 34,030,669$ 32,920,288$
Contributions as a Percentage of
Covered-Employee Payroll (2)
33.70% 31.99% 30.05% 29.02% 26.32% 24.88%
(1)
(2)
(3)
Note to Schedule:
Valuation Date:
Methods and assumptions used to determine contribution rates:
Actuarial cost method Entry age normal
Amortization method Level percentage of payroll, closed
Remaining amortization period 15 years
Assets valuation method 5-year smoothed market
Inflation 2.75%
Salary Increases Varies by entry age and service
Payroll Growth 3.00%
Investment rate of return
Retirement age
Mortality
The probabilities of retirement are based on the 2014 CalPERS Experience study for the period
from 1997 to 2011
The probabilities of mortality are based on the 2014 CalPERS Experience Study for the period
from 1997 to 2011. Pre-retirement and post-retirement mortality rates include 20 years of
projected mortality improvement using Scale BB published by the Society of Actuaries.
As of June 30, for the Last Ten Fiscal Years
Historical information is required only for measurement for which GASB 68 is applicable.
Covered-Employee Payroll represented above is based on pensionable earnings provided by the employer
Includes one year's payroll growth using 2.75 percent payroll assumption for fiscal year ended June 30, 2019; 3.00 percent payroll
assumption for fiscal years ended June 30, 2014-17
7.50% net of pension investment and administrative expenses, including inflation.
CITY OF ESCONDIDO
Miscellaneous Plan - Agent Multiple-Employer Defined Benefit Plan
Schedule of Plan Contributions
Required Supplementary Information (Unaudited) (Continued)
The actuarial methods and assumptions used to set the actuarially determined contributions for Fiscal Year 2017-18 was from the June 30,
2015 funding valuation report.
107

2018-19 2017-18 2016-17 2015-16 2014-15 2013-14 (1)
Actuarially Determined Contribution 11,295,735$ 10,527,707$ 9,490,834$ 9,136,624$ 9,066,062$ 7,687,967$
Contribution in Relation to the
Actuarially Determined Contribution (11,295,735) (10,527,707) (9,490,834) (9,136,624) (9,066,062) (7,687,967)
Contribution Deficiency (Excess) -$ -$ -$ -$ -$ -$
Covered-Employee Payroll (2) (3)
26,597,043$ 25,864,216$ 25,070,264$ 21,836,652$ 23,096,046$ 20,583,139$
Contributions as a Percentage of
Covered-Employee Payroll (2)
42.47% 40.70% 37.86% 41.84% 39.25% 37.35%
(1)
(2)
(3)
Note to Schedule:
Valuation Date:
Methods and assumptions used to determine contribution rates:
Actuarial cost method Entry age normal
Amortization method Level percentage of payroll, closed
Remaining amortization period 15 years
Assets valuation method 5-year smoothed market
Inflation 2.75%
Salary Increases Varies by entry age and service
Payroll Growth 3.00%
Investment rate of return
Retirement age
Mortality
CITY OF ESCONDIDO
Required Supplementary Information (Unaudited) (Continued)
Safety Plan - Agent Multiple-Employer Defined Benefit Plan
Schedule of Plan Contributions
As of June 30, for the Last Ten Fiscal Years
The probabilities of retirement are based on the 2014 CalPERS Experience study for the period
from 1997 to 2011
The probabilities of mortality are based on the 2014 CalPERS Experience Study for the period
from 1997 to 2011. Pre-retirement and post-retirement mortality rates include 20 years of
projected mortality improvement using Scale BB published by the Society of Actuaries.
Historical information is required only for measurement for which GASB 68 is applicable.
Covered-Employee Payroll represented above is based on pensionable earnings provided by the employer
Includes one year's payroll growth using 2.75 percent payroll assumption for fiscal year ended June 30, 2019; 3.00 percent payroll
assumption for fiscal years ended June 30, 2014-17
The actuarial methods and assumptions used to set the actuarially determined contributions for Fiscal Year 2017-18 was from the June 30,
2015 funding valuation report.
7.50% net of pension investment and administrative expenses, including inflation.
108

CITY OF ESCONDIDO Notes to Required Supplementary Information
June 30, 2019
Budgetary Information The City adopts an annual operating budget prepared on the modified accrual basis for its general, certain special revenue, and certain debt service funds. Under Section 2-59 of the Escondido City Code, the City Manager is required to prepare and submit to the City Council the annual budget of the City and administer it after adoption. Each year, the City Manager submits a proposed budget to the City Council in May. The City Council holds budget hearings in June and the final budget is adopted by the City Council before June 30. The legal level of budgetary control is at the fund level. The City Manager is authorized to transfer budgeted amounts between the accounts of any fund; however, any revisions that alter the total appropriations of any fund must be approved by City Council. No budgetary comparisons are presented for certain special revenue, certain debt service, capital projects, or proprietary funds as the City is not legally required to adopt an annual budget for those funds. The special revenue funds with legally adopted budgets include the: Successor Agency Housing, Street, Community Services, Community Development Block Grant, Landscape and Assessment District, Law Enforcement, HOME, Miscellaneous Funds and the Vehicle Parking District Fund. The City holds a midyear budget review meeting at which time revenue and expenditure projections are reviewed. Any necessary changes are approved by the City Council. Prior period appropriations lapse unless they are appropriated again through the formal budget process or through the carryover process. The City controls its expenditures using encumbrance accounting. In addition to the annual operating budget, the City adopts a Five-Year Capital improvement Program. Funds are appropriated for the first year of the plan with years two through five included for planning purposes. Funds are appropriated on a project basis and are carried over until expended or the project is closed. The legal level of budgetary control is at the project level. The City Manager is authorized to transfer budgeted amounts between projects when transfers are less than $50,000 or 10% of the project. Transfers in excess of the budget policy amount must be approved by the City Council.
109

Supplementary Information
110

CITY OF ESCONDIDO Non-Major Governmental Funds
SPECIAL REVENUE FUNDS
STREET FUND
This fund was established to account for transactions related to:
Gasoline taxes received under Sections 2103, 2105, 2106, 2107, and 2107.5 of the Streets and Highways Code. These funds are utilized solely for street-related purposes such as new construction, rehabilitation, or maintenance.
Revenues allocated to the City based on section 2031 of the Streets & Highway Code and the Road Repair and Accountability Act of 2017 (SB1 Beall). These revenues come from an additional 12 cent per gallon increase to the gasoline excise tax and additional 20 cent per gallon increase to the diesel fuel excise tax effective November 1, 2017. In addition, a "Transportation Improvement Fee" was added to vehicle registrations beginning January 1, 2018.
Traffic impact fees which are collected from developers. These fees are used exclusively for street improvements that are required as the result of growth and development.
COMMUNITY SERVICES FUND
This fund was established to account for transactions related to:
Transactions related to the After School Education & Safety Grant which provides funds to provide safe and educationally enriching alternatives for children and youths during non-school hours
The purchase and development of parks with funding received from park development fees collected from developers.
The revenue received from the sale of mitigation credits. The funds will be used to provide fund restoration projects at Daley Ranch.
The operating activities of the Reidy Creek Golf Course
COMMUNITY DEVELOPMENT BLOCK GRANT FUND
This fund was created to account for transactions related to the Community Development Block Grant provided by the Federal Government. The resources are expended for community development and housing assistance.
LANDSCAPE AND ASSESSMENT DISTRICT FUND
This fund was created to account for transactions related to the maintenance of landscaping in various subdivision areas throughout the City. There are currently 38 active assessment districts.
LAW ENFORCEMENT FUND
This fund was established to account for transactions related to:
Revenue received by the Police Department through the asset forfeiture program. The funds must be used to supplement and enhance existing law enforcement budgets.
Transactions related to the law enforcement grants received from the Federal and State Government. These funds are used to provide front line law enforcement services and must supplement existing services.
111

CITY OF ESCONDIDO Non-Major Governmental Funds
SPECIAL REVENUE FUNDS (continued)
HOME FUND
This fund was created to account for transactions related to the HOME grant provided by the Department of Housing and Urban Development (HUD). The resources are expended for affordable housing programs.
MISCELLANEOUS FUND
This fund was established to account for transactions related to:
Public art fees, which are assessed when development occurs. The funds will be used to provide public art throughout the city.
General reimbursable grants received and restricted by outside sources including federal, state, county, and local agencies.
Monies received from the Frances B. Ryan Trust. The Trust was established to create the Pioneer Room, a historical perspective of Escondido, and to provide financing for its ongoing operation.
VEHICLE PARKING DISTRICT FUND
This fund was established to account for transactions related to the maintenance and operation of the City-owned public parking lots. Funding was historically provided by parking permit revenues and is currently supported by transfers from the General Fund.
DEBT SERVICE FUNDS
GENERAL OBLIGATION DEBT SERVICE FUND
This fund was created to account for transactions related to debt issued for the construction of new public safety facilities. On November 2, 2004, Escondido voters approved Proposition P, which authorized the sale of up to $84,350,000 in municipal bonds. Funding is provided through special assessments on the property tax rolls.
GOLF COURSE DEBT SERVICE FUND
This fund was created to account for transactions related to debt issued for the development of two Municipal Golf Courses. Funding is provided by repayment of a loan to American Golf Corporation and a General Fund transfer.
112

CITY OF ESCONDIDO Non-Major Governmental Funds
CAPITAL PROJECT FUNDS
STREET IMPROVEMENT FUND
This fund was created to account for projects related to street improvements such as street-related construction, improvements, and right-of-way acquisitions. Funding is provided from a variety of sources, which include transfers from Gas Tax and Traffic Impact Funds as well as grant funding received from the Department of Transportation.
STORM DRAIN FUND
This fund was created to account for funds collected from developers when projects create a need for improvements to the City’s storm drain basin system. Funds are held until collections for a specific basin make an improvement.
GENERAL CAPITAL PROJECTS FUND
This fund was created to account for transactions related to general capital projects. These projects are typically funded through transfers from General, Public Facilities, and Water and Sewer funds. Project balances may include other funding sources that are restricted in how they can be used.
COUNTY TRANSPORTATION STREET PROJECTS FUND
This fund was established to account for transactions related to the San Diego Transportation Improvement Program Ordinance and Expenditure Plan administered by the San Diego Association of Governments (SANDAG). Allocations are funded by a one-half of one percent Transaction and Use Tax, which was established in 1987 under Proposition-A and extended by voters in November 2004. All resources are legally restricted to expenditures for street, pedestrian, and bicycle transportation programs.
PUBLIC FACILITIES FUND
This fund was created to account for developer fees to ensure public facility standards, established by the City, are met with respect to additional needs that are created as the result of growth and development in the City. The funds collected are restricted in how they can be spent; they cannot be used for operation, maintenance, repair, alteration, or replacement of capital facilities.
PERMANENT FUNDS
DALEY RANCH FUND
This fund was created to fund the City's long-term management and maintenance efforts of Daley Ranch as stated in an agreement with the Wildlife Agencies entered into with the California Department of Fish and Game and the U.S. Fish and Wildlife Services in 1997. Funds are deposited into the Daley Ranch Fund when conservation credits are sold by the City. Interest earned on the funds is available for the management and maintenance of the Conservation Bank in accordance with the Agreement.
113
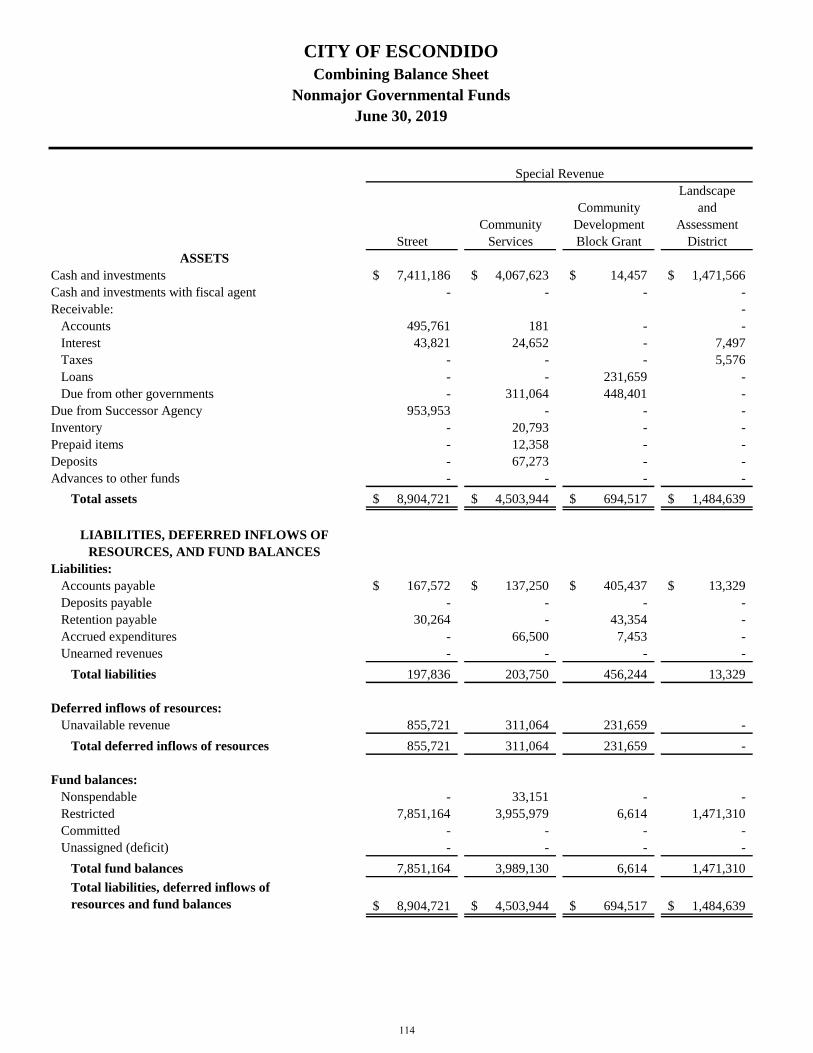
Landscape
Community and
Community Development Assessment
Street Services Block Grant District
ASSETS
Cash and investments 7,411,186$ 4,067,623$ 14,457$ 1,471,566$
Cash and investments with fiscal agent - - - -
Receivable: -
Accounts 495,761 181 - -
Interest 43,821 24,652 - 7,497
Taxes - - - 5,576
Loans - - 231,659 -
Due from other governments - 311,064 448,401 -
Due from Successor Agency 953,953 - - -
Inventory - 20,793 - -
Prepaid items - 12,358 - -
Deposits - 67,273 - -
Advances to other funds - - - -
Total assets 8,904,721$ 4,503,944$ 694,517$ 1,484,639$
LIABILITIES, DEFERRED INFLOWS OF
RESOURCES, AND FUND BALANCES
Liabilities:
Accounts payable 167,572$ 137,250$ 405,437$ 13,329$
Deposits payable - - - -
Retention payable 30,264 - 43,354 -
Accrued expenditures - 66,500 7,453 -
Unearned revenues - - - -
Total liabilities 197,836 203,750 456,244 13,329
Deferred inflows of resources:
Unavailable revenue 855,721 311,064 231,659 -
Total deferred inflows of resources 855,721 311,064 231,659 -
Fund balances:
Nonspendable - 33,151 - -
Restricted 7,851,164 3,955,979 6,614 1,471,310
Committed - - - -
Unassigned (deficit) - - - -
Total fund balances 7,851,164 3,989,130 6,614 1,471,310
Total liabilities, deferred inflows of
resources and fund balances 8,904,721$ 4,503,944$ 694,517$ 1,484,639$
Special Revenue
CITY OF ESCONDIDO
Combining Balance Sheet
Nonmajor Governmental Funds
June 30, 2019
114
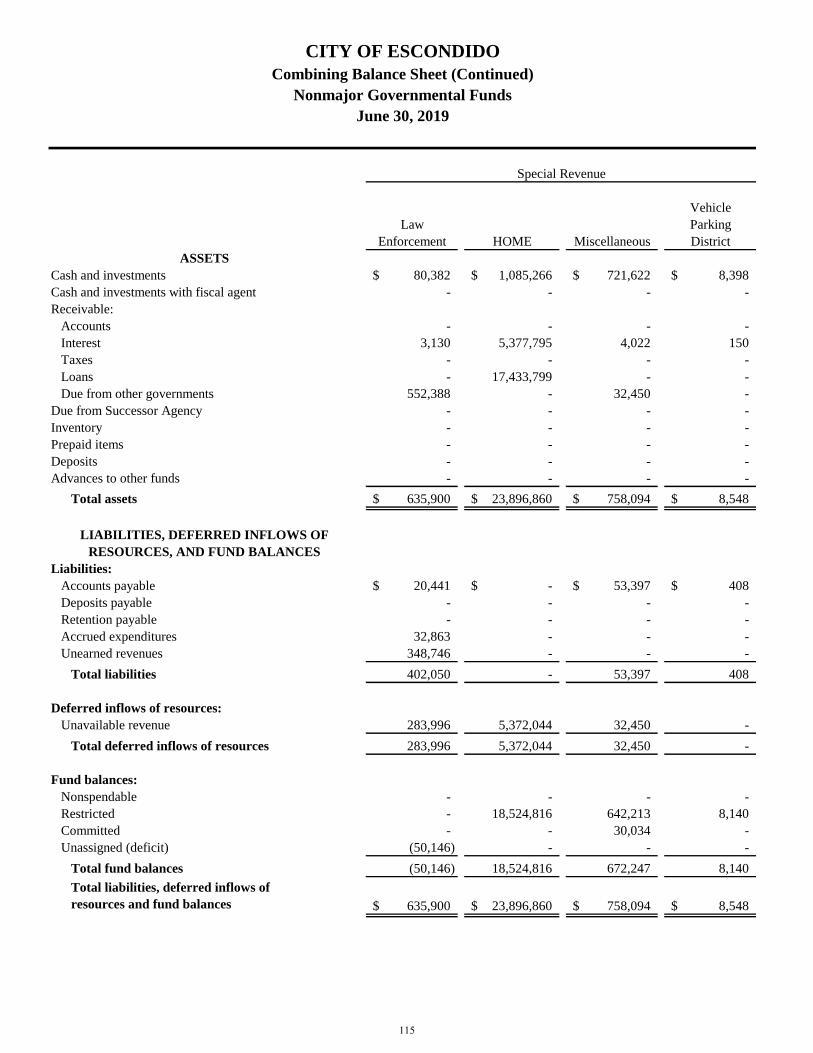
Vehicle
Law Parking
Enforcement HOME Miscellaneous District
ASSETS
Cash and investments 80,382$ 1,085,266$ 721,622$ 8,398$
Cash and investments with fiscal agent - - - -
Receivable:
Accounts - - - -
Interest 3,130 5,377,795 4,022 150
Taxes - - - -
Loans - 17,433,799 - -
Due from other governments 552,388 - 32,450 -
Due from Successor Agency - - - -
Inventory - - - -
Prepaid items - - - -
Deposits - - - -
Advances to other funds - - - -
Total assets 635,900$ 23,896,860$ 758,094$ 8,548$
LIABILITIES, DEFERRED INFLOWS OF
RESOURCES, AND FUND BALANCES
Liabilities:
Accounts payable 20,441$ -$ 53,397$ 408$
Deposits payable - - - -
Retention payable - - - -
Accrued expenditures 32,863 - - -
Unearned revenues 348,746 - - -
Total liabilities 402,050 - 53,397 408
Deferred inflows of resources:
Unavailable revenue 283,996 5,372,044 32,450 -
Total deferred inflows of resources 283,996 5,372,044 32,450 -
Fund balances:
Nonspendable - - - -
Restricted - 18,524,816 642,213 8,140
Committed - - 30,034 -
Unassigned (deficit) (50,146) - - -
Total fund balances (50,146) 18,524,816 672,247 8,140
Total liabilities, deferred inflows of
resources and fund balances 635,900$ 23,896,860$ 758,094$ 8,548$
Special Revenue
CITY OF ESCONDIDO
Combining Balance Sheet (Continued)
Nonmajor Governmental Funds
June 30, 2019
115
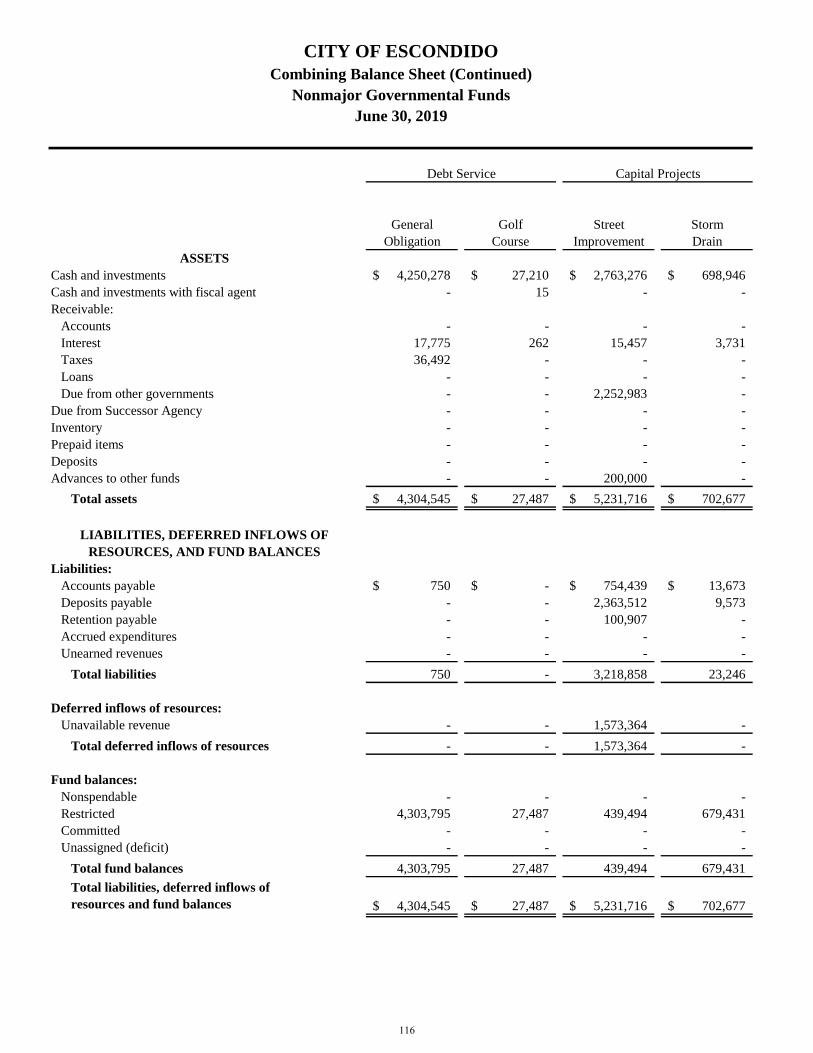
General Golf Street Storm
Obligation Course Improvement Drain
ASSETS
Cash and investments 4,250,278$ 27,210$ 2,763,276$ 698,946$
Cash and investments with fiscal agent - 15 - -
Receivable:
Accounts - - - -
Interest 17,775 262 15,457 3,731
Taxes 36,492 - - -
Loans - - - -
Due from other governments - - 2,252,983 -
Due from Successor Agency - - - -
Inventory - - - -
Prepaid items - - - -
Deposits - - - -
Advances to other funds - - 200,000 -
Total assets 4,304,545$ 27,487$ 5,231,716$ 702,677$
LIABILITIES, DEFERRED INFLOWS OF
RESOURCES, AND FUND BALANCES
Liabilities:
Accounts payable 750$ -$ 754,439$ 13,673$
Deposits payable - - 2,363,512 9,573
Retention payable - - 100,907 -
Accrued expenditures - - - -
Unearned revenues - - - -
Total liabilities 750 - 3,218,858 23,246
Deferred inflows of resources:
Unavailable revenue - - 1,573,364 -
Total deferred inflows of resources - - 1,573,364 -
Fund balances:
Nonspendable - - - -
Restricted 4,303,795 27,487 439,494 679,431
Committed - - - -
Unassigned (deficit) - - - -
Total fund balances 4,303,795 27,487 439,494 679,431
Total liabilities, deferred inflows of
resources and fund balances 4,304,545$ 27,487$ 5,231,716$ 702,677$
Debt Service Capital Projects
CITY OF ESCONDIDO
Combining Balance Sheet (Continued)
Nonmajor Governmental Funds
June 30, 2019
116

Permanent
General County
Capital Transportation Public Daley
Projects Street Projects Facilities Ranch
ASSETS
Cash and investments 1,292,865$ 1,599,600$ 7,298,878$ 345,701$
Cash and investments with fiscal agent - - - -
Receivable:
Accounts - - - -
Interest 6,285 1,593 39,271 1,860
Taxes - - - -
Loans - - 224,405 -
Due from other governments - 85,132 - -
Due from Successor Agency - - - -
Inventory - - - -
Prepaid items - - - -
Deposits - - - -
Advances to other funds - - 45,000 -
Total assets 1,299,150$ 1,686,325$ 7,607,554$ 347,561$
LIABILITIES, DEFERRED INFLOWS OF
RESOURCES, AND FUND BALANCES
Liabilities:
Accounts payable 22,637$ 815,661$ 51,974$ -$
Deposits payable - - -
Retention payable - 656,544 - -
Accrued expenditures - - - -
Unearned revenues - - - -
Total liabilities 22,637 1,472,205 51,974 -
Deferred inflows of resources:
Unavailable revenue - 57,543 - -
Total deferred inflows of resources - 57,543 - -
Fund balances:
Nonspendable - - - 249,022
Restricted 509,850 156,577 7,555,580 98,539
Committed 766,663 - - -
Unassigned (deficit) - - - -
Total fund balances 1,276,513 156,577 7,555,580 347,561
Total liabilities, deferred inflows of
resources and fund balances 1,299,150$ 1,686,325$ 7,607,554$ 347,561$
Capital Projects
CITY OF ESCONDIDO
Combining Balance Sheet (Continued)
Nonmajor Governmental Funds
June 30, 2019
117
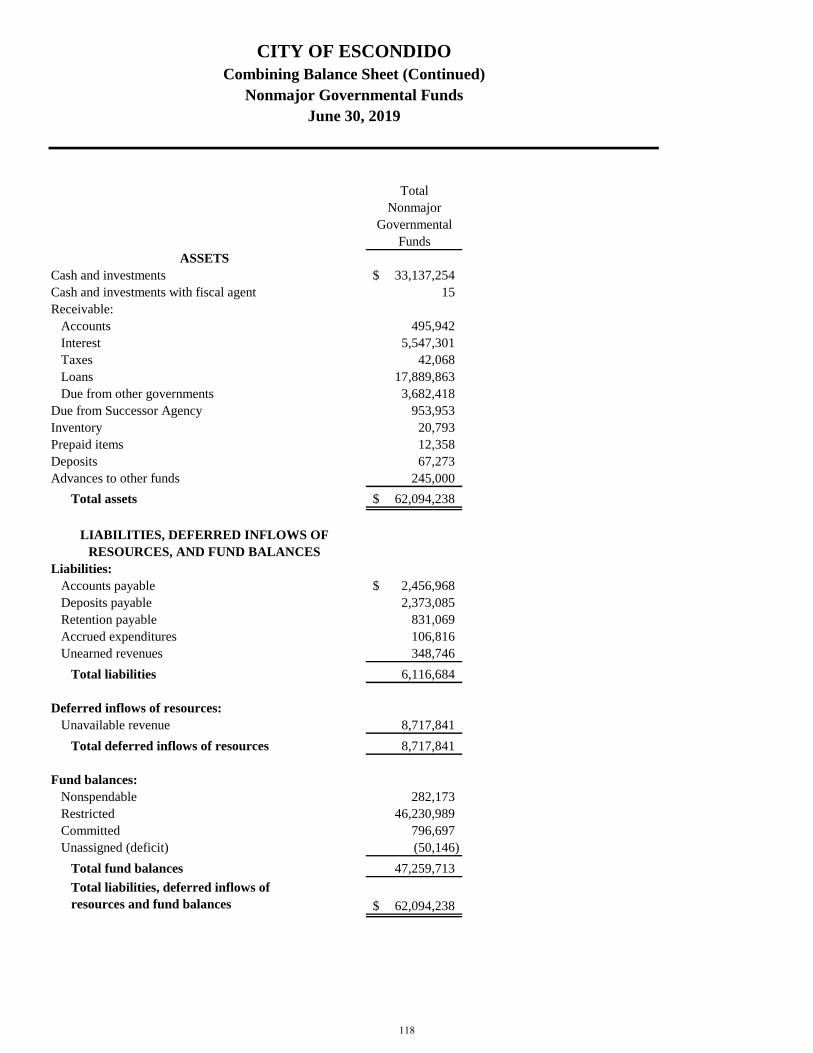
Total
Nonmajor
Governmental
Funds
ASSETS
Cash and investments 33,137,254$
Cash and investments with fiscal agent 15
Receivable:
Accounts 495,942
Interest 5,547,301
Taxes 42,068
Loans 17,889,863
Due from other governments 3,682,418
Due from Successor Agency 953,953
Inventory 20,793
Prepaid items 12,358
Deposits 67,273
Advances to other funds 245,000
Total assets 62,094,238$
LIABILITIES, DEFERRED INFLOWS OF
RESOURCES, AND FUND BALANCES
Liabilities:
Accounts payable 2,456,968$
Deposits payable 2,373,085
Retention payable 831,069
Accrued expenditures 106,816
Unearned revenues 348,746
Total liabilities 6,116,684
Deferred inflows of resources:
Unavailable revenue 8,717,841
Total deferred inflows of resources 8,717,841
Fund balances:
Nonspendable 282,173
Restricted 46,230,989
Committed 796,697
Unassigned (deficit) (50,146)
Total fund balances 47,259,713
Total liabilities, deferred inflows of
resources and fund balances 62,094,238$
CITY OF ESCONDIDO
Combining Balance Sheet (Continued)
Nonmajor Governmental Funds
June 30, 2019
118

Landscape
Community and
Community Development Assessment
Street Services Block Grant District
REVENUES:
Property taxes -$ -$ -$ -$
Other taxes - - - -
Intergovernmental 5,730,222 690,850 1,904,989 -
Charges for services 702,241 590,786 - -
Special assessments - - - 831,574
Investment income 237,278 166,613 - 24,241
Miscellaneous 170,822 - 1,250 8,430
Total revenues 6,840,563 1,448,249 1,906,239 864,245
EXPENDITURES:
Current:
General government - - - -
Public safety - - - -
Public works 2,809,483 - - 817,274
Community services - 1,711,863 949,148 -
Community development - - - -
Capital outlay 670,598 164,533 968,247 -
Debt services:
Principal retirements - - - -
Interest and fiscal charges - - - -
Total expenditures 3,480,081 1,876,396 1,917,395 817,274
EXCESS (DEFICIENCY) OF REVENUES
OVER EXPENDITURES 3,360,482 (428,147) (11,156) 46,971
OTHER FINANCING SOURCES (USES)
Transfers in - 118,210 - -
Transfers out (2,055,000) - - -
Total other financing sources (uses) (2,055,000) 118,210 - -
NET CHANGE IN FUND BALANCES 1,305,482 (309,937) (11,156) 46,971
FUND BALANCES:
Beginning of year 6,545,682 4,299,067 17,770 1,424,339
End of year 7,851,164$ 3,989,130$ 6,614$ 1,471,310$
Special Revenue
CITY OF ESCONDIDO
Combining Statement of Revenues, Expenditures, and Changes in Fund Balances
Nonmajor Governmental Funds
For the Year Ended June 30, 2019
119
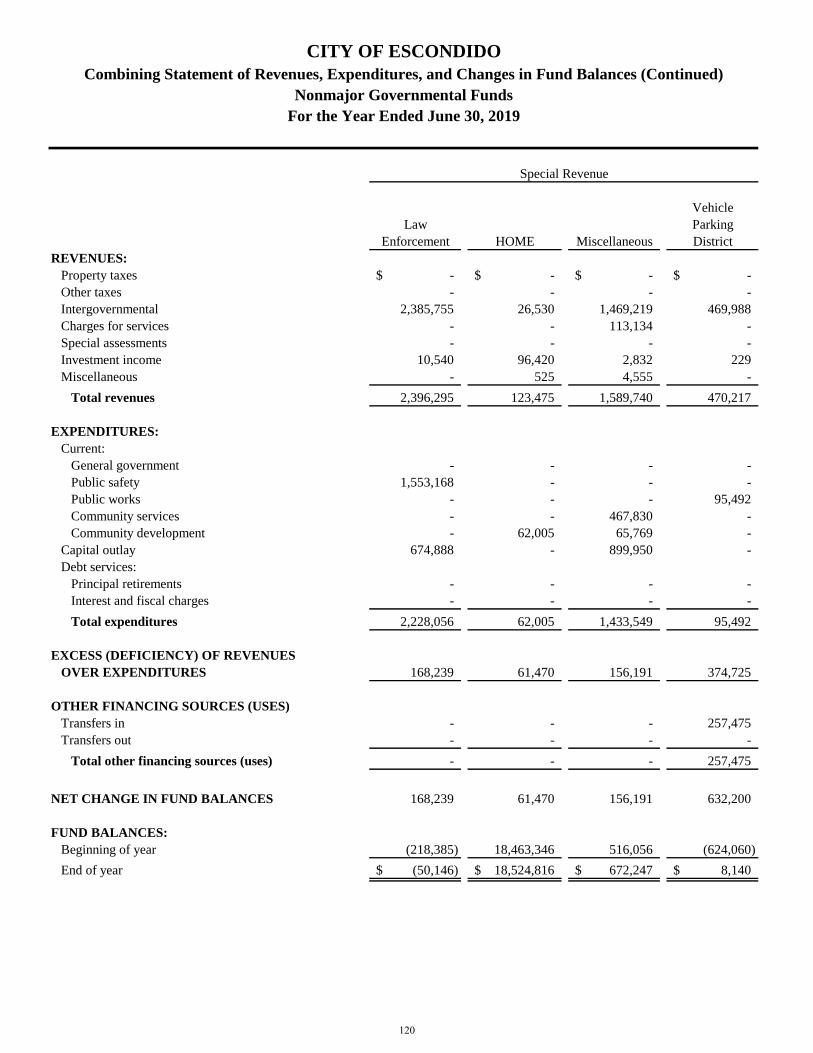
Vehicle
Law Parking
Enforcement HOME Miscellaneous District
REVENUES:
Property taxes -$ -$ -$ -$
Other taxes - - - -
Intergovernmental 2,385,755 26,530 1,469,219 469,988
Charges for services - - 113,134 -
Special assessments - - - -
Investment income 10,540 96,420 2,832 229
Miscellaneous - 525 4,555 -
Total revenues 2,396,295 123,475 1,589,740 470,217
EXPENDITURES:
Current:
General government - - - -
Public safety 1,553,168 - - -
Public works - - - 95,492
Community services - - 467,830 -
Community development - 62,005 65,769 -
Capital outlay 674,888 - 899,950 -
Debt services:
Principal retirements - - - -
Interest and fiscal charges - - - -
Total expenditures 2,228,056 62,005 1,433,549 95,492
EXCESS (DEFICIENCY) OF REVENUES
OVER EXPENDITURES 168,239 61,470 156,191 374,725
OTHER FINANCING SOURCES (USES)
Transfers in - - - 257,475
Transfers out - - - -
Total other financing sources (uses) - - - 257,475
NET CHANGE IN FUND BALANCES 168,239 61,470 156,191 632,200
FUND BALANCES:
Beginning of year (218,385) 18,463,346 516,056 (624,060)
End of year (50,146)$ 18,524,816$ 672,247$ 8,140$
Special Revenue
CITY OF ESCONDIDO
Combining Statement of Revenues, Expenditures, and Changes in Fund Balances (Continued)
Nonmajor Governmental Funds
For the Year Ended June 30, 2019
120
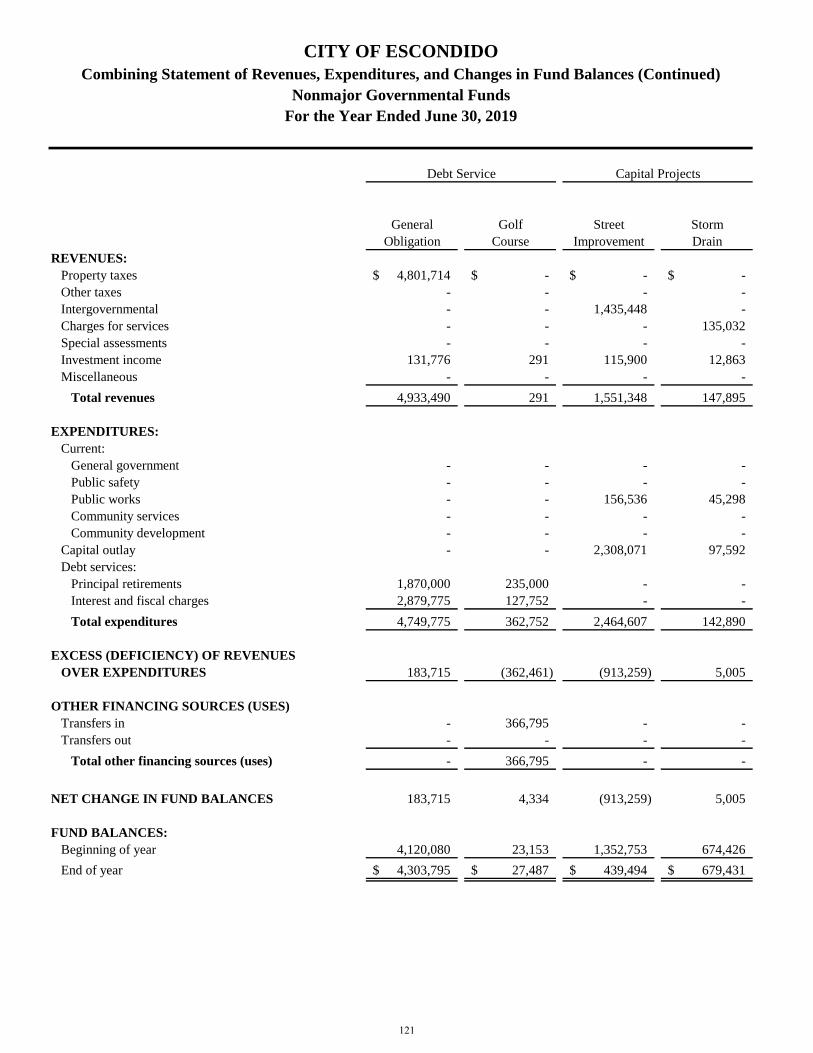
General Golf Street Storm
Obligation Course Improvement Drain
REVENUES:
Property taxes 4,801,714$ -$ -$ -$
Other taxes - - - -
Intergovernmental - - 1,435,448 -
Charges for services - - - 135,032
Special assessments - - - -
Investment income 131,776 291 115,900 12,863
Miscellaneous - - - -
Total revenues 4,933,490 291 1,551,348 147,895
EXPENDITURES:
Current:
General government - - - -
Public safety - - - -
Public works - - 156,536 45,298
Community services - - - -
Community development - - - -
Capital outlay - - 2,308,071 97,592
Debt services:
Principal retirements 1,870,000 235,000 - -
Interest and fiscal charges 2,879,775 127,752 - -
Total expenditures 4,749,775 362,752 2,464,607 142,890
EXCESS (DEFICIENCY) OF REVENUES
OVER EXPENDITURES 183,715 (362,461) (913,259) 5,005
OTHER FINANCING SOURCES (USES)
Transfers in - 366,795 - -
Transfers out - - - -
Total other financing sources (uses) - 366,795 - -
NET CHANGE IN FUND BALANCES 183,715 4,334 (913,259) 5,005
FUND BALANCES:
Beginning of year 4,120,080 23,153 1,352,753 674,426
End of year 4,303,795$ 27,487$ 439,494$ 679,431$
Debt Service Capital Projects
CITY OF ESCONDIDO
Combining Statement of Revenues, Expenditures, and Changes in Fund Balances (Continued)
Nonmajor Governmental Funds
For the Year Ended June 30, 2019
121
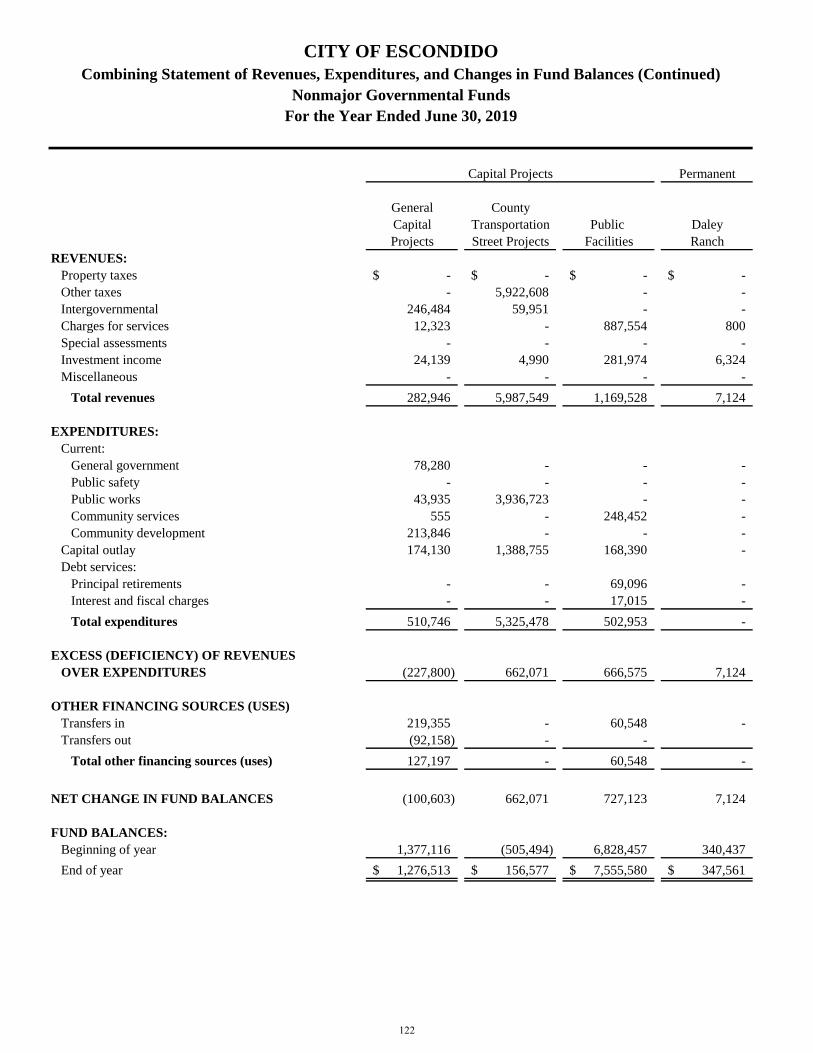
Permanent
General County
Capital Transportation Public Daley
Projects Street Projects Facilities Ranch
REVENUES:
Property taxes -$ -$ -$ -$
Other taxes - 5,922,608 - -
Intergovernmental 246,484 59,951 - -
Charges for services 12,323 - 887,554 800
Special assessments - - - -
Investment income 24,139 4,990 281,974 6,324
Miscellaneous - - - -
Total revenues 282,946 5,987,549 1,169,528 7,124
EXPENDITURES:
Current:
General government 78,280 - - -
Public safety - - - -
Public works 43,935 3,936,723 - -
Community services 555 - 248,452 -
Community development 213,846 - - -
Capital outlay 174,130 1,388,755 168,390 -
Debt services:
Principal retirements - - 69,096 -
Interest and fiscal charges - - 17,015 -
Total expenditures 510,746 5,325,478 502,953 -
EXCESS (DEFICIENCY) OF REVENUES
OVER EXPENDITURES (227,800) 662,071 666,575 7,124
OTHER FINANCING SOURCES (USES)
Transfers in 219,355 - 60,548 -
Transfers out (92,158) - -
Total other financing sources (uses) 127,197 - 60,548 -
NET CHANGE IN FUND BALANCES (100,603) 662,071 727,123 7,124
FUND BALANCES:
Beginning of year 1,377,116 (505,494) 6,828,457 340,437
End of year 1,276,513$ 156,577$ 7,555,580$ 347,561$
Capital Projects
CITY OF ESCONDIDO
Combining Statement of Revenues, Expenditures, and Changes in Fund Balances (Continued)
Nonmajor Governmental Funds
For the Year Ended June 30, 2019
122

Total
Nonmajor
Governmental
Funds
REVENUES:
Property taxes 4,801,714$
Other taxes 5,922,608
Intergovernmental 14,419,436
Charges for services 2,441,870
Special assessments 831,574
Investment income 1,116,410
Miscellaneous 185,582
Total revenues 29,719,194
EXPENDITURES:
Current:
General government 78,280
Public safety 1,553,168
Public works 7,904,741
Community services 3,377,848
Community development 341,620
Capital outlay 7,515,154
Debt services:
Principal retirements 2,174,096
Interest and fiscal charges 3,024,542
Total expenditures 25,969,449
EXCESS (DEFICIENCY) OF REVENUES
OVER EXPENDITURES 3,749,745
OTHER FINANCING SOURCES (USES)
Transfers in 1,022,383
Transfers out (2,147,158)
Total other financing sources (uses) (1,124,775)
NET CHANGE IN FUND BALANCES 2,624,970
FUND BALANCES:
Beginning of year 44,634,743
End of year 47,259,713$
Combining Statement of Revenues, Expenditures, and Changes in Fund Balances (Continued)
CITY OF ESCONDIDO
Nonmajor Governmental Funds
For the Year Ended June 30, 2019
123

Final Variance
Budget Over
Amounts Actual (Under)
REVENUES:
Intergovernmental 5,665,740$ 5,730,222$ 64,482$
Charges for services 2,180,220 702,241 (1,477,979)
Investment income 32,895 237,278 204,383
Miscellaneous - 170,822 170,822
Total revenues 7,878,855 6,840,563 (1,038,292)
EXPENDITURES:
Current:
Public works 3,812,590 2,809,483 (1,003,107)
Community development 592,372 - (592,372)
Capital outlay 7,438,788 670,598 (6,768,190)
Total expenditures 11,843,750 3,480,081 (8,363,669)
EXCESS (DEFICIENCY) OF REVENUES
OVER EXPENDITURES (3,964,895) 3,360,482 (7,325,377)
OTHER FINANCING SOURCES (USES)
Transfers out (2,055,000) (2,055,000) -
Total other financing sources (uses) (2,055,000) (2,055,000) -
NET CHANGE IN FUND BALANCE (6,019,895) 1,305,482 (7,325,377)
FUND BALANCE:
Beginning of year 6,545,682 6,545,682 -
End of year 525,787$ 7,851,164$ (7,325,377)$
CITY OF ESCONDIDO
Schedule of Revenues, Expenditures, and Change in Fund Balance - Budget and Actual
Street Special Revenue Fund
For the Year Ended June 30, 2019
124

Final Variance
Budget Over
Amounts Actual (Under)
REVENUES:
Intergovernmental 931,295$ 690,850$ (240,445)$
Charges for services 2,241,650 590,786 (1,650,864)
Investment income 25,895 166,613 140,718
Total revenues 3,198,840 1,448,249 (1,750,591)
EXPENDITURES:
Current:
Community services 2,118,045 1,711,863 (406,182)
Capital outlay 4,765,763 164,533 (4,601,230)
Total expenditures 6,883,808 1,876,396 (5,007,412)
EXCESS (DEFICIENCY) OF REVENUES
OVER EXPENDITURES (3,684,968) (428,147) (3,256,821)
OTHER FINANCING SOURCES (USES)
Transfers in 118,210 118,210 -
Total other financing sources (uses) 118,210 118,210 -
NET CHANGE IN FUND BALANCE (3,566,758) (309,937) (3,256,821)
FUND BALANCE:
Beginning of year 4,299,067 4,299,067 -
End of year 732,309$ 3,989,130$ (3,256,821)$
CITY OF ESCONDIDO
Schedule of Revenues, Expenditures, and Change in Fund Balance - Budget and Actual
Community Services Special Revenue Fund
For the Year Ended June 30, 2019
125

Final Variance
Budget Over
Amounts Actual (Under)
REVENUES:
Intergovernmental 1,791,465$ 1,904,989$ 113,524$
Miscellaneous - 1,250 1,250
Total revenues 1,791,465 1,906,239 114,774
EXPENDITURES:
Current:
Community services 1,302,386 949,148 (353,238)
Community development 95,000 - (95,000)
Capital outlay 2,471,664 968,247 (1,503,417)
Total expenditures 3,869,050 1,917,395 (1,951,655)
EXCESS (DEFICIENCY) OF REVENUES
OVER EXPENDITURES (2,077,585) (11,156) (2,066,429)
NET CHANGE IN FUND BALANCE (2,077,585) (11,156) (2,066,429)
FUND BALANCE:
Beginning of year 17,770 17,770 -
End of year (2,059,815)$ 6,614$ (2,066,429)$
CITY OF ESCONDIDO
Schedule of Revenues, Expenditures, and Change in Fund Balance - Budget and Actual
Community Development Block Grant Special Revenue Fund
For the Year Ended June 30, 2019
126
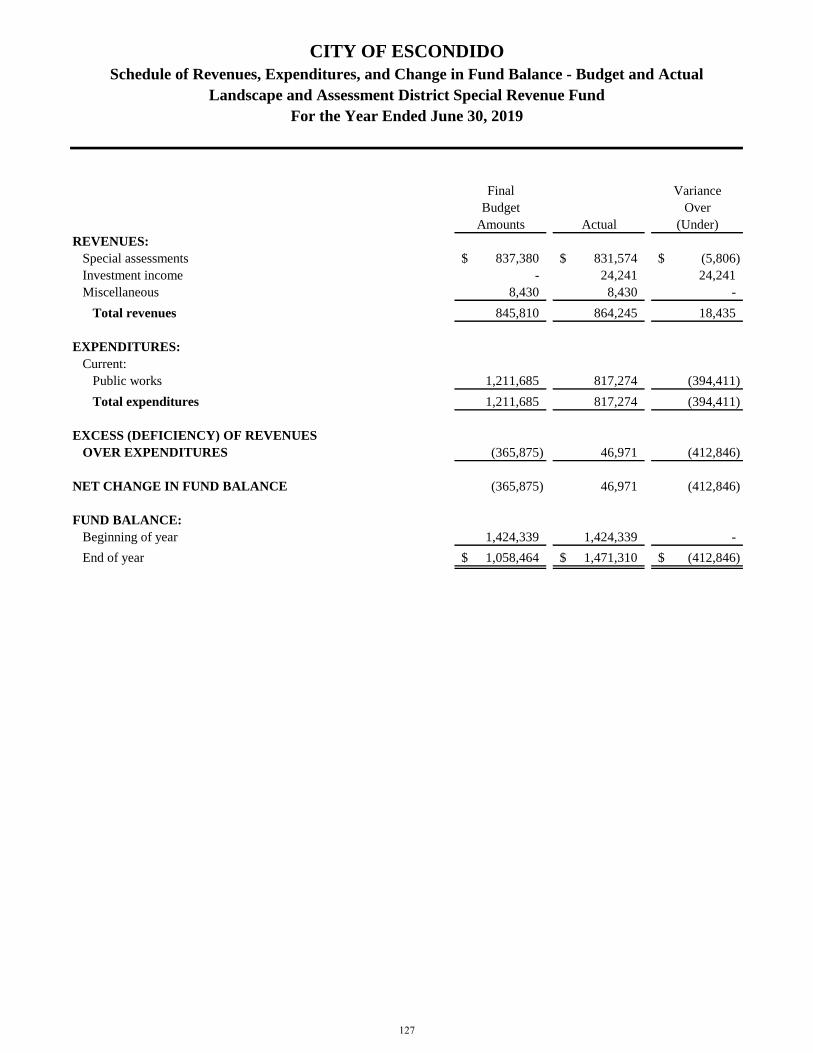
Final Variance
Budget Over
Amounts Actual (Under)
REVENUES:
Special assessments 837,380$ 831,574$ (5,806)$
Investment income - 24,241 24,241
Miscellaneous 8,430 8,430 -
Total revenues 845,810 864,245 18,435
EXPENDITURES:
Current:
Public works 1,211,685 817,274 (394,411)
Total expenditures 1,211,685 817,274 (394,411)
EXCESS (DEFICIENCY) OF REVENUES
OVER EXPENDITURES (365,875) 46,971 (412,846)
NET CHANGE IN FUND BALANCE (365,875) 46,971 (412,846)
FUND BALANCE:
Beginning of year 1,424,339 1,424,339 -
End of year 1,058,464$ 1,471,310$ (412,846)$
CITY OF ESCONDIDO
Schedule of Revenues, Expenditures, and Change in Fund Balance - Budget and Actual
Landscape and Assessment District Special Revenue Fund
For the Year Ended June 30, 2019
127

Final Variance
Budget Over
Amounts Actual (Under)
REVENUES:
Intergovernmental 2,645,580$ 2,385,755$ (259,825)$
Investment income - 10,540 10,540
Total revenues 2,645,580 2,396,295 (249,285)
EXPENDITURES:
Current:
Public safety 4,513,805 1,553,168 (2,960,637)
Capital outlay 674,888 674,888 -
Total expenditures 5,188,693 2,228,056 (2,960,637)
EXCESS (DEFICIENCY) OF REVENUES
OVER EXPENDITURES (2,543,113) 168,239 (3,209,922)
NET CHANGE IN FUND BALANCE (2,543,113) 168,239 (3,209,922)
FUND BALANCE:
Beginning of year (218,385) (218,385) -
End of year (2,761,498)$ (50,146)$ (3,209,922)$
CITY OF ESCONDIDO
Schedule of Revenues, Expenditures, and Change in Fund Balance - Budget and Actual
Law Enforcement Special Revenue Fund
For the Year Ended June 30, 2019
128

Final Variance
Budget Over
Amounts Actual (Under)
REVENUES:
Intergovernmental 648,965$ 26,530$ (622,435)$
Investment income - 96,420 96,420
Miscellaneous - 525 525
Total revenues 648,965 123,475 (525,490)
EXPENDITURES:
Current:
Community development 87,970 62,005 (25,965)
Total expenditures 87,970 62,005 (25,965)
EXCESS (DEFICIENCY) OF REVENUES
OVER EXPENDITURES 560,995 61,470 (551,455)
NET CHANGE IN FUND BALANCE 560,995 61,470 (551,455)
FUND BALANCE:
Beginning of year 18,463,346 18,463,346 -
End of year 19,024,341$ 18,524,816$ (551,455)$
CITY OF ESCONDIDO
Schedule of Revenues, Expenditures, and Change in Fund Balance - Budget and Actual
HOME Special Revenue Fund
For the Year Ended June 30, 2019
129

Final Variance
Budget Over
Amounts Actual (Under)
REVENUES:
Intergovernmental 148,015$ 1,469,219$ 1,321,204$
Charges for services 295,000 113,134 (181,866)
Investment income 3,400 2,832 (568)
Miscellaneous - 4,555 4,555
Total revenues 446,415 1,589,740 1,143,325
EXPENDITURES:
Current:
Community services 481,254 467,830 (13,424)
Community development 497,513 65,769 (431,744)
Capital outlay 1,278,875 899,950 (378,925)
Total expenditures 2,257,642 1,433,549 (824,093)
EXCESS (DEFICIENCY) OF REVENUES
OVER EXPENDITURES (1,811,227) 156,191 (1,967,418)
NET CHANGE IN FUND BALANCE (1,811,227) 156,191 (1,967,418)
FUND BALANCE:
Beginning of year 516,056 516,056 -
End of year (1,295,171)$ 672,247$ (1,967,418)$
CITY OF ESCONDIDO
Schedule of Revenues, Expenditures, and Change in Fund Balance - Budget and Actual
Miscellaneous Special Revenue Fund
For the Year Ended June 30, 2019
130

Final Variance
Budget Over
Amounts Actual (Under)
REVENUES:
Intergovernmental -$ 469,988$ 469,988$
Investment income - 229 229
Total revenues - 470,217 470,217
EXPENDITURES:
Current:
Public works 98,225 95,492 (2,733)
Total expenditures 98,225 95,492 (2,733)
EXCESS (DEFICIENCY) OF REVENUES
OVER EXPENDITURES (98,225) 374,725 (472,950)
OTHER FINANCING SOURCES (USES)
Transfers in 98,225 257,475 159,250
Total other financing sources (uses) 98,225 257,475 159,250
NET CHANGE IN FUND BALANCE - 632,200 (313,700)
FUND BALANCE:
Beginning of year (624,060) (624,060) -
End of year (624,060)$ 8,140$ (313,700)$
CITY OF ESCONDIDO
Schedule of Revenues, Expenditures, and Change in Fund Balance - Budget and Actual
Vehicle Parking District Special Revenue Fund
For the Year Ended June 30, 2019
131

Final Variance
Budget Over
Amounts Actual (Under)
REVENUES:
Property taxes 4,731,900$ 4,801,714$ 69,814$
Investment income 20,050 131,776 111,726
Total revenues 4,751,950 4,933,490 181,540
EXPENDITURES:
Debt services:
Principal retirements 1,870,000 1,870,000 -
Interest and fiscal charges 2,881,950 2,879,775 (2,175)
Total expenditures 4,751,950 4,749,775 (2,175)
EXCESS (DEFICIENCY) OF REVENUES
OVER EXPENDITURES - 183,715 (183,715)
NET CHANGE IN FUND BALANCE - 183,715 (183,715)
FUND BALANCE:
Beginning of year 4,120,080 4,120,080 -
End of year 4,120,080$ 4,303,795$ (183,715)$
CITY OF ESCONDIDO
Schedule of Revenues, Expenditures, and Change in Fund Balance - Budget and Actual
General Obligation Debt Service Fund
For the Year Ended June 30, 2019
132
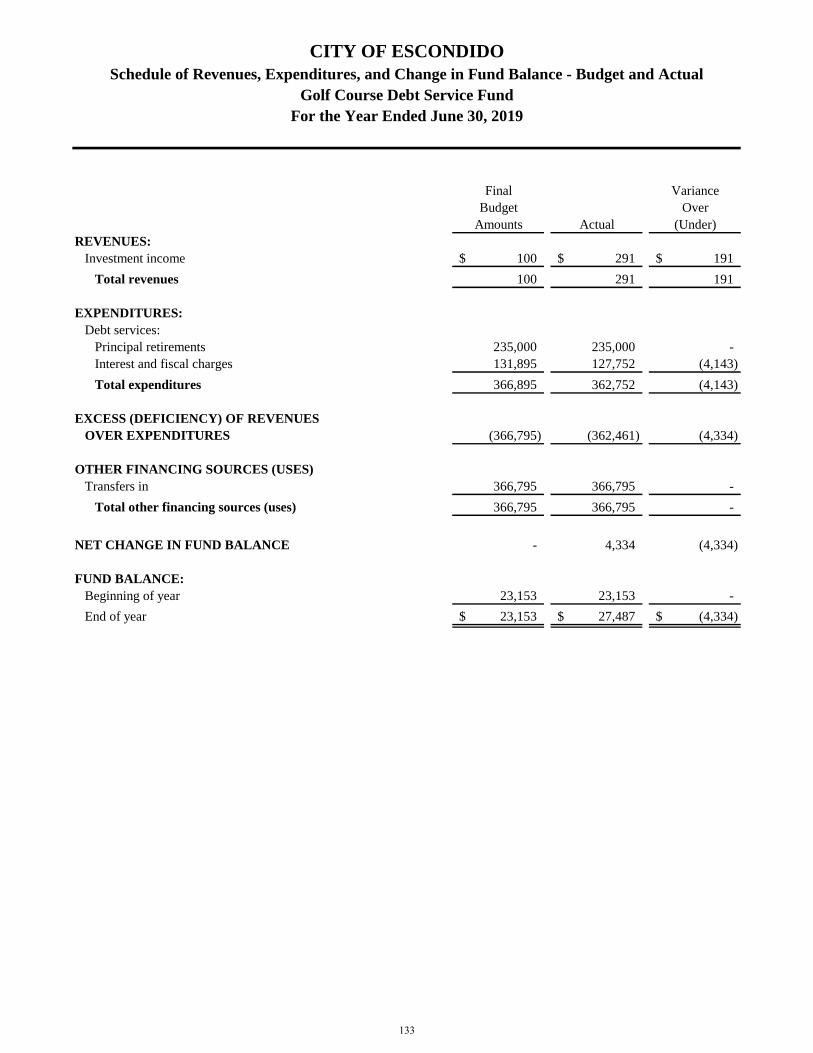
Final Variance
Budget Over
Amounts Actual (Under)
REVENUES:
Investment income 100$ 291$ 191$
Total revenues 100 291 191
EXPENDITURES:
Debt services:
Principal retirements 235,000 235,000 -
Interest and fiscal charges 131,895 127,752 (4,143)
Total expenditures 366,895 362,752 (4,143)
EXCESS (DEFICIENCY) OF REVENUES
OVER EXPENDITURES (366,795) (362,461) (4,334)
OTHER FINANCING SOURCES (USES)
Transfers in 366,795 366,795 -
Total other financing sources (uses) 366,795 366,795 -
NET CHANGE IN FUND BALANCE - 4,334 (4,334)
FUND BALANCE:
Beginning of year 23,153 23,153 -
End of year 23,153$ 27,487$ (4,334)$
CITY OF ESCONDIDO
Schedule of Revenues, Expenditures, and Change in Fund Balance - Budget and Actual
Golf Course Debt Service Fund
For the Year Ended June 30, 2019
133
CITY OF ESCONDIDO INTERNAL SERVICE FUNDS
BUILDING MAINTENANCE FUND
This fund was created to account for financial activity related to the maintenance and repair of all City-owned buildings. Funding is provided through charges to other departments, based on square footage, common area allocation, and specific maintenance projects.
VEHICLE AND EQUIPMENT MAINTENANCE FUND
This fund was created to account for transactions related to the maintenance, operation, and replacement of the City’s vehicles, whereby the City can more accurately determine the full cost of services. Such costs to other departments are billed through charges to departments in the form of a rental payment for each piece of equipment.
CENTRAL SERVICES FUND
This fund was created to account for transactions related to the provision of a central stores warehouse as well as postage, telephone, and copying services. Funding is provided through charges to other departments based on actual usage.
NETWORK AND SYSTEMS ADMINISTRATION FUND
This fund was created to account for financial activity related to Network & Systems Administration services, licensing and hardware. Funding is provided through charges to other departments based on workstation inventory.
WORKERS' COMPENSATION FUND
This fund was created to account for transactions related to the City’s self-insurance provision of Workers’ Compensation insurance. Funding is provided through charges to other departments based on payroll expense.
GENERAL LIABILITY SELF-INSURANCE FUND
This fund was created to account for transactions related to the City’s self-insurance provision of general liability insurance. Funding is provided through charges to other departments based on future risk evaluation, prior claims experience, and other factors.
INSURANCE FUND
This fund was created to account for transactions related to:
The provision of health, vision, dental, and life insurance for City employees. Funding is provided through charges to other departments and employee contributions based on employee participation.
Property insurance obtained for the City. Funding is provided through charges to other departments based on replacement cost of the property and square footage allocations.
The provision of unemployment insurance. Funding is provided through charges to other departments based on payroll expense.
134

Vehicle and Network and
Building Equipment Central Systems
Maintenance Maintenance Services Administration
ASSETS
Current Assets:
Cash and investments 1,431,829$ 7,341,075$ 583,493$ 519,745$
Receivables (Net):
Accounts 120 10,000 - -
Interest 7,093 39,522 2,565 2,953
Inventory 61,916 99,203 368,164 -
Deposits - - - -
Total Current Assets 1,500,958 7,489,800 954,222 522,698
Noncurrent Assets:
Capital assets:
Being depreciated, net 1,331,193 6,666,414 25,003 197,962
Total Noncurrent Assets 1,331,193 6,666,414 25,003 197,962
Total Assets 2,832,151 14,156,214 979,225 720,660
DEFERRED OUTFLOWS OF RESOURCES
Deferred outflows of resources related to pensions 556,914 380,642 132,156 332,967
Total Deferred Outflows of Resources 556,914 380,642 132,156 332,967
LIABILITIES
Current Liabilities:
Accounts payable 342,241 214,064 105,363 12,564
Accrued expenses 48,423 27,606 7,764 27,888
Long-term debt, due within one year 108,151 186,539 1,666 -
Total Current Liabilities 498,815 428,209 114,793 40,452
Noncurrent Liabilities:
Aggregate net pension liabilities 3,807,749 2,472,093 737,971 2,514,590
Long-term debt, due in more than one year 295,554 245,107 14,992 -
Total Noncurrent Liabilities 4,103,303 2,717,200 752,963 2,514,590
Total Liabilities 4,602,118 3,145,409 867,756 2,555,042
DEFERRED INFLOWS OF RESOURCES
Deferred inflows of resources related to pensions 41,220 29,529 10,654 29,055
Total Deferred Inflows of Resources 41,220 29,529 10,654 29,055
NET POSITION
Net investment in capital assets 1,026,422 6,301,503 25,003 197,962
Unrestricted (deficit) (2,280,695) 5,060,415 207,968 (1,728,432)
Total Net Position (1,254,273)$ 11,361,918$ 232,971$ (1,530,470)$
CITY OF ESCONDIDO
Combining Statement of Net Position
Internal Service Funds
June 30, 2019
135

General
Workers' Liability
Compensation Self-Insurance Insurance Total
ASSETS
Current Assets:
Cash and investments 9,733,472$ 7,580,346$ 2,064,500$ 29,254,460$
Receivables (Net):
Accounts - - 43,833 53,953
Interest 50,594 39,609 8,493 150,829
Inventory - - - 529,283
Deposits 250,000 - 62,600 312,600
Total Current Assets 10,034,066 7,619,955 2,179,426 30,301,125
Noncurrent Assets:
Capital assets:
Being depreciated, net - - - 8,220,572
Total Noncurrent Assets - - - 8,220,572
Total Assets 10,034,066 7,619,955 2,179,426 38,521,697
DEFERRED OUTFLOWS OF RESOURCES
Deferred outflows of resources related to pensions 29,430 - 70,948 1,503,057
Total Deferred Outflows of Resources 29,430 - 70,948 1,503,057
LIABILITIES
Current Liabilities:
Accounts payable 141,670 3,658 132,505 952,065
Accrued expenses 2,582 - 45,483 159,746
Long-term debt, due within one year 2,956,900 566,160 891 3,820,307
Total Current Liabilities 3,101,152 569,818 178,879 4,932,118
Noncurrent Liabilities:
Aggregate net pension liabilities 236,477 - 485,022 10,253,902
Long-term debt, due in more than one year 11,829,101 2,264,640 8,022 14,657,416
Total Noncurrent Liabilities 12,065,578 2,264,640 493,044 24,911,318
Total Liabilities 15,166,730 2,834,458 671,923 29,843,436
DEFERRED INFLOWS OF RESOURCES
Deferred inflows of resources related to pensions 3,491 - 5,502 119,451
Total Deferred Inflows of Resources 3,491 - 5,502 119,451
NET POSITION
Net investment in capital assets - - - 7,550,890
Unrestricted (deficit) (5,106,725) 4,785,497 1,572,949 2,510,977
Total Net Position (5,106,725)$ 4,785,497$ 1,572,949$ 10,061,867$
Internal Service Funds
June 30, 2019
CITY OF ESCONDIDO
Combining Statement of Net Position (Continued)
136

Vehicle and Network and
Building Equipment Central Systems
Maintenance Maintenance Services Administration
Operating Revenues:
Charges for services 4,896,825$ 5,773,175$ 1,396,701$ 1,753,290$
Total Operating Revenues 4,896,825 5,773,175 1,396,701 1,753,290
Operating Expenses:
Personnel services 2,177,121 1,261,744 472,166 1,252,673
Administrative expenses - 9,250 75,565 -
Benefit claims - - - -
Supplies 100,854 161,109 91,467 12,849
Repairs and maintenance 170,994 1,101,153 117,766 7,022
Depreciation 128,838 2,673,585 18,461 26,397
Utilities 1,000,877 6,522 356,148 15,705
Fuel - 1,137,514 - -
Professional services 1,512,138 77,972 186,010 49,042
Insurance premiums 51,035 41,075 14,285 13,435
Rent 2,825 - - -
Other 55,921 217,889 57,669 350,637
Total Operating Expenses 5,200,603 6,687,813 1,389,537 1,727,760
Operating Income (Loss) (303,778) (914,638) 7,164 25,530
Nonoperating Revenues (Expenses):
Investment income 15,491 288,233 10,380 11,487
Interest and fiscal charges (14,585) (15,545) - -
Miscellaneous 2,910 571,673 50
Total Nonoperating Revenues (Expenses) 3,816 844,361 10,430 11,487
Income Before Transfers and Capital
Contributions (299,962) (70,277) 17,594 37,017
Transfers in 1,648,000 25,000 - -
Transfers (out) - - (219,355) -
Capital Contributions:
Developer contributions 130,795 106,154 - -
Total Transfers and Capital Contributions 1,778,795 131,154 (219,355) -
Changes in Net Position 1,478,833 60,877 (201,761) 37,017
Net Position at Beginning of Year (2,733,106) 11,301,041 434,732 (1,567,487)
Net Position at End of Year (1,254,273)$ 11,361,918$ 232,971$ (1,530,470)$
CITY OF ESCONDIDO
Combining Statement of Revenues, Expenses, and Changes in Fund Net Position
Internal Service Funds
For the Year Ended June 30, 2019
137

General
Workers' Liability
Compensation Self-Insurance Insurance Total
Operating Revenues:
Charges for services 3,842,201$ 2,647,215$ 11,397,775$ 31,707,182$
Total Operating Revenues 3,842,201 2,647,215 11,397,775 31,707,182
Operating Expenses:
Personnel services 134,977 - 306,914 5,605,595
Administrative expenses 320,600 1,412,265 164,605 1,982,285
Benefit claims 1,143,326 432,283 605,197 2,180,806
Supplies 1,993 - 1,876 370,148
Repairs and maintenance - - - 1,396,935
Depreciation - - - 2,847,281
Utilities 1,209 - 8,890 1,389,351
Fuel - - - 1,137,514
Professional services 1,641,297 273,926 144,853 3,885,238
Insurance premiums 813,883 771,507 10,013,669 11,718,889
Rent - - - 2,825
Other 7,109 5,647 74,457 769,329
Total Operating Expenses 4,064,394 2,895,628 11,320,461 33,286,196
Operating Income (Loss) (222,193) (248,413) 77,314 (1,579,014)
Nonoperating Revenues (Expenses):
Investment income 348,609 274,815 24,898 973,913
Interest and fiscal charges - - - (30,130)
Miscellaneous - - 65,549 640,182
Total Nonoperating Revenues (Expenses) 348,609 274,815 90,447 1,583,965
Income Before Transfers and Capital
Contributions 126,416 26,402 167,761 4,951
Transfers in 500,000 - - 2,173,000
Transfers (out) - - - (219,355)
Capital Contributions:
Developer contributions - - - 236,949
Total Transfers and Capital Contributions 500,000 - - 2,190,594
Changes in Net Position 626,416 26,402 167,761 2,195,545
Net Position at Beginning of Year (5,733,141) 4,759,095 1,405,188 7,866,322
Net Position at End of Year (5,106,725)$ 4,785,497$ 1,572,949$ 10,061,867$
CITY OF ESCONDIDO
Combining Statement of Revenues, Expenses, and Changes in Fund Net Position (Continued)
Internal Service Funds
For the Year Ended June 30, 2019
138

Vehicle and Network and
Building Equipment Central Systems
Maintenance Maintenance Services Administration
Cash Flows from Operating Activities:
Cash received from customers 4,896,705$ 5,763,175$ 1,396,701$ 1,753,290$
Cash paid to employees for services (2,044,316) (1,169,541) (511,241) (1,147,153)
Cash paid to other suppliers of goods and services (2,782,300) (3,020,147) (878,606) (439,843)
Cash from other sources 2,910 106,665 50 -
Net Cash Provided by Operating Activities 72,999 1,680,152 6,904 166,294
Cash Flows from Noncapital Financing Activities:
Cash received from (Paid to) other funds 1,648,000 25,000 (219,355) -
Net Cash Provided by (Used in) Noncapital
Financing Activities 1,648,000 25,000 (219,355) -
Cash Flows from Capital and Related
Financing Activities:
Purchase and construction of capital assets (188,385) (2,338,143) - (156,484)
Sale of capital assets - 494,491 - -
Capital lease payment - (190,376) - -
Principal payments on loans (94,601) - - -
Interest payments on loans (14,585) - - -
Net Cash (Used in) Capital and
Related Financing Activities (297,571) (2,034,028) - (156,484)
Cash Flows from Investing Activities:
Investment income 8,401 281,804 11,364 10,333
Net Cash Provided by Investing Activities 8,401 281,804 11,364 10,333
Net increase (decrease) in cash and cash equivalents 1,431,829 (47,072) (201,087) 20,143
Cash and cash equivalents:
Beginning of year - 7,388,147 784,580 499,602
End of year 1,431,829$ 7,341,075$ 583,493$ 519,745$
CITY OF ESCONDIDO
Combining Statement of Cash Flows
Internal Service Funds
For the Year Ended June 30, 2019
139

General
Workers' Liability
Compensation Self-Insurance Insurance Total
Cash Flows from Operating Activities:
Cash received from customers 3,842,201$ 2,647,215$ 11,379,160$ 31,678,447$
Cash paid to employees for services (444,028) (1,412,265) (444,969) (7,173,513)
Cash paid to other suppliers of goods and services (3,047,008) (1,147,625) (10,780,870) (22,096,399)
Cash from other sources - - 65,549 175,174
Net Cash Provided by Operating Activities 351,165 87,325 218,870 2,583,709
Cash Flows from Noncapital Financing Activities:
Cash received from other funds 500,000 - - 1,953,645
Net Cash Provided by (Used in) Noncapital
Financing Activities 500,000 - - 1,953,645
Cash Flows from Capital and Related
Financing Activities:
Purchase and construction of capital assets - - - (2,683,012)
Sale of capital assets - - - 494,491
Capital lease payment - - - (190,376)
Principal payments on loans - - - (94,601)
Interest payments on loans - - - (14,585)
Net Cash (Used in) Capital and
Related Financing Activities - - - (2,488,083)
Cash Flows from Investing Activities:
Investment income 335,666 267,311 22,627 937,506
Net Cash Provided by Investing Activities 335,666 267,311 22,627 937,506
Net increase (decrease) in cash and cash equivalents 1,186,831 354,636 241,497 2,986,777
Cash and cash equivalents:
Beginning of year 8,546,641 7,225,710 1,823,003 26,267,683
End of year 9,733,472$ 7,580,346$ 2,064,500$ 29,254,460$
CITY OF ESCONDIDO
Combining Statement of Cash Flows (Continued)
Internal Service Funds
For the Year Ended June 30, 2019
140

Vehicle and
Building Equipment Central Office
Maintenance Maintenance Services Automation
Reconciliation of Operating Income (Loss) to Net
Cash Provided by Operating Activities:
Operating income (loss) (303,778)$ (914,638)$ 7,164$ 25,530$
Adjustment to reconcile operating income (loss) to
net cash provided by operating activities:
Depreciation 128,838 2,673,585 18,461 26,397
Pension expense 175,716 96,526 40,681 111,487
Cash from other sources 2,910 106,665 50 -
Changes in assets, deferred outflows of resources,
deferred inflows of resources, and liabilities:
Accounts receivable (120) (10,000) - -
Inventories 4,300 (15,420) (87,910) -
Accounts payable 108,044 (261,493) 32,649 8,847
Accrued expenses 697 2,087 (4,660) (5,967)
Compensated absences (43,608) 2,840 469 -
Estimated claims payable - - - -
Total adjustments 376,777 2,594,790 (260) 140,764
Net Cash Provided by Operating
Activities $ 72,999 $ 1,680,152 $ 6,904 $ 166,294
Noncash Investing, Capital and Financing
Activities:
Contributed property, plant and equipment 130,795$ 106,154$ -$ -$
Total noncash investing, capital and financing
activities 130,795$ 106,154$ -$ -$
CITY OF ESCONDIDO
Combining Statement of Cash Flows (Continued)
Internal Service Funds
For the Year Ended June 30, 2019
141
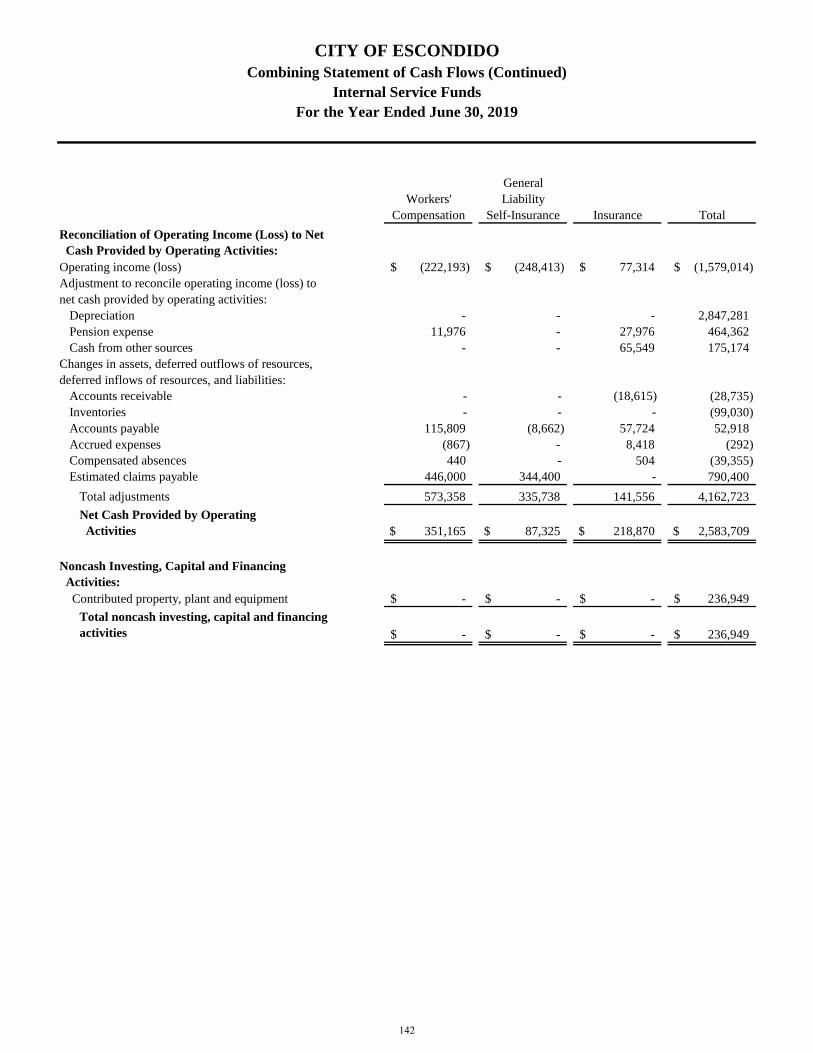
General
Workers' Liability
Compensation Self-Insurance Insurance Total
Reconciliation of Operating Income (Loss) to Net
Cash Provided by Operating Activities:
Operating income (loss) (222,193)$ (248,413)$ 77,314$ (1,579,014)$
Adjustment to reconcile operating income (loss) to
net cash provided by operating activities:
Depreciation - - - 2,847,281
Pension expense 11,976 - 27,976 464,362
Cash from other sources - - 65,549 175,174
Changes in assets, deferred outflows of resources,
deferred inflows of resources, and liabilities:
Accounts receivable - - (18,615) (28,735)
Inventories - - - (99,030)
Accounts payable 115,809 (8,662) 57,724 52,918
Accrued expenses (867) - 8,418 (292)
Compensated absences 440 - 504 (39,355)
Estimated claims payable 446,000 344,400 - 790,400
Total adjustments 573,358 335,738 141,556 4,162,723
Net Cash Provided by Operating
Activities $ 351,165 $ 87,325 $ 218,870 $ 2,583,709
Noncash Investing, Capital and Financing
Activities:
Contributed property, plant and equipment -$ -$ -$ 236,949$
Total noncash investing, capital and financing
activities -$ -$ -$ 236,949$
Internal Service Funds
For the Year Ended June 30, 2019
CITY OF ESCONDIDO
Combining Statement of Cash Flows (Continued)
142

CITY OF ESCONDIDO AGENCY FUNDS
HIDDEN TRAILS COMMUNITY FACILITIES DISTRICT
This fund was created to account for debt service payments on 1982 Mello-Roos Community Facility Act special tax bonds paid from special taxes collected and remitted to a fiscal agent. The bonds were issued to finance the acquisition of certain backbone public facilities including street, water and sewer facilities in the Hidden Trails Community Facilities District.
EUREKA RANCH COMMUNITY FACILITIES DISTRICT
This fund was created to account for debt service payments on 1982 Mello-Roos Community Facility Act special tax bonds paid from special taxes collected and remitted to a fiscal agent. The bonds were issued to finance various public improvements including street, storm drain and sewer improvements as well as utility undergrounding within the Eureka Ranch Community Facilities District.
AUTO PARKWAY ASSESSMENT DISTRICT FUND
This fund was created to account for debt service payments on 1915 Act Assessment bonds paid from special assessments collected and remitted to a fiscal agent-trustee. The bonds were issued to finance capital improvements in the Auto Parkway District, including drainage and road improvements, sewer, lighting, and other improvements.
RANCHO SAN PASQUAL FUND
This fund was created to account for the debt service payments collected directly from property owners and remitted to bondholders for payment on Rancho San Pasqual bonds, issued to finance certain public improvements within the City's Assessment District No. 95-1.
DEPOSIT TRUST FUND
This fund was created to account for deposits received and held by the City as an agent for individuals, developers, private organizations, and other governmental agencies.
143

Hidden Trails Eureka Ranch Auto
Community Community Parkway
Facilities Facilities Assessment Rancho
District District District San Pasqual
ASSETS
Cash and investments 174,895$ 792,194$ 6,526$ 293,489$
Cash and investments with fiscal agent 15 167 - 348,598
Receivables:
Taxes 1,267 6,727 - 1,297
Interest 557 2,886 - 1,140
Total assets 176,734$ 801,974$ 6,526$ 644,524$
LIABILITIES
Accounts payable -$ 1,540$ 960$ -$
Deposits payable - - - -
Due to bondholders 176,734 800,434 5,566 644,524
Total liabilities 176,734$ 801,974$ 6,526$ 644,524$
June 30, 2019
CITY OF ESCONDIDO
Combining Statement of Assets and Liabilities
Agency Funds
144

Deposit
Trust Total
ASSETS
Cash and investments 10,913,800$ 12,180,904$
Cash and investments with fiscal agent - 348,780
Receivables:
Taxes - 9,291
Interest 556 5,139
Total assets 10,914,356$ 12,544,114$
LIABILITIES
Accounts payable 178,495$ 180,995$
Deposits payable 10,735,861 10,735,861
Due to bondholders - 1,627,258
Total liabilities 10,914,356$ 12,544,114$
June 30, 2019
CITY OF ESCONDIDO
Combining Statement of Assets and Liabilities (Continued)
Agency Funds
145

Balance Balance
July 1, 2018 Additions Deductions June 30, 2019
Hidden Trails Community Facilities District
ASSETS
Cash and investments 177,578$ 203,057$ (205,740)$ 174,895$
Cash and investments with fiscal agent 1 54 (40) 15
Receivables:
Taxes 1,160 705 (598) 1,267
Interest 599 1,118 (1,160) 557
Total assets 179,338$ 204,934$ (207,538)$ 176,734$
LIABILITIES
Accounts payable -$ 202,270$ (202,270)$ -$
Due to bondholders 179,338 314,936 (317,540) 176,734
Total liabilities 179,338$ 517,206$ (519,810)$ 176,734$
Eureka Ranch Community Facilities District
ASSETS
Cash and investments 801,008$ 1,046,598$ (1,055,412)$ 792,194$
Cash and investments with fiscal agent 10 283 (126) 167
Receivables:
Taxes 1,705 6,727 (1,705) 6,727
Interest 2,452 2,886 (2,452) 2,886
Total assets 805,175$ 1,056,494$ (1,059,695)$ 801,974$
LIABILITIES
Accounts payable -$ 1,046,942$ (1,045,402)$ 1,540$
Due to bondholders 805,175 1,531,733 (1,536,474) 800,434
Total liabilities 805,175$ 2,578,675$ (2,581,876)$ 801,974$
CITY OF ESCONDIDO
Combining Statement of Assets and Liabilities
Agency Funds
For the Year Ended June 30, 2019
146
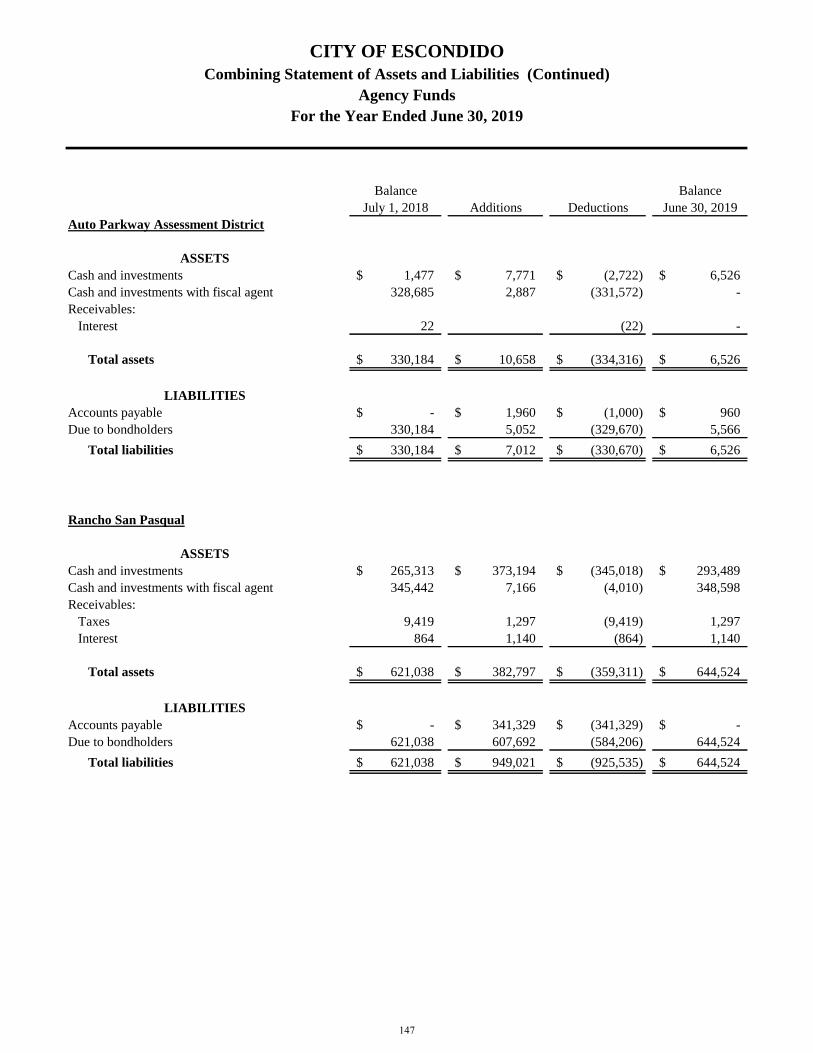
Balance Balance
July 1, 2018 Additions Deductions June 30, 2019
Auto Parkway Assessment District
ASSETS
Cash and investments 1,477$ 7,771$ (2,722)$ 6,526$
Cash and investments with fiscal agent 328,685 2,887 (331,572) -
Receivables:
Interest 22 (22) -
Total assets 330,184$ 10,658$ (334,316)$ 6,526$
LIABILITIES
Accounts payable -$ 1,960$ (1,000)$ 960$
Due to bondholders 330,184 5,052 (329,670) 5,566
Total liabilities 330,184$ 7,012$ (330,670)$ 6,526$
Rancho San Pasqual
ASSETS
Cash and investments 265,313$ 373,194$ (345,018)$ 293,489$
Cash and investments with fiscal agent 345,442 7,166 (4,010) 348,598
Receivables:
Taxes 9,419 1,297 (9,419) 1,297
Interest 864 1,140 (864) 1,140
Total assets 621,038$ 382,797$ (359,311)$ 644,524$
LIABILITIES
Accounts payable -$ 341,329$ (341,329)$ -$
Due to bondholders 621,038 607,692 (584,206) 644,524
Total liabilities 621,038$ 949,021$ (925,535)$ 644,524$
CITY OF ESCONDIDO
Combining Statement of Assets and Liabilities (Continued)
Agency Funds
For the Year Ended June 30, 2019
147

Balance Balance
July 1, 2018 Additions Deductions June 30, 2019
Deposit Trust
ASSETS
Cash and investments 10,691,517$ 3,861,569$ (3,639,286)$ 10,913,800$
Receivables:
Interest 452 556 (452) 556
Total assets 10,691,969$ 3,862,125$ (3,639,738)$ 10,914,356$
LIABILITIES
Accounts payable 68,099$ 3,470,297$ (3,359,901)$ 178,495$
Deposits payable 10,623,870 4,045,525 (3,933,534) 10,735,861
Total liabilities 10,691,969$ 7,515,822$ (7,293,435)$ 10,914,356$
Total Agency Funds
ASSETS
Cash and investments 11,936,893$ 5,492,189$ (5,248,178)$ 12,180,904$
Cash and investments with fiscal agent 674,137 10,390 (335,748) 348,779
Receivables:
Taxes 12,284 8,729 (11,722) 9,291
Interest 4,390 5,700 (4,950) 5,140
Total assets 12,627,704$ 5,517,008$ (5,600,598)$ 12,544,114$
LIABILITIES
Accounts payable 68,099$ 5,062,798$ (4,949,902)$ 180,995$
Deposits payable 10,623,870 4,045,525 (3,933,534) 10,735,861
Due to bondholders 1,935,735 2,459,413 (2,767,890) 1,627,258
Total liabilities 12,627,704$ 11,567,736$ (11,651,326)$ 12,544,114$
For the Year Ended June 30, 2019
CITY OF ESCONDIDO
Combining Statement of Assets and Liabilities (Continued)
Agency Funds
148

149

Statistical Section
150

CITY OF ESCONDIDO STATISTICAL SECTION
This section of the City of Escondido's comprehensive annual financial report provides detailed information as a context for understanding what the information in the financial statements, note disclosures and required supplementary information says about the government's overall financial health.
FINANCIAL TRENDS INFORMATION
These schedules are intended to assist users in understanding and assessing how a government’s financial position has changed over time.
REVENUE CAPACITY INFORMATION
These schedules are intended to assist users in understanding and assessing factors affecting a government’s ability to generate its own revenue.
DEBT CAPACITY INFORMATION
These schedules are intended to assist users in understanding and assessing a government’s debt burden and its ability to issue additional debt.
DEMOGRAPHIC AND ECONOMIC INFORMATION
These schedules are intended to assist users in understanding the socioeconomic environment within which a government operates and provide information that facilitates comparison of financial statement information over time and among governments.
OPERATING INFORMATION
These schedules are intended to provide information about operations and resources to assist readers in using financial statement information to understand and assess a government’s economic condition.
151
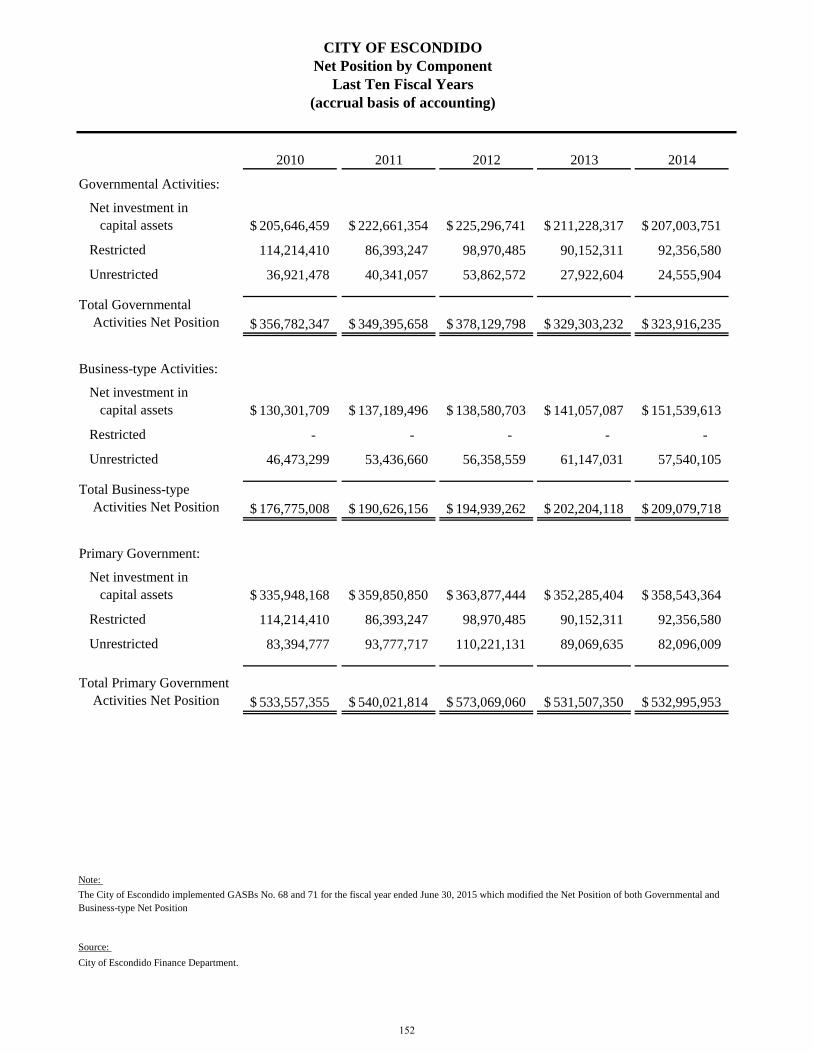
2010 2011 2012 2013 2014
Governmental Activities:
Net investment in
capital assets 205,646,459$ 222,661,354$ 225,296,741$ 211,228,317$ 207,003,751$
Restricted 114,214,410 86,393,247 98,970,485 90,152,311 92,356,580
Unrestricted 36,921,478 40,341,057 53,862,572 27,922,604 24,555,904
Total Governmental
Activities Net Position 356,782,347$ 349,395,658$ 378,129,798$ 329,303,232$ 323,916,235$
Business-type Activities:
Net investment in
capital assets 130,301,709$ 137,189,496$ 138,580,703$ 141,057,087$ 151,539,613$
Restricted - - - - -
Unrestricted 46,473,299 53,436,660 56,358,559 61,147,031 57,540,105
Total Business-type
Activities Net Position 176,775,008$ 190,626,156$ 194,939,262$ 202,204,118$ 209,079,718$
Primary Government:
Net investment in
capital assets 335,948,168$ 359,850,850$ 363,877,444$ 352,285,404$ 358,543,364$
Restricted 114,214,410 86,393,247 98,970,485 90,152,311 92,356,580
Unrestricted 83,394,777 93,777,717 110,221,131 89,069,635 82,096,009
Total Primary Government
Activities Net Position 533,557,355$ 540,021,814$ 573,069,060$ 531,507,350$ 532,995,953$
Source:
City of Escondido Finance Department.
CITY OF ESCONDIDO
The City of Escondido implemented GASBs No. 68 and 71 for the fiscal year ended June 30, 2015 which modified the Net Position of both Governmental and
Business-type Net Position
Net Position by Component
Last Ten Fiscal Years
(accrual basis of accounting)
Note:
152

2015 2016 2017 2018 2019
Governmental Activities:
Net investment in
capital assets 201,314,048$ 223,906,554$ 218,477,270$ 218,992,174$ 218,870,698$
Restricted 90,509,538 96,530,455 100,550,008 104,851,906 115,547,295
Unrestricted (124,495,479) (121,164,871) (99,262,303) (112,191,974) (124,447,522)
Total Governmental
Activities Net Position 167,328,107$ 199,272,138$ 219,764,975$ 211,652,106$ 209,970,471$
Business-type Activities:
Net investment in
capital assets 158,231,376$ 172,888,190$ 188,875,729$ 183,764,968$ 195,706,168$
Restricted - - - 3,642,092 1,095,891
Unrestricted 28,819,831 22,072,596 9,234,771 21,293,844 20,679,543
Total Business-type
Activities Net Position 187,051,207$ 194,960,786$ 198,110,500$ 208,700,904$ 217,481,602$
Primary Government:
Net investment in
capital assets 359,545,424$ 396,794,744$ 407,352,999$ 402,757,142$ 414,576,866$
Restricted 90,509,538 96,530,455 100,550,008 108,493,998 116,643,186
Unrestricted (95,675,648) (99,092,275) (90,027,532) (90,898,130) (103,767,979)
Total Primary Government
Activities Net Position 354,379,314$ 394,232,924$ 417,875,475$ 420,353,010$ 427,452,073$
Source:
City of Escondido Finance Department.
CITY OF ESCONDIDO
Net Position by Component (Continued)
Note:
The City of Escondido implemented GASBs No. 68 and 71 for the fiscal year ended June 30, 2015 which modified the Net Position of both Governmental and
Business-type Net Position
Last Ten Fiscal Years
(accrual basis of accounting)
153

2010 2011 2012 2013 2014
Expenses
Governmental Activities:
General government 8,058,408$ 8,162,775$ 7,923,896$ 6,931,282$ 6,817,120$
Public safety 58,486,106 56,170,547 60,467,057 58,937,215 64,735,010
Community services 20,321,281 13,935,737 14,428,323 13,492,016 13,824,749
Public works 25,927,953 30,251,264 23,508,515 28,719,020 22,830,644
Community development 7,814,707 9,908,625 6,765,185 6,095,723 4,442,510
Interest and fiscal charges 7,649,971 7,459,498 5,946,168 4,038,630 3,709,135
Total Governmental Activities
Expenses 128,258,426 125,888,446 119,039,144 122,533,177 116,359,168
Business-type Activities:
Water 40,277,313 37,364,315 43,537,887 48,899,219 51,937,493
Wastewater 24,154,671 23,833,875 23,995,887 25,847,825 28,748,596
Total Business-type Activities
Expenses 64,431,984 61,198,190 67,533,774 74,747,044 80,686,089
Total Primary Government Expenses 192,690,410$ 187,086,636$ 186,572,918$ 197,280,221$ 197,045,257$
Program Revenues
Governmental activities:
Charges for services:
General government 159,353$ 351,155$ 735,395$ 481,812$ 1,049,402$
Public safety 9,207,628 8,273,579 8,429,675 8,322,729 8,217,629
Community services 5,625,758 3,871,455 4,158,173 4,118,332 4,104,210
Public works 1,076,721 994,907 1,160,643 1,261,705 1,554,453
Community development 1,372,001 1,154,371 820,337 914,370 1,351,882
Operating grants and contributions 14,568,341 12,988,723 13,503,657 12,507,289 13,031,177
Capital grants and contributions 14,818,607 10,550,030 5,608,064 8,528,675 3,331,901
Total Governmental Activities
Program Revenues 46,828,409 38,184,220 34,415,944 36,134,912 32,640,654
Business-type Activities:
Charges for services:
Water 40,155,208 37,293,900 42,398,099 48,857,327 54,411,250
Wastewater 29,208,703 28,176,381 26,430,851 28,482,081 29,413,549
Operating grants and contributions - - - 6,559 243,302
Capital grants and contributions 5,851,309 8,922,144 2,155,659 3,858,657 1,879,809
Total Business-type Activities
Program Revenues 75,215,220 74,392,425 70,984,609 81,204,624 85,947,910
Total Primary Government Program
Revenues 122,043,629$ 112,576,645$ 105,400,553$ 117,339,536$ 118,588,564$
(accrual basis of accounting)
CITY OF ESCONDIDO
Changes in Net Position
Last Ten Fiscal Years
154

2015 2016 2017 2018 2019
Expenses
Governmental Activities:
General government 6,412,164$ 8,852,170$ 9,357,787$ 11,319,840$ 11,594,163$
Public safety 62,464,110 65,521,010 71,876,096 80,848,786 80,834,482
Community services 12,485,541 12,559,645 12,571,637 13,453,775 14,394,666
Public works 24,390,896 20,066,941 22,107,665 25,876,603 27,320,553
Community development 4,652,366 4,643,576 5,077,618 5,516,258 5,388,553
Interest and fiscal charges 4,655,972 2,952,792 2,646,232 2,849,950 2,695,321
Total Governmental Activities
Expenses 115,061,049 114,596,134 123,637,035 139,865,212 142,227,738
Business-type Activities:
Water 51,558,727 49,844,796 57,314,740 62,431,613 60,286,760
Wastewater 29,740,987 30,565,986 32,361,361 32,843,118 33,669,077
Total Business-type Activities
Expenses 81,299,714 80,410,782 89,676,101 95,274,731 93,955,837
Total Primary Government Expenses 196,360,763$ 195,006,916$ 213,313,136$ 235,139,943$ 236,183,575$
Program Revenues
Governmental activities:
Charges for services:
General government 261,135$ 479,655$ 300,203$ 681,369$ 700,526$
Public safety 9,450,880 9,292,514 10,251,178 11,190,662 11,701,922
Community services 4,042,601 3,807,474 3,739,242 3,634,653 3,668,178
Public works 1,292,959 2,280,973 2,424,590 1,738,505 2,276,458
Community development 1,615,495 1,811,997 1,973,600 1,763,863 1,501,441
Operating grants and contributions 9,216,428 10,604,522 9,441,222 9,980,538 15,008,732
Capital grants and contributions 2,855,849 4,787,949 6,622,075 9,564,799 7,654,270
Total Governmental Activities
Program Revenues 28,735,347 33,065,084 34,752,110 38,554,389 42,511,527
Business-type Activities:
Charges for services:
Water 54,323,287 51,055,900 55,442,545 61,551,122 57,495,553
Wastewater 32,014,382 33,594,079 34,166,698 34,464,076 35,780,554
Operating grants and contributions 533,816 70,130 30,832 143,298 152,007
Capital grants and contributions 2,972,993 1,355,692 1,766,559 7,846,908 4,859,530
Total Business-type Activities
Program Revenues 89,844,478 86,075,801 91,406,634 104,005,404 98,287,644
Total Primary Government Program
Revenues 118,579,825$ 119,140,885$ 126,158,744$ 142,559,793$ 140,799,171$
(Continued)
(accrual basis of accounting)
CITY OF ESCONDIDO
Changes in Net Position (Continued)
Last Ten Fiscal Years
155

2010 2011 2012 2013 2014
Net (Expense)/Revenue
Governmental activities (81,430,017)$ (87,704,226)$ (84,623,200)$ (86,398,265)$ (83,718,514)$
Business-type activities 10,783,236 13,194,235 3,450,835 6,457,580 5,261,821
Total Primary Government
Net Expense (70,646,781)$ (74,509,991)$ (81,172,365)$ (79,940,685)$ (78,456,693)$
General Revenues and Other
Changes in Net Position
Governmental activities:
Taxes:
Sales taxes 17,826,617$ 20,819,517$ 25,532,055$ 24,202,373$ 27,366,084$
Property taxes 27,884,137 28,168,365 24,060,363 16,738,501 16,805,289
Franchise tax 4,344,355 4,461,129 4,563,576 4,516,247 4,694,252
Payments in lieu of taxes 17,989,533 17,652,114 19,548,954 19,041,332 20,075,228
Other taxes 4,014,349 4,048,337 2,899,789 3,971,585 4,218,914
Use of money and property 4,654,030 4,810,578 5,885,611 3,290,477 4,153,899
Sale of capital assets - 171,386 399,819 - -
Miscellaneous 2,130,400 476,135 748,181 1,070,052 892,851
Transfers 41,330 1,248,845 25,000 25,000 125,000
Extraordinary item:
Gain/(loss) - - 29,693,992 (34,948,363) -
Total Governmental Activities 78,884,751 81,856,406 113,357,340 37,907,204 78,331,517
Business-type activities:
Use of money and property 1,794,117 1,608,420 1,750,475 1,522,495 1,577,693
Miscellaneous 274,876 297,338 250,862 447,638 161,086
Transfers (41,330) (1,248,845) (25,000) (25,000) (125,000)
Extraordinary item:
Loss on chemical
tank spill - - (1,114,066) - -
Total Business-type Activities 2,027,663 656,913 862,271 1,945,133 1,613,779
Total Primary Government 80,912,414$ 82,513,319$ 114,219,611$ 39,852,337$ 79,945,296$
Change in Net Position
Governmental activities (2,545,266)$ (5,847,820)$ 28,734,140$ (48,491,061)$ (5,386,997)$
Business-type activities 12,810,899 13,851,148 4,313,106 8,402,713 6,875,600
Total primary government 10,265,633$ 8,003,328$ 33,047,246$ (40,088,348)$ 1,488,603$
Source:
City of Escondido Finance Department.
(accrual basis of accounting)
CITY OF ESCONDIDO
Changes in Net Position (Continued)
Last Ten Fiscal Years
156
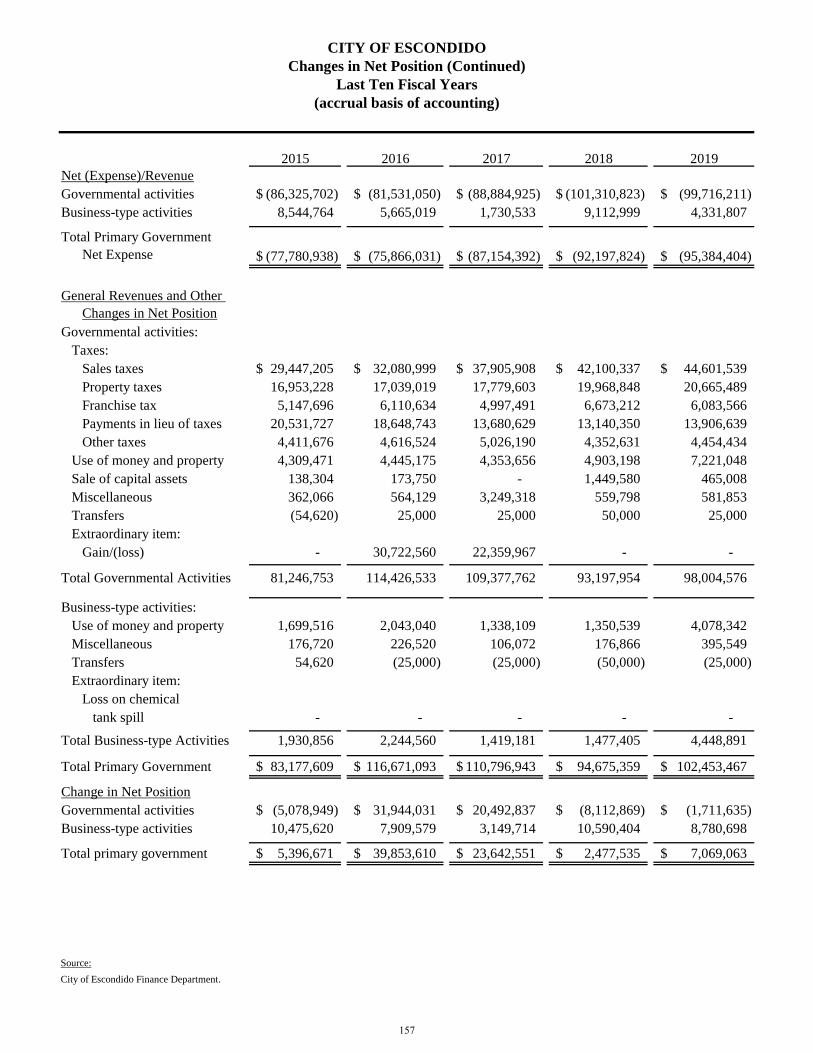
2015 2016 2017 2018 2019
Net (Expense)/Revenue
Governmental activities (86,325,702)$ (81,531,050)$ (88,884,925)$ (101,310,823)$ (99,716,211)$
Business-type activities 8,544,764 5,665,019 1,730,533 9,112,999 4,331,807
Total Primary Government
Net Expense (77,780,938)$ (75,866,031)$ (87,154,392)$ (92,197,824)$ (95,384,404)$
General Revenues and Other
Changes in Net Position
Governmental activities:
Taxes:
Sales taxes 29,447,205$ 32,080,999$ 37,905,908$ 42,100,337$ 44,601,539$
Property taxes 16,953,228 17,039,019 17,779,603 19,968,848 20,665,489
Franchise tax 5,147,696 6,110,634 4,997,491 6,673,212 6,083,566
Payments in lieu of taxes 20,531,727 18,648,743 13,680,629 13,140,350 13,906,639
Other taxes 4,411,676 4,616,524 5,026,190 4,352,631 4,454,434
Use of money and property 4,309,471 4,445,175 4,353,656 4,903,198 7,221,048
Sale of capital assets 138,304 173,750 - 1,449,580 465,008
Miscellaneous 362,066 564,129 3,249,318 559,798 581,853
Transfers (54,620) 25,000 25,000 50,000 25,000
Extraordinary item:
Gain/(loss) - 30,722,560 22,359,967 - -
Total Governmental Activities 81,246,753 114,426,533 109,377,762 93,197,954 98,004,576
Business-type activities:
Use of money and property 1,699,516 2,043,040 1,338,109 1,350,539 4,078,342
Miscellaneous 176,720 226,520 106,072 176,866 395,549
Transfers 54,620 (25,000) (25,000) (50,000) (25,000)
Extraordinary item:
Loss on chemical
tank spill - - - - -
Total Business-type Activities 1,930,856 2,244,560 1,419,181 1,477,405 4,448,891
Total Primary Government 83,177,609$ 116,671,093$ 110,796,943$ 94,675,359$ 102,453,467$
Change in Net Position
Governmental activities (5,078,949)$ 31,944,031$ 20,492,837$ (8,112,869)$ (1,711,635)$
Business-type activities 10,475,620 7,909,579 3,149,714 10,590,404 8,780,698
Total primary government 5,396,671$ 39,853,610$ 23,642,551$ 2,477,535$ 7,069,063$
Source:
City of Escondido Finance Department.
(accrual basis of accounting)
CITY OF ESCONDIDO
Changes in Net Position (Continued)
Last Ten Fiscal Years
157

2010 2011 2012 2013 2014
General Fund
Reserved 10,331,307$ $ - $ - $ - $ -
Unreserved, designated 21,694,390 - - - -
Unreserved, undesignated - - - - -
Nonspendable - 5,456,377 5,180,347 2,503,401 217,690
Restricted - - - - -
Committed to - 28,354,588 31,938,244 17,210,596 17,319,659
Assigned to - 713,361 852,481 980,678 897,465
Unassigned - 399,790 753,121 247,130 1,753,519
Total General Fund 32,025,697$ 34,924,116$ 38,724,193$ 20,941,805$ 20,188,333$
All Other Governmental Funds
Reserved 91,342,926$ $ - $ - $ - $ -
Reserved for current
projects, reported in:
Special revenue funds 3,005,679 - - - -
Capital projects funds 9,407,468 - - - -
Unreserved, reported in:
Special revenue funds 4,762,099 - - - -
Capital projects funds 8,691,702 - - - -
Undesignated, reported in:
Special revenue funds 1,097,044 - - - -
Capital projects funds - - - - -
Nonspendable - 61,204,587 57,982,791 60,199,844 -
Restricted for - 21,732,085 30,695,122 20,785,893 81,559,045
Committed to - 8,418,117 5,208,585 2,466,775 2,008,525
Assigned to - 774,990 447,148 159,405 139,653
Unassigned - (14,547,286) (1,021,715) (1,248,533) (1,149,954)
Total All Other
Governmental Funds 118,306,918$ $77,582,493 93,311,931$ 82,363,384$ 82,557,269$
Note:
Source:
City of Escondido Finance Department.
The City of Escondido implemented GASB 54 for the fiscal year ended June 30, 2011 and has elected not to restate fund balance amounts in previous years.
CITY OF ESCONDIDO
Fund Balances of Governmental Funds
Last Ten Fiscal Years
(modified accrual basis of accounting)
158

2015 2016 2017 2018 2019
General Fund
Reserved $ - $ - $ - $ - $ -
Unreserved, designated - - - - -
Unreserved, undesignated - - - - -
Nonspendable 183,403 179,185 9,991,902 9,991,902 5,187,424
Restricted - - - 1,997,186 7,013,035
Committed to 17,281,659 16,892,319 17,921,319 17,392,319 17,392,319
Assigned to 681,822 941,262 1,541,101 1,762,773 2,297,428
Unassigned - 1,961,211 1,712,930 2,839,620 1,888,896
Total General Fund 18,146,884$ 19,973,977$ 31,167,252$ $33,983,800 $33,779,102
All Other Governmental Funds
Reserved $ - $ - $ - $ - $ -
Reserved for current
projects, reported in:
Special revenue funds - - - - -
Capital projects funds - - - - -
Unreserved, reported in:
Special revenue funds - - - - -
Capital projects funds - - - - -
Undesignated, reported in:
Special revenue funds - - - - -
Capital projects funds - - - - -
Nonspendable - - 333,590 373,620 282,173
Restricted for 78,261,012 84,682,384 86,075,428 87,811,164 90,532,465
Committed to 1,860,686 984,157 1,656,212 698,161 796,697
Assigned to 488 - - - -
Unassigned (1,184,683) (846,790) (1,354,541) (1,347,939) (50,146)
Total All Other
Governmental Funds 78,937,503$ 84,819,751$ 86,710,689$ 87,535,006$ 91,561,189$
Note:
Source:
City of Escondido Finance Department.
The City of Escondido implemented GASB 54 for the fiscal year ended June 30, 2011 and has elected not to restate fund balance amounts in previous years.
CITY OF ESCONDIDO
Fund Balances of Governmental Funds (Continued)
Last Ten Fiscal Years
(modified accrual basis of accounting)
159
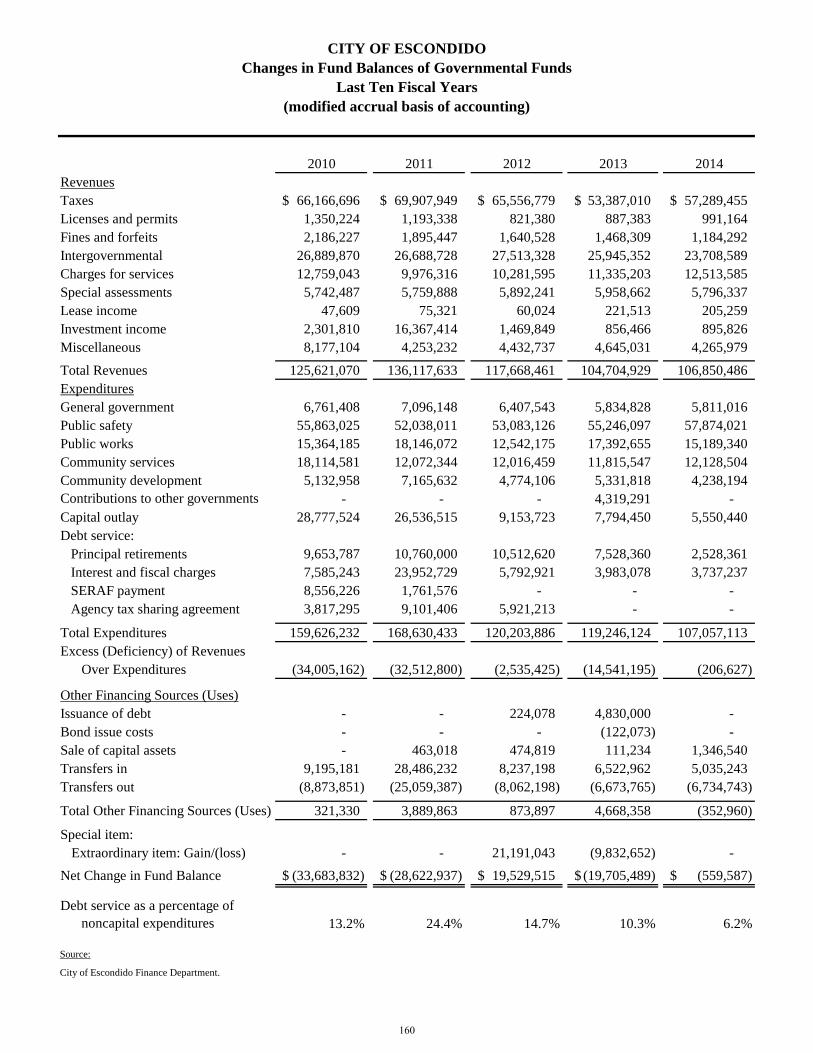
2010 2011 2012 2013 2014
Revenues
Taxes 66,166,696$ 69,907,949$ 65,556,779$ 53,387,010$ 57,289,455$
Licenses and permits 1,350,224 1,193,338 821,380 887,383 991,164
Fines and forfeits 2,186,227 1,895,447 1,640,528 1,468,309 1,184,292
Intergovernmental 26,889,870 26,688,728 27,513,328 25,945,352 23,708,589
Charges for services 12,759,043 9,976,316 10,281,595 11,335,203 12,513,585
Special assessments 5,742,487 5,759,888 5,892,241 5,958,662 5,796,337
Lease income 47,609 75,321 60,024 221,513 205,259
Investment income 2,301,810 16,367,414 1,469,849 856,466 895,826
Miscellaneous 8,177,104 4,253,232 4,432,737 4,645,031 4,265,979
Total Revenues 125,621,070 136,117,633 117,668,461 104,704,929 106,850,486
Expenditures
General government 6,761,408 7,096,148 6,407,543 5,834,828 5,811,016
Public safety 55,863,025 52,038,011 53,083,126 55,246,097 57,874,021
Public works 15,364,185 18,146,072 12,542,175 17,392,655 15,189,340
Community services 18,114,581 12,072,344 12,016,459 11,815,547 12,128,504
Community development 5,132,958 7,165,632 4,774,106 5,331,818 4,238,194
Contributions to other governments - - - 4,319,291 -
Capital outlay 28,777,524 26,536,515 9,153,723 7,794,450 5,550,440
Debt service:
Principal retirements 9,653,787 10,760,000 10,512,620 7,528,360 2,528,361
Interest and fiscal charges 7,585,243 23,952,729 5,792,921 3,983,078 3,737,237
SERAF payment 8,556,226 1,761,576 - - -
Agency tax sharing agreement 3,817,295 9,101,406 5,921,213 - -
Total Expenditures 159,626,232 168,630,433 120,203,886 119,246,124 107,057,113
Excess (Deficiency) of Revenues
Over Expenditures (34,005,162) (32,512,800) (2,535,425) (14,541,195) (206,627)
Other Financing Sources (Uses)
Issuance of debt - - 224,078 4,830,000 -
Bond issue costs - - - (122,073) -
Sale of capital assets - 463,018 474,819 111,234 1,346,540
Transfers in 9,195,181 28,486,232 8,237,198 6,522,962 5,035,243
Transfers out (8,873,851) (25,059,387) (8,062,198) (6,673,765) (6,734,743)
Total Other Financing Sources (Uses) 321,330 3,889,863 873,897 4,668,358 (352,960)
Special item:
Extraordinary item: Gain/(loss) - - 21,191,043 (9,832,652) -
Net Change in Fund Balance (33,683,832)$ (28,622,937)$ 19,529,515$ (19,705,489)$ (559,587)$
Debt service as a percentage of
noncapital expenditures 13.2% 24.4% 14.7% 10.3% 6.2%
Source:
City of Escondido Finance Department.
(modified accrual basis of accounting)
CITY OF ESCONDIDO
Changes in Fund Balances of Governmental Funds
Last Ten Fiscal Years
160

2015 2016 2017 2018 2019
Revenues
Taxes 59,989,511$ 64,220,119$ 62,296,112$ 86,246,378$ 89,722,666$
Licenses and permits 862,280 934,455 1,222,686 1,183,587 888,019
Fines and forfeits 1,151,366 1,344,221 1,186,276 1,076,387 1,257,729
Intergovernmental 22,900,854 24,648,821 23,485,944 17,091,365 18,031,912
Charges for services 13,670,047 13,509,208 16,154,072 16,305,361 15,438,111
Special assessments 5,970,331 5,567,955 5,589,696 797,529 831,574
Lease income 203,599 3,502,021 3,632,770 3,951,092 3,998,929
Investment income 941,778 1,245,689 540,184 481,733 3,130,835
Miscellaneous 4,544,360 1,574,553 2,298,139 467,910 824,270
Total Revenues 110,234,126 116,547,042 116,405,879 127,601,342 134,124,045
Expenditures
General government 6,086,111 6,447,372 6,251,493 6,212,196 6,404,132
Public safety 61,843,630 64,266,503 65,038,985 67,917,569 70,183,327
Public works 17,407,197 14,442,206 16,592,694 20,020,822 20,583,634
Community services 11,744,673 12,080,978 11,825,028 12,096,472 12,982,171
Community development 4,585,497 4,985,006 5,078,286 4,944,488 4,777,498
Contributions to other governments - - - - -
Capital outlay 2,966,301 3,919,203 6,084,281 10,522,490 7,606,834
Debt service:
Principal retirements 74,848,007 243,360 1,592,870 2,616,218 2,702,509
Interest and fiscal charges 5,637,963 2,351,824 3,235,906 3,216,739 3,133,810
SERAF payment - - - - -
Agency tax sharing agreement - - - - -
Total Expenditures 185,119,379 108,736,452 115,699,543 127,546,994 128,373,915
Excess (Deficiency) of Revenues
Over Expenditures (74,885,253) 7,810,590 706,336 54,348 5,750,130
Other Financing Sources (Uses)
Issuance of debt 70,660,479 - 3,230,225 2,095,893 -
Bond issue costs - - - - -
Sale of capital assets 138,304 173,751 - 1,724,580 -
Transfers in 3,173,695 2,968,322 3,765,952 5,615,293 4,056,429
Transfers out (4,748,440) (3,243,322) (4,450,952) (5,849,248) (5,985,074)
Total Other Financing Sources (Uses) 69,224,038 (101,249) 2,545,225 3,586,518 (1,928,645)
Special item:
Extraordinary item: Gain/(loss) - - 9,832,652 - -
Net Change in Fund Balance (5,661,215)$ 7,709,341$ 13,084,213$ 3,640,866$ 3,821,485$
Debt service as a percentage of
noncapital expenditures 5.4% 2.5% 4.4% 5.0% 4.8%
Source:
City of Escondido Finance Department.
(modified accrual basis of accounting)
CITY OF ESCONDIDO
Changes in Fund Balances of Governmental Funds (Continued)
Last Ten Fiscal Years
161

Fiscal Year
Ended
June 30 Residential Commercial Industrial Other Total
2010 8,231,590,550 939,687,068 734,423,838 1,918,881,771 11,824,583,227
2011 8,055,721,483 927,680,780 735,847,485 1,940,187,481 11,659,437,229
2012 8,250,098,328 915,511,275 704,991,571 1,890,820,616 11,761,421,790
2013 8,311,628,639 883,780,782 690,353,003 1,902,605,041 11,788,367,465
2014 8,565,684,527 874,571,529 684,905,167 1,989,341,749 12,114,502,972
2015 9,141,236,450 892,083,504 705,542,595 1,974,941,095 12,713,803,644
2016 9,660,263,316 929,027,539 722,758,161 2,034,053,982 13,346,102,998
2017 10,700,250,243 2,078,689,776 789,351,890 508,151,608 14,076,443,517
2018 11,429,262,692 2,231,580,409 825,162,925 546,043,980 15,032,050,006
2019 12,122,763,897 2,353,765,429 885,053,468 544,401,944 15,905,984,738
Fiscal Year Taxable Total
Ended Less: Assessed Direct Tax
June 30 Unsecured Exemptions Value Rate
2010 486,166,246 (587,494,693) 11,723,254,780 0.103
2011 462,394,959 (587,861,385) 11,533,970,803 0.103
2012 455,849,872 (597,181,491) 11,620,090,171 0.103
2013 462,158,958 (612,709,744) 11,637,816,679 0.103
2014 465,412,975 (622,608,050) 11,957,307,897 0.103
2015 494,147,367 (625,897,200) 12,582,053,811 0.103
2016 501,273,002 (659,335,434) 13,188,040,566 0.103
2017 505,626,175 (739,647,768) 13,842,421,924 0.103
2018 507,918,480 (756,770,988) 14,783,197,498 0.103
2019 559,432,166 (809,077,827) 15,656,339,077 0.103
Notes:
(1) Includes City of Escondido and Community Development Commission assessed values.
Source:
County of San Diego Auditor and Controller's Office.
Secured (1)
CITY OF ESCONDIDO
Assessed Value and Estimated Actual Value of Taxable Property
Last Ten Fiscal Years
In 1978 the voters of the State of California passed Proposition 13 which limited property taxes to a total maximum rate of 1% based upon the assessed
value of the property being taxed. Each year, the assessed value of property may be increased by an "inflation factor" (limited to a maximum increase of
2%). With few exceptions, property is only reassessed at the time that it is sold to a new owner. At that point, the new assessed value is reassessed at the
purchase price of the property sold. The assessed valuation data shown above represents the only data currently available with respect to the actual market
value of taxable property and is subject to the limitations described above.
162

CITY OF ESCONDIDO
Direct and Overlapping Property Tax Rates
(Rate per $100 of assessed value)
Last Ten Fiscal Years
Fiscal Year Voter Total
Ended School San Diego All Approved Tax
June 30 District County Other Total Debt Rate
2010 0.103 % 0.103 % 0.710 % 0.157 % 0.030 % 1.000 0.125 % 1.125 %
2011 0.103 0.103 0.710 0.157 0.030 1.000 0.139 1.139
2012 0.103 0.103 0.710 0.157 0.030 1.000 0.140 1.140
2013 0.103 0.103 0.710 0.157 0.030 1.000 0.141 1.141
2014 0.103 0.103 0.710 0.157 0.030 1.000 0.132 1.132
2015 0.103 0.103 0.710 0.157 0.030 1.000 0.127 1.127
2016 0.103 0.103 0.710 0.157 0.030 1.000 0.153 1.153
2017 0.103 0.103 0.710 0.157 0.030 1.000 0.146 1.146
2018 0.103 0.103 0.710 0.157 0.030 1.000 0.145 1.145
2019 0.103 0.103 0.710 0.157 0.030 1.000 0.141 1.141
Note:
* The City Direct Rate is the total direct rate to the City General Fund.
Source:
County of San Diego Auditor and Controller's Office.
TRA 004-013 is represented in this table
Allocation of 1% Ad Valorem Property Taxes
Overlapping Rates
In 1978, California voters passed Proposition 13 which sets the property tax rate at a 1.00% fixed amount. This 1.00% is shared by all taxing
agencies for which the subject property resides within.
City Total
Direct
Rate*
Direct
Rate
163

Taxable Taxable
Assessed Assessed
Taxpayer Value Rank Value Rank
North County Fair LLC $229,657,759 1 1.47 % $172,782,156 1 1.47 %
Prebys Conrad Trust 109,854,163 2 0.70 66,248,945 3 0.57
Eagle Rose Owner LLC 88,422,340 3 0.56
Casav Del LLC 68,959,956 4 0.44
Latitude Del LLC 61,791,541 5 0.39
Morningview Terrace Apts Ca 49,898,400 6 0.32
Frit Escondido Promenade LLC 49,215,846 7 0.31 28,728,879 0.25
Luna Properties LLC 42,060,684 8 0.27 25,855,846 0.22
Stone Brewing Co 41,388,882 9 0.26
Cox Communications California 40,974,742 10 0.26 46,369,183 4 0.40
M G Morningview Apartments 67,014,812 2 0.57
Vons 40,855,749 5 0.35
Realty Associates Fund Viii L 36,200,420 6 0.31
P K I Del Norte Plaza LP 34,853,400 7 0.30
O C/S D Holdings LLC 34,686,840 8 0.30
Goal Line L P 34,505,295 9 0.29
Lowes Of Escondido 29,749,500 10 0.25
TOTAL $782,224,313 4.98 % $617,851,025 5.28 %
Notes:
(1) Net assessed valuation for 2018-19 is $15,656,339,077
(2) Net assessed valuation for 2009-10 is $11,723,254,780
Source:
City of Escondido Finance Department & County Assessor
Percentage of
2019
Percentage of
CITY OF ESCONDIDO
Principal Property Taxpayers
Current Year and Nine Years Ago
2010
Total Taxable
Assessed
Value (1)
Assessed
Value (2)
Total Taxable
164

CITY OF ESCONDIDO
Property Tax Levies and Collections
Last Ten Fiscal Years
Collected within the
Fiscal Taxes Levied Fiscal Year of Levy Collections in
Year Ended for the Percent Subsequent Percent
June 30 Fiscal Year Amount of Levy Years Amount of Levy
2010 9,477,871 9,086,734 95.87 372,031 9,458,765 99.80
2011 9,382,618 9,097,417 96.96 247,404 9,344,821 99.60
2012 9,536,098 9,288,990 97.41 168,496 9,457,486 99.18
2013 9,720,947 9,489,467 97.62 155,805 9,645,271 99.22
2014 10,099,951 9,834,962 97.38 126,961 9,961,923 98.63
2015 10,403,367 10,222,663 98.26 189,807 10,412,470 100.09
2016 10,966,106 10,779,437 98.30 165,151 10,944,588 99.80
2017 11,541,072 11,328,962 98.16 167,550 11,496,512 99.61
2018 12,210,502 12,008,665 98.35 174,069 12,182,734 99.77
2019 13,245,889 12,990,223 98.07 142,712 13,132,935 99.15
Notes:
Source:
County of San Diego Auditor and Controller's Office.
The amounts presented do not include property taxes collected for the Community Development Commission in the following amounts: 2009/10 - $19,863,033
and 2010/11 - $19,092,408.
The Community Development Commission was dissolved in fiscal year 2011/12.
Total Collections to Date
165

Business Name Business Category Business Name Business Category
7-Eleven Food Stores Food Markets Apple Stores Furniture/Appliance
Arco AM/PM Mini Marts Service Stations Apro Energy Sales
Baker Electric Bldg.Matls-Whsle Arco AM/PM Mini Marts Service Stations
BMW of Escondido Auto Sales - New BMW of Escondido Auto Sales - New
Carmax Auto Superstores Auto Sales - Used Escondido Jeep Eagle GMC Auto Sales - New
Ford of Escondido Auto Sales - New Heller Ford Suzuki Auto Sales - New
Home Depot Bldg.Matls-Retail Home Depot Bldg.Matls-Retail
Honda of Escondido Auto Sales - New Honda of Escondido Auto Sales - New
Jack Powell Chrysler Jeep Dodge Auto Sales - New J C Penney Company Department Stores
Lexus Escondido Auto Sales - New Jack Powell Chrysler Plymouth Auto Sales - New
Lowe's Home Centers Bldg.Matls-Retail Lowe's Home Centers Bldg.Matls-Retail
Mercedes-Benz of Escondido Auto Sales - New Macy's Department Store Department Stores
Mossy Mitsubishi/Volkswagen Auto Sales - New Mercedes-Benz of Escondido Auto Sales - New
Mossy Nissan Escondido Auto Sales - New Mossy Nissan Escondido Auto Sales - NewNorth County Buick Cadillac
GMC Auto Sales - New Nordstrom Department Store Department Stores
North County Kia Auto Sales - New
North County Buick Cadillac
GMC Auto Sales - New
Pine Tree Lumber Bldg.Matls-Whsle Pine Tree Lumber Bldg.Matls-Retail
Quality Chevrolet Auto Sales - New Quality Chevrolet Auto Sales - New
Shell Service Stations Service Stations Sears Roebuck & Company Department Stores
Superior Ready Mix Concrete Bldg.Matls-Whsle Shell Service Stations Service Stations
Target Stores Department Stores Superior Ready Mix Concrete Bldg.Matls-Whsle
Toyota of Escondido Auto Sales - New Target Stores Department Stores
United Oil Service Stations Service Stations Toyota of Escondido Auto Parts/Repair
Vons Service Stations Service Stations Vons Grocery Company Food Markets
Wal Mart Stores Department Stores Vons Service Stations Service Stations
Notes:
Firms Listed Alphabetically
Source:
Avenu Insights & Analytics
CITY OF ESCONDIDO
Top 25 Sales Tax Producers
Current Year and Nine Years Ago
State law does not allow disclosure of the top ten sales tax providers to the City
2019 2010
166

Category Name 2010Q1 2011Q1 2012Q1 2013Q1 2014Q1
Accommodation and Food Services 1,198,951$ 1,710,802$ 1,790,636$ 1,937,241$ 2,095,916$
Administrative and Support and
Waste Management and
Remediation Services 116,661 79,049 87,377 104,215 137,762
Arts, Entertainment, and Recreation 14,996 11,102 11,920 16,196 20,666
Construction 713,587 127,917 95,163 106,385 91,283
Educational Services 9,916 37,240 38,220 39,586 42,224
Health Care and Social Assistance 61,864 88,267 280,381 55,560 49,298
Information 419,943 107,376 114,451 99,361 130,112
Manufacturing 222,534 1,068,332 1,196,132 1,105,616 1,215,223
Other Services (except Public
Administration) 240,238 350,448 378,669 388,155 420,768
Professional, Scientific, and
Technical Services 68,821 73,287 79,453 75,690 80,911
Real Estate and Rental and Leasing 40,066 250,236 317,452 353,982 362,060
Retail Trade 11,603,924 15,125,030 18,337,124 19,394,269 20,362,306
Transportation and Warehousing 301,691 3,853 5,277 5,320 6,347
Wholesale Trade 425,700 1,333,521 1,430,661 1,511,448 1,759,254
All Other Sectors 392,618 384,993 487,177 599,109
Total 15,438,891$ 20,759,079$ 24,547,910$ 25,680,201$ 27,373,240$
Notes:
The data contained in this report is economic and therefore constantly changing as adjustments, fund transfers, late filings and audits are recorded.
The categories listed in previous reports were based on SBOE NAICS codes and have been updated to reflect current updated CDTFA standards.
Source:
Avenu Insights & Analytics
CITY OF ESCONDIDO
Taxable Sales by Category
Last Ten Calendar Years (First Quarter)
167

Category Name 2015Q1 2016Q1 2017Q1 2018Q1 2019Q1
Accommodation and Food Services 2,243,053$ 2,449,825$ 2,602,746$ 2,741,428$ 2,719,900$
Administrative and Support and
Waste Management and
Remediation Services 105,771 92,689 113,747 128,435 140,601
Arts, Entertainment, and Recreation 24,418 41,617 61,706 39,834 51,499
Construction 115,879 82,417 88,791 120,122 461,469
Educational Services 43,233 37,292 40,002 33,195 37,379
Health Care and Social Assistance 44,747 50,224 51,939 54,909 40,068
Information 156,877 121,845 91,651 93,749 88,544
Manufacturing 1,437,742 1,436,670 1,471,757 1,648,799 1,489,494
Other Services (except Public
Administration) 434,319 450,688 504,010 510,377 547,494
Professional, Scientific, and
Technical Services 86,658 96,755 85,242 78,195 85,360
Real Estate and Rental and Leasing 392,684 403,294 420,714 518,327 570,531
Retail Trade 21,015,238 20,915,522 22,013,444 22,173,806 22,133,914
Transportation and Warehousing 12,571 11,617 11,099 13,351 20,118
Wholesale Trade 1,962,655 2,325,100 2,543,511 2,800,773 2,779,867
All Other Sectors 721,824 869,624 1,069,930 1,076,421 1,132,579
Total 28,797,669$ 29,385,181$ 31,170,290$ 32,031,721$ 32,298,818$
Notes:
The data contained in this report is economic and therefore constantly changing as adjustments, fund transfers, late filings and audits are recorded.
The categories listed in previous reports were based on SBOE NAICS codes and have been updated to reflect current updated CDTFA standards.
Source:
Avenu Insights & Analytics
CITY OF ESCONDIDO
Taxable Sales by Category (Continued)
Last Ten Calendar Years (First Quarter)
168

Fiscal Year General Lease Certificates Tax Capital Total
Ended Obligation Revenue of Allocation Loans Leases Governmental
June 30 Bonds Bonds Participation Bonds (2) Payable Payable Activities
2010 80,360,000$ 63,995,000$ 2,760,000$ 3,786,572$ 7,113,854$ - 158,015,426$
2011 78,860,000 56,000,000 2,295,000 4,033,736 6,246,320 - 147,435,056
2012 77,295,000 5,320,000 1,790,000 - 6,398,573 - 90,803,573
2013 75,665,000 4,830,000 1,240,000 - 994,926 - 82,729,926
2014 73,965,000 4,625,000 645,000 - 888,366 - 80,123,366
2015 61,520,000 4,415,000 - - 779,130 1,046,067 67,760,197
2016 61,520,000 4,200,000 - - 666,456 874,856 67,261,312
2017 60,460,000 3,980,000 - - 3,496,159 709,677 68,645,836
2018 58,680,000 3,750,000 - - 3,085,997 2,348,521 67,864,518
2019 56,810,000 3,515,000 - - 2,674,999 1,892,577 64,892,576
Notes:
Sources:
City of Escondido Finance Department, Avenu Insights & Analytics, U.S. Census Bureau, 2010 American Community Survey.
(2) Debt issued by the Escondido Community Development Commission is no longer reported as a result of the dissolution of the Community Development Commission
on February 1, 2012
CITY OF ESCONDIDO
Ratios of Outstanding Debt by Type
Last Ten Fiscal Years
Governmental Activities (1)
(1) Details regarding the City's outstanding debt can be found in Note 8 of the financial statements
169

Fiscal Year Revenue COP & Total Total Percentage Debt
Ended Lease Revenue Loans Business Primary of Personal Per
June 30 Bonds Payable Activities Government Income Capita
2010 82,315,000$ 25,981,179$ 108,296,179$ 266,311,605$ 7.66 % 1,832
2011 80,095,000 26,507,579 106,602,579 254,037,635 8.97 1,750
2012 118,420,000 24,715,177 143,135,177 233,938,750 7.80 1,602
2013 115,975,000 22,585,446 138,560,446 221,290,372 7.28 1,517
2014 113,075,000 20,448,701 133,523,701 213,647,067 6.65 1,452
2015 103,970,000 18,304,767 122,274,767 190,034,964 5.82 1,290
2016 101,250,000 16,153,467 117,403,467 184,664,779 5.56 1,225
2017 98,615,000 13,994,615 112,609,615 181,255,451 5.18 1,196
2018 95,890,000 11,839,768 107,729,768 175,594,286 4.72 1,159
2019 93,060,000 11,305,828 104,365,828 169,258,404 4.28 1,108
Notes:
Sources:
City of Escondido Finance Department, Avenu Insights & Analytics, U.S. Census Bureau, 2010 American Community Survey.
CITY OF ESCONDIDO
Ratios of Outstanding Debt by Type (Continued)
Last Ten Fiscal Years
Business-type Activities (1)
(1) Details regarding the City's outstanding debt can be found in Note 8 of the financial statements
(2) Debt issued by the Escondido Community Development Commission is no longer reported as a result of the dissolution of the Community Development
Commission on February 1, 2012
170

Fiscal Year General Certificates Tax Percent of
Ended Obligation of Allocation Assessed Per
June 30 Bonds Participation Bonds(2)
Total Value(1)
Capita
2010 80,360,000 2,760,000 3,786,572 86,906,572 0.74 598
2011 78,860,000 2,295,000 4,033,736 85,188,736 0.74 587
2012 77,295,000 1,790,000 - 79,085,000 0.68 541
2013 75,665,000 1,240,000 - 76,905,000 0.66 527
2014 73,965,000 645,000 - 74,610,000 0.62 507
2015 61,520,000 - - 61,520,000 0.49 418
2016 61,520,000 - - 61,520,000 0.47 408
2017 60,460,000 - - 60,460,000 0.44 399
2018 58,680,000 - - 58,680,000 0.40 387
2019 56,810,000 - - 56,810,000 0.36 372
Sources:
City of Escondido Finance Department
Avenu Insights & Analytics
(1) Assessed value has been used because the actual value of taxable property is not readily available in the State of California.
CITY OF ESCONDIDO
Ratio of General Bonded Debt Outstanding
Last Ten Fiscal Years
Outstanding General Obligation Bonded Debt
Notes:
171

2018-19 Assessed Valuation 16,040,918,913$
Redevelopment Agency Incremental Valuation 3,333,373,695
Adjusted Assessed Valuation 12,707,545,218$
Estimated Share
Outstanding of Overlapping
Debt 6/30/19 Debt
OVERLAPPING TAX AND ASSESSMENT DEBT:
Metropolitan Water District 0.547 % 48,050,000$ 262,834$
Palomar Community College District 13.091 618,718,625 80,996,455
San Marcos Unified School District School 3.513 274,121,554 9,629,890
San Marcos Unified School District School Facilities Improvement District No. 1 2.222 1,380,653 30,678
Escondido Union High School District 76.892 85,428,729 65,687,858
Escondido Union School District 77.583 136,864,622 106,183,680
San Pasqual Union School District 56.828 197,458 112,211
Palomar Pomerado Hospital District 19.091 431,124,259 82,305,932
City of Escondido 100.000 56,810,000 56,810,000
City of Escondido Community Facilities District No. 2006-01 100.000 12,545,000 12,545,000
City of Escondido Hidden Trails Community Facilities District 100.000 1,840,000 1,840,000
City of Escondido 1915 Act Bonds 100.000 2,125,000 2,125,000
TOTAL OVERLAPPING TAX AND ASSESSMENT DEBT 1,669,205,900 418,529,538
DIRECT AND OVERLAPPING GENERAL FUND DEBT:
San Diego County General Fund Obligations 3.049 255,365,000 7,786,079
San Diego County Pension Obligation Bonds 3.049 508,765,000 15,512,245
San Diego County Superintendent of School Obligations 3.049 10,085,000 307,492
Palomar Community College District Certificates of Participation 13.091 2,140,000 280,147
San Marcos Unified School General Fund Obligations 3.513 77,140,785 2,709,956
Escondido Union High School District Certificates of Participation 76.892 54,250,000 41,713,910
Escondido Union School District Certificates of Participation 77.583 15,525,000 12,044,761
Escondido Union School District Benefit Obligation Bonds 77.583 7,655,000 5,938,979
City of Escondido General Fund Lease Revenue Bonds 100.000 3,515,000 3,515,000
City of Escondido Lease Obligations 100.000 1,892,577 1,892,577
City of Escondido Loans Obligations 100.000 2,675,000 2,675,000
TOTAL DIRECT AND OVERLAPPING GENERAL FUND OBLIGATION DEBT 939,008,362 94,376,146
TOTAL CITY DIRECT DEBT 8,082,577$
TOTAL OVERLAPPING DEBT 504,823,107$
TOTAL DIRECT AND OVERLAPPING DEBT 512,905,684$ (2)
RATIOS TO 2018-19 ASSESSED VALUATION:
Total Overlapping Tax and Assessment Debt 2.61 %
Combined Direct Debt ($64,892,577) 0.05
Combined Total Debt 3.20
RATIOS TO REDEVELOPMENT SUCCESSOR AGENCY INCREMENTAL VALUATION ($3,333,373,695):
Total Overlapping Tax Increment Debt 0.23 %
Source: Avenu Insights & Analytics.
(2) Excludes tax and revenue anticipation notes, enterprise revenue, mortgage revenue, and non-bonded capital lease obligations.
Percentage
Applicable (1)
(1) The percentage of overlapping debt applicable to the city is estimated using taxable assessed property value. Applicable percentages were estimated by
determining the portion of the overlapping district's assessed value that is within the boundaries of the city divided by the district's total taxable assessed value.
CITY OF ESCONDIDO
Direct and Overlapping Debt
For the Year Ended June 30, 2019
172
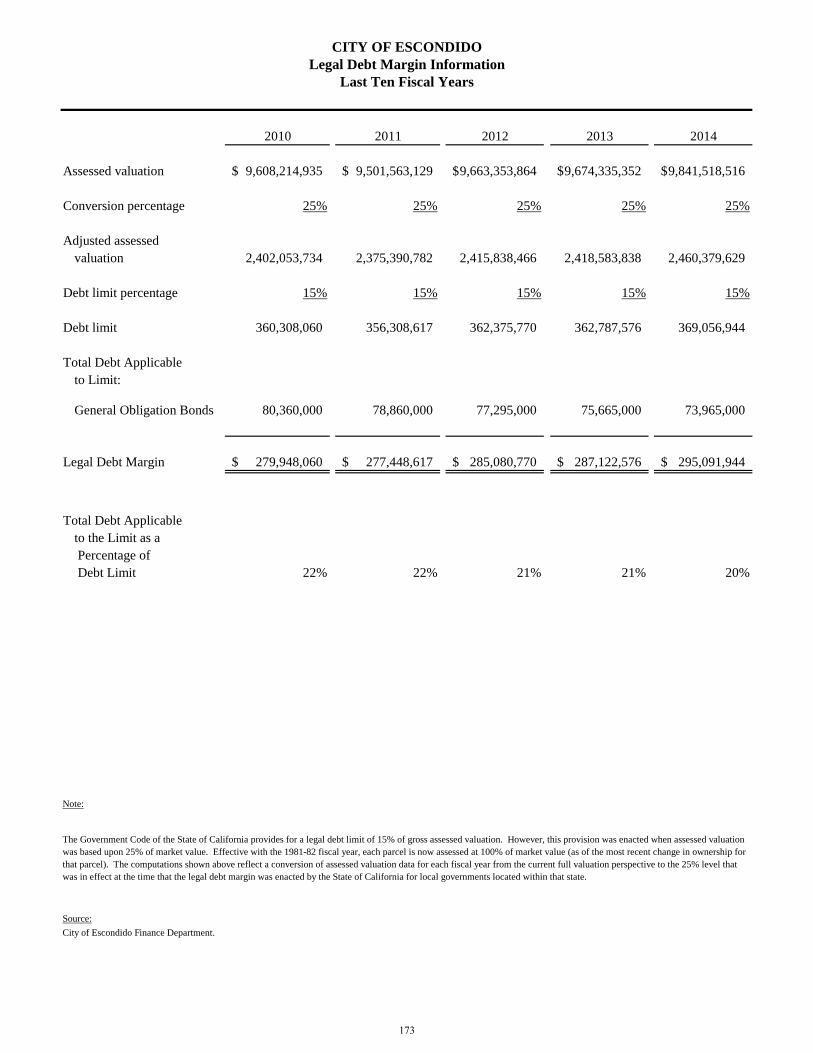
2010 2011 2012 2013 2014
Assessed valuation 9,608,214,935$ 9,501,563,129$ 9,663,353,864$ 9,674,335,352$ 9,841,518,516$
Conversion percentage 25% 25% 25% 25% 25%
Adjusted assessed
valuation 2,402,053,734 2,375,390,782 2,415,838,466 2,418,583,838 2,460,379,629
Debt limit percentage 15% 15% 15% 15% 15%
Debt limit 360,308,060 356,308,617 362,375,770 362,787,576 369,056,944
Total Debt Applicable
to Limit:
General Obligation Bonds 80,360,000 78,860,000 77,295,000 75,665,000 73,965,000
Legal Debt Margin 279,948,060$ 277,448,617$ 285,080,770$ 287,122,576$ 295,091,944$
Total Debt Applicable
to the Limit as a
Percentage of
Debt Limit 22% 22% 21% 21% 20%
Note:
Source:
City of Escondido Finance Department.
The Government Code of the State of California provides for a legal debt limit of 15% of gross assessed valuation. However, this provision was enacted when assessed valuation
was based upon 25% of market value. Effective with the 1981-82 fiscal year, each parcel is now assessed at 100% of market value (as of the most recent change in ownership for
that parcel). The computations shown above reflect a conversion of assessed valuation data for each fiscal year from the current full valuation perspective to the 25% level that
was in effect at the time that the legal debt margin was enacted by the State of California for local governments located within that state.
CITY OF ESCONDIDO
Legal Debt Margin Information
Last Ten Fiscal Years
173

2015 2016 2017 2018 2019
Assessed valuation 10,389,492,632$ 10,901,050,697$ 11,397,164,781$ 12,065,097,152$ 12,707,545,218$
Conversion percentage 25% 25% 25% 25% 25%
Adjusted assessed
valuation 2,597,373,158 2,725,262,674 2,849,291,195 3,016,274,288 3,176,886,305
Debt limit percentage 15% 15% 15% 15% 15%
Debt limit 389,605,974 408,789,401 427,393,679 452,441,143.20 476,532,945.68
Total Debt Applicable
to Limit:
General Obligation Bonds 61,520,000 61,520,000 60,460,000 58,680,000 56,810,000
Legal Debt Margin 328,085,974$ 347,269,401$ 366,933,679$ 393,761,143$ 419,722,946$
Total Debt Applicable
to the Limit as a
Percentage of
Debt Limit 16% 15% 14% 13% 12%
Note:
Source:
City of Escondido Finance Department.
CITY OF ESCONDIDO
Legal Debt Margin Information (Continued)
Last Ten Fiscal Years
The Government Code of the State of California provides for a legal debt limit of 15% of gross assessed valuation. However, this provision was enacted when assessed valuation was
based upon 25% of market value. Effective with the 1981-82 fiscal year, each parcel is now assessed at 100% of market value (as of the most recent change in ownership for that
parcel). The computations shown above reflect a conversion of assessed valuation data for each fiscal year from the current full valuation perspective to the 25% level that was in
effect at the time that the legal debt margin was enacted by the State of California for local governments located within that state.
174
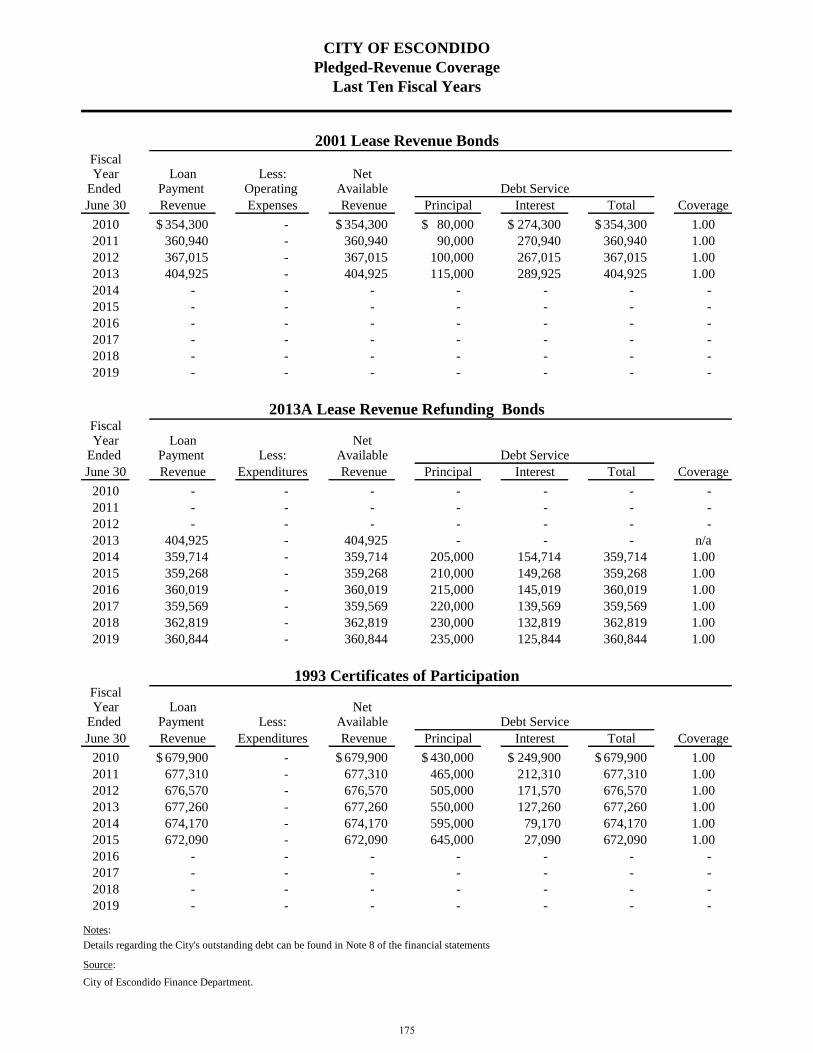
FiscalYear Loan Less: Net
Ended Payment Operating Available
June 30 Revenue Expenses Revenue Principal Interest Total Coverage
2010 354,300$ - 354,300$ 80,000$ 274,300$ 354,300$ 1.00
2011 360,940 - 360,940 90,000 270,940 360,940 1.00
2012 367,015 - 367,015 100,000 267,015 367,015 1.00
2013 404,925 - 404,925 115,000 289,925 404,925 1.00
2014 - - - - - - -
2015 - - - - - - -
2016 - - - - - - -
2017 - - - - - - -
2018 - - - - - - -
2019 - - - - - - -
FiscalYear Loan Net
Ended Payment Less: Available
June 30 Revenue Expenditures Revenue Principal Interest Total Coverage
2010 - - - - - - -
2011 - - - - - - -
2012 - - - - - - -
2013 404,925 - 404,925 - - - n/a
2014 359,714 - 359,714 205,000 154,714 359,714 1.00
2015 359,268 - 359,268 210,000 149,268 359,268 1.00
2016 360,019 - 360,019 215,000 145,019 360,019 1.00
2017 359,569 - 359,569 220,000 139,569 359,569 1.00
2018 362,819 - 362,819 230,000 132,819 362,819 1.00
2019 360,844 - 360,844 235,000 125,844 360,844 1.00
FiscalYear Loan Net
Ended Payment Less: Available
June 30 Revenue Expenditures Revenue Principal Interest Total Coverage
2010 679,900$ - 679,900$ 430,000$ 249,900$ 679,900$ 1.00
2011 677,310 - 677,310 465,000 212,310 677,310 1.00
2012 676,570 - 676,570 505,000 171,570 676,570 1.00
2013 677,260 - 677,260 550,000 127,260 677,260 1.00
2014 674,170 - 674,170 595,000 79,170 674,170 1.00
2015 672,090 - 672,090 645,000 27,090 672,090 1.00
2016 - - - - - - -
2017 - - - - - - -
2018 - - - - - - -
2019 - - - - - - -
Notes:
Details regarding the City's outstanding debt can be found in Note 8 of the financial statements
Source:
City of Escondido Finance Department.
Debt Service
2013A Lease Revenue Refunding Bonds
1993 Certificates of Participation
Debt Service
Debt Service
Last Ten Fiscal Years
2001 Lease Revenue Bonds
CITY OF ESCONDIDO
Pledged-Revenue Coverage
175

Fiscal Charges forYear Services Less Net
Ended and Other Operating Available
June 30 Revenue Expenses Revenue Principal Interest Total Coverage
2010 72,191,950$ 52,131,987$ 20,059,963$ 2,135,000$ 3,937,058$ 6,072,058$ 3.30
2011 67,713,179 49,064,535 18,648,644 2,220,000 3,852,716 6,072,716 3.07
2012 71,296,465 53,021,213 18,275,252 2,310,000 4,020,204 6,330,204 2.89
2013 79,799,930 60,004,862 19,795,068 2,445,000 5,169,939 7,614,939 2.60
2014 86,667,661 65,419,946 21,247,715 2,900,000 5,331,367 8,231,367 2.58
2015 87,671,696 66,305,756 21,365,940 1,170,000 3,974,086 5,144,086 4.15
2016 86,015,050 66,144,441 19,870,609 2,720,000 4,559,645 7,279,645 2.73
2017 93,821,259 72,905,682 20,915,577 2,635,000 4,643,985 7,278,985 2.87
2018 101,325,778 80,281,886 21,043,892 2,725,000 4,545,937 7,270,937 2.89
2019 98,754,414 76,800,519 21,953,895 2,830,000 4,435,876 7,265,876 3.02
FiscalYear Special Net
Ended Assessment Less: Available
June 30 Collections Expenditures Revenue Principal Interest Total Coverage
2010 229,274$ - 229,274$ 60,000$ 166,850$ 226,850$ 1.01
2011 238,709 - 238,709 75,000 162,900 237,900 1.00
2012 209,432 - 209,432 65,000 159,357 224,357 0.93
2013 229,435 - 229,435 70,000 155,610 225,610 1.02
2014 227,470 - 227,470 75,000 130,338 205,338 1.11
2015 202,543 - 202,543 95,000 185,180 280,180 0.72
2016 192,845 - 192,845 100,000 88,231 188,231 1.02
2017 199,532 - 199,532 100,000 86,231 186,231 1.07
2018 202,926 - 202,926 110,000 83,994 193,994 1.05
2019 201,350 - 201,350 110,000 81,381 191,381 1.05
FiscalYear Special Net
Ended Assessment Less: Available
June 30 Collections Expenditures Revenue Principal Interest Total Coverage
2010 1,419,402$ - 1,419,402$ 320,000.00 893,243$ 1,213,243$ 1.17
2011 1,182,479 - 1,182,479 330,000 879,630 1,209,630 0.98
2012 1,225,888 - 1,225,888 345,000 865,114 1,210,114 1.01
2013 1,252,550 - 1,252,550 360,000 849,600 1,209,600 1.04
2014 1,231,047 - 1,231,047 375,000 833,058 1,208,058 1.02
2015 1,240,086 - 1,240,086 - 1,218,656 1,218,656 1.02
2016 1,088,472 - 1,088,472 - 445,103 445,103 2.45
2017 1,028,832 - 1,028,832 295,000 594,950 889,950 1.16
2018 1,067,698 - 1,067,698 445,000 587,550 1,032,550 1.03
2019 1,044,975 - 1,044,975 460,000 576,200 1,036,200 1.01
Notes:
Details regarding the City's outstanding debt can be found in Note 8 of the financial statements
Source:
City of Escondido Finance Department.
Debt Service
Debt Service
Special Assessment Debt - Hidden Trails
Debt Service
Special Assessment Debt - Eureka Ranch
Water and Wastewater Revenue and Revenue Certificates of Participation
Last Ten Fiscal Years
CITY OF ESCONDIDO
Pledged-Revenue Coverage (Continued)
176

FiscalYear Special Net
Ended Assessment Less: Available
June 30 Collections Expenditures Revenue Principal Interest Total Coverage
2010 335,748$ - 335,748$ 195,000$ 135,422$ 330,422$ 1.02
2011 338,480 - 338,480 205,000 124,172 329,172 1.03
2012 347,187 - 347,187 215,000 112,359 327,359 1.06
2013 343,514 - 343,514 225,000 99,984 324,984 1.06
2014 347,171 - 347,171 240,000 86,906 326,906 1.06
2015 343,788 - 343,788 255,000 72,984 327,984 1.05
2016 343,967 - 343,967 270,000 58,219 328,219 1.05
2017 340,252 - 340,252 285,000 42,609 327,609 1.04
2018 338,357 - 338,357 300,000 26,156 326,156 1.04
2019 327,091 - 327,091 315,000 8,859 323,859 1.01
FiscalYear Special Net
Ended Assessment Less: Available
June 30 Collections Expenditures Revenue Principal Interest Total Coverage
2010 351,695$ - 351,695$ 125,000$ 207,774$ 332,774$ 1.06
2011 351,270 - 351,270 130,000 200,920 330,920 1.06
2012 357,610 - 357,610 140,000 193,595 333,595 1.07
2013 350,697 - 350,697 145,000 185,793 330,793 1.06
2014 355,975 - 355,975 155,000 177,543 332,543 1.07
2015 349,564 - 349,564 165,000 168,577 333,577 1.05
2016 345,177 - 345,177 175,000 158,887 333,887 1.03
2017 353,979 - 353,979 175,000 148,913 323,913 1.09
2018 348,126 - 348,126 195,000 138,368 333,368 1.04
2019 353,023 - 353,023 205,000 126,968 331,968 1.06
Notes:
Details regarding the City's outstanding debt can be found in Note 8 of the financial statements
Source:
City of Escondido Finance Department.
Debt Service
Debt Service
Special Assessment Debt - Rancho San Pasqual
Last Ten Fiscal Years
Special Assessment Debt - Auto Parkway
CITY OF ESCONDIDO
Pledged-Revenue Coverage (Continued)
177

Calendar
Year Population(1)
Personal Income
(in millions)(2)
Per Capita
Income(2)
2009 145,388 3,477$ 23,914$ 10.1 %
2010 145,196 2,833 19,514 10.6
2011 146,064 2,999 20,536 9.9
2012 145,908 3,040 20,836 9.3
2013 147,102 3,214 21,851 7.9
2014 147,294 3,267 22,181 4.8
2015 150,760 3,323 22,042 5.2
2016 151,492 3,500 23,103 4.7
2017 151,478 3,700 24,573 3.1
2018 152,739 3,960 25,919 2.7
Notes:
Sources:
Avenu Insights & Analytics, U.S. Census Bureau, 2010 American Community Survey.
The California Department of Finance demographics estimates now incorporate 2010 Census counts as the benchmark
(1) Population Projections are provided by the California Department of Finance Projections.
(2) Income Data is provided by the U.S. Census Bureau, 2010 American Community Survey.
(3) Unemployment Data is provided by the EDD's Bureau of Labor Statistics Department.
CITY OF ESCONDIDO
Demographic and Economic Statistics
Last Ten Calendar Years
Unemployment
Rate(3)
178
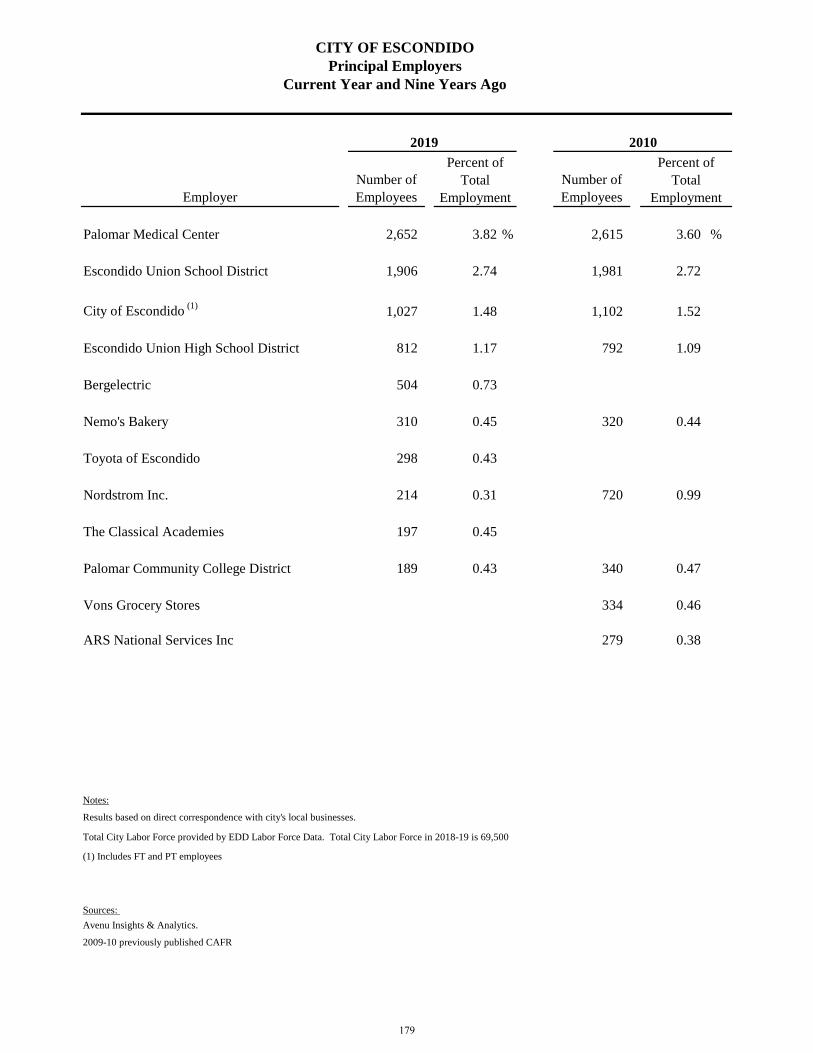
Employer
Number of
Employees
Number of
Employees
Palomar Medical Center 2,652 3.82 % 2,615 3.60 %
Escondido Union School District 1,906 2.74 1,981 2.72
City of Escondido (1)
1,027 1.48 1,102 1.52
Escondido Union High School District 812 1.17 792 1.09
Bergelectric 504 0.73
Nemo's Bakery 310 0.45 320 0.44
Toyota of Escondido 298 0.43
Nordstrom Inc. 214 0.31 720 0.99
The Classical Academies 197 0.45
Palomar Community College District 189 0.43 340 0.47
Vons Grocery Stores 334 0.46
ARS National Services Inc 279 0.38
Notes:
Results based on direct correspondence with city's local businesses.
Total City Labor Force provided by EDD Labor Force Data. Total City Labor Force in 2018-19 is 69,500
(1) Includes FT and PT employees
Sources:
Avenu Insights & Analytics.
2009-10 previously published CAFR
CITY OF ESCONDIDO
Principal Employers
Current Year and Nine Years Ago
2019
Percent of
Total
Employment
Percent of
Total
Employment
2010
179

Function 2010 2011 2012 2013 2014 2015 2016 2017 2018 2019
General Government 110 109 106 108 111 107 113 120 123 115
Public Safety 381 375 360 374 383 365 383 398 397 397
Public Works 142 143 151 154 148 140 118 111 107 105
Community Development 39 38 37 35 36 37 38 37 37 36
Community Services 225 224 216 225 206 174 168 167 94 105
Housing &
Neighborhood Services 14 15 12 10 10 9 10 9 10 9
Water 117 118 118 114 114 118 115 117 115 121
Wastewater 74 75 73 71 82 78 73 73 71 72
Total 1,102 1,097 1,073 1,091 1,090 1,028 1,018 1,032 954 960
Source:
City of Escondido Finance Department.
CITY OF ESCONDIDO
Full-time and Part-time City Employees by Function
Last Ten Fiscal Years
As of June 30
180

Function 2010 2011 2012 2013 2014
Police:
Physical Arrests 7,190 7,617 7,032 5,988 5,740
Traffic Violations 16,956 13,811 13,054 9,782 8,454
Parking Violations 7,606 5,784 4,514 4,022 4,328
Fire:
Number of Calls Answered 11,544 11,370 11,978 13,065 13,139
Number of Inspections Conducted 2,059 2,222 1,380 1,741 1,496
Public Works(1)
:
Street Resurfacing (miles) 1.5 9.5 3.0 19.3 18.6
Parks and Recreation(2)
:
Number of Recreation Classes 1,101 1,176 990 1,275 2,410
Number of Facility Rentals 1,106 1,125 995 2,541 1,975
Golf Rounds Played 97,683 95,020 95,934 95,528 97,094
Water:
Number of Service Connections 26,390 26,489 26,502 26,508 26,536
Average Daily Consumption (gallons) 18,799,222 18,835,000 20,220,000 23,370,000 22,579,315
Sewer:
Number of Service Connections 27,014 27,066 27,054 27,072 27,102
Average Daily Treatment (gallons) 12,500,000 12,900,000 12,730,000 12,630,000 12,100,000
Note:
(1) Funding for street resurfacing was increased beginning in 2013
(2) A new registration process for recreation was implemented in 2013.
Source:
City of Escondido.
CITY OF ESCONDIDO
Operating Indicators by Function
Last Ten Fiscal Years
181

Function 2015 2016 2017 2018 2019
Police:
Physical Arrests 4,923 5,114 5,533 5,763 5,491
Traffic Violations 8,528 7,038 6,912 5,779 7,221
Parking Violations 5,571 6,052 6,218 6,752 7,509
Fire:
Number of Calls Answered 13,450 14,553 15,369 16,710 16,154
Number of Inspections Conducted 2,590 2,086 1,826 3,624 4,082
Public Works(1)
:
Street Resurfacing (miles) 44.0 63.5 67.0 94.0 98.0
Parks and Recreation(2)
:
Number of Recreation Classes 1,070 808 577 640 728
Number of Facility Rentals 1,770 1,857 3,056 3,482 3,000
Golf Rounds Played 94,917 99,130 97,394 99,817 96,709
Water:
Number of Service Connections 26,567 26,617 26,694 26,884 27,052
Average Daily Consumption (gallons) 19,500,000 16,680,000 17,206,595 19,431,105 17,120,000
Sewer:
Number of Service Connections 27,139 27,048 27,070 48,092 48,161
Average Daily Treatment (gallons) 11,900,000 11,700,000 12,600,000 12,300,000 13,400,000
Note:
(1) Funding for street resurfacing was increased beginning in 2013
(2) A new registration process for recreation was implemented in 2013.
Source:
City of Escondido.
CITY OF ESCONDIDO
Operating Indicators by Function (Continued)
Last Ten Fiscal Years
182

Function 2010 2011 2012 2013 2014
Police:
Stations 1 1 1 1 1
Fire:
Stations 7 7 7 7 7
Public Works:
Streets (miles) 304.4 304.6 304.9 305.0 305.0
Streetlights 6,460 6,479 6,480 6,479 6,487
Traffic Signals 146 148 148 151 152
Parks and Recreation:
Parks 14 14 14 14 14
Community Centers 3 3 3 3 3
Golf Courses 2 2 2 2 2
Water:
Water Mains (miles) 430 430 430 431 431
Maximum Daily Plant
Capacity (gallons) 75,000,000 75,000,000 75,000,000 75,000,000 75,000,000
Sewer:
Sanitary Sewers (miles) 351 352 355 363 379
Storm Drains (miles) 380 381 383 382 377
Maximum Daily Treatment
Capacity (gallons) 18,000,000 18,000,000 18,000,000 18,000,000 18,000,000
Source:
City of Escondido.
CITY OF ESCONDIDO
Capital Asset Statistics by Function
Last Ten Fiscal Years
183

Function 2015 2016 2017 2018 2019
Police:
Stations 1 1 1 1 1
Fire:
Stations 7 7 7 7 7
Public Works:
Streets (miles) 306.2 307.4 323.0 363.8 331.0
Streetlights 6,488 6,489 6,489 6,489 6,635
Traffic Signals 153 155 155 155 165
Parks and Recreation:
Parks 14 14 14 14 14
Community Centers 3 3 3 3 3
Golf Courses 2 2 2 2 2
Water:
Water Mains (miles) 423 423 430 436 436
Maximum Daily Plant
Capacity (gallons) 75,000,000 75,000,000 75,000,000 75,000,000 75,000,000
Sewer:
Sanitary Sewers (miles) 374 380 380 389 389
Storm Drains (miles) 411 411 221 200 200
Maximum Daily Treatment
Capacity (gallons) 18,000,000 18,000,000 18,000,000 18,000,000 18,000,000
Source:
City of Escondido.
CITY OF ESCONDIDO
Capital Asset Statistics by Function (Continued)
Last Ten Fiscal Years
184