California Agricultural Exports · PDF filen 2010, California agricultural exports reached...
13
California Agricultural Exports California Agricultural Statistics Review 2011-2012 115 California Agricultural Exports n 2010, California agricultural exports reached $14.7 billion, representing a 125 percent increase over the past 11 years. As indicated by the table below, California’s agricultural export growth is continuing despite the recent global economic downturn. California Agricultural Export Values, 2000-2010 Millions 2000 $6.53 2001 $6.51 2002 $6.55 2003 $7.50 2004 $8.24 2005 $9.37 2006 $9.82 2007 $11.17 2008 $12.90 2009 $12.34 2010 $14.72 Exports of almonds continued to be the top commodity from California, with $2.3 billion in international sales. Dairy products rebounded from a downturn in 2009 with an 88 percent increase in 2010, ranking this category No. 2 in export value at $1.1 billion. I The leading 57 export commodities accounted for $12.8 billion, or 88 percent of total exports, while the remaining 12 percent of exports were associated with “other products and mixtures.” Of the top 57 commodities, 41 experienced an increase in export value of 5 percent or greater. California’s share of total U.S. agricultural exports was 14 percent in 2010, representing a 1.9 percent increase over 2009. California’s top 10 export commodities accounted for 64 percent of the state’s total agricultural exports. The top 10 export destinations—Canada, European Union and China/ Hong Kong—accounted for 45 percent of the 2010 export value. The California Department of Food and Agriculture works closely with the Western United States Agricultural Trade Association and the Centers for International Trade Development to increase California’s agricultural exports and provide trade services to the state’s farmers, ranchers and food processors. Methodology Data to compute agricultural exports are derived from official government sources, published industry sources and unpublished information from government and industry. Export quantities and values of the whole U.S. and California port districts are from the Department of Commerce trade data posted on the United States International Trade Commission online database (http://dataweb.usitc.gov/). Canadian import (value) data are from Strategis Canada’s online database (http:// strategis.ic.gc.ca /engdoc/main.html ). If the California export price is not available for a particular product, the University of California Agricultural Issues Center used
Transcript of California Agricultural Exports · PDF filen 2010, California agricultural exports reached...

California Agricultural Exports California Agricultural Statistics Review 2011-2012 115
California Agricultural Exports
n 2010, California agricultural exports reached $14.7 billion, representing a 125 percent increase over the past 11 years. As indicated by the table below, California’s agricultural export growth is continuing despite the recent global economic downturn.
California Agricultural Export Values, 2000-2010 Millions 2000 $6.53 2001 $6.51 2002 $6.55 2003 $7.50 2004 $8.24 2005 $9.37 2006 $9.82 2007 $11.17 2008 $12.90 2009 $12.34 2010 $14.72
Exports of almonds continued to be the top commodity from California, with $2.3 billion in international sales. Dairy products rebounded from a downturn in 2009 with an 88 percent increase in 2010, ranking this category No. 2 in export value at $1.1 billion.
I The leading 57 export commodities accounted for $12.8 billion, or 88 percent of total exports, while the remaining 12 percent of exports were associated with “other products and mixtures.” Of the top 57 commodities, 41 experienced an increase in export value of 5 percent or greater.
California’s share of total U.S. agricultural exports was 14 percent in 2010, representing a 1.9 percent increase over 2009. California’s top 10 export commodities accounted for 64 percent of the state’s total agricultural exports. The top 10 export destinations—Canada, European Union and China/Hong Kong—accounted for 45 percent of the 2010 export value.
The California Department of Food and Agriculture works closely with the Western United States Agricultural Trade Association and the Centers for International Trade Development to increase California’s agricultural exports and provide trade services to the state’s farmers, ranchers and food processors.
Methodology
Data to compute agricultural exports are derived from official government sources, published industry sources and unpublished information from government and industry. Export quantities
and values of the whole U.S. and California port districts are from the Department of Commerce trade data posted on the United States International Trade Commission online database (http://dataweb.usitc.gov/). Canadian import (value) data are from Strategis Canada’s online database (http:// strategis.ic.gc.ca /engdoc/main.html ). If the California export price is not available for a particular product, the University of California Agricultural Issues Center used

California Agricultural Exports California Agricultural Statistics Review 2011-2012 116
the U.S. average export price for that commodity to provide a dollar value for exports. Production quantities and values are from various National Agricultural Statistics Service, Economic Research Service, and Agricultural Marketing Service publications.
The University of California Agricultural Issues Center export estimates differ from other sources, such as the Economic Research Service, on methodological issues. The Economic Research Service estimates are based on a state’s share of production of the exported commodity. It is assumed that, for any particular commodity, a state’s share of U.S. production equals that state’s share of U.S. exports. Other sources use port data instead, without direct links to where the product originated. The Agricultural Issues Center export figures correspond to commodities that have been produced within the state. Products originated in another state and exported via California ports are not included in these statistics. In most cases the final Agricultural Issues Center report presents the export data at the individual commodity level. For instance, exports of a given fruit in fresh, canned and dried forms are added up and listed under the name of the fruit, although the estimation of fresh fruit exports may differ from the methodology used for canned and dried fruit.
The ratio of quantity exported to quantity produced is given on a farm-weight basis. That means, for example, that wine is converted back into fresh grapes. Standard conversion factors published by the USDA are applied.
To improve the accuracy of the 2010 export data, the Agricultural Issues Center examined if previous assumptions accurately reflected current marketing situations for each of the top 56 commodities listed in 2009. As a result, estimation methods for hay exports were updated and improved. Previous estimates of California hay exports included exports of alfalfa seed for sowing along with California share of U.S. production for cubes and pellets. New estimation methods only include exports of cubes and pellets from California ports and use California share of production among the western states of Arizona, California, Nevada and Utah. We used the new estimation methods to revise 2008 and 2009 export data. Further revisions to 2008 and 2009 estimates reflect updated figures related to production data.
Exports of alfalfa seed and other seed crops are aggregated under the category “Seeds for sowing,” which have been added in the 2010 data as a separate principal commodity. Previously, estimates of seed exports were included in the “Total Other Products and Mixtures” category.

California Agricultural Exports California Agricultural Statistics Review 2011-2012 117
2009
$1 Million
1 Almonds 1 1,899 1,923 2,392 24
2 Dairy and Products 1,214 608 1,143 88
3 Wine 910 812 1,007 24
4 Walnuts 491 666 820 23
5 Rice 552 877 797 -9
6 Pistachios 581 682 720 5
7 Table Grapes 618 594 641 8
8 Oranges and Products 1 438 422 568 34
9 Tomatoes, Processed 490 458 492 8
10 Cotton 377 257 416 62
11 Lettuce 338 320 331 3
12 Raisins 300 286 327 14
13 Strawberries 303 297 327 10
14 Seeds, Sowing 2 264 281 310 10
15 Beef and Products 1 228 206 293 43
16 Hay3 125 178 208 17
17 Dried Plums 179 155 174 12
18 Lemons1 159 134 148 11
19 Peaches and Nectarines 174 124 141 14
20 Broccoli 120 113 129 14
21 Cherries 1 121 92 128 39
22 Raspberries and Blackberries 1, 4 85 87 114 32
23 Carrots1 109 112 112 0
24 Onions 75 72 87 22
25 Flowers and Nursery 1 82 83 86 4
26 Cauliflower 1 65 72 85 18
27 Plums 69 55 68 24
28 Celery 60 59 62 4
29 Tomatoes, Fresh 1 48 60 59 -2
30 Melons 51 50 55 11
31 Spinach 39 45 51 14
32 Tangerines and Mandarins 31 33 40 19
33 Grape Juice 49 41 39 -3
34 Grapefruit 39 34 35 4
35 Potatoes 33 29 32 9
36 Bell and Chili Peppers 31 27 30 12
37 Wheat 49 32 30 -8
38 Garlic 25 24 29 22
39 Avocados 9 3 28 711
40 Blueberries 19 19 26 36
41 Pears 31 28 26 -8
42 Turkey 25 20 24 23
43 Dates 20 21 24 14
44 Figs 15 18 20 17
45 Apples 1 36 20 20 4
46 Dry Beans 17 15 20 41
47 Asparagus1 11 13 19 38
48 Sweet Potatoes 14 17 18 5
49 Cottonseed and Byproducts 1 14 11 16 45
50 Olives and Olive Oil 5 19 18 15 -15
51 Kiwi 13 11 14 31
52 Apricots 18 11 13 21
53 Chicken 10 9 10 6
California Agricultural Product Export Values and Rankings, 2008-20102010Rank
Commodity 2008 2010 Change in Value (In Percent)

California Agricultural Exports California Agricultural Statistics Review 2011-2012 118
Source: University of California, Agricultural Issues Center. 1 Export values were revised for 2009 based on updated production data from the U.S. Department of Agriculture/National Agricultural Statistics Service (USDA NASS). 2 “Seeds, Sowing” have been added as a separate principal commodity. Previously, estimates of seed exports were included in the “Total Other Products and Mixtures” category. 3 Hay export values for 2008 and 2009 were revised based on updated estimation methodologies, including the removal of alfalfa seed exports, which are now included in exports of seeds for sowing. 4 “Raspberries and Blackberries” category also include exports of mulberries and loganberries. 5 Product category “Olives and Olive Oil” is equal to the product category “Olives” found in previous years' data tables. 6 Total principal commodity values for 2008 and 2009 were revised based on updates to USDA NASS production data and estimation methodologies related to exports of hay and seeds for sowing. 7 The value for "Total Other Products and Mixtures" is composed of (a) highly processed products that are difficult to attribute to a specific commodity such as mixtures of fruits, nuts and vegetables and other processed foods; and (b) animal and plant products marketed in such small quantities that they are not included in the top 57 leading commodities. This category no longer includes seeds for sowing. 8 Total “Other Products and Mixtures” values for 2008 and 2009 were revised based on the elimination of seeds for sowing from this category. 9 Export values for each year are rounded. More precise numbers are used in the percent change calculations.
2009
$1 Million
California Agricultural Product Export Values and Rankings, 2008-20102010Rank
Commodity 2008 2010 Change in Value (In Percent)
54 Eggs 1 3 6 5 -12
55 Mushrooms 4 4 4 2
56 Artichokes 3 3 4 40
57 Cabbage 4 4 4 -3
11,108 10,650 12,840 21
1,791 1,689 1,880 11
12,898 12,339 14,720 19
Source: University of California, Agricultural Issues Center.
9 Export values for each year are rounded. More precise numbers are used in the percent change calculations.
5 Product category olives and olive oil is equal to the product category olives found in previous years' data tables.6 Total principal commodity values for 2008 and 2009 were revised based on updates to USDA NASS production data and estimation methodologies related to exports of hay and seeds for sowing.7 The value for "Total Other Products and Mixtures" is composed of (a) highly processed products that are difficult to attribute to a specific commodity such as mixtures of fruits, nuts and vegetables and other processed foods; and (b) animal and plant products marketed in such small quantities that they are not included in the top 57 leading commodities. This category no longer includes seeds for sowing. 8 Total other products and mixtures values for 2008 and 2009 were revised based on the elimination of seeds for sowing from this category.
Total Principal Commodities 5
Total Other Products and Mixtures 6,7
Total All Agricultural Exports 8
1 Export values were revised for 2009 based on updated production data from the U.S. Department of Agriculture/National Agricultural Statistics Service.2 Seeds, sowing have been added as a separate principal commodity. Previously, estimates of seed exports were included in the total other products and mixtures category.3 Hay export values for 2008 and 2009 were revised based on updated estimation methodologies, including the removal of alfalfa seed exports, which are now included in exports of seeds for sowing.4 Raspberries and blackberries category also include exports of mulberries and loganberries.
continued
California Agricultural Exports California Agricultural Statistics Review 2011-2012 119
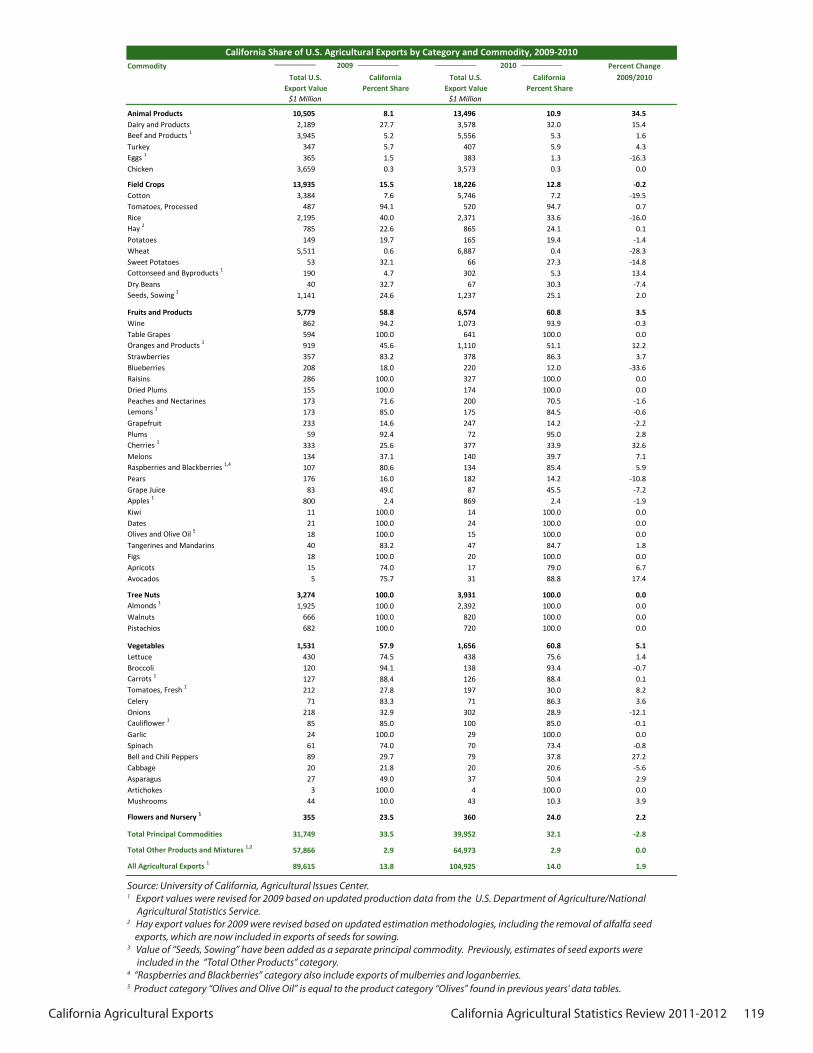
Commodity Percent ChangeTotal U.S. California Total U.S. California 2009/2010
Export Value Percent Share Export Value Percent Share$1 Million $1 Million
Animal Products 10,505 8.1 13,496 10.9 34.5Dairy and Products 2,189 27.7 3,578 32.0 15.4Beef and Products 1 3,945 5.2 5,556 5.3 1.6Turkey 347 5.7 407 5.9 4.3Eggs 1 365 1.5 383 1.3 -16.3Chicken 3,659 0.3 3,573 0.3 0.0
Field Crops 13,935 15.5 18,226 12.8 -0.2Cotton 3,384 7.6 5,746 7.2 -19.5Tomatoes, Processed 487 94.1 520 94.7 0.7Rice 2,195 40.0 2,371 33.6 -16.0Hay 2 785 22.6 865 24.1 0.1Potatoes 149 19.7 165 19.4 -1.4Wheat 5,511 0.6 6,887 0.4 -28.3Sweet Potatoes 53 32.1 66 27.3 -14.8Cottonseed and Byproducts 1 190 4.7 302 5.3 13.4Dry Beans 40 32.7 67 30.3 -7.4Seeds, Sowing 3 1,141 24.6 1,237 25.1 2.0
Fruits and Products 5,779 58.8 6,574 60.8 3.5Wine 862 94.2 1,073 93.9 -0.3Table Grapes 594 100.0 641 100.0 0.0Oranges and Products 1 919 45.6 1,110 51.1 12.2Strawberries 357 83.2 378 86.3 3.7Blueberries 208 18.0 220 12.0 -33.6Raisins 286 100.0 327 100.0 0.0Dried Plums 155 100.0 174 100.0 0.0Peaches and Nectarines 173 71.6 200 70.5 -1.6Lemons 1 173 85.0 175 84.5 -0.6Grapefruit 233 14.6 247 14.2 -2.2Plums 59 92.4 72 95.0 2.8Cherries 1 333 25.6 377 33.9 32.6Melons 134 37.1 140 39.7 7.1Raspberries and Blackberries 1,4 107 80.6 134 85.4 5.9Pears 176 16.0 182 14.2 -10.8Grape Juice 83 49 0 87 45 5 7 2
California Share of U.S. Agricultural Exports by Category and Commodity, 2009-20102009 2010
Grape Juice 83 49.0 87 45.5 -7.2Apples 1 800 2.4 869 2.4 -1.9Kiwi 11 100.0 14 100.0 0.0Dates 21 100.0 24 100.0 0.0Olives and Olive Oil 5 18 100.0 15 100.0 0.0Tangerines and Mandarins 40 83.2 47 84.7 1.8Figs 18 100.0 20 100.0 0.0Apricots 15 74.0 17 79.0 6.7Avocados 5 75.7 31 88.8 17.4
Tree Nuts 3,274 100.0 3,931 100.0 0.0Almonds 1 1,925 100.0 2,392 100.0 0.0Walnuts 666 100.0 820 100.0 0.0Pistachios 682 100.0 720 100.0 0.0
Vegetables 1,531 57.9 1,656 60.8 5.1Lettuce 430 74.5 438 75.6 1.4Broccoli 120 94.1 138 93.4 -0.7Carrots 1 127 88.4 126 88.4 0.1Tomatoes, Fresh 1 212 27.8 197 30.0 8.2Celery 71 83.3 71 86.3 3.6Onions 218 32.9 302 28.9 -12.1Cauliflower 1 85 85.0 100 85.0 -0.1Garlic 24 100.0 29 100.0 0.0Spinach 61 74.0 70 73.4 -0.8Bell and Chili Peppers 89 29.7 79 37.8 27.2Cabbage 20 21.8 20 20.6 -5.6Asparagus 27 49.0 37 50.4 2.9Artichokes 3 100.0 4 100.0 0.0Mushrooms 44 10.0 43 10.3 3.9
Flowers and Nursery 1 355 23.5 360 24.0 2.2
Total Principal Commodities 31,749 33.5 39,952 32.1 -2.8
Total Other Products and Mixtures 1,2 57,866 2.9 64,973 2.9 0.0
All Agricultural Exports 1 89,615 13.8 104,925 14.0 1.9
Source: University of California, Agricultural Issues Center.1 Export values were revised for 2009 based on updated production data from the U.S. Department of Agriculture/National Agricultural Statistics Service.2 Hay export values for 2009 were revised based on updated estimation methodologies, including the removal of alfalfa seed exports, which are now included in exports of seeds for sowing.3 Value of seeds, sowing have been added as a separate principal commodity. Previously, estimates of seed exports were included in the total other products category.
Source: University of California, Agricultural Issues Center. 1 Export values were revised for 2009 based on updated production data from the U.S. Department of Agriculture/National Agricultural Statistics Service. 2 Hay export values for 2009 were revised based on updated estimation methodologies, including the removal of alfalfa seed exports, which are now included in exports of seeds for sowing. 3 Value of “Seeds, Sowing” have been added as a separate principal commodity. Previously, estimates of seed exports were included in the “Total Other Products” category. 4 “Raspberries and Blackberries” category also include exports of mulberries and loganberries. 5 Product category “Olives and Olive Oil” is equal to the product category “Olives” found in previous years' data tables.
California Agricultural Exports California Agricultural Statistics Review 2011-2012 120
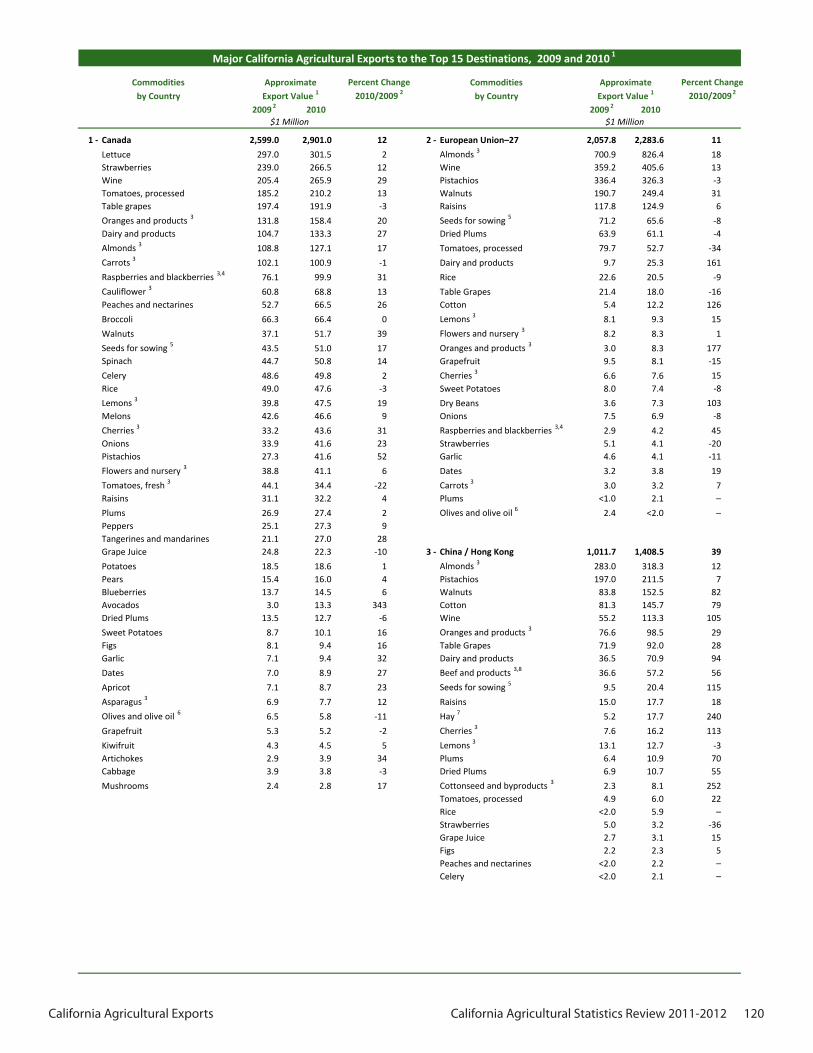
Percent Change Percent Change
2010/2009 2 2010/2009 2
2009 2 2010 2009 2 2010
1 - Canada 2,599.0 2,901.0 12 2 - European Union–27 2,057.8 2,283.6 11
Lettuce 297.0 301.5 2 Almonds 3 700.9 826.4 18Strawberries 239.0 266.5 12 Wine 359.2 405.6 13Wine 205.4 265.9 29 Pistachios 336.4 326.3 -3Tomatoes, processed 185.2 210.2 13 Walnuts 190.7 249.4 31Table grapes 197.4 191.9 -3 Raisins 117.8 124.9 6
Oranges and products 3 131.8 158.4 20 Seeds for sowing 5 71.2 65.6 -8Dairy and products 104.7 133.3 27 Dried Plums 63.9 61.1 -4
Almonds 3 108.8 127.1 17 Tomatoes, processed 79.7 52.7 -34
Carrots 3 102.1 100.9 -1 Dairy and products 9.7 25.3 161
Raspberries and blackberries 3,4 76.1 99.9 31 Rice 22.6 20.5 -9
Cauliflower 3 60.8 68.8 13 Table Grapes 21.4 18.0 -16Peaches and nectarines 52.7 66.5 26 Cotton 5.4 12.2 126
Broccoli 66.3 66.4 0 Lemons 3 8.1 9.3 15
Walnuts 37.1 51.7 39 Flowers and nursery 3 8.2 8.3 1
Seeds for sowing 5 43.5 51.0 17 Oranges and products 3 3.0 8.3 177Spinach 44.7 50.8 14 Grapefruit 9.5 8.1 -15
Celery 48.6 49.8 2 Cherries 3 6.6 7.6 15Rice 49.0 47.6 -3 Sweet Potatoes 8.0 7.4 -8
Lemons 3 39.8 47.5 19 Dry Beans 3.6 7.3 103Melons 42.6 46.6 9 Onions 7.5 6.9 -8
Cherries 3 33.2 43.6 31 Raspberries and blackberries 3,4 2.9 4.2 45Onions 33.9 41.6 23 Strawberries 5.1 4.1 -20Pistachios 27.3 41.6 52 Garlic 4.6 4.1 -11
Flowers and nursery 3 38.8 41.1 6 Dates 3.2 3.8 19
Tomatoes, fresh 3 44.1 34.4 -22 Carrots 3 3.0 3.2 7Raisins 31.1 32.2 4 Plums <1.0 2.1 –
Plums 26.9 27.4 2 Olives and olive oil 6 2.4 <2.0 –Peppers 25.1 27.3 9Tangerines and mandarines 21.1 27.0 28Grape Juice 24.8 22.3 -10 3 - China / Hong Kong 1,011.7 1,408.5 39
Potatoes 18.5 18.6 1 Almonds 3 283.0 318.3 12Pears 15.4 16.0 4 Pistachios 197.0 211.5 7Blueberries 13.7 14.5 6 Walnuts 83.8 152.5 82Avocados 3.0 13.3 343 Cotton 81.3 145.7 79Dried Plums 13.5 12.7 -6 Wine 55.2 113.3 105
Sweet Potatoes 8.7 10.1 16 Oranges and products 3 76.6 98.5 29Figs 8.1 9.4 16 Table Grapes 71.9 92.0 28Garlic 7.1 9.4 32 Dairy and products 36.5 70.9 94
Dates 7.0 8.9 27 Beef and products 3,8 36.6 57.2 56
Apricot 7.1 8.7 23 Seeds for sowing 5 9.5 20.4 115
Asparagus 3 6.9 7.7 12 Raisins 15.0 17.7 18
Olives and olive oil 6 6.5 5.8 -11 Hay 7 5.2 17.7 240
Grapefruit 5.3 5.2 -2 Cherries 3 7.6 16.2 113
Kiwifruit 4.3 4.5 5 Lemons 3 13.1 12.7 -3Artichokes 2.9 3.9 34 Plums 6.4 10.9 70Cabbage 3.9 3.8 -3 Dried Plums 6.9 10.7 55
Mushrooms 2.4 2.8 17 Cottonseed and byproducts 3 2.3 8.1 252Tomatoes, processed 4.9 6.0 22Rice <2.0 5.9 –Strawberries 5.0 3.2 -36Grape Juice 2.7 3.1 15Figs 2.2 2.3 5Peaches and nectarines <2.0 2.2 –Celery <2.0 2.1 –
continued on next page
by Country Export Value 1 by Country Export Value 1
$1 Million $1 Million
Major California Agricultural Exports to the Top 15 Destinations, 2009 and 2010 1
Commodities Approximate Commodities Approximate

California Agricultural Exports California Agricultural Statistics Review 2011-2012 121
Percent Change Percent Change
2010/2009 2 2010/2009 2
2009 2 2010 2009 2 2010by Country Export Value 1 by Country Export Value 1
$1 Million $1 Million
Major California Agricultural Exports to the Top 15 Destinations, 2009 and 2010 1
Commodities Approximate Commodities Approximate
4 - Japan 1,217.0 1,216.1 0 5 - Mexico 630.9 735.9 17Rice 422.0 232.3 -45 Dairy and products 184.2 275.7 50
Almonds 3 95.9 126.5 32 Seeds for sowing 5 71.1 71.8 1
Hay 7 91.9 83.0 -10 Tomatoes, processed 58.6 58.4 0
Beef and products 3,8 67.2 78.4 17 Table Grapes 18.8 32.6 73
Oranges and products 3 62.4 76.6 23 Almonds 3 23.9 31.0 30Wine 73.4 71.7 -2 Peaches and nectarines 9.1 26.6 192Dairy and products 38.2 67.8 77 Tomatoes, fresh 3 36.6 23.1 -37Walnuts 51.7 67.1 30 Flowers and nursery 3 20.7 21.5 4Lemons 3 43.7 49.2 13 Pistachios 19.9 17.0 -15Broccoli 32.7 43.7 34 Cotton 14.6 15.4 5Raisins 30.5 41.3 35 Strawberries 12.8 14.0 9Dried Plums 28.2 32.5 15 Rice 8.4 13.2 57Strawberries 27.6 29.5 7 Beef and products 3,8 11.2 10.8 -4Cherries 3 19.4 27.4 41 Wine 7.7 10.5 36Tomatoes, processed 17.9 23.0 28 Raisins 5.3 9.0 70Grapefruit 15.8 18.6 18 Plums 7.0 8.8 26Pistachios 13.5 17.4 29 Walnuts 56.4 8.3 -85Cotton 6.5 15.6 140 Kiwifruit 5.5 7.5 36Table Grapes 6.2 14.6 135 Garlic 4.6 7.1 54Onions 8.1 14.3 77 Onions 5.3 6.9 30Seeds for sowing 5 13.9 12.7 -9 Potatoes 6.1 6.7 10Cauliflower 3 6.5 9.3 43 Figs 4.6 6.3 37Tangerines and mandarines 7.0 8.7 24 Oranges and products 3 3.5 6.3 80Raspberries and blackberries 3,4 6.5 7.1 9 Lettuce 5.8 5.8 0Avocados 0.0 6.8 – Avocados 0.0 4.8 –Asparagus 3 4.5 6.2 38 Cottonseed and byproducts 3 3.7 4.3 16Blueberries 2.6 5.3 104 Pears 5.5 4.0 -27Melons 2.8 3.2 14 Melons 2.8 3.9 39Grape Juice 2.1 3.1 48 Carrots 3 3.9 3.5 -10Lettuce <1.5 3.0 – Lemons 3 1.5 2.4 60Flowers & nursery 3 3.0 2.9 -3 Dried Plums <2.0 2.4 –Dry Beans 2.3 2.9 26 Lemons <2.0 2.4 –Celery <1 2.2 – Cherries 3 <2.0 2.2 –Figs < 2.0 2.1 – Olives and olive oil 6 2.0 <2.0 –Olives and olive oil 6 2.4 < 2.0 –
6 - South Korea 369.8 578.4 56Oranges and products 3 73.8 114.7 55Beef and products 3,8 41.6 75.8 82Rice 40.1 73.6 84Walnuts 48.3 66.1 37Almonds 3 50.3 63.7 27Dairy and products 18.8 39.6 111Hay 7 18.5 31.0 68Cotton 8.8 25.6 191Tomatoes, processed 9.6 13.4 40Cherries 3 6.6 10.4 58Wine 9.0 9.8 9Table Grapes 4.7 8.6 83Raisins 7.3 8.3 14Grape Juice 8.5 6.6 -22Lemons 3 4.8 6.2 29Seeds for sowing 5 5.3 5.9 11Pistachios 3.2 3.5 9Blueberries <2.0 2.3 –Dried Plums 2.4 2.1 -13
continued on next page
continued

California Agricultural Exports California Agricultural Statistics Review 2011-2012 122
Percent Change Percent Change
2010/2009 2 2010/2009 2
2009 2 2010 2009 2 2010by Country Export Value 1 by Country Export Value 1
$1 Million $1 Million
Major California Agricultural Exports to the Top 15 Destinations, 2009 and 2010 1
Commodities Approximate Commodities Approximate
7 - United Arab Emirates 259.2 344.6 33 10 - Australia 198.8 186.8 -6Almonds 3 146.8 206.5 41 Walnuts 20.4 21.8 7Hay 7 51.2 62.1 21 Table Grapes 48.0 21.7 -55Walnuts 18.4 27.3 48 Rice 30.1 21.1 -30Tomatoes, processed 4.0 8.3 108 Oranges and products 3 13.4 20.7 54Table Grapes 5.9 7.8 31 Dairy and products 4.5 16.6 269Oranges and products 3 7.3 6.7 -8 Pistachios 10.6 15.6 47Pistachios 9.0 5.9 -34 Raisins 9.5 11.0 16Rice 5.6 5.5 -2 Lemons 3 8.6 9.0 5Dairy and products 2.3 5.5 139 Tomatoes, processed 10.3 8.2 -20Wine 2.0 <2.0 – Dates 6.2 7.0 13
Almonds 3 4.7 6.2 32Dried Plums 7.8 6.1 -22
8 - Taiwan 207.5 306.2 48 Cherries 3 4.6 6.0 30Rice 24.8 61.7 149 Seeds for sowing 5 3.7 4.3 16Beef and products 3,8 18.7 33.9 81 Onions 3.9 3.1 -21Peaches and nectarines 20.9 27.8 33 Wine 10.3 2.8 -73Almonds 3 16.4 23.2 41 Garlic <2.0 2.3 –Cotton 6.8 17.0 150Broccoli 11.2 16.3 46Table Grapes 21.4 16.1 -25 11 - Israel 9 99.5 140.3 41Walnuts 10.0 13.1 31 Rice 33.8 44.4 31Hay 7 9.0 11.9 32 Pistachios 14.1 27.2 93Lettuce 9.7 11.4 18 Walnuts 19.1 24.7 29Raisins 9.2 11.1 21 Almonds 3 14.1 17.2 22Dairy and products 7.2 10.4 44 Dairy 2.6 6.9 167Wine 4.6 10.1 120 Dried Plums 4.0 6.2 55Plums 5.9 8.5 44 Raisns 3.6 5.1 40Cherries 3 7.4 7.2 -3 Tomatoes Processed 4.3 4.0 -9Oranges and products 3 5.2 6.1 17Cauliflower 3 2.8 4.0 43Onions 3.1 3.6 16 12 - Indonesia 70.6 131.4 86Celery 3.6 2.8 -22 Dairy and products 18.4 51.7 181Tomatoes, processed 3.0 <2.0 – Table Grapes 24.0 35.4 48Seeds for sowing 5 <2.0 <2.0 – Cotton 16.4 23.0 40
Almonds 3 2.5 4.1 64Oranges and products 3 <2.0 3.6 –
9 - India 219.5 295.8 35 Onions 2.3 2.8 22Almonds 3 174.5 230.0 32 Beef and products 3,8 <1.0 2.3 –Cotton 22.2 42.0 89Pistachios 12.1 6.7 -45Table Grapes 2.5 4.4 76 13 - Russia 9 66.1 117.9 78Oranges and products 3 <1.0 3.2 – Almonds 3 36.8 55.9 52Seeds for sowing 5 <2.0 2.0 – Dairy 2.7 26.4 866Dry Beans 2.3 <2.0 – Dried Plums 4.6 12.3 169
Wine 7.3 7.1 -3Pistachios 8.9 4.3 -52Seeds for sowing 5 1.5 3.5 133Rice <2.0 2.8 –
continued on next page
continued

California Agricultural Exports California Agricultural Statistics Review 2011-2012 123
Percent Change Percent Change
2010/2009 2 2010/2009 2
2009 2 2010 2009 2 2010by Country Export Value 1 by Country Export Value 1
$1 Million $1 Million
Major California Agricultural Exports to the Top 15 Destinations, 2009 and 2010 1
Commodities Approximate Commodities Approximate
14 - Philippines 68.7 115.6 68 15 - Malaysia 74.5 114.6 54
Dairy and products 21.7 59.0 172 Dairy and products 10.1 29.2 189Table Grapes 24.4 21.6 -11 Oranges and products3 13.3 21.6 62Wine 6.8 7.4 9 Table Grapes 14.6 17.9 23Tomatoes, processed <2.0 7.0 – Almonds3 7.7 10.5 36Oranges and products3 2.8 4.3 54 Raisins 7.4 10.3 39Raisins 2.6 4.3 65 Dried Plums 5.4 5.6 4
Cotton <2.0 3.5 –Pistachios 2.6 3.1 19Wine <2.0 2.4 –
Source: University of California, Agricultural Issues Center. 1 This table provides the total export value and export values for individual commodities to the top 15 destinations. 2 For reliability purposes only commodities with export values of $2 million or greater to the destination in either 2009 or 2010 are reported. Percent change in value from 2009 to 2010 are not included for commodities with less than $2 million in exports in either year.3 Values were revised for 2009 based on updated production data from the U.S. Department of Agriculture/National Agricultural Statistics Service. 4 “Raspberries and Blackberries” category also include exports of mulberries and loganberries. 5 Value of “Seeds, Sowing” have been added as a separate principal commodity. Previously, estimates of seed exports were included in the “Total Other Products and Mixtures” category. 6 Product category “Olives and Olive Oil” is equal to the product category “Olives” found in previous years' data tables. 7 Hay export values for 2009 were revised based on updated estimation methodologies, including the removal of alfalfa seed exports, which are now included in exports of seeds for sowing. 8 Hides and skins are included in the heading "Beef and Products" from previous reports, but not explicitly highlighted because of its smaller percentage of total beef exports. 9 In 2010 Russia and Israel replaced Singapore and Thailand in the top 15 export destinations.
continued

California Agricultural Exports California Agricultural Statistics Review 2011-2012 124
Rank EU Member 1 Almonds Wine Pistachios Walnuts Raisins Principal Total 4
Products 2,3
1 United Kingdom 35 181 15 5 52 73 361
2 Germany 165 42 33 55 24 53 372
3 Spain 225 <1 21 52 1 18 317
4 Italy 57 56 19 45 1 82 260
5 Netherlands 63 16 67 17 6 50 219
6 France 50 9 27 1 1 22 110
7 Belgium 31 12 102 8 2 10 165
8 Greece 21 <1 11 2 0 3 37
9 Sweden 11 11 <1 3 12 8 45
10 Denmark 12 14 <1 0 12 5 43
Other EU Members 5 31 18 40 4 8 36 137
Total 4 701 359 336 191 118 360 2,065
1 United Kingdom 50 203 16 13 52 67 401
2 Germany 212 43 31 77 26 59 449
3 Spain 239 1 16 69 1 14 340
4 Italy 72 53 13 51 <1 60 250
5 Netherlands 81 12 78 18 6 62 257
6 France 51 25 34 1 2 28 140
7 Belgium 36 19 90 9 3 16 174
8 Greece 19 <1 10 3 0 2 34
9 Sweden 14 11 <1 4 13 10 51
10 Denmark 11 16 0 0 13 4 45
Other EU Members5 42 22 37 4 9 20 134
2009
Approximate Export Value, MillionsMajor California Agricultural Exports to the European Union, 2009 & 2010
2010
Total 4 826 406 326 249 125 342 2,274
Source: University of California, Agricultural Issues Center.
2 Other principal commodities are those that individually account for less than $100 million in export value to the EU.
4 Accurate export destination data is only available for 51 of the top 57 commodities. The commodities which export destinations are not included are apples, chickens, eggs, mushrooms turkey and wheat. Totals may not equal due to rounding.5 Other EU members include Austria, Bulgaria, Cyprus, Czech Republic, Estonia, Finland, Hungary, Ireland, Latvia, Lithuania, Luxembourg, Malta, Poland, Portugal, Romania, Slovak Republic, and Slovenia. All these countries combined account for just over 5 percent of California agricultural exports to the EU.
1 The EU members to which California exports are shipped reflects only the initial destination of the product, not the EU country of consumption. Many products are distributed throughout the EU after the initial entry.
3 Seeds, sowing have been added as a separate principal commodity. Previously, estimates of seed exports were included in the total other products category.
Source: University of California, Agricultural Issues Center. 1 The EU members to which California exports are shipped reflects only the initial destination of the product, not the EU country of consumption. Many products are distributed throughout the EU after the initial entry. 2 Other principal commodities are those that individually account for less than $100 million in export value to the EU. 3 “Seeds, Sowing” have been added as a separate principal commodity. Previously, estimates of seed exports were included in the “Total Other Products” category. 4 Accurate export destination data is only available for 51 of the top 57 commodities. The commodities that export destinations are not included are apples, chickens, eggs, mushrooms, turkey and wheat. Totals may not equal due to rounding. 5 Other EU members include Austria, Bulgaria, Cyprus, Czech Republic, Estonia, Finland, Hungary, Ireland, Latvia, Lithuania, Luxembourg, Malta, Poland, Portugal, Romania, Slovak Republic, and Slovenia. All these countries combined account for just over 5 percent of California agricultural exports to the EU.

California Agricultural Exports California Agricultural Statistics Review 2011-2012 125
2009 2010 2009 2010 2009 2010
1 - Almonds 3 10 - Cotton 20 - Broccoli
European Union 36 35 China/Hong Kong 33 35 Canada 59 51
China/Hong Kong 15 13 India 10 10 Japan 29 34
India 9 10 Pakistan 11 7 Taiwan 10 13
United Arab Emirates 8 9 Indonesia 6 6
Canada 6 5 Turkey 5 5 21 - Cherries 3
Japan 5 5 Thailand 6 5 Canada 36 34
Japan 21 21
2 - Dairy and Products 11 - Lettuce China/Hong Kong 8 13
Mexico 32 24 Canada 93 91 South Korea 7 8
Canada 18 12 Taiwan 8 6
China/Hong Kong 5 6 12 - Raisins
Japan 6 6 European Union 41 38 22 - Raspberries and
Philippines <4 5 Japan 11 13 Blackberries 3,7
Canada 11 10 Canada 88 88
3 - Wine China/Hong Kong 5 5 Japan 8 6
European Union 44 40
Canada 25 26 13 - Strawberries 23 - Carrots 3
China/Hong Kong 7 11 Canada 80 82 Canada 91 90
Japan 9 7 Japan 9 9
24 - Onions
4 - Walnuts 14 - Seeds, Sowing 8 Canada 47 48
European Union 29 30 Mexico 25 23 Japan 11 16
China/Hong Kong 13 19 European Union 25 21 European Union 10 8
Turkey 13 10 Canada 16 16 Mexico 7 8
Japan 8 8 China/Hong Kong 3 6
South Korea 7 8 25 - Flowers and Nursery 3
Canada 6 6 15 - Beef and Products 3,4 Canada 65 48
Japan 33 27 Mexico 16 25
5 - Rice South Korea 20 26 European Union 6 10
Major Destinations for California Agricultural Exports, 2009-2010 1, 2
Percent of Export Value
5 Rice South Korea 20 26 European Union 6 10
Japan 48 29 China/Hong Kong 18 20
South Korea 5 9 Taiwan 9 12 26 - Cauliflower 3
Taiwan 3 8 Vietnam 11 8 Canada 84 81
Canada 6 6 Japan 9 11
16 - Hay 5
6 - Pistachios Japan 52 40 27 - Plums
European Union 49 45 United Arab Emirates 29 30 Canada 49 40
China/Hong Kong 29 29 South Korea 10 15 China/Hong Kong 12 16
Canada <4 6 China/Hong Kong 3 9 Mexico 13 13
Taiwan 5 6 Taiwan 11 13
7 - Table Grapes
Canada 34 30 17 - Dried Plums 28 - Celery
China/Hong Kong 12 14 Canada 82 81
Indonesia 4 6 European Union 41 35 Taiwan 6 5
Mexico 3 5 Japan 18 19
Canada 9 7 29 - Tomatoes, Fresh 3
8 - Oranges and Products 3 Canada 54 58
Canada 29 28 18 - Lemons 3 Mexico 44 39
South Korea 18 20 Japan 29 33
China/Hong Kong 19 17 Canada 27 32 30 - Melons
Japan 15 13 China/Hong Kong 9 9 Canada 85 84
European Union 8 6 Mexico 6 7
9 - Tomatoes, Processed Japan 6 6
Canada 40 43 19 - Peaches and
Mexico 13 12 Nectarines 31 - Spinach
European Union 17 11 Canada 53 47 Canada 99 99
Taiwan 21 20
Mexico 9 19

California Agricultural Exports California Agricultural Statistics Review 2011-2012 126
2009 2010 2009 2010 2009 2010
Major Destinations for California Agricultural Exports, 2009-2010 1, 2
Percent of Export Value
32 - Tangerines and 40 - Blueberries 49 - Cottonseed and Byproducts 3
Mandarins Canada 71 55 China/Hong Kong 24 51
Canada 63 68 Japan 14 22 Mexico 34 27
Japan 21 22 South Korea 6 9 South Korea 11 7
Canada 14 7
33 - Grape Juice 41 - Pears
Canada 61 57 Canada 55 62 50 - Olives and Olive Oil 6
South Korea 21 17 Mexico 19 15 Canada 36 38
Japan 5 8 European Union 13 12
China/Hong Kong 7 8 43 - Dates Japan 14 10Canada 34 38 Mexico 11 10
34 - Grapefruit Australia 30 30 China/Hong Kong 6 7
Japan 47 53 European Union 15 16
European Union 28 23 51 - Kiwi
Canada 16 15 44 - Figs Canada 51 54
Canada 46 46 Mexico 40 32
35 - Potatoes Mexico 26 31
Canada 63 58 China/Hong Kong 12 11 52 - Apricots
Mexico 21 21 Japan 9 10 Canada 64 65
Mexico 10 11
36 - Bell and 46 - Dry Beans 10 12
Chili Peppers European Union 38 40 56 - Artichokes
Canada 95 92 Japan 24 16 Canada 94 90
India 24 10 Mexico 6 9
38 - Garlic Canada 13 7
Canada 30 32 57 - Cabbage
Mexico 19 24 47 - Asparagus 3 Canada 90 91
European Union 19 14 Canada 51 42 Mexico 6 6
Australia 6 8 Japan 33 34
Japan 6 6 Switzerland 2 12
European Union 8 7
39 - Avocado
Canada 88 48 48 - Sweet Potatoes
Japan 0 25 Canada 51 56
Mexico 0 17 European Union 47 41
South Korea 3 7
3 Values were revised for 2009 based on updated production data from the U.S. Department of Agriculture/National Agricultural Statistics Service.
5 Hay export values for 2008 and 2009 were revised based on updated estimation methodologies, including the removal of alfalfa seed exports, which 6 Product category olives and olive oil is equal to the product category olives found in previous years' data tables.7 Raspberries and blackberries category also include exports of mulberries and loganberries.8 Seeds, sowing export values and destinations have been added as a separate principal commodity in 2010.
Source: University of California, Agricultural Issues Center.1 This table shows destinations that receive shares of total exports greater than or equal to 5 percent of each commodity in either 2009 or 2010 for 2 Accurate export destination data are only available for 51 of the top 57 commodities. The commodities which export destinations are not included
4 Hides and skins are included in the heading "beef and products" from previous reports, but not explicitly hilighted because of its smaller percentage of
continued
Source: University of California, Agricultural Issues Center. 1 This table shows destinations that receive shares of total exports greater than or equal to 5 percent of each commodity in either 2009 or 2010 for which reliable data are available. 2 Accurate export destination data are only available for 51 of the top 57 commodities. The commodities which export destinations are not included are apples, chickens, eggs, mushrooms, turkey and wheat. 3 Values were revised for 2009 based on updated production data from the U.S. Department of Agriculture/National Agricultural Statistics Service. 4 Hides and skins are included in the heading "Beef and Products" from previous reports, but not explicitly hilighted because of its smaller percentage of total beef exports. 5 Hay export values for 2008 and 2009 were revised based on updated estimation methodologies, including the removal of alfalfa seed exports, which are now included in exports of seeds for sowing. 6 Product category “Olives and Olive Oil” is equal to the product category “Olives” found in previous years' data tables. 7 “Raspberries and Blackberries” category also include exports of mulberries and loganberries. 8 “Seeds, Sowing” export values and destinations have been added as a separate principal commodity in 2010.

California Agricultural Exports California Agricultural Statistics Review 2011-2012 127
2009 2010Commodity Units Quantity Quantity Ratio of Quantity Quantity Ratio of
Exported Produced Exported Exported Produced Exportedto Produced 1 to Produced 1
Percentage PercentageApples 2 cwt. 875 2,650 0.33 691 2,800 0.25Apricots short tons 6 69 0.09 7 65 0.10Artichokes cwt. 41 1,118 0.04 56 900 0.06Asparagus 2 cwt. 3 400 0.01 5 403 0.01Avocados short tons 2 275 0.01 18 127 0.14Beef and Products 2 liveweight cwt. 1,308 18,875 0.07 1,645 18,876 0.09Bell and Chili Peppers cwt. 91 242 0.38 140 280 0.50Blueberries cwt. 2,459 18,720 0.13 2,884 17,175 0.17Broccoli cwt. 124 4,938 0.03 123 4,688 0.03Cabbage cwt. 2,154 19,875 0.11 2,163 19,740 0.11Carrots2 cwt. 1,676 6,475 0.26 1,979 5,494 0.36Cauliflower 2 cwt. 2,125 19,019 0.11 2,250 19,285 0.12Celery short tons 28 89 0.31 34 94 0.36Cherries 2 bales 696 601 1.16 725 830 0.87Cotton short tons 33 275 0.12 30 349 0.09Cottonseed and Byproducts 2 cwt. 60,305 395,120 0.15 96,312 403,850 0.24Dairy and Products 3,4 short tons 4 24 0.17 4 28 0.15Dates short tons 178 496 0.36 223 378 0.59Dried Plums cwt. 320 1,508 0.21 320 1,450 0.22Dry Beans dozens 7,743 442,000 0.02 6,767 449,167 0.02Eggs 2 short tons 18 40 0.44 19 40 0.47Figs cwt. 475 3,677 0.13 535 3,614 0.15Garlic short tons 70 141 0.50 80 275 0.29Grapefruit short tons 1,808 6,501 0.28 1,861 6,636 0.28Grapes, All 5 short tons 820 7,000 0.12 942 6,256 0.15Hay 6 short tons 7 26 0.27 9 33 0.27Kiwi 76lb boxes 2,759 20,500 0.13 2,846 22,105 0.13Lemons 2 cwt. 5,228 66,065 0.08 5,431 67,550 0.08Lettuce cwt. 2,027 19,085 0.11 2,238 19,555 0.11Melons short tons 25 46 0.54 21 195 0.11Olives and Olive Oil 7 cwt. 3,665 20,203 0.18 3,672 18,826 0.20Onions 75lb boxes 18,040 57,500 0.31 26,189 61,500 0.43Oranges and Products 2 cwt. 1,748 20,580 0.08 2,129 20,840 0.10Peaches and Nectarines short tons 24 255 0.09 22 220 0.10Pears cwt. 414 10,029 0.04 436 10,176 0.04Pistachios cwt., in shell 3,002 3,550 0.85 2,870 5,220 0.55Plums short tons 41 112 0.37 58 141 0.41Potatoes cwt. 1,445 14,644 0.10 1,690 13,215 0.13Raspberries and Blackberries 2,7 cwt. 592 1,232 0.48 498 810 0.61Rice cwt. 18,616 47,804 0.39 23,228 44,326 0.52Spinach cwt. 491 6,251 0.08 504 5,388 0.09Strawberries cwt. 2,531 24,856 0.10 2,753 25,829 0.11Sweet Potatoes cwt. 471 5,916 0.08 547 6,390 0.09Tangerines and Mandarins 75lb boxes 749 9,900 0.08 845 19,800 0.04Tomatoes, Fresh 2 cwt. 935 10,440 0.09 591 10,440 0.06Tomatoes, Processed short tons 2,125 13,314 0.16 2,301 12,297 0.19Turkey liveweight cwt. 160 3,900 0.04 168 4,043 0.04Walnuts short tons 275 437 0.63 280 503 0.56Wheat bushels 3,751 43,400 0.09 3,732 40,350 0.09
Weighted average 9 0.22 0.24
Source: University of California, Agricultural Issues Center.1 In general export quantities were converted to farm quantities using standard UDSA conversion tables. http://www.ers.usda.gov/publications/ah697/2 Values for 2009 were revised based on updated production data from the U.S. Department of Agriculture/National Agricultural Statistics Service.
5 Grapes, all includes grape juice, raisins, table grapes, and wine.
8 Raspberries and blackberries category also includes exports of mulberries and loganberries.9 The weighted average is based on each of the 53 commodity's share of production value. Values for chickens, flowers and nursery products, mushrooms and seeds for sowing are not included because reliable data on export quantity is not available.
1,000 Farm-gate Units 1,000 Farm-gate Units
Ratio of California Farm Quantity Exported to Farm Quantity Produced, 2009 and 2010
4 There is no addition for the farm quantity of milk allocated to whey exports because whey is a by-product from cheese production. Other dairy products including casein, lactose, milk albumin, products for infant use, pudding, and rennet are converted to farm equivalent by multiplying California's share of U.S. milk production to the U.S. export quantity for these products, then applying a conversion factor of 1 pound of product to 8 pounds of milk equivalent. The same conversion factor is used for non fat dry milk.
7 Product category olives and olive oil is equal to the product category olives found in previous years' data tables.
3 Farm quantity exported for dairy and products is calculated by converting cheese, condensed milk, fluid milk, ice cream, nonfat dry milk, and whole dry milk to their fluid milk equivalents.
6 Hay export values for 2009 were revised based on updated estimation methodologies, including the removal of alfalfa seed exports, which are now included in exports of seeds, sowing.
Source: University of California, Agricultural Issues Center. 1 In general export quantities were converted to farm quantities using standard UDSA conversion tables. 2 Values for 2009 were revised based on updated production data from the U.S. Department of Agriculture/National Agricultural Statistics Service. 3 Farm quantity exported for “Dairy and Products” is calculated by converting cheese, condensed milk, fluid milk, ice cream, nonfat dry milk, and whole dry milk to their fluid milk equivalents. 4 There is no addition for the farm quantity of milk allocated to whey exports because whey is a by-product from cheese production. Other dairy products including casein, lactose, milk albumin, products for infant use, pudding, and rennet are converted to farm equivalent by multiplying California's share of U.S. milk production to the U.S. export quantity for these products, then applying a conversion factor of 1 pound of product to 8 pounds of milk equivalent. The same conversion factor is used for nonfat dry milk. 5 “Grapes,” all includes grape juice, raisins, table grapes, and wine. 6 Hay export values for 2009 were revised based on updated estimation methodologies, including the removal of alfalfa seed exports, which are now included in exports of “Seeds, Sowing.” 7 Product category “Olives and Olive Oil” is equal to the product category “Olives” found in previous years' data tables. 8 “Raspberries and Blackberries” category also includes exports of mulberries and loganberries. 9 The weighted average is based on each of the 53 commodity's share of production value. Values for chickens, flowers and nursery products, mushrooms and seeds for sowing are not included because reliable data on export quantity is not available..