Saluti in Italiano Signorina Mangiafreno. Buongiorno Good morning.
Upload
shonda-mayCategory
view
214download
0
Calibration and Validation of Global Forest Products Model
(GFPM)
Joseph Buongiorno, Shushuai ZhuUniversity of Wisconsin - Madison

Acknowledgements
USDA Forest Service Southern Research Station
James Turner
Jeff Prestemon

Objectives
• Synchronize GFPM and FAO data cycles
• Correct data errors
• Reconcile data with theory
• Assist users with automated procedures
• Check predictions with observations
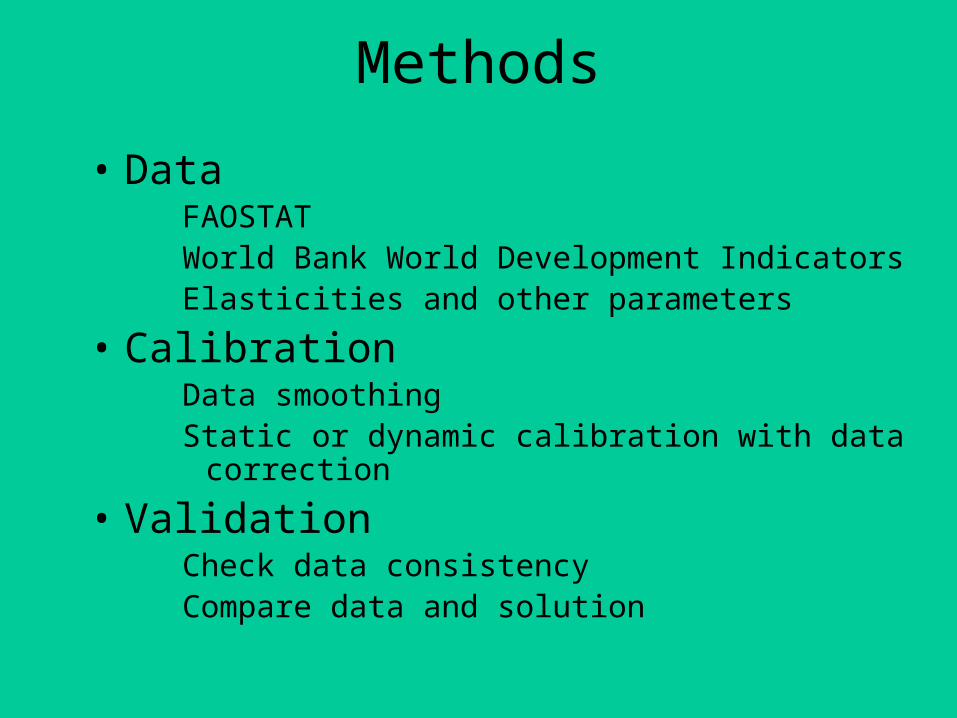
Methods
• DataFAOSTATWorld Bank World Development IndicatorsElasticities and other parameters
• CalibrationData smoothingStatic or dynamic calibration with data correction
• ValidationCheck data consistencyCompare data and solution

Data 1: FAO Statistics
Un-check Download button Show Data button

Data 2: World Bank WDI

Data 3: Forest Resource AssessmentExtent of forest and other wooded land 2010
Country/area
Land area
Inland water(1 000
ha)
Countryarea
(1 000 ha)
Forest Other wooded land Other land (1 000 ha)
1 000 ha% of
land area 1 000 ha% of
land area Total
of which with
tree cover
Angola 58480 47 0 0 66190 - 0 124670
Botswana 11351 20 34791 61 10531 - 1500 58173
Comoros 3 2 0 0 183 - 0 186
Djibouti 6 n.s. 220 9 2092 - 2 2320
Eritrea 1532 15 7153 71 1415 - 1660 11760
Ethiopia 12296 11 44650 41 52685 - 799 110430
Kenya 3467 6 28650 50 24797 10385 1123 58037
Lesotho 44 1 97 3 2894 - 0 3035
Madagascar 12553 22 15688 27 29913 - 550 58704
Malawi 3237 34 0 0 6171 - 2440 11848

GDP Price Year
Fuelwood-developing countries 0.05 -0.10
Fuelwood-developed countries 0.22 -0.10
Sawnwood 0.22 -0.10 -0.003
Standard error 0.03 0.02 0.001
Plywood & veneer 0.41 -0.29 -0.009
Standard error 0.04 0.02 0.002
Particleboard 0.54 -0.29 -0.006
Standard error 0.07 0.02 0.002
Fiberboard 0.35 -0.46 -0.002
Standard error 0.06 0.02 0.002
Newsprint 0.58 -0.25 -0.008
Standard error 0.04 0.02 0.001
Printing & Writing 0.45 -0.37 0.003
Standard error 0.03 0.02 0.001
Other paper & Paperboard 0.43 -0.23 -0.004
Standard error 0.03 0.02 0.001
Data 4: Elasticities of Demand

Calibration Goal = GFPM InputsGFPM
Spreadsheet
Content Calibration
Demand Initial condition+elasticities Yes
Supply Initial condition+elasticities Yes
Forest Initial condition+elasticities+ forest growth parameters
Yes
Manufacture I/O coefficients, costs Yes
Recycling Max recycling Yes
Transportation Initial import, export, cost Yes
ExogChange GDP growth and other changes No

Calibration Procedure
Smooth data (optional)
world price (net exporter)Local price =
world price + transport cost (net importer)
Then, for each country, simultaneously:Estimate I/O coefficients & manufacturing
costsCorrect data if needed

Goal Programming
Minimize (calibrated - reported production) +(calibrated - expected input)
Subject to:
– Observed imports, exports, and prices
– Prior bounds on:• I/O coefficients• Manufacturing costs• Recycling rates

Objective Function
2/1)()()1()(min jwiwi j
ijYijYβwiYi
iYβZ i
Deviationfrom reportedproduction
Deviation from expectedinput
Weight=world price
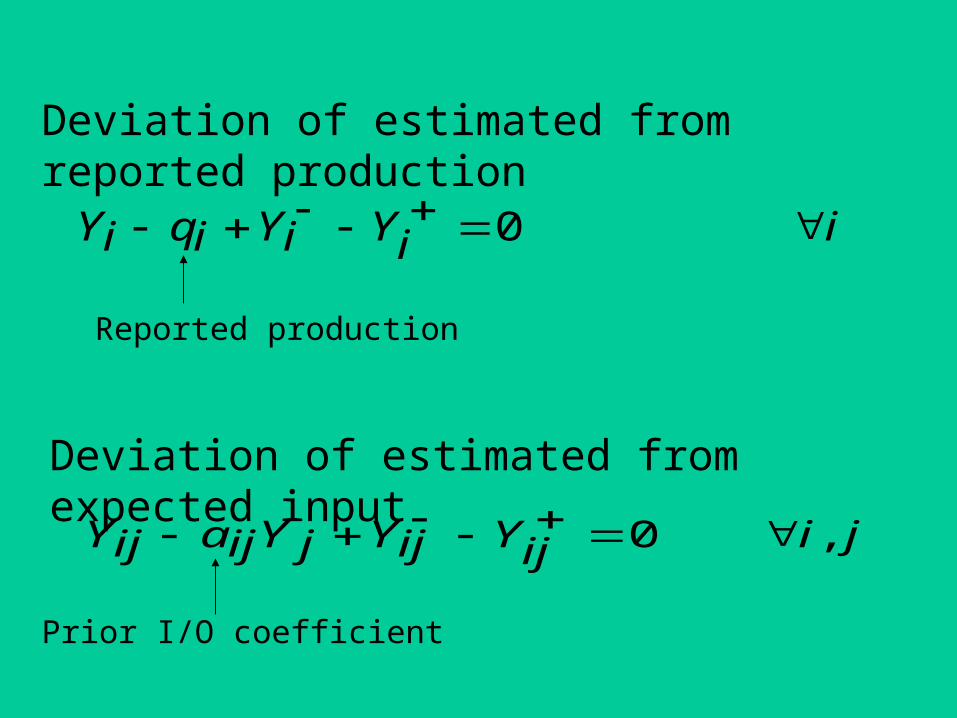
Deviation of estimated from reported production
Deviation of estimated from expected input
iiYiYiqiY 0
jiijYijYjYijaijY ,0
Reported production
Prior I/O coefficient
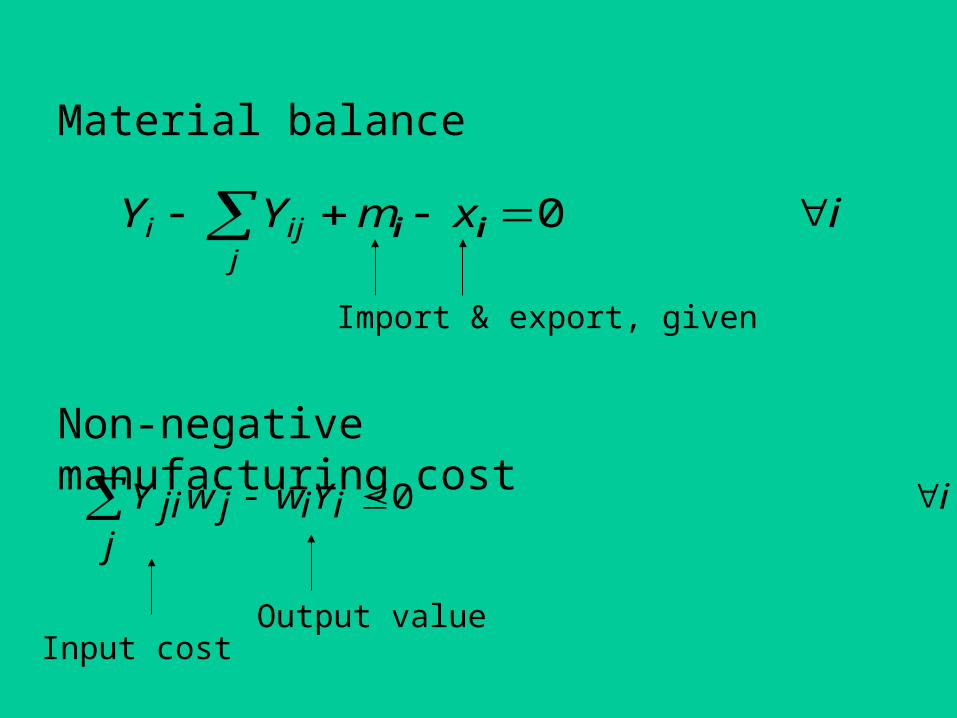
Material balance
Non-negative manufacturing cost
iiYiwjwjjiY 0
ixmYYj
iji 0ii
Import & export, given
Output valueInput cost

Feasible range of input i for output j
Feasible post-consumer recovery
jiUijajYijY
LijajY ,
iUijr
jjxjm
jijYjYiY
Lijr
jjxjm
jijYjY )()(
bounds on I/O coefficients
Paper consumption
Recovery bounds
Calculated I/O coefficient
jiY
YA
j
ijij ,

Dynamic Calibration
• Purpose: Smooth yearly change of I/O coefficients
• Method:– Static calibration for each last 3 years– “Average” of calibrated I/O coefficients, production,
imports, and prices

GFPM Calibration Interface

Post Calibration Data Checks
• Consumption = production + import – export
• Prices:Net Exporter=World Price
Net Importer=World Price + Transport Cost
• Manufacturing cost= Output Price – Input Costs
• Recovered paper >= consumed waste paper

Input Data Check Results
Inputmanufacturing cost
Algeriaplywood
Derivedmanufacturing cost

GFPM Validation - Base YearCheck predicted = calibrated:Demand
QuantityPrice
Supply Quantity
Price
Manufacturing QuantityPriceManufacturing cost
Net Trade
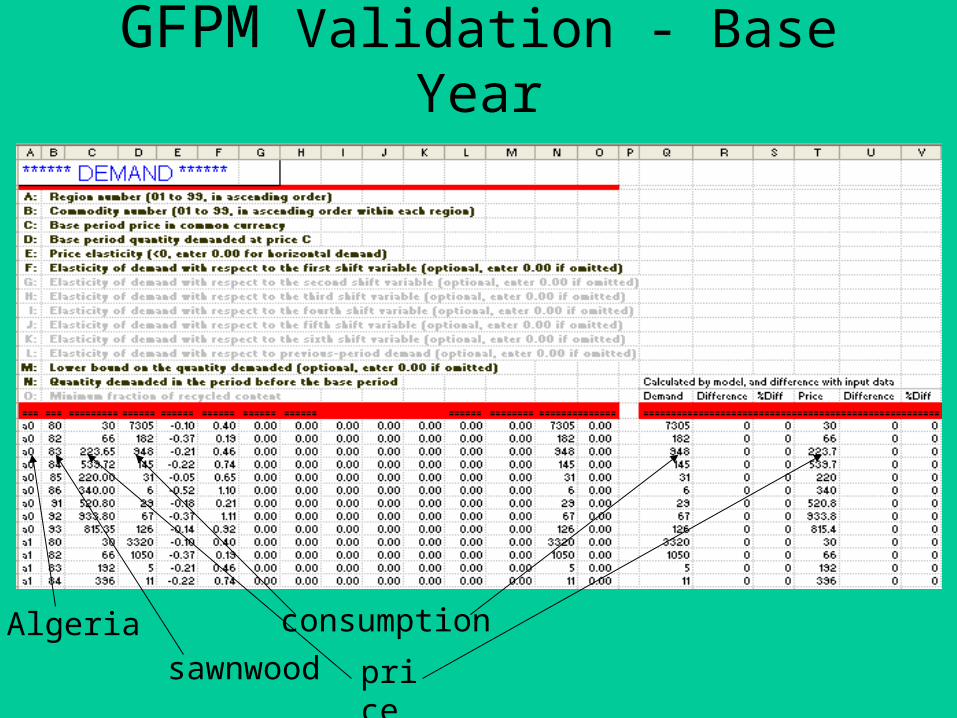
GFPM Validation - Base Year
Algeria
sawnwood price
consumption

Long Term validation
• Set base year (e.g. 1980)
• Set exogenous variables (e.g. 1980-1995)• GDP
• GDP/capita
• Compare predictions and observations

Industrial Roundwood Production
Actual (1980 - 1994) Projections (1980 - 1994)
0
400000
800000
1200000
1600000
2000000
1980 1985 1990 1980 1985 1990
Year
Th
ou
san
d c
ub
ic m
ete
rs
Africa North/Central America South America Asia Oceania Europe Former USSR

Industrial Roundwood Net Trade
Actual (1980 - 1994) Projections (1980 - 1994)
-75000
-60000
-45000
-30000
-15000
0
15000
30000
45000
1980 1985 1990 1980 1985 1990
Year
Th
ou
san
d c
ub
ic m
ete
rs
Africa North/Central America South America Asia Oceania Europe Former USSR

Soldid Wood World Prices
Actual (1980 - 1994) Projections (1980 - 1994)
0
100
200
300
400
500
1980 1985 1990 1980 1985 1990
Year
1994 U
S$ p
er
cu
bic
mete
r
Industrial Roundwood Sawnwood & sleepers

Further Work
• Extend dynamic calibration– I/O and costs (consider all data simultaneously)
– Demand (elasticities of demand)
– Supply (elasticities of supply)
• Explore alternative trade theories– Export (monopolistic competition)
• Update long-term validation

GFPM Software, Data, Manuals
http://fwe.wisc.edu/staticsites/buongiorno/book/GFPM.html