Calgary Real Estate Listings: Calgary Townhouses, Homes & Condos
Upload
crystal-tostCategory
view
218download
0
8/8/2019 Calgary Real Estate Market Statistics for September 2010
http://slidepdf.com/reader/full/calgary-real-estate-market-statistics-for-september-2010 1/10REALTORS® are educated, licensed professionals trained to guide you through the real estate transaction.
No MLS ® information can be reprinted without sourcing the Calgary Real Estate Board.
Asrti Rat
Ttal MLS® Ifrmati
SepTeMbeR 2010
StatsREB ®Calgary Real Estate Board
Ttal MLS® Ivtry t Sa
R E A L T O R ® S O L D P R O P E R T I
Calgary, October 1, 2010 – Hm sals i th cityf Calary wr mth-vr-mth i Stmr
2010, th rst tic i sals sic Aril 2010. Yar-vr-yar sals ctid t trd lwr i th mthf Stmr, t at a ac slwr tha rvismths, accrdi t rs rlasd tday y thCalary Ral estat bard (CReb®).
Th mr f sil family hm sals i th mthf Stmr 2010 rw y 10 r ct at 958,cmard with Ast 2010, wh sals wr 867.Th mr f cdmiim sals fr th mth f Stmr 2010 was 366. This was a icras f 1 r ct frm th 364 cdmiim trasactisrcrdd i Ast 2010.
Yar-vr-yar, th mr f sil family hmssld i Stmr 2010 i th city f Calary wrdw 24 r ct. I Stmr 2009, sil family
hm sals ttalld 1,257. Cdmiim sals saw adcras f 37 r ct frm th sam tim a yar a.I Stmr 2009, cdmiim sals wr 580.
“Thr ar sis that Stmr may mar a radal,if t sliht, tic fr Calary’s hsi mart—war si a mdst imrvmt sic th mart’sdcli, that rally startd i Aril f this yar,” saysDia Sctt, rsidt f CReb®.
“Th ba f Caada is i hrry t rais itrstrats t ay siicat lvl, ad affrdailityctis t imrv i y smts f th Calaryhsi mart. Ths factrs, al with ratslcti, hav clarly tid this mart i favr f th yr,” says Sctt.
“Thr ar sm rat rtitis t thr fr yrs, articlarly i th cd mart. Crrtly,th hihst vlm ric smt fr cds is i th$200,000 t $300,000 ra. W hav t s thisid f affrdaility i Calary’s cd mart imay yars,” adds Sctt.
Th avra ric f a sil family hm i th cityf Calary i Stmr 2010 was $460,278, shwia 3 r ct icras frm Ast 2010, wh thavra ric was $445,617, ad siicatcha frm Stmr 2009, wh th avra ricwas $459,085. Th avra ric f a cdmiim ith city f Calary i Stmr 2010 was $284,028,shwi a 1 r ct dcras frm Ast 2010,wh th avra ric was $286,384 ad a 2 r ct
dcras vr last yar, wh th avra ric was$290,253. Avra ric ifrmati ca sfl istalishi trds vr tim, t ds t idicatactal rics i ctrs cmrisd f widly divrtihrhds, r acct fr ric diffrtialstw rahical aras.
Th mdia ric f a sil family hm i thcity f Calary fr Stmr 2010 was $390,000,shwi a 1 r ct dcras frm Ast 2010wh th mdia ric was 395,000. This was a 2r ct dcras frm Stmr 2009, wh thmdia ric was $399,900. Th mdia ric f acdmiim i Stmr 2010 was $265,000,shwi a 2 r ct icras frm Ast 2010, whth mdia ric was $260,000, ad cha frm
buYeRS’ MARkeT ConTInueS In CALgARY
Home sales in the city of Calgary increase month-over-month in September 2010
Stmr 2009, wh it was th sam – $265,000.
All city f Calary MLS® statistics icld rrtislistd ad sld ly withi Calary’s city limits. Thmdia ric is th ric that is midway tw thlast xsiv ad mst xsiv hm sld i aara dri a iv rid f tim. Dri that tim,half th yrs ht hms that cst mr tha thmdia ric ad half ht hms fr lss tha thmdia ric.
“Clarly thr is a shift i th tys f yrs trith mart. It was rst-tim hm yrs wh drvth lat mart rcvry last fall ad this sri.Whil lwr ricd hm sals hav dclid, hmsals vr $1 milli hav actally icrasd y 2%this yar, as cmard t th sam rid last yar,”says Sctt.
Sil family listis i th city f Calary adddfr th mth f Stmr 2010 ttalld 2,252, aicras f 15 r ct frm Ast 2010 wh 1,960w listis wr addd, ad shwi a icras f 21 r ct frm Stmr 2009, wh 1,857 wlistis cam t th mart.
Cdmiim w listis i th city f Calaryaddd fr Stmr 2010 wr 921, 14 r ctfrm Ast 2010, wh th MLS® saw 808 cdlistis cmi t th mart. This is a dcrasf 2 r ct frm Stmr 2009, wh wcdmiim listis addd wr 940.
“uli th vlm f frclsrs w hav s sthf th rdr, Caada’s mart has s ly a smallicras i arrars ad frclsrs. nthlss this
icras lily had a mdst imact r crrtivtry—w xct this t hav a small ic ric ad sly as thy wr thrh th martthis fall,” td Sctt.
“Whil csmr cdc ad j rwth hasimrvd, cmic jittrs will cti t imactCalary’s hsi marti it th fall. Mrad mr hmyrs will vtally rtr tth martlac, t fr th mmt thy rmaimdratly catis. Fall sals shld imrvslihtly, rcti imrvd j crati—t i-mirati will dd t fl a sstaid rcvryi Calary’s hsi mart,” says Sctt.
CReb® is a rfssial dy f 5,489 licsd
rrs ad ristrd assciats, rrsti 246mmr fcs ad is ddicatd t haci thval, itrity ad xrtis f its ReALToR ® mmrs.
ReALToRS® ar cmmittd t a hih stadard f rfssial cdct, i dcati, ad a strictCd f ethics ad Stadards f bsiss practic.usi th srvics f a rfssial ReALToR ® cahl csmrs ta fll advata f ral statrtitis whil rdci thir riss wh yir slli ral stat. Th ard ds t ratstatistics r aalysis f ay idividal mmr r cmay’s mart shar. All MLS® activ listis fr Calary ad ara may fd th ard’s wsitat www.cr.cm.
1 of 10

8/8/2019 Calgary Real Estate Market Statistics for September 2010
http://slidepdf.com/reader/full/calgary-real-estate-market-statistics-for-september-2010 2/10
2010 2009 Mth Chg **YTD 2010 **YTD 2009 YTD ChgSINGLE FAMILY(Calgary Metro)
Month End Inventory 4,880 3,148 n/a n/a n/a n/a
New Listings added 2,252 1,857 21.27% 21,886 18,475 18.46%
Sales 958 1,257 -23.79% 9,584 11,269 -14.95%
Avg DOM 52 40 30.00% 40 46 -13.04%Average Sale Price 460,278 459,085 0.26% 464,686 437,379 6.24%
Median Price 390,000 399,900 -2.48% 410,000 389,500 5.26%
CONDOMINIUM (Calgary Metro)
Month End Inventory 2,204 1,515 n/a n/a n/a n/a
New Listings added 921 940 -2.02% 9,698 8,310 16.70%
Sales 366 580 -36.90% 4,244 4,884 -13.10%
Avg DOM 57 43 32.56% 46 51 -9.80%
Average Sale Price 284,028 290,253 -2.14% 290,687 281,562 3.24%
Median Price 265,000 265,000 0.00% 268,500 259,000 3.67%
TOWNS (outside Calgary)Month End Inventory 2,546 2,233 n/a n/a n/a n/a
New Listings added 669 655 2.14% 7,340 6,942 5.73%
Sales 271 407 -33.42% 2,887 3,056 -5.53%
Avg DOM 88 69 27.54% 69 75 -8.00%
Average Sale Price 363,507 354,797 2.45% 362,938 349,032 3.98%
Median Price 339,000 337,000 0.59% 336,900 330,000 2.09%
COUNTRY RESIDENTIAL(Acreages)
Month End Inventory 1,070 911 17.45% n/a n/a n/a
New Listings added 185 245 -24.49% 2,213 2,043 8.32%
Sales 50 101 -50.50% 497 535 -7.10%Avg DOM 86 96 -10.42% 88 90 -2.22%
Average Sale Price 714,994 765,605 -6.61% 832,834 765,776 8.76%
Median Price 650,000 710,000 -8.45% 755,000 690,000 9.42%
RURAL LAND
Month End Inventory 536 538 -0.37% n/a n/a n/a
New Listings added 50 74 -32.43% 828 828 0.00%
Sales 17 31 -45.16% 165 148 11.49%
Avg DOM 117 127 -7.87% 126 116 8.62%
Average Sale Price 425,241 535,347 -20.57% 404,989 433,663 -6.61%
Median Price 321,300 300,000 7.10% 335,000 323,500 3.55%
TOTAL MLS*
Month End Inventory 11,349 8,464 34.09% n/a n/a n/a
New Listings added 4,108 3,798 8.16% 42,242 36,875 14.55%
Sales 1,673 2,387 -29.91% 17,490 19,981 -12.47%
Avg DOM 61 49 24.49% 49 54 -9.26%
Average Sale Price 410,708 412,348 -0.40% 412,963 392,854 5.12%
Median Price 355,000 355,000 0.00% 362,000 350,000 3.43%
CALGARY REAL ESTATE BOARD
TOTAL MLS® FOR SEPTEMBER 2010
*Total MLS includes Mobile Listings**Year-to-date values in the monthly statistics package will accurately reflect our database at that specific point in time.
2 of 10
8/8/2019 Calgary Real Estate Market Statistics for September 2010
http://slidepdf.com/reader/full/calgary-real-estate-market-statistics-for-september-2010 3/10
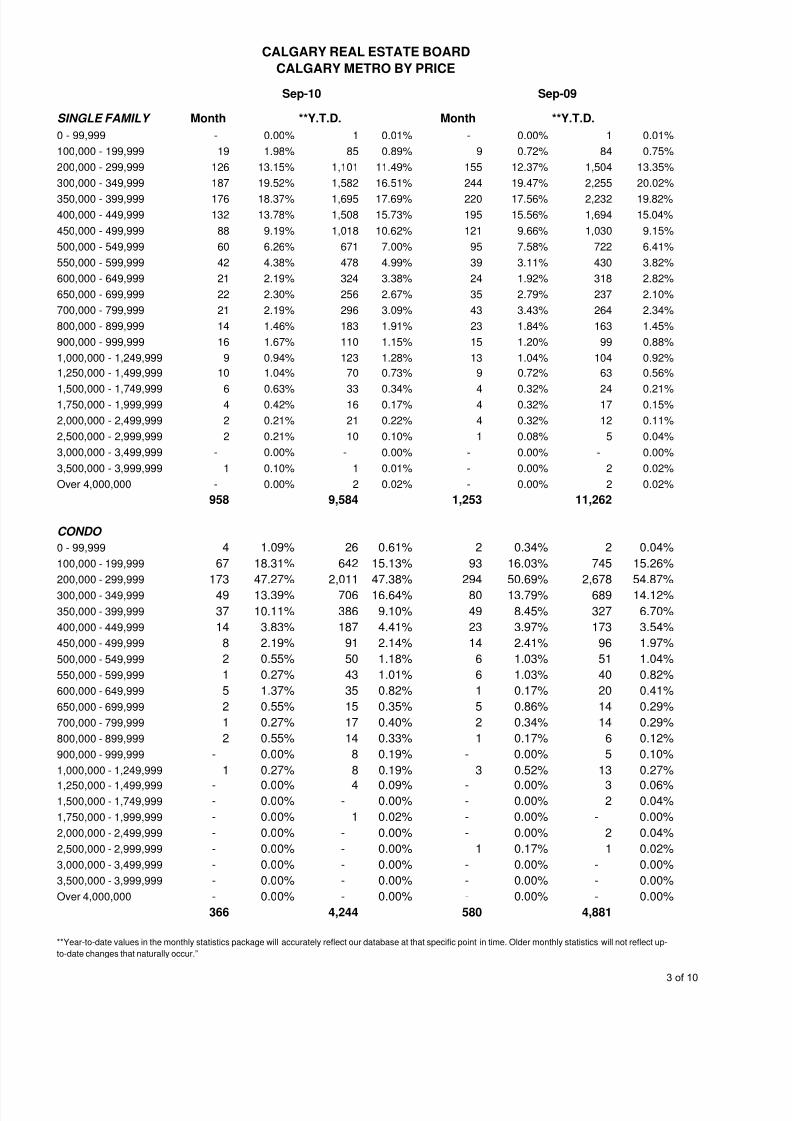
SINGLE FAMILY
0 - 99,999 - 0.00% 1 0.01% - 0.00% 1 0.01%
100,000 - 199,999 19 1.98% 85 0.89% 9 0.72% 84 0.75%
200,000 - 299,999 126 13.15% 1,101 11.49% 155 12.37% 1,504 13.35%
300,000 - 349,999 187 19.52% 1,582 16.51% 244 19.47% 2,255 20.02%
350,000 - 399,999 176 18.37% 1,695 17.69% 220 17.56% 2,232 19.82%
400,000 - 449,999 132 13.78% 1,508 15.73% 195 15.56% 1,694 15.04%
450,000 - 499,999 88 9.19% 1,018 10.62% 121 9.66% 1,030 9.15%
500,000 - 549,999 60 6.26% 671 7.00% 95 7.58% 722 6.41%
550,000 - 599,999 42 4.38% 478 4.99% 39 3.11% 430 3.82%
600,000 - 649,999 21 2.19% 324 3.38% 24 1.92% 318 2.82%
650,000 - 699,999 22 2.30% 256 2.67% 35 2.79% 237 2.10%
700,000 - 799,999 21 2.19% 296 3.09% 43 3.43% 264 2.34%
800,000 - 899,999 14 1.46% 183 1.91% 23 1.84% 163 1.45%
900,000 - 999,999 16 1.67% 110 1.15% 15 1.20% 99 0.88%
1,000,000 - 1,249,999 9 0.94% 123 1.28% 13 1.04% 104 0.92%
1,250,000 - 1,499,999 10 1.04% 70 0.73% 9 0.72% 63 0.56%
1,500,000 - 1,749,999 6 0.63% 33 0.34% 4 0.32% 24 0.21%1,750,000 - 1,999,999 4 0.42% 16 0.17% 4 0.32% 17 0.15%
2,000,000 - 2,499,999 2 0.21% 21 0.22% 4 0.32% 12 0.11%
2,500,000 - 2,999,999 2 0.21% 10 0.10% 1 0.08% 5 0.04%
3,000,000 - 3,499,999 - 0.00% - 0.00% - 0.00% - 0.00%
3,500,000 - 3,999,999 1 0.10% 1 0.01% - 0.00% 2 0.02%
Over 4,000,000 - 0.00% 2 0.02% - 0.00% 2 0.02%
958 9,584 1,253 11,262
CONDO
0 - 99,999 4 1.09% 26 0.61% 2 0.34% 2 0.04%
100,000 - 199,999 67 18.31% 642 15.13% 93 16.03% 745 15.26%
200,000 - 299,999 173 47.27% 2,011 47.38% 294 50.69% 2,678 54.87%
300,000 - 349,999 49 13.39% 706 16.64% 80 13.79% 689 14.12%
350,000 - 399,999 37 10.11% 386 9.10% 49 8.45% 327 6.70%
400,000 - 449,999 14 3.83% 187 4.41% 23 3.97% 173 3.54%
450,000 - 499,999 8 2.19% 91 2.14% 14 2.41% 96 1.97%
500,000 - 549,999 2 0.55% 50 1.18% 6 1.03% 51 1.04%
550,000 - 599,999 1 0.27% 43 1.01% 6 1.03% 40 0.82%
600,000 - 649,999 5 1.37% 35 0.82% 1 0.17% 20 0.41%
650,000 - 699,999 2 0.55% 15 0.35% 5 0.86% 14 0.29%
700,000 - 799,999 1 0.27% 17 0.40% 2 0.34% 14 0.29%
800,000 - 899,999 2 0.55% 14 0.33% 1 0.17% 6 0.12%
900,000 - 999,999 - 0.00% 8 0.19% - 0.00% 5 0.10%
1,000,000 - 1,249,999 1 0.27% 8 0.19% 3 0.52% 13 0.27%
1,250,000 - 1,499,999 - 0.00% 4 0.09% - 0.00% 3 0.06%1,500,000 - 1,749,999 - 0.00% - 0.00% - 0.00% 2 0.04%
1,750,000 - 1,999,999 - 0.00% 1 0.02% - 0.00% - 0.00%
2,000,000 - 2,499,999 - 0.00% - 0.00% - 0.00% 2 0.04%
2,500,000 - 2,999,999 - 0.00% - 0.00% 1 0.17% 1 0.02%
3,000,000 - 3,499,999 - 0.00% - 0.00% - 0.00% - 0.00%
3,500,000 - 3,999,999 - 0.00% - 0.00% - 0.00% - 0.00%
Over 4,000,000 - 0.00% - 0.00% - 0.00% - 0.00%
366 4,244 580 4,881
**Year-to-date values in the monthly statistics package will accurately reflect our database at that specific point in time. Older monthly statistics will not reflect up-
to-date changes that naturally occur.”
CALGARY REAL ESTATE BOARD
CALGARY METRO BY PRICE
Sep-10 Sep-09
Month **Y.T.D. Month **Y.T.D.
3 of 10

8/8/2019 Calgary Real Estate Market Statistics for September 2010
http://slidepdf.com/reader/full/calgary-real-estate-market-statistics-for-september-2010 4/10
8/8/2019 Calgary Real Estate Market Statistics for September 2010
http://slidepdf.com/reader/full/calgary-real-estate-market-statistics-for-september-2010 5/10
Style Inventory
Listings
Added Sales Avg Price Total Sales Median Price Avg DOM S$/L$
NW
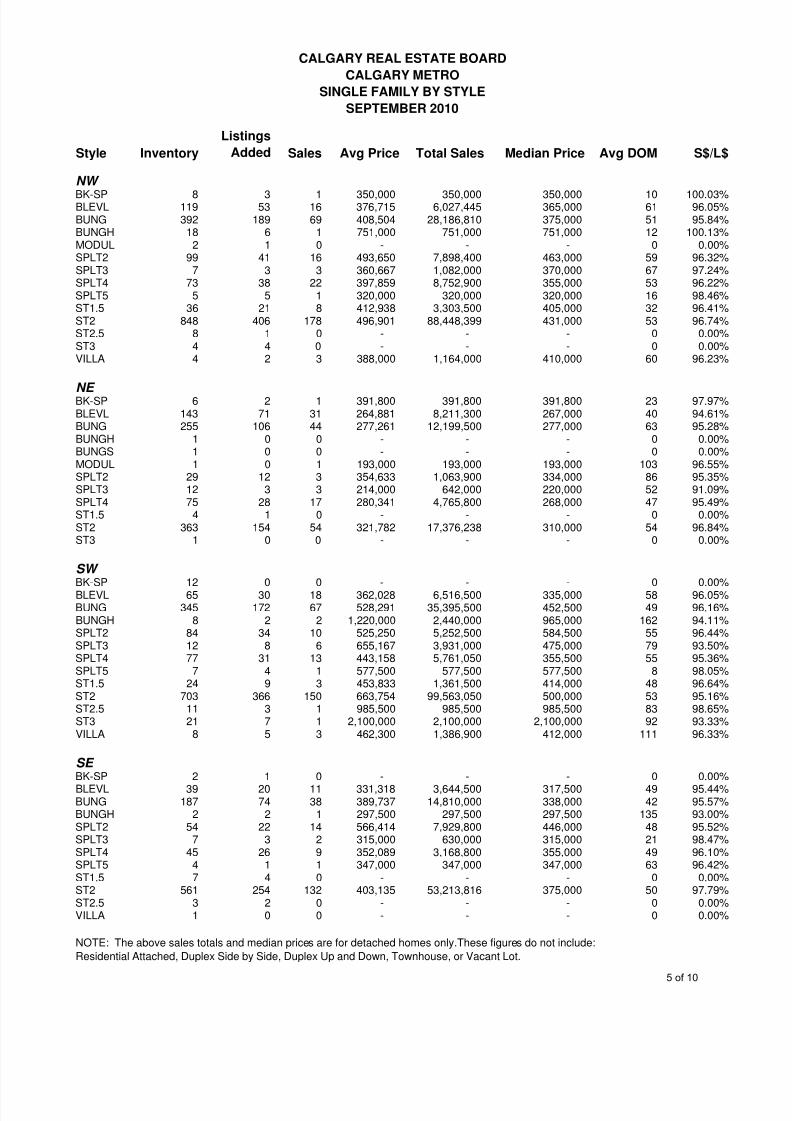
BK-SP 8 3 1 350,000 350,000 350,000 10 100.03%BLEVL 119 53 16 376,715 6,027,445 365,000 61 96.05%BUNG 392 189 69 408,504 28,186,810 375,000 51 95.84%BUNGH 18 6 1 751,000 751,000 751,000 12 100.13%MODUL 2 1 0 - - - 0 0.00%SPLT2 99 41 16 493,650 7,898,400 463,000 59 96.32%SPLT3 7 3 3 360,667 1,082,000 370,000 67 97.24%SPLT4 73 38 22 397,859 8,752,900 355,000 53 96.22%SPLT5 5 5 1 320,000 320,000 320,000 16 98.46%ST1.5 36 21 8 412,938 3,303,500 405,000 32 96.41%ST2 848 406 178 496,901 88,448,399 431,000 53 96.74%ST2.5 8 1 0 - - - 0 0.00%ST3 4 4 0 - - - 0 0.00%VILLA 4 2 3 388,000 1,164,000 410,000 60 96.23%
NE
BK-SP 6 2 1 391,800 391,800 391,800 23 97.97%BLEVL 143 71 31 264,881 8,211,300 267,000 40 94.61%BUNG 255 106 44 277,261 12,199,500 277,000 63 95.28%BUNGH 1 0 0 - - - 0 0.00%BUNGS 1 0 0 - - - 0 0.00%MODUL 1 0 1 193,000 193,000 193,000 103 96.55%SPLT2 29 12 3 354,633 1,063,900 334,000 86 95.35%SPLT3 12 3 3 214,000 642,000 220,000 52 91.09%SPLT4 75 28 17 280,341 4,765,800 268,000 47 95.49%ST1.5 4 1 0 - - - 0 0.00%ST2 363 154 54 321,782 17,376,238 310,000 54 96.84%ST3 1 0 0 - - - 0 0.00%
SW
BK-SP 12 0 0 - - - 0 0.00%BLEVL 65 30 18 362,028 6,516,500 335,000 58 96.05%BUNG 345 172 67 528,291 35,395,500 452,500 49 96.16%BUNGH 8 2 2 1,220,000 2,440,000 965,000 162 94.11%SPLT2 84 34 10 525,250 5,252,500 584,500 55 96.44%SPLT3 12 8 6 655,167 3,931,000 475,000 79 93.50%SPLT4 77 31 13 443,158 5,761,050 355,500 55 95.36%SPLT5 7 4 1 577,500 577,500 577,500 8 98.05%ST1.5 24 9 3 453,833 1,361,500 414,000 48 96.64%ST2 703 366 150 663,754 99,563,050 500,000 53 95.16%ST2.5 11 3 1 985,500 985,500 985,500 83 98.65%ST3 21 7 1 2,100,000 2,100,000 2,100,000 92 93.33%VILLA 8 5 3 462,300 1,386,900 412,000 111 96.33%
SE
BK-SP 2 1 0 - - - 0 0.00%
BLEVL 39 20 11 331,318 3,644,500 317,500 49 95.44%BUNG 187 74 38 389,737 14,810,000 338,000 42 95.57%BUNGH 2 2 1 297,500 297,500 297,500 135 93.00%SPLT2 54 22 14 566,414 7,929,800 446,000 48 95.52%SPLT3 7 3 2 315,000 630,000 315,000 21 98.47%SPLT4 45 26 9 352,089 3,168,800 355,000 49 96.10%SPLT5 4 1 1 347,000 347,000 347,000 63 96.42%ST1.5 7 4 0 - - - 0 0.00%ST2 561 254 132 403,135 53,213,816 375,000 50 97.79%ST2.5 3 2 0 - - - 0 0.00%VILLA 1 0 0 - - - 0 0.00%
NOTE: The above sales totals and median prices are for detached homes only.These figures do not include:
Residential Attached, Duplex Side by Side, Duplex Up and Down, Townhouse, or Vacant Lot.
CALGARY METRO
CALGARY REAL ESTATE BOARD
SINGLE FAMILY BY STYLE
SEPTEMBER 2010
5 of 10
8/8/2019 Calgary Real Estate Market Statistics for September 2010
http://slidepdf.com/reader/full/calgary-real-estate-market-statistics-for-september-2010 6/10
Style Inventory
Listings
Added Sales Avg Price Total Sales Median Price Avg DOM S$/L$
NW
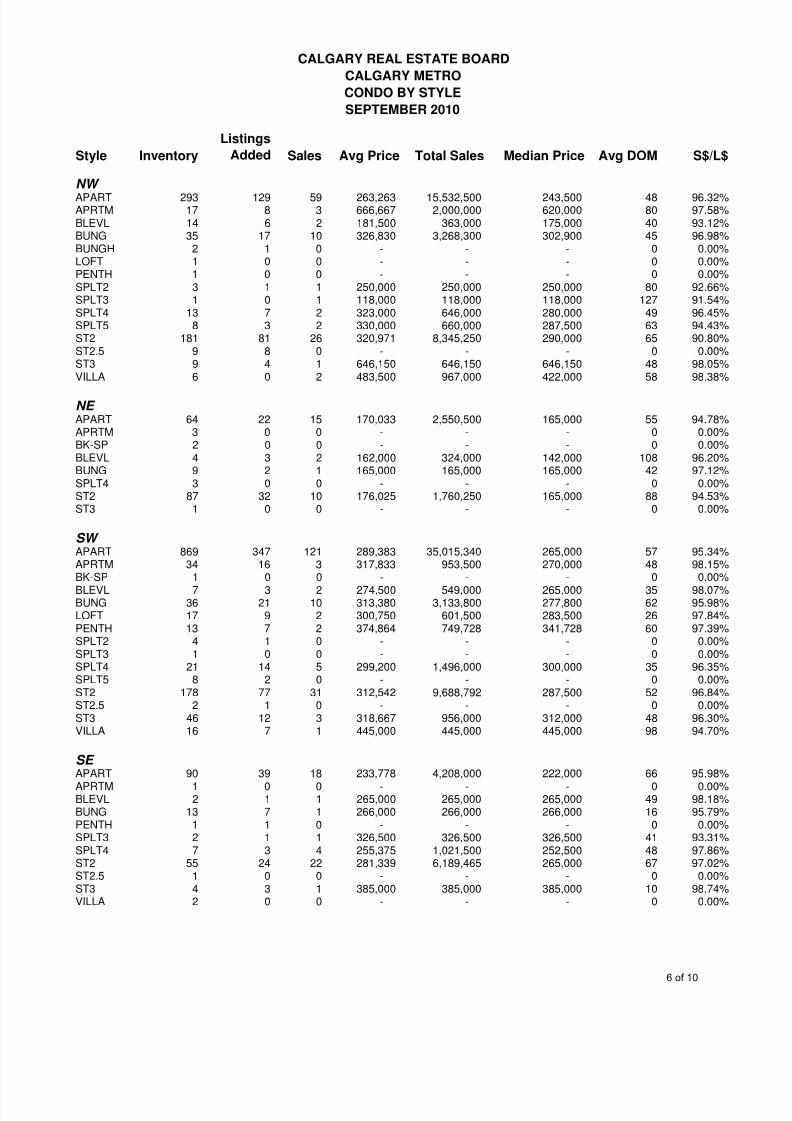
APART 293 129 59 263,263 15,532,500 243,500 48 96.32%APRTM 17 8 3 666,667 2,000,000 620,000 80 97.58%
BLEVL 14 6 2 181,500 363,000 175,000 40 93.12%
BUNG 35 17 10 326,830 3,268,300 302,900 45 96.98%
BUNGH 2 1 0 - - - 0 0.00%
LOFT 1 0 0 - - - 0 0.00%
PENTH 1 0 0 - - - 0 0.00%
SPLT2 3 1 1 250,000 250,000 250,000 80 92.66%
SPLT3 1 0 1 118,000 118,000 118,000 127 91.54%
SPLT4 13 7 2 323,000 646,000 280,000 49 96.45%
SPLT5 8 3 2 330,000 660,000 287,500 63 94.43%
ST2 181 81 26 320,971 8,345,250 290,000 65 90.80%
ST2.5 9 8 0 - - - 0 0.00%
ST3 9 4 1 646,150 646,150 646,150 48 98.05%
VILLA 6 0 2 483,500 967,000 422,000 58 98.38%
NE
APART 64 22 15 170,033 2,550,500 165,000 55 94.78%
APRTM 3 0 0 - - - 0 0.00%
BK-SP 2 0 0 - - - 0 0.00%
BLEVL 4 3 2 162,000 324,000 142,000 108 96.20%
BUNG 9 2 1 165,000 165,000 165,000 42 97.12%
SPLT4 3 0 0 - - - 0 0.00%
ST2 87 32 10 176,025 1,760,250 165,000 88 94.53%
ST3 1 0 0 - - - 0 0.00%
SW
APART 869 347 121 289,383 35,015,340 265,000 57 95.34%
APRTM 34 16 3 317,833 953,500 270,000 48 98.15%
BK-SP 1 0 0 - - - 0 0.00%
BLEVL 7 3 2 274,500 549,000 265,000 35 98.07%BUNG 36 21 10 313,380 3,133,800 277,800 62 95.98%
LOFT 17 9 2 300,750 601,500 283,500 26 97.84%
PENTH 13 7 2 374,864 749,728 341,728 60 97.39%
SPLT2 4 1 0 - - - 0 0.00%
SPLT3 1 0 0 - - - 0 0.00%
SPLT4 21 14 5 299,200 1,496,000 300,000 35 96.35%
SPLT5 8 2 0 - - - 0 0.00%
ST2 178 77 31 312,542 9,688,792 287,500 52 96.84%
ST2.5 2 1 0 - - - 0 0.00%
ST3 46 12 3 318,667 956,000 312,000 48 96.30%
VILLA 16 7 1 445,000 445,000 445,000 98 94.70%
SE
APART 90 39 18 233,778 4,208,000 222,000 66 95.98%
APRTM 1 0 0 - - - 0 0.00%BLEVL 2 1 1 265,000 265,000 265,000 49 98.18%
BUNG 13 7 1 266,000 266,000 266,000 16 95.79%
PENTH 1 1 0 - - - 0 0.00%
SPLT3 2 1 1 326,500 326,500 326,500 41 93.31%
SPLT4 7 3 4 255,375 1,021,500 252,500 48 97.86%
ST2 55 24 22 281,339 6,189,465 265,000 67 97.02%
ST2.5 1 0 0 - - - 0 0.00%
ST3 4 3 1 385,000 385,000 385,000 10 98.74%
VILLA 2 0 0 - - - 0 0.00%
CALGARY REAL ESTATE BOARD
CALGARY METRO
CONDO BY STYLE
SEPTEMBER 2010
6 of 10
8/8/2019 Calgary Real Estate Market Statistics for September 2010
http://slidepdf.com/reader/full/calgary-real-estate-market-statistics-for-september-2010 7/10
Type
Sold or
Leased
Sold or
Leased
Avg Price or
Lse / M2
Avg DOM Total Sales SP / LP
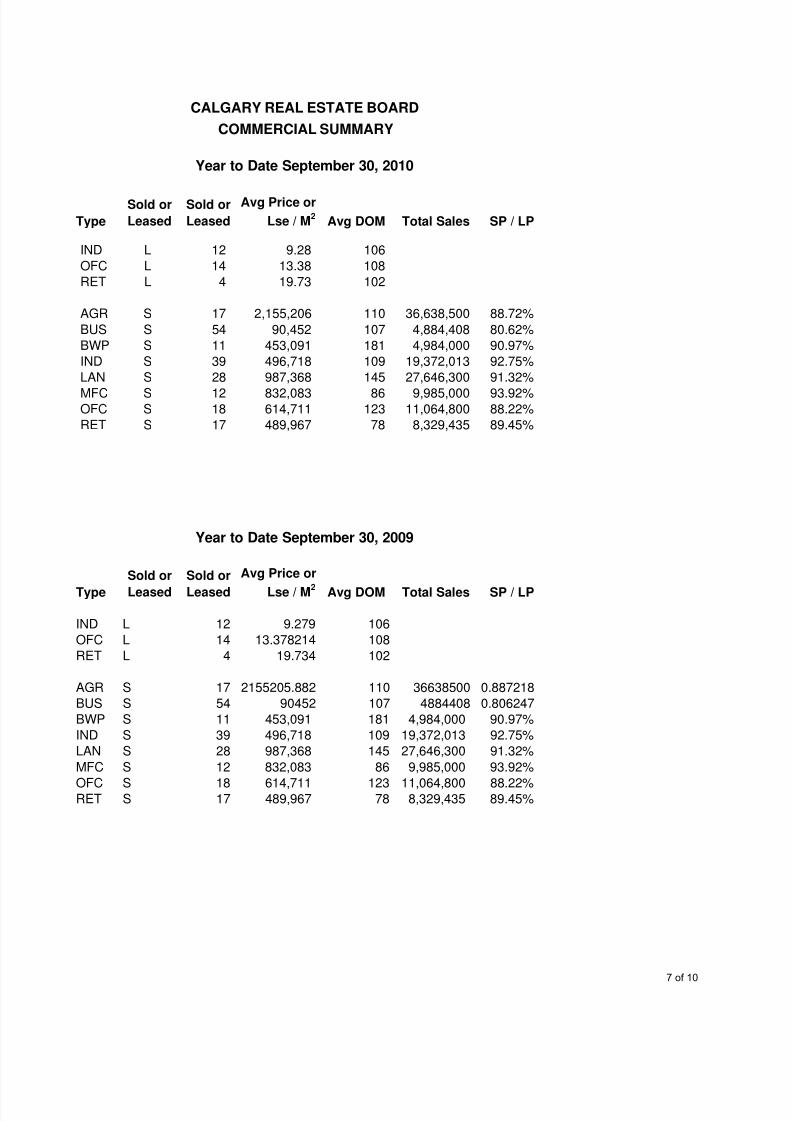
IND L 12 9.28 106
OFC L 14 13.38 108
RET L 4 19.73 102
AGR S 17 2,155,206 110 36,638,500 88.72%
BUS S 54 90,452 107 4,884,408 80.62%
BWP S 11 453,091 181 4,984,000 90.97%
IND S 39 496,718 109 19,372,013 92.75%
LAN S 28 987,368 145 27,646,300 91.32%
MFC S 12 832,083 86 9,985,000 93.92%OFC S 18 614,711 123 11,064,800 88.22%
RET S 17 489,967 78 8,329,435 89.45%
Type
Sold or
Leased
Sold or
Leased
Avg Price or
Lse / M2 Avg DOM Total Sales SP / LP
IND L 12 9.279 106
OFC L 14 13.378214 108
RET L 4 19.734 102
AGR S 17 2155205.882 110 36638500 0.887218
BUS S 54 90452 107 4884408 0.806247
BWP S 11 453,091 181 4,984,000 90.97%
IND S 39 496,718 109 19,372,013 92.75%
LAN S 28 987,368 145 27,646,300 91.32%
MFC S 12 832,083 86 9,985,000 93.92%
OFC S 18 614,711 123 11,064,800 88.22%RET S 17 489,967 78 8,329,435 89.45%
COMMERCIAL SUMMARY
CALGARY REAL ESTATE BOARD
Year to Date September 30, 2009
Year to Date September 30, 2010
7 of 10

8/8/2019 Calgary Real Estate Market Statistics for September 2010
http://slidepdf.com/reader/full/calgary-real-estate-market-statistics-for-september-2010 8/10
CALGARY REAL ESTATE BOARD
2387 2346
19761428 1447
1988
2535 2448 22391902 1683 1628 1673
8464
7995
7409
6006
6838
8154
10003
11725
1298913459
12865
11928
11349
412,348
409,823
415,031
402,055395,435
399,661
420,693
405,850
433,030 433,248 416,064
395,933
410,708
355,000360,000
360,000
360,000352,000 352,000
375,000
364,500375,000
370,000 362,000
350,000355,000
$0
$50,000
$100,000
$150,000
$200,000
$250,000
$300,000
$350,000
$400,000
$450,000
$500,000
0
2000
4000
6000
8000
10000
12000
14000
16000
18000
20000
22000
Sep-09 Oct-09 Nov-09 Dec-09 Jan-10 Feb-10 Mar-10 Apr-10 May-10 Jun-10 Jul-10 Aug-10 Sep-10
A v e r a g e / M e d i a n S a l e s P r i c e
# S a l e s / I n v e n t o r y
TOTAL MLS®
SEPTEMBER 2010
Sales
Inventory
Avg Sale Price
Median Sale Price
8 of 10
8/8/2019 Calgary Real Estate Market Statistics for September 2010
http://slidepdf.com/reader/full/calgary-real-estate-market-statistics-for-september-2010 9/10
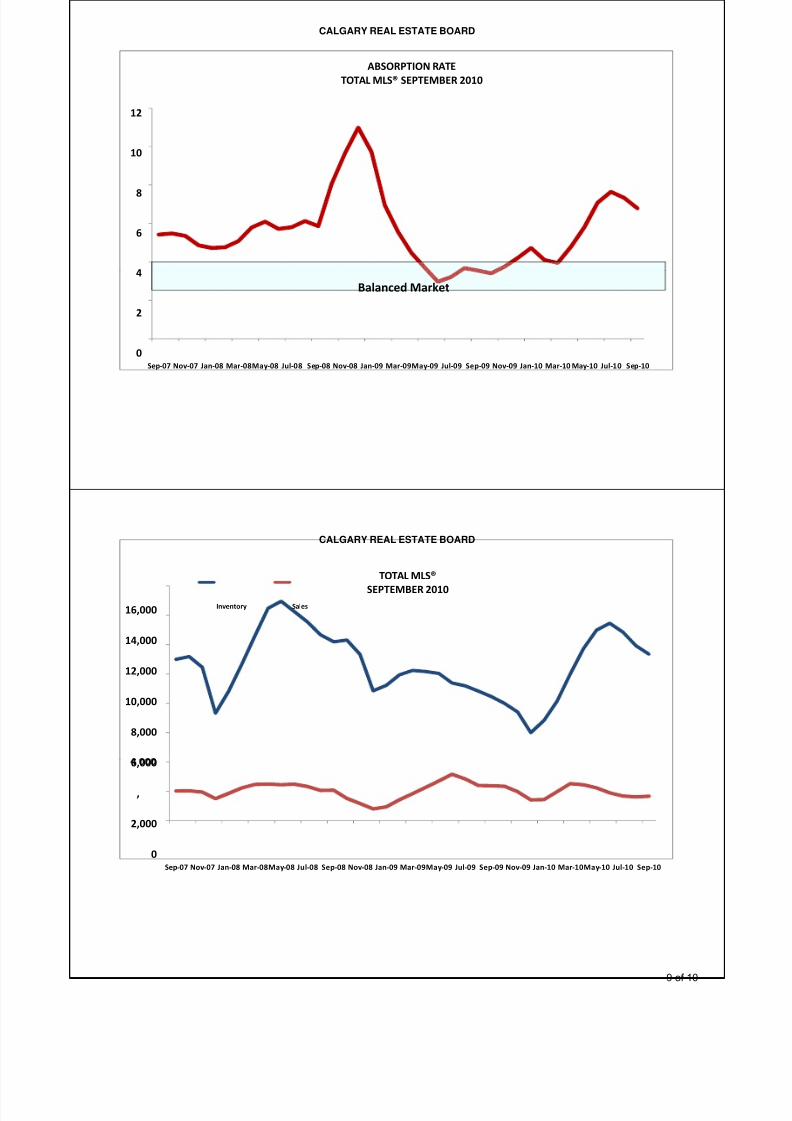
CALGARY REAL ESTATE BOARD
4
6
8
10
12
ABSORPTION RATE
TOTAL MLS® SEPTEMBER 2010
0
2
Sep‐07 Nov‐07 Jan‐08 Mar‐08May‐08 Jul‐08 Sep‐08 Nov‐08 Jan‐09 Mar‐09May‐09 Jul‐09 Sep‐09 Nov‐09 Jan‐10 Mar‐10 May‐10 Jul‐10 Sep‐10
Balanced Market
CALGARY REAL ESTATE BOARD
6,000
8,000
10,000
12,000
14,000
16,000
TOTAL MLS®
SEPTEMBER 2010
Inventory Sales
0
2,000
,
Sep‐07 Nov‐07 Jan‐08 Mar‐08May‐08 Jul‐08 Sep‐08 Nov‐08 Jan‐09 Mar‐09May‐09 Jul‐09 Sep‐09 Nov‐09 Jan‐10 Mar‐10May‐10 Jul‐10 Sep‐10
9 of 10

8/8/2019 Calgary Real Estate Market Statistics for September 2010
http://slidepdf.com/reader/full/calgary-real-estate-market-statistics-for-september-2010 10/10
CALGARY REAL ESTATE BOARD
2,000
3,000
4,000
5,000
6,000
7,000
TOTAL MLS®
SEPTEMBER 2010New Listings
Sales
0
1,000
Sep‐07 Nov‐07 Jan‐08 Mar‐08May‐08 Jul‐08 Sep‐08 Nov‐08 Jan‐09 Mar‐09May‐09 Jul‐09 Sep‐09 Nov‐09 Jan‐10 Mar‐10May‐10 Jul‐10 Sep‐10
CALGARY REAL ESTATE BOARD
8,000
10,000
12,000
14,000
16,000
18,000
20,000
8,464
11,349
TOTAL MLS® INVENTORY
AS
OF
SEPTEMBER MONTH END
0
2,000
4,000
,
2009 2010
10 of 10