Calendar No. 614 - U.S. Government Printing Office
22
Wu and Ding Volume 2, Number 2, December 2007 199 Validating the American Customer Satisfaction Index Model in the Online Context: An Empirical Study of U.S. Consumer Electronics E-Tailers Kuang-Wen Wu Assistant Professor, Department of International Trade Feng Chia University, Taiwan [email protected] May-Ching Ding Assistant Professor, Department of International Busines, Yu Da College of Business, Taiwan ABSTRACT The American Customer Satisfaction Index (ACSI) model, developed in 1996, used a multiple indicator approach to measure overall customer satisfaction. The authors of the present non-experimental, exploratory study adopted the ACSI model to examine and explore the relationships among electronic service quality, customer expectations, perceived value, customer satisfaction, and customer loyalty for consumer electronics e-tailers. The study adopted quota and snowball sampling. A total of 276 valid responses were collected from an online survey, and the data was analyzed using structural equation modeling (SEM). Of the eight hypotheses in this study, six were supported and two were not. Findings indicated that perceived value and customer satisfaction were two significant variables that mediated the relationships between electronic service quality and customer loyalty. Moreover, this study found that electronic service quality had no direct effect on customer satisfaction, but had indirect positive effects on customer satisfaction for consumer electronics e-tailers. In terms of practical implications, managers of consumer electronics e-tailers could formulate a competitive strategy based on the modified ACSI model to retain current customers and to enhance customer relationship management (CRM). The study also includes a discussion of limitations and recommendations for future research. Keywords: Customer satisfaction, customer loyalty, perceived value, e-tailing
Transcript of Calendar No. 614 - U.S. Government Printing Office

Wu and Ding
Volume 2, Number 2, December 2007
199
Validating the American Customer Satisfaction Index Model
in the Online Context: An Empirical Study of
U.S. Consumer Electronics E-Tailers
Kuang-Wen Wu
Assistant Professor, Department of International Trade Feng Chia University, Taiwan
May-Ching Ding Assistant Professor, Department of International Busines,
Yu Da College of Business, Taiwan
ABSTRACT
The American Customer Satisfaction Index (ACSI) model, developed in 1996, used a multiple indicator approach to measure overall customer satisfaction. The authors of the present non-experimental, exploratory study adopted the ACSI model to examine and explore the relationships among electronic service quality, customer expectations, perceived value, customer satisfaction, and customer loyalty for consumer electronics e-tailers. The study adopted quota and snowball sampling. A total of 276 valid responses were collected from an online survey, and the data was analyzed using structural equation modeling (SEM). Of the eight hypotheses in this study, six were supported and two were not.
Findings indicated that perceived value and customer satisfaction were two significant variables that mediated the relationships between electronic service quality and customer loyalty. Moreover, this study found that electronic service quality had no direct effect on customer satisfaction, but had indirect positive effects on customer satisfaction for consumer electronics e-tailers. In terms of practical implications, managers of consumer electronics e-tailers could formulate a competitive strategy based on the modified ACSI model to retain current customers and to enhance customer relationship management (CRM). The study also includes a discussion of limitations and recommendations for future research. Keywords: Customer satisfaction, customer loyalty, perceived value, e-tailing

Validating the American Customer Satisfaction
Index Model in the Online Context
International Journal of Business and Information
200
1. INTRODUCTION Electronic commerce has emerged as an increasingly significant business phenomenon in recent years [Sexton, Johnson, and Hignite, 2002], and the experience of shopping in an online store is more technological than the non-electronic retail service experience. Using the Internet, customers browse Web sites to find merchandise, to search for merchandise information, and to compare prices. They are also able to determine when the items will be delivered and how to return merchandise. All of those experiences influence customers' expected and perceived notions of an e-tailer's service quality, and will ultimately influence their satisfaction and loyalty. Among customers who change retail sales providers, however, nearly 70% do not complain about price or product quality, but about the indifferent attitude of their former providers [Bennington and Cummane, 1998]. The WebTrack data also has shown that, although more online-only retailers (33%) than brick-and-mortar retailers (28%) responded to customer service e-mails within six hours, the pure-plays were less responsive overall [as cited in Cox, 2002]. Meanwhile, findings from the Jupiter Executive Survey revealed that a majority of customers (57%) indicated that the speed of a retailer's response to customer service e-mail inquiries would affect their decision to make future purchases from a particular Web site [as cited in Cox, 2002]. These consumers' responses indicate that service quality is one of the factors that influences customer satisfaction and retains customers in the competitive online market.
Service quality and customer satisfaction have been selected as research topics for the last 40 years. In the last 10 years, however, development of the Internet has fostered the emergence of e-commerce, a new kind of business that has caused researchers to rethink the definition of business. Parasuraman, Zeithaml, and Berry [1988], who developed SERVQUAL, have also developed two new scales to show their interest in the new era – E-S-QUAL and E-RecS-QUAL [Parasuraman, Zeithaml, and Malhotra, 2005]. Unlike SERVQUAL, which was examined and applied in several studies, E-S-QUAL and E-RecS-QUAL are newly developed products that need continued validation and application to different types of e-business.
In the satisfaction literature, Fornell, Johnson, Anderson, Cha, and Bryant [1996] have developed the American Customer Satisfaction Index (ACSI) model, which comprehensively identifies causal relationships among customer satisfaction and antecedents and consequences of customer satisfaction. However, expectation measures used in the ACSI are concerned with quality rather than value. The logic behind the expectations to value linkage is unclear [Johnson, Gustafsson, Andreassen, Lervik, and Cha, 2000]. The purpose of our non-experimental, causal study is to provide construct validation of the ACSI model by examining, within the online context – and particularly for consumer electronics e-tailers – the relationships among customer expectations, electronic service quality, perceived value, customer satisfaction, customer loyalty, and customer complaints.

Wu and Ding
Volume 2, Number 2, December 2007
201
2. LITERATURE REVIEW
The literature review covers the following major areas: electronic service
quality (2.1), expectancy disconfirmation (2.2), perceived values and satisfaction
(2.3), and service quality, customer satisfaction, and loyalty (2.4). 2.1. Electronic Service Quality
Self-service is an important concept in business-to-consumer e-commerce. Online shoppers look for items they want to purchase on the Internet, add items into an online basket, and click the “Submit” button to send an order to online stores. The growing volume of online sales every year is evidence that consumers increasingly prefer to "help themselves," and, in so doing, demand instant information [Bonde and Cahill, 2005]. According to 50% of 1,008 survey respondents, saving time is the biggest advantage of self-service, whereas 43% say that lack of human contact is the biggest disadvantage [Howard and Worboys, 2003].
Like the shop window of a physical retail store, a Web page is an essential element for a virtual store. However, an online store not only needs a fancy, informative Web page, but also a reliable system to support the operation. A study conducted by the Boston Consulting Group indicates that 48% of respondents cite slow response time as the main reason for abandoning online transactions [as cited in Teeter and Schointuch, 2000].
In a three-stage process, Zeithaml, Parasuraman, and Malhotra [2000] developed 11 e-SQ dimensions for measuring perceived e-service quality, using exploratory focus groups and two phases of empirical data collection and analysis. Their purpose was to develop a conceptual framework to understand e-service quality. They also suggested that the 11 e-SQ dimensions should be continually examined and improved [Zeithaml, Parasuraman, and Malhotra, 2002]. Parasuraman, Zeithaml, and Malhotra [2005] refined the e-SQ scale and developed an E-Core Service Quality Scale (E-S-QUAL) for measuring electronic service quality. This scale consists of 22 items to measure four dimensions: efficiency, system availability, fulfillment, and privacy.
The E-S-QUAL was successfully tested in a study using a quota-sampling method. One-third of respondents were asked to evaluate their favorite sites, one-third were asked to evaluate their second-favorite sites, and one-third were asked to evaluate their third-favorite sites [Parasuraman et al., 2005]. There were 549 completed questionnaires from randomly selected Web users. These scholars suggested that the scale may be modified to measure service quality of pure-service sites because their research focused on Web sites that sold physical products. 2.2. Expectancy Disconfirmation
Expectancy disconfirmation theory consists of two components: the formation of expectations, and the disconfirmation of those expectations through performance comparisons [Oliver and DeSarbo, 1988]. Expectations reflect anticipated performance [Churchill and Surprenant, 1982]. Oliver [1997] defined
Validating the American Customer Satisfaction
Index Model in the Online Context
International Journal of Business and Information
202
an expectation as "anticipation of future consequences based on prior experience, current circumstances, or other sources of information" [p. 68]. Zeithaml, Berry, and Parasuraman [1993] developed a conceptual model of customer service expectations. They found that there are three different levels of customer expectations: desired service ("ideal"), adequate service ("should"), and predictive service ("will"). However, researchers argued that respondents were often confused when they attempted to distinguish among these three levels of expectations [Tse and Wilton, 1988].
The literature on customer satisfaction suggests that customers' expectations have an impact on satisfaction levels. As presented by Oliver [1980], customers form expectations of anticipated performance prior to purchase. These expectations serve as the baseline for satisfaction assessments [Oliver, 1981, 1993]. Interestingly, customers are believed to adapt satisfaction levels to expectation levels in order to avoid the discord that would happen when expectations deviate from satisfaction levels. This effect results in the higher (lower) expectations and the higher (lower) satisfaction judgment [Oliver, 1997; Oliver and DeSarbo, 1988]. The majority of the empirical findings supported a positive relationship between expectations and satisfaction [Bearden and Teel, 1983; Swan and Trawick, 1981].
By the mid-1980s, satisfaction literature focused on the disconfirmation paradigm [Bearden and Teel, 1983; Churchill and Surprenant, 1982; Oliver, 1980; Prakash and Lounsbury, 1984]. In one of their studies, Churchill and Surprenant [1982] linked related concepts and formed a disconfirmation paradigm, encompassing four constructs: expectations, performance, disconfirmation, and satisfaction. According to their paradigm of satisfaction, disconfirmation resulted from the discrepancy between expectations and performance, "occupied a central position as a crucial intervening variable" [Churchill and Surprenant, 1982, p. 492], and eventually influenced satisfaction. The performance-expectation comparison was labeled negative disconfirmation if the product or service was worse than expected, positive disconfirmation if better than expected, and zero or simple disconfirmation if as expected [Oliver and DeSarbo, 1988]. A more recent study also supported the idea that disconfirmation is emerging as a dominant predictor of satisfaction effects [Szymanski and Henard, 2001].
Hypothesis 1. Customer expectation has a direct positive effect on electronic service quality for consumer electronics e-tailers. Hypothesis 2. Customer expectation has a direct positive effect on customer satisfaction for consumer electronics e-tailers.
2.3. Perceived Value and Satisfaction An early pioneer in the study of equity, George Homans stated that the
essence of equity was contained in a "rule of justice" [as cited in Oliver, 1997]. In fundamental terms, equity is an evaluation of fairness, rightness, or deservingness that customers make in reference to what others receive [Oliver,

Wu and Ding
Volume 2, Number 2, December 2007
203
1997]. In the satisfaction literature, equity theory considers the ratio of the customer's perceived outcome/input to that of the service provider's outcome/input [Oliver and DeSarbo, 1988]. Bolton and Lemon [1999] extended this concept to the perspective of perceived value. They declared that equity referred to customers' evaluation of the perceived sacrifice (input) of the offering (outcome). Perceived sacrifices include purchase price and other possible costs such as time consumption [Yang, 2001]. A positive perception of value may bring customers back to make another transaction [Minocha, Dawson, Blandford, and Millard, 2005]. When customers believe they are being treated fairly in an exchange, they will be satisfied with the transaction if their outcome-to-input ratio is in some sense adequate [Oliver and DeSarbo, 1988]. Fredericks and Salter [1998] pointed out that quality, price, and company or brand image are three factors comprised in the customer value package. In other words, customers will make an explicit comparison between what they give and what they get. The positive relationship between equity and satisfaction was supported in the literature [Oliver, 1993; Oliver and Swan, 1989a, 1989b]. However, customers expect prices to be lower in an online store than in a traditional sales channel [Karlsson, Kuttainen, Pitt, and Spyropoulou, 2005]. They may expect to get more value from an online store than from a physical store.
Hypothesis 3. Customer expectation has a direct positive effect on perceived value for consumer electronics e-tailers. Hypothesis 4. Electronic service quality has a direct positive effect on perceived value for consumer electronics e-tailers. Hypothesis 5. Perceived value has a direct positive effect on customer satisfaction for consumer electronics e-tailers.
2.4. Service Quality, Customer Satisfaction, and Loyalty
Bloemer and Ruyter [1998] suggested that store loyalty resulted from a customer’s being committed to the store through an explicit and extensive decision-making process. Customer loyalty is frequently exercised as a conscious evaluation of the price/quality ratio or the willingness to pay a premium price or, alternatively, price indifference [Raju, Srinivasan, and Lal, 1990; Zeithaml, Berry, and Parasuraman, 1996]. Supphellen and Nysveen [2001] suggested that corporate brand loyalty affected online shoppers' intentions to revisit the website.
Cronin and Taylor [1992] examined the causal relationships among service quality, customer satisfaction, and purchase intention. Each variable was measured by one item. There were 660 usable questionnaires randomly collected from customers of four types of businesses in the southeastern United States: banking, pest control, dry cleaning, and fast food. The results of correlation analysis have suggested that (1) service quality was an antecedent of customer satisfaction, (2) service quality had less effect on purchase intentions than did customer satisfaction, and (3) customer satisfaction had a significant effect on purchase intentions.
Validating the American Customer Satisfaction
Index Model in the Online Context
International Journal of Business and Information
204
Dabholkar, Shepherd, and Thorpe [2000] also found that customer satisfaction strongly mediated the effect of service quality on behavioral intentions. The data used in their study were systematically and randomly collected from 397 churches. A test of discriminant validity revealed that the construct of service quality was different from the construct of customer satisfaction. The result of regression analysis in structural equations modeling supported their proposition that customer satisfaction had a stronger effect on behavioral intentions than did service quality [Dabholkar et al., 2000].
Service quality literature indicated that perceptions of high service quality and high service satisfaction resulted in a very high level of purchase intentions [Boulding, Kalra, Staelin, and Zeithaml, 1993; Cronin and Taylor, 1992; Taylor, 1997; Taylor and Baker, 1994; Zeithaml et al., 1996]. Cöner and Güngör [2002] stated that customer loyalty was affected by product quality, service quality, and retailer image. They also suggested "quality [of product and service] . . . is directly related to customer satisfaction, and . . . lead[s] to the loyalty of the customer" [Cöner and Güngör, 2002, p. 195]. Customer satisfaction literature showed that the relationship between customer satisfaction and customer loyalty depended on the type of satisfaction. The positive impact of manifest satisfaction on customer loyalty was stronger than that of latent satisfaction on customer loyalty [Bloemer and Kasper, 1995; Bloemer and Ruyter, 1998]. Based on empirical findings in service quality and satisfaction literature, service quality is one of the antecedents of satisfaction [Anderson and Sullivan, 1993; Cronin and Taylor, 1992, 1994; Reidenbach and Sandifer-Smallwood, 1990; Spreng and Mackoy, 1996; Woodside, Frey, and Daly, 1989], and loyalty is one of the consequences of satisfaction [Cöner and Güngör, 2002; Cronin and Taylor, 1992, 1994; Dabholkar, Shepherd, and Thorpe, 2000]. Luarn and Lin [2004] tested their hypothesized customer loyalty model and found that customer satisfaction, perceived value, and customer loyalty were different constructs. Their findings indicated that not only customer satisfaction and perceived value directly affected customer loyalty, but also indirectly affected customer loyalty through commitment.
Customer complaints result from customer dissatisfaction. According to Singh [1988], dissatisfaction led to consumer-complaining behavior (CCB), which was expressed in voice responses (complain to seller), private responses (complain to friends), and third-party responses. The findings of Zeithaml et al. [1996] also partially supported the three-dimension typology of complaining behavior.
Hypothesis 6. Electronic service quality has a direct positive effect on customer satisfaction for consumer electronics e-tailers. Hypothesis 7. Customer satisfaction has a direct positive effect on customer loyalty for consumer electronics e-tailers. Hypothesis 8. Customer satisfaction has a direct negative effect on customer complaint for consumer electronics e-tailers.

Wu and Ding
Volume 2, Number 2, December 2007
205
3. METHODOLOGY
This section discusses study methodology with regard to the target
population, the accessible population, the quota and snowball sampling plan, and
instrumentation.
3.1. Target Population
The target population includes a set of people or events to which researchers wish to generalize the results of their study [Romano, 2004]. In this study, the target population included all American online shoppers who had ever purchased consumer electronics products on the Internet. It is difficult to calculate an exact number of the target population because the size of the consumer electronics market is presented by the amount of dollar sales. In this study, the number of the target population was estimated by dividing the number of annual online consumer electronics sales by the amount of average online spending per year per online shopper. Online sales reached $141.4 billion in 2004 [Millard, 2005], and online consumer electronics sales accounted for 6% of total online sales [Miller, 2001]. The average online spending per person in the first half of 2004 was nearly $580 [Kerner, 2004]. The average online shopping frequency was 1.34 times per month [Turow, Feldman, and Meltzer, 2005], or nearly 16 times per year, per online shopper. Therefore, our target population is estimated at 177,500 online shoppers of consumer electronics. 3.2. Accessible Population
The accessible population is a subset of the target population, representing that number which is accessible to a researcher because of geographic, temporal, or cultural characteristics [Romano, 2004]. In this study, the accessible population was limited to online consumer electronics shoppers who could be reached by e-mail, but its number was unknown. 3.3. Quota and Snowball Sampling Plan
Two non-random sampling techniques were used for this study. Sampling method is one of the factors affecting sampling error. The greater the sampling error, the less accurate the estimation of population values [Grossnickle and Raskin, 2001]. For this reason, random samples are always preferable to non-random ones. Random samples, however, are not always available, affordable, or efficient. Online shoppers are more difficult to identify than traditional shoppers; therefore, non-random snowball sampling was used to access the population. To enhance the representativeness of the sample, quota sampling was used. Quota sampling is another non-random sampling technique closely paralleling stratified sampling (random sampling) [StatPat Inc., 2005].
The sample for this study was selected from online consumer electronics shoppers who received the e-mail invitation to participate in an online survey. A snowball sampling method was used to access the initial sample. "Snowball or referral sampling is used when the population being researched is difficult to reach" [Grossnickle and Raskin, 2001, p. 126]. The method relies on finding

Validating the American Customer Satisfaction
Index Model in the Online Context
International Journal of Business and Information
206
initial respondents who fit the profile for the study, contacting them, asking them to participate in the study, and asking them to refer other qualified potential respondents. The initial group of respondents of the snowball was a non-random "quota" sample, selected to represent the population. The strengths of snowball sampling are cost-efficiency and time-saving. Snowball sampling allows researchers to reach the potential qualified respondents by the distribution of interpersonal relationships. By initially starting with a quota sample, to represent various subpopulations in the target population, it may be possible that the final data-producing sample closely represents the target population, thereby strengthening the external validity of study findings.
The demographic profile of the initial quota sample was determined based on the characteristics of U.S. adult Internet users presented by Turow, Feldman, and Meltzer [2005] – that is, 48% male, 59% under 45 years of age, 61% with some college or more, and 55% with a family income of less than $75,000. A study by InsightExpress revealed that the demographics of online consumers in the U.S. were similar to the characteristics of U.S. adult Internet users [as cited in Girard, Korgaonkar, and Silverblatt, 2003]. In our study, the initial quota sample comprised 320 people, selected by the researcher based on quota characteristics (Table 1). The first-order snowball sample consisted of people who received e-mail invitations from the initial sample. The second-order snowball sample consisted of people who received e-mail invitations from the first-order snowball sample. The start date for data collection was August 4, 2005, and the completion date was October 3, 2005.
Table 1
Quota Characteristics and Size of Initial Sample
Some College or
More
Less Than
College Total
Income Age Male Female Male Female
Family
income
less than
$75K
Under 45 years old 32 32 21 21 106
45 years old or
older
20 20
15 15 70
$75K or
more
Under 45 years old 26 26 17 17 86
45 years old or
older
18 18
11 11 58
Total 96 96 64 64 320
Note. The initial quota sample was distributed according to the following characteristics:
50% male, 60% under 45 years old, 60% with some college or more, and 55% with
family income less than $75,000.

Wu and Ding
Volume 2, Number 2, December 2007
207
3.4. Instrumentation Since some constructs cannot be observed directly in the social sciences
field, the researcher has to use scales to measure the theoretical constructs. Those measured in this way are often called “latent variables,” whereas the measured behavior scores are termed “observed or manifest variables” [Byrne, 2001]. The instruments used to measure latent variables are usually in the form of self-reporting questionnaires. This study required measures of six latent variables – customer expectation, electronic service quality, perceived value, customer satisfaction, customer loyalty, and customer complaint. All instruments were adapted from existing scales. The survey instruments included Customer Expectation Scale, Perceived Value Scale, E-S-QUAL, Customer Satisfaction Scale, and Behavioral-Intentions Battery. Participants took approximately 10 minutes to complete the online survey. 4. RESULTS The following discussion of study results covers socio-demographic characteristics of the final data-producing sample, reliability and validity of scales, and the hypothesized causal structure model.
4.1. Characteristics of Final Data-Producing Sample
Among the 359 respondents who participated in the online survey, 20 had not lived in the continental United States for at least six months of the last year, 52 had not purchased online electronic products within the last year, 9 did not finish the online survey, and 2 had made their last purchase more than one year earlier. This left 276 valid responses for use in the data analysis procedures.
The respondents comprised 60.2% males and 39.8% females, ranging from 18 to 75 years of age, with an average age of 35.23 years and a standard deviation of 10.9 years. The largest age group was between 26 and 35 years of age (47.0%), and the smallest was 56 years of age or older (5.6%). Of all respondents, more than 90% completed some higher education. The largest education group was "professional/graduate" (40.6%), and the second largest was "four-year college graduate" (40.2%). The largest group of annual household income (19.4%) was between $60,000 and $74,999. About 60% of respondents had an annual household income of less than $75,000, and 40% had an annual income of more than $75,000. Table 2 presents the frequency distribution of socio-demographic characteristics for respondents..
The socio-demographic characteristics of the final data-producing sample were 60% male, 83% under 45 years old, 95% with some college or more, and 60% with an annual family income of less than $75,000. To assess the representativeness of the final data-producing sample with the target population, and implications for external validity, the percentage difference in four demographic characteristics between the data-producing sample and the initial quota sample were analyzed. For the characteristic of gender, the percentage difference was 10%. For the characteristic of age, the percentage difference was 23% (under-representing those 45 and over).

Validating the American Customer Satisfaction
Index Model in the Online Context
International Journal of Business and Information
208
Table 2
Socio-Demographic Characteristics of Sample,
by Gender, Age, Education, and Household Income
Demographic Variables Frequency Valid Percentage
Gender (n = 274)
Male 165 60.2%
Female 109 39.8%
Agea (n = 268)
18-25 45 16.8%
26-35 126 47.0%
36-45 52 19.4%
46-55 30 11.2%
56 or more 15 5.6%
Hollingshead's Education Scale (n = 276)
1. Professional/Graduate 112 40.6%
2. Four-year college graduate 111 40.2%
3. One to three years college 40 14.5%
4. High school graduate 13 4.7%
Annual Household Income (n = 273)
Less than $ 30,000 29 10.6%
$ 30,000-$ 44,999 38 13.9%
$ 45,000-$ 59,999 44 16.1%
$ 60,000-$ 74,999 53 19.4%
$ 75,000-$ 89,999 39 14.3%
$ 90,000-$104,999 13 4.8%
$105,000-$119,999 18 6.6%
$120,000 or more 39 14.3%
______________________________________________________________________________________________________________
aThe average age was 35.23 years of age, and the standard deviation was 10.9.
For the characteristic of education, the percentage difference was 35%
(under-representing those with less than some college). For the characteristic of family income, the percentage difference was 5%. The results indicated that the characteristics of the final data-producing sample in gender and family income had good representativeness with the initial quota sample, but not with the characteristics of age and education. Table 3 presents the comparison of characteristics of the initial quota sample with the final data-producing sample.

Wu and Ding
Volume 2, Number 2, December 2007
209
Table 3
Comparison of Characteristics of
Initial Quota Sample with Those of Final Data-Producing Sample
Variable
Quota
Sample
(N =
320)
Quota
Sample
(%)
Final Data-
Producing
Sample
(N =
268-276)
Final Data-
Producing
Sample
(%)
Percentage
Difference (data- producing
sample – quota
sample)
Age
n = 268
Under 45 192 60% 223 83% +23%
45 and
older
128 40% 45 17% - 23%
Gender
n = 274
Male 160 50% 165 60% +10%
Female 160 50% 109 40% - 10%
Education
n = 276
No college 128 40% 13 5% - 35%
Some
college or
more
192 60% 263 95% +35%
Family Income
n = 273
Less than
$75K
176 55% 164 60% +5%
$75K or
more
144 45% 109 40% - 5%
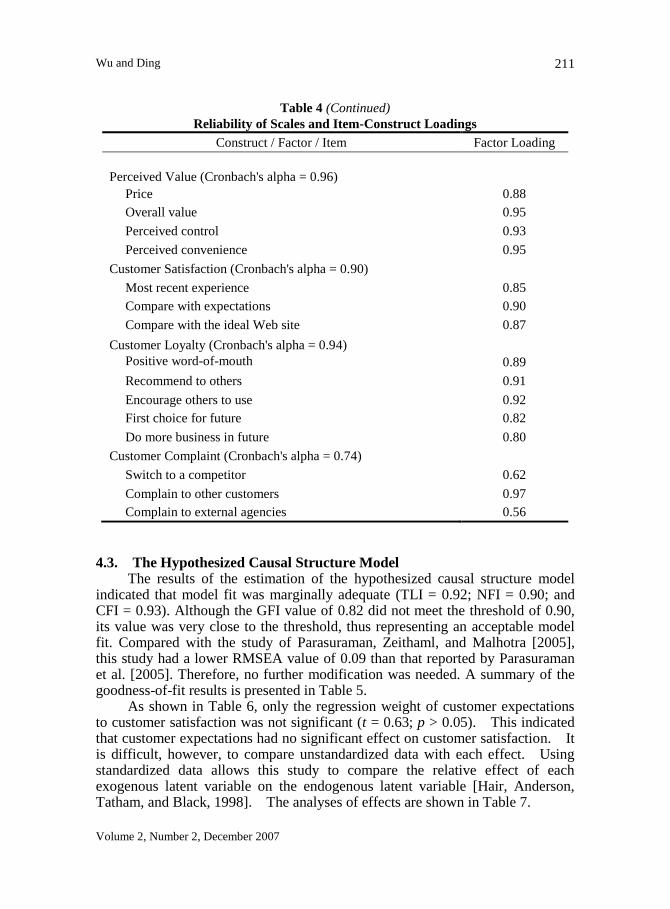
4.2. Reliability and Validity of Scales The reliability of sales used in this study was calculated by Cronbach's
coefficient alpha. The coefficient alpha values exceeded the minimum standard of 0.7 [Nunnally and Bernstein, 1994], providing good estimates of internal consistency reliability. Coefficient alpha values ranged from 0.93 to 0.97 for the four dimensions of electronic service quality and from 0.74 to 0.97 for other constructs (Table 4). All constructs obtained an acceptable level of a coefficient alpha above 0.70, indicating that the scales used in this study were reliable.
The estimates of standardized factor loadings were used to determine the convergent validity of scales. The minimum factor loading in the confirmatory factor analysis for items in this study was 0.56 (Table 4). Because each factor loading on each construct was more than 0.50, the convergent validity for each construct in this study was established [Hair, Anderson, Tatham, and Black, 1998].

Validating the American Customer Satisfaction
Index Model in the Online Context
International Journal of Business and Information
210
Table 4
Reliability of Scales and Item-Construct Loadings
Construct / Factor / Item Factor Loading
Electronic Service Quality (E-S-QUAL)
Efficiency (Cronbach's alpha = 0.96)
Easy to find what I need 0.87
Easy to get anywhere on the site 0.88
Enable to complete a transaction quickly 0.89
Well-organized information 0.90
Load Web page fast 0.86
Simple to use 0.88
Enable to get on to it quickly 0.89
Well-organized Web page 0.84
System Availability (Cronbach's alpha = 0.93)
Always available for business 0.90
Launch and run right away 0.86
Does not crash 0.87
Pages do not freeze after enter order information 0.86
Fulfillment (Cronbach's alpha = 0.97)
Deliver orders when promised 0.93
Items delivery within a suitable time frame 0.91
Quickly deliver 0.92
Send out the items ordered 0.92
Has in stock items that the company claims to have 0.85
Truthful about its offerings 0.91
Make accurate promises about delivery of products 0.91
Privacy (Cronbach's alpha = 0.93)
Protects information about shopping behavior 0.91
Does not share personal information with other sites 0.90
Protect credit card information 0.92
Customer Expectation (Cronbach's alpha = 0.97)
Should be used easily and quickly 0.92
Should fulfill its promises 0.94
Should function properly 0.96
Should be safe and protect customer information 0.90
Overall expectation of service quality 0.90
(continued)
Wu and Ding
Volume 2, Number 2, December 2007
211
Table 4 (Continued)
Reliability of Scales and Item-Construct Loadings
Construct / Factor / Item Factor Loading
Perceived Value (Cronbach's alpha = 0.96)
Price 0.88
Overall value 0.95
Perceived control 0.93
Perceived convenience 0.95
Customer Satisfaction (Cronbach's alpha = 0.90)
Most recent experience 0.85
Compare with expectations 0.90
Compare with the ideal Web site 0.87
Customer Loyalty (Cronbach's alpha = 0.94)
Positive word-of-mouth
0.89
Recommend to others 0.91
Encourage others to use 0.92
First choice for future 0.82
Do more business in future 0.80
Customer Complaint (Cronbach's alpha = 0.74)
Switch to a competitor 0.62
Complain to other customers 0.97
Complain to external agencies 0.56
4.3. The Hypothesized Causal Structure Model
The results of the estimation of the hypothesized causal structure model indicated that model fit was marginally adequate (TLI = 0.92; NFI = 0.90; and CFI = 0.93). Although the GFI value of 0.82 did not meet the threshold of 0.90, its value was very close to the threshold, thus representing an acceptable model fit. Compared with the study of Parasuraman, Zeithaml, and Malhotra [2005], this study had a lower RMSEA value of 0.09 than that reported by Parasuraman et al. [2005]. Therefore, no further modification was needed. A summary of the goodness-of-fit results is presented in Table 5.
As shown in Table 6, only the regression weight of customer expectations to customer satisfaction was not significant (t = 0.63; p > 0.05). This indicated that customer expectations had no significant effect on customer satisfaction. It is difficult, however, to compare unstandardized data with each effect. Using standardized data allows this study to compare the relative effect of each exogenous latent variable on the endogenous latent variable [Hair, Anderson, Tatham, and Black, 1998]. The analyses of effects are shown in Table 7.

Validating the American Customer Satisfaction
Index Model in the Online Context
International Journal of Business and Information
212
Table 5. Goodness-of-Fit Results of the Hypothesized Model
Goodness-of-Fit Statistics Values
Desired
Range of
Values for
Good Fit
Absolute Fit Measures
Chi-square test
χ2
788.49
(p < .001)
p > .05
Degrees of freedom Df 244 ≥ 0
Chi-square / degrees of freedom ratio χ2 / df 3.23 2 to 5
Goodness of fit index GFI .82 > .90
Root mean square error of
approximation RMSEA .09 < .08
Incremental Fit Measures
Adjusted good-of-fit index AGFI .77 > .90
Tucker-Lewis index TLI .92 > .90
Normed fit index NFI .90 > .90
Comparative fit index CFI .93 > .95
Table 6. Regression Weights of the Hypothesized Causal Structure Model
Unstandardized
B coefficient S.E.
Standardized β
coefficient t-value
Electronic
Service
Quality
← Customer
Expectation 4.32 .25 .79
17.16*
*
Customer
Satisfaction ←
Customer
Expectation .07 .12 .05 .63
Perceived
Value ←
Customer
Expectation .93 .15 .51
6.06**
Perceived
Value ←
Electronic
Service Quality .06 .03 .18
2.23
*
Customer
Satisfaction ←
Perceived
Value .66 .06 .83
11.85*
*
Customer
Satisfaction ←
Electronic
Service Quality -.04 .02 -.14
-1.92
*
Customer
Loyalty ←
Customer
Satisfaction .38 .04 .57
9.32**
Customer
Complain ←
Customer
Satisfaction .12 .04 .19
2.87**
Note. * p ≤ .05; ** p ≤ .01

Wu and Ding
Volume 2, Number 2, December 2007
213
In Table 7, only one direct effect was not significant: customer satisfaction (0.050). Six of nine indirect effects were significant – customer expectations to perceived value (0.143), customer expectations to customer loyality (0.273), electronic service quality to customer satisfaction (0.151), perceived value to customer loyalty (0.473), and perceived value to customer complaint (0.161). Three of the indirect effects were not significant – customer expectations to customer complaint (0.092), electronic service quality to customer loyalty (0.005), and electronic service quality to customer complaint (0.002). The results indicated that perceived value and customer satisfaction mediate the relationships among electronic service quality, customer expectations, customer complaints, and customer loyalty. Based on the goodness-of-fit results and the results of the analyses of direct, indirect, and total effects, every hypothesis in this study was supported except Hypothesis 2 and Hypothesis 6.
Table 7
Standardized Direct, Indirect, and Total Effects of Hypothesized Model
Customer
Expectation
Electronic
Service
Quality
Perceived
Value
Customer
Satisfaction
Direct effects
Electronic service quality .786**
Perceived value .507** .182*
Customer satisfaction .050** -.142* .834**
Customer loyalty .568**
Customer complaint .192**
Indirect effects
Perceived value .143**
Customer satisfaction .430** .151*
Customer loyalty .273** .005 .473**
Customer complaint .092** .002 .161**
Total effectsa
Electronic service quality .786**
Perceived value .649** .182*
Customer satisfaction .480** .009 .834**
Customer loyalty .273** .005 .473** .568**
Customer complaint .092** .002 .161** .192**
Note. * p ≤ .05; ** p ≤ .01 aTotal effects = Direct effects + Indirect effects.

Validating the American Customer Satisfaction
Index Model in the Online Context
International Journal of Business and Information
214
5. DISCUSSION AND CONCLUSION The data analysis results indicated that customer expectations and electronic
service quality did not directly influence customer satisfaction. Instead, it was found that they indirectly affected it via perceived value. These unpredicted findings do not support empirical findings of a positive relationship between expectations and satisfaction found by Bearden and Teel [1983] and Swan and Trawick [1981], and do not support empirical findings that service quality is one of the antecedents of satisfaction [Anderson and Sullivan, 1993; Cronin and Taylor, 1992, 1994; Reidenbach and Sandifer-Smallwood, 1990; Spreng and Mackoy, 1996; Woodside, Frey, and Daly, 1989]. A possible explanation for these unexpected findings may be that online shoppers primarily evaluate their satisfaction according to their perceived value. The process of online shopping is a kind of self-service procedure. Online shoppers on their own decide what kind of consumer electronics product they want to purchase, read the online product description, compare prices and coupon codes on the Internet, and submit an electronic order to the e-tailer of their choice. It is no wonder that saving time is the biggest advantage of self-service [Howard and Worboys, 2003]. Because of the lack of human contact, online shoppers may easily misunderstand that e-tailers start to serve customers only from order handling to delivery, and forget that service includes the development and design of the website, reliable computer servers, and so on. Therefore, online shoppers may simply use the price and the delivery as the standards for the evaluation of satisfaction.
The results also indicated that customer satisfaction did influence behavioral intentions. Online shoppers who were satisfied with shopping experiences with consumer electronics e-tailers may have favorable intentions toward the sites such as repurchase intentions; online shoppers who were not satisfied may have unfavorable intentions toward the sites, which may lead them to complain to other customers. These findings confirm the definition of loyalty by Oliver [1999], and support the results of the empirical research by Luarn and Lin [2003] and Singh [1988]. This study found that online shoppers who were satisfied with consumer electronics e-tailers were likely to have favorable behavioral intentions toward the sites, such as recommending the consumer electronics e-tailers they shopped to someone and considering the e-tailer to be their first choice for future transactions. On the contrary, online shoppers who were not satisfied with consumer electronics e-tailers were likely to have unfavorable behavioral intentions toward the sites, and to switch to competitors if they experienced a problem with an e-tailer, or to complain to other customers.
In the American Customer Satisfaction Index (ACSI) model, customer satisfaction has three antecedents that have a direct, positive effect on satisfaction: perceived value, perceived service quality, and customer expectations [American Society for Quality, 2001]. However, this study found that only one antecedent (perceived value) has a direct positive effect on customer satisfaction. Customer expectations were found to have no effect on satisfaction; moreover, electronic service quality was found to have a weak direct negative effect on satisfaction.

Wu and Ding
Volume 2, Number 2, December 2007
215
These findings marginally support the findings of the American Society for Quality [2001]. A possible explanation may be that online shoppers are willing to endure low electronic service quality in exchange for the low price of consumer electronics products. Low electronic service quality may result in low levels of satisfaction, but low prices may bring customers back to the e-tailers. Online shopping does have the advantage of price competition. Most consumer electronics e-tailers ship an order for free when the order reaches a certain price. If the e-tailer does not have a store in the state where the customer lives, the customer can enjoy the benefit of no sales tax. Online shoppers may not care about electronic service quality as much as the price when their online shopping motivation is saving money. A Consumer Reports reader survey (18,700 respondents) also suggested that online shoppers were satisfied with shopping online for consumer electronics because of price [Wong, 2005].
According to the prior discussion, the hypothesized model was modified (Figure 1) to remove the arrows representing the relationship between customer expectations and customer satisfaction, and to change the relationship between electronic service quality and customer satisfaction from positive to negative.
Figure 1. Modified Model
5.1. Limitations and Future Research
There are some limitations in this study. First, the quota and snowball sampling methods are non-random, and may introduce sampling bias, thus threatening external validity. The results obtained by these sampling methods
+
+
-
+
+
-
+
Customer
Loyalty
Customer
Satisfaction
Electronic
Service
Quality
Perceived
Value
Customer
Complaints
Customer
Expectation
s

Validating the American Customer Satisfaction
Index Model in the Online Context
International Journal of Business and Information
216
were difficult to generalize to the population because they were a type of non-probability sampling, and the socio-demographic characteristics of data-producing samples partially matched those of quota samples. Second, this was primarily a cross-sectional study because of the constraints of cost and time, although a longitudinal approach is very important for a study of consumer behavior. Third, the findings of this study cannot be generalized to other categories of e-tailers, such as those selling apparel, because of differences in the nature of each industry. Fourth, the participants in this study may be active online survey respondents, and may have completed a similar survey prior to participating in this study. This study was limited to examining the causal relationships among customer expectation, electronic service quality, perceived value, customer satisfaction, customer loyalty, and customer complaint. In any future study, other significant variables, such as store image and profitability of consumer electronics e-tailers, may be added into the hypothesized causal structural model. Also, future studies may use a different sampling method to collect data; e.g., randomly selecting respondents from a list of customers of a specific e-tailer. 5.2. Practical Implications
The major motivators of customer purchases of consumer electronics on the Internet may be price and saving money. To increase sales, therefore, consumer electronics e-tailers could reduce costs and offer better prices. By improving their website design and check-out system, they would increase customer satisfaction and joy in self-service. Furthermore, consumer electronics e-tailers could improve website security to protect customers' privacy because this is a fundamental requirement for e-commerce. Customer satisfaction has a direct effect on customers' behavioral intentions. Managers of consumer electronics e-tailers could develop a training program for customer service representatives to make a concerted effort to increase customer loyalty and reduce customer complaints. Moreover, these managers could formulate a competitive strategy based on our modified model to keep current customers and to enhance customer relationship management. REFERENCES
American Society for Quality. 2001. American Customer Satisfaction Index:
Methodology Report. Milwaukee, WI: Author.
Anderson, E.W., and Sullivan, M.W. 1993. The antecedents and consequences of
customer satisfaction for firms, Marketing Science 12(2), 125-143.
Bearden, W.O., and Teel, J.E. 1983. Selected determinants of consumer satisfaction and
complaint reports, Journal of Marketing Research 20(1), 21-28.
Bennington, L., and Cummane, J. 1998. Measuring service quality: A hybrid
methodology, Total Quality Management 9(6), 395-405.
Berry, L L., and Parasuraman, A. 1992. Prescriptions for a service quality revolution in
America, Organizational Dynamics 20(4), pp. 5-15.

Wu and Ding
Volume 2, Number 2, December 2007
217
Bitner, M.J.; Brown, S.W.; and Meuter, M.L. 2000. Technology infusion in service
encounters, Journal of the Academy of Marketing Science 28(1), 138-149.
Bloemer, J., and Kasper, H. 1995. The complex relationship between consumer
satisfaction and brand loyalty, Journal of Economic Psychology 16(1), 311-329.
Bloemer, J., and Ruyter, K.D. 1998. On the relationship between store image, store
satisfaction and store loyalty, European Journal of Marketing 32(5/6), 499-513.
Bonde, A., and Cahill, D.B. 2005. Facilitating the move to Web self-service and
optimized customer interactions. Retrieved December 18, 2005, from
http://www.dmreview.com/article_sub.cfm?articleId=1032865
Bolton R.N., and Lemon K.N. 1999. A dynamic model of customers' usage of services:
Usage as an antecedent and consequence of satisfaction, Journal of Marketing
Research 36(2), 171-186.
Boulding, W.; Kalra, A.; Staelin, R.; and Zeithaml, V.A. 1993) A dynamic process model
of service quality: From expectations to behavioral intentions, Journal of Marketing
Research 30(1), 7-27.
Byrne, B.M. 2001. Structural equation modeling with AMOS: Basic concepts,
applications, and programming, Mahwah, NJ: Lawrence Erlbaum Associates, Inc.
Churchill, G.A., Jr., and Surprenant, C. 1982. An investigation into the determinants of
customer satisfaction, Journal of Marketing Research 19(4), 491-504.
Cöner, A., and Güngör, M.O. 2002. Factors affecting customer loyalty in the competitive
Turkish metropolitan retail markets, Journal of American Academy of Business
2(1), 189-195.
Cox, B. 2002. Customer service still a struggle. Retrieved January 20, 2005, from
http://dc.internet.com/news/print.php/947951
Cronin, J.J., Jr., and Taylor, S.A. 1992. Measuring service quality: A re-examination and
extension, Journal of Marketing 56(3), 55-68.
Cronin, J.J., Jr., and Taylor, S.A. 1994. SERVPERF versus SERVQUAL: Reconciling
performance-based and perceptions-minus-expectations measurement of service
quality, Journal of Marketing 58(1), 125-131.
Dabholkar, P.A.; Shepherd, C.D.; and Thorpe, D.I. 2000) A comprehensive framework
for service quality: An investigation of critical conceptual and measurement issues
through a longitudinal study, Journal of Retailing 76(2), 139-173.
Fornell, C.; Johnson, M.; Anderson, E.W.; Cha, J.; and Bryant, B.E. 1996. The American
Customer Satisfaction Index: Nature, purpose, and findings, Journal of Marketing
60(4), 7-18.
Fredericks, J.O., and Salter, J.M., II. 1998. What does your customer really want? Quality
Progress 31(1), 63-65.
Girard, T.; Korgaonkar, P.; and Silverblatt, R. 2003. Relationship of type of product,
shopping orientations, and demographics with preference for shopping on the
Internet, Journal of Business and Psychology 18(1), 101-120.
Grossnickle, J., and Raskin, O. 2001. The Handbook of Online Marketing Research, New
York, NY: The McGraw-Hill Companies, Inc.
Hair, J.F., Jr.; Anderson, R.E.; Tatham, R.L.; and Black, W.C. 1998. Multivariate Data
Analysis (5th ed.), Boston, MA: Pearson Education Inc.

Validating the American Customer Satisfaction
Index Model in the Online Context
International Journal of Business and Information
218
Hart, C.W.L.; Heskett, J.L.; and Sasser, W.E., Jr. 1990. The profitable art of service
recovery, Harvard Business Review 68(4), 148-156.
Holloway, B.B., and Beatty, S.E. 2003. Service failure in online retailing: A recovery
opportunity, Journal of Service Research 6(1), 92-105.
Howard, M., and Worboys, C. 2003. Self-service – A contradiction in terms or
customer-led choice? Journal of Consumer Behavior 2(4), 382-392.
Johnson, M. D.; Gustafsson, A.; Andreassen, T.W.; Lervik, L.; and Cha, J. 2000. The
evolution and future of National Customer Satisfaction Index models. Retrieved
June 11, 2005, from http://www.kundebarometer.com/discourse/ paper2.pdf
Karlsson, T.; Kuttainen, C.; Pitt, L.; and Spyropoulou, S. 2005. Price as a variable in
online consumer trade-offs [Abstract], Marketing Intelligence and Planning 23(4/5),
350-358.
Kerner, S.M. 2004. More broadband usage means more online spending. Retrieved June
10, 2005, from http://www.clickz.com/stats/sectors/broadband/ article.php/3419281
Luarn, P., and Lin, H.-H. 2003) A customer loyalty model for e-service context, Journal
of Electronic Commerce Research 4(4), 156-167.
Millard, E. 2005. Online retail sales to surge in 2005. Retrieved December 26, 2005, from
http://www.cio-today.com/news/Online-Retail-Sales-To-Surge-in-
2005/story.xhtml?story_id=1000034INSV8
Miller, P. 2001. Tuning in to electronics: Catalogers pursue consumer electronics
industry, Catalog Age 18(8), 46-48. Retrieved March 16, 2004, from
http://www.findarticles.com/p/articles/mi_m3816/is_8_18/ai_76629652
Miller, J.L.; Craighead, C.W.; and Karwan, K. R. 2000. Service recovery: A framework
and empirical investigation, Journal of Operations Management 18(4), 387-400.
Minocha, S.; Dawson, L.H.; Blandford, A.; and Millard, N. 2005. Providing value to
customer in e-commerce environments: The customer's perspective. Retrieved
December 12, 2005, from http://www.uclic.ucl.ac.uk/annb/docs/
smldabnmChappreprint.pdf
Nunnally, J.C., and Bernstein, I.H. 1994. Psychometric Theory (3rd ed.), New York, NY:
McGraw-Hill, Inc.
Oliver, R.L. 1980. A cognitive model of the antecedents and consequences of satisfaction
decisions, Journal of Marketing Research 17(4), 460-469.
Oliver, R.L. 1981. Measurement and evaluation of satisfaction processes in retail settings,
Journal of Retailing 57(3), 25-48.
Oliver, R.L. 1993. Cognitive, affective, and attribute bases of the satisfaction response,
Journal of Consumer Research 20(3), 418-430.
Oliver, R.L. 1997. Satisfaction: A Behavioral Perspective on the Consumer, New York,
NY: McGraw-Hill, Inc.
Oliver, R.L. 1999. Whence consumer loyalty? Journal of Marketing 63, 33-44.
Oliver, R.L., and DeSarbo, W.S. 1988. Response determinants in satisfaction judgments,
Journal of Consumer Research 14(4), 495-507.
Oliver, R.L., and Swan, J.E. 1989a. Consumer perceptions of interpersonal equity and
satisfaction in transactions: A field survey approach, Journal of Marketing 53(2),
21-35.

Wu and Ding
Volume 2, Number 2, December 2007
219
Oliver, R.L., and Swan, J.E. 1989b. Equity and disconfirmation perceptions as influences
on merchant and product satisfaction, Journal of Consumer Research 16(3),
372-383.
Parasuraman, A.; Zeithaml, V.A.; and Berry, L.L. 1988. SERVQUAL: A multiple-item
scale for measuring consumer perceptions of service quality, Journal of Retailing
64(1), 12-40.
Parasuraman, A.; Zeithaml, V.A.; and Malhotra, A. 2005. E-S-QUAL: A multiple-item
scale for assessing electronic service quality, Journal of Service Research 7(10),
1-21.
Prakash, V., and Lounsbury, J. W. 1984. The role of expectations in the determination of
consumer satisfaction, Journal of Academy of Marketing Science 12(3), 1-17.
Raju, J. S.; Srinivasan, V.; and Lal, R. 1990. The effects of brand loyalty on competitive
price promotional strategies, Management Science 36(3), 276-304.
Reichheld, F.F., and Sasser, W.E., Jr. 1990. Zero defections: Quality comes to services,
Harvard Business Review 68(5), 105-111.
Reidenbach, R.E., and Sandifer-Smallwood, B. 1990. Exploring perceptions of hospital
operations by a modified SERVQUAL approach, Journal of Health Care Marketing
10(4), 47-55.
Robbins, T.L., and Miller, J.L. 2004. Considering customer loyalty in developing service
recovery strategies, Journal of Business Strategies 21(2), 95-109.
Romano, P.S. 2004. Choosing study subjects and recruitment. Retrieved May 9, 2005,
from:http://som.ucdavis.edu/students/k30/folder.2004-06-21.4913658468/
3ChoosingStudySubj.ppt
Sexton, R.S.; Johnson, R.A.; and Hignite, M.A. 2002. Predicting Internet/e-commerce
use, Internet Research 12(5), 402-410.
Singh, J. 1988. Consumer complaint intentions and behavior: Definitional and
taxonomical issues, Journal of Marketing 52(1), 93-107.
Smith, A.K., and Bolton, R.N. 2002. The effect of customers' emotional responses to
service failure on their recovery effort evaluations and satisfaction judgments,
Journal of the Academy of Marketing Science 30(1), 5-23.
Spreng, R.A., and Mackoy, R.D. 1996. An empirical examination of a model of
perceived service quality and satisfaction, Journal of Retailing,72(2), 201-214.
StatPat Inc. 2005. Sampling methods. Retrieved December 14, 2005, from
http://www.statpac.com/surveys/sampling.htm
Supphellen, M., and Nysveen, H. 2001. Drivers of intention to revisit the websites of
well-known companies: The role of corporate brand loyalty, International Journal
of Market Research 43(3), 341-352.
Swan, J.E., and Trawick, I.F. 1981. Disconfirmation of expectations and satisfaction with
a retail service, Journal of Retailing 57(3), 49-67.
Swanson, S.R., and Kelley, S.W. 2001. Attributions and outcomes of the service recovery
process, Journal of Marketing Theory and Practice 9(4), 50-65.
Szymanski, D.M., and Henard, D.H. 2001. Customer satisfaction: A meta-analysis of the
empirical evidence, Journal of Academy of Marketing Science 29(1), 16-35.
Tax, S.S., and Brown, S.W. 1998. Recovering and learning from service failure, Sloan
Management Review 40(1), 75-88.

Validating the American Customer Satisfaction
Index Model in the Online Context
International Journal of Business and Information
220
Taylor, S.A. 1997. Assessing regression-based importance weights for quality
perceptions and satisfaction judgments in the presence of higher order and/or
interaction effects, Journal of Retailing,73(1), 135-159.
Taylor, S.A., and Baker, T.L. 1994. An assessment of the relationship between service
quality and customer satisfaction in the formation of customers' purchase intentions,
Journal of Retailing 70(2), 163-178.
Teeter, C., and Schointuch, B. 2000. Controlling Internet service quality, Credit Union
Executive Journal 40(6), 6-11.
Tse, D.K., and Wilton, P.C. 1988. Models of consumer satisfaction formation: An
extension, Journal of Marketing Research 25(2), 204-212.
Turow J.; Feldman L.; and Meltzer K. 2005. Open to exploitation: American shoppers
online and offline. Retrieved June 11, 2005, from http://www.
annenbergpublicpolicycenter.org/04_info_society/Turow_APPC_Report_WEB_FI
NAL.pdf
Wong, M. 2005. Consumer Reports: Shopping online smarter. Retrieved December 19,
2005, from http://abcnews.go.com/Technology/wireStory?id= 1279735andpage=1
Woodside, A.G.; Frey, L.L.; and Daly, R.T. 1989. Linking service quality, customer
satisfaction, and behavioral intention, Journal of Health Care Marketing 9(4), 5-17.
Yang, Z. 2001. Measuring e-service quality and its linkage to customer loyalty,
Dissertation Abstracts International. (UMI No. 3034679).
Zeithaml, V.A.; Berry, L L.; and Parasuraman, A. 1993. The nature and determinants of
customer expectations of service, Journal of Academy of Marketing Science 21(1),
1-12.
Zeithaml, V.A.; Berry, L.L.; and Parasuraman, A. 1996. The behavioral consequences of
service quality, Journal of Marketing 60(2), 31-46.
Zeithaml, V.A., and Bitner, M.J. 2003. Services Marketing (3rd ed.), New York, NY: The
McGraw-Hill Companies, Inc.
Zeithaml, V.A.; Parasuraman, A.; and Malhotra, A. 2000. A conceptual framework for
understanding e-service quality: implications for future research and managerial
practice. Working Paper No. 00-115. Cambridge, MA: Marketing Science Institute.
Zeithaml, V.A.; Parasuraman, A.; and Malhotra, A. 2002. Service quality delivery
through websites: A critical review of extant knowledge, Journal of Academy of
Marketing Science 30(4), 362-375.
ABOUT THE AUTHORS:
Kuang-Wen Wu is an assistant professor of the Feng Chia University in Taiwan.
He earned his Ph.D. in global leadership from Lynn University at Boca Raton, Florida,
USA. His research area is in Internet marketing and service marketing.
May-Ching Ding is an assistant professor of the Yu Da College of Business in
Taiwan. DShe obtained her Ph.D. in global leadership from Lynn University at Boca
Raton, Florida, USA. Her research area is in e-commerce and financial management.