Multimedia- Microsoft PowerPoint ADE100- Computer Literacy Lecture 21.
Upload
madlyn-tamsyn-millerCategory
view
227download
3
Calculations & Graphics using Spreadsheet
ADE100- Computer LiteracyLecture 17
2
Knowledge test
•What is cell alignment?•What is the purpose of Fill handle?•Why comments are inserted in the excel sheet?•Why hyperlinks are used?
3
Topics covered
•Doing mathematics • Formulas, addition, subtraction• Average, logic formula, etc.
•Making charts • formatting i.e. background, • Legend, color of bars, creating pictograph
4
Formulas
• Formula• Expression that produces some values• Use values, cell references and built-in
functions• Must begin with an equal sign (=)• When the formula is entered in the cell the
calculation executes immediately• Cells display result and formula bar shows
formula
5
Entering formulas
• Entering a formula• Click on the empty cell that will display the
result of the formula • Type the equal sign (=)• Type your formula without any spaces like
a1+a2+a3 and press Enter key• If you change any value of a cell
referenced in a formula, the formula will automatically recalculate and display the new value.

6
Addition
• Addition • Move the cursor to cell A1 and type a value
of 10• Press Enter• Type a value like 20 in cell A2• Enter formula in cell A3; =A1+A2 and
press Enter• The result of calculation will display in the
cell and formula in the formula bar
7
Subtraction
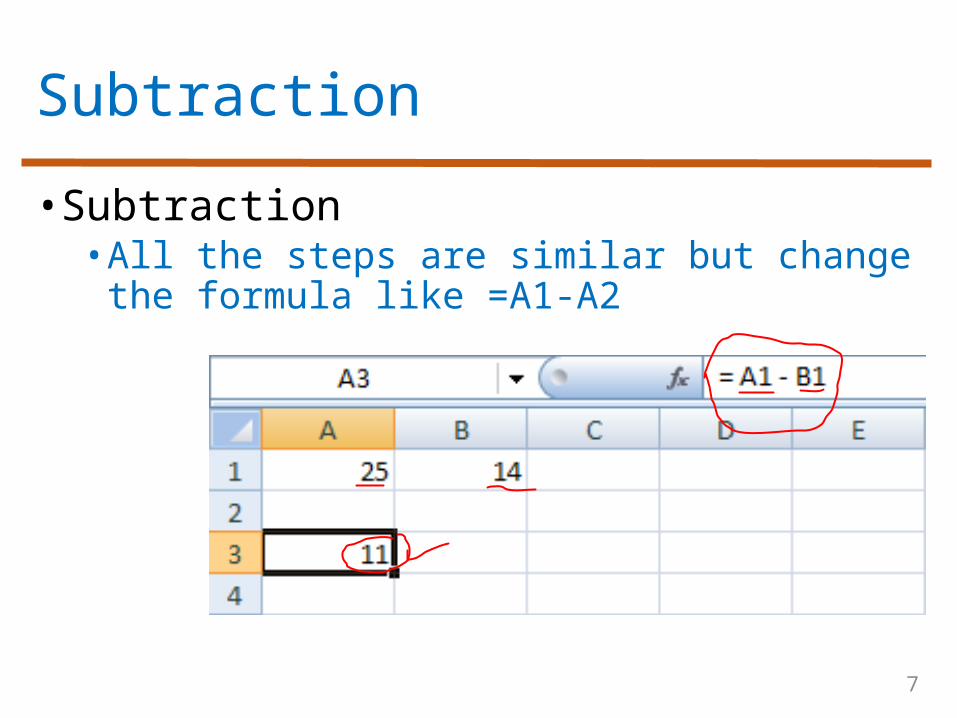
• Subtraction• All the steps are similar but change the
formula like =A1-A2
8
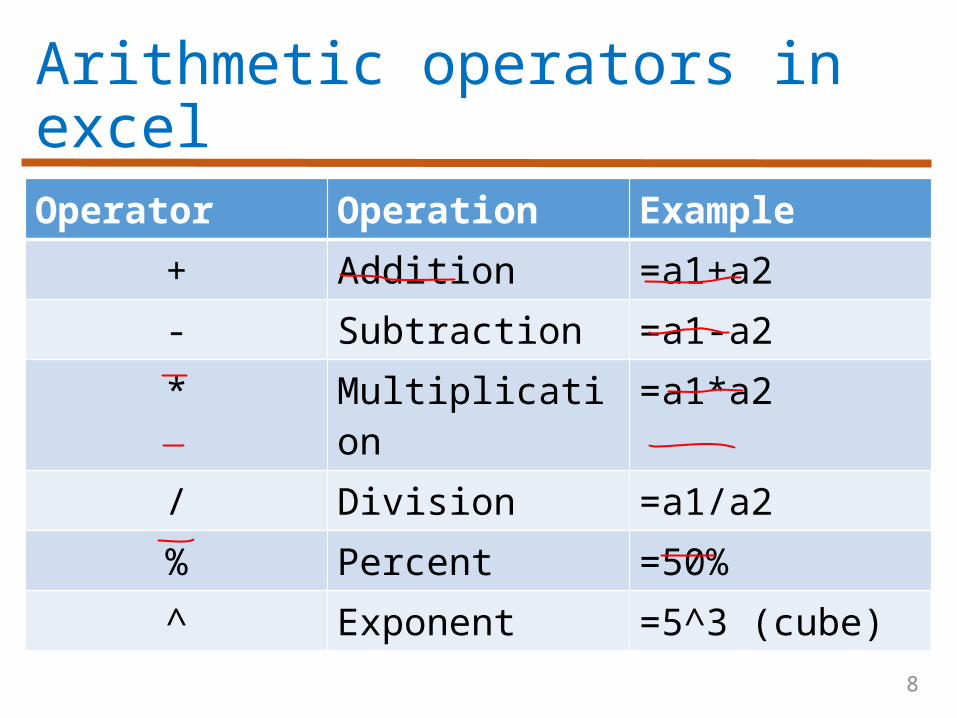
Arithmetic operators in excel
Operator Operation Example + Addition =a1+a2- Subtraction =a1-a2* Multiplication =a1*a2/ Division =a1/a2% Percent =50%^ Exponent =5^3 (cube)
9
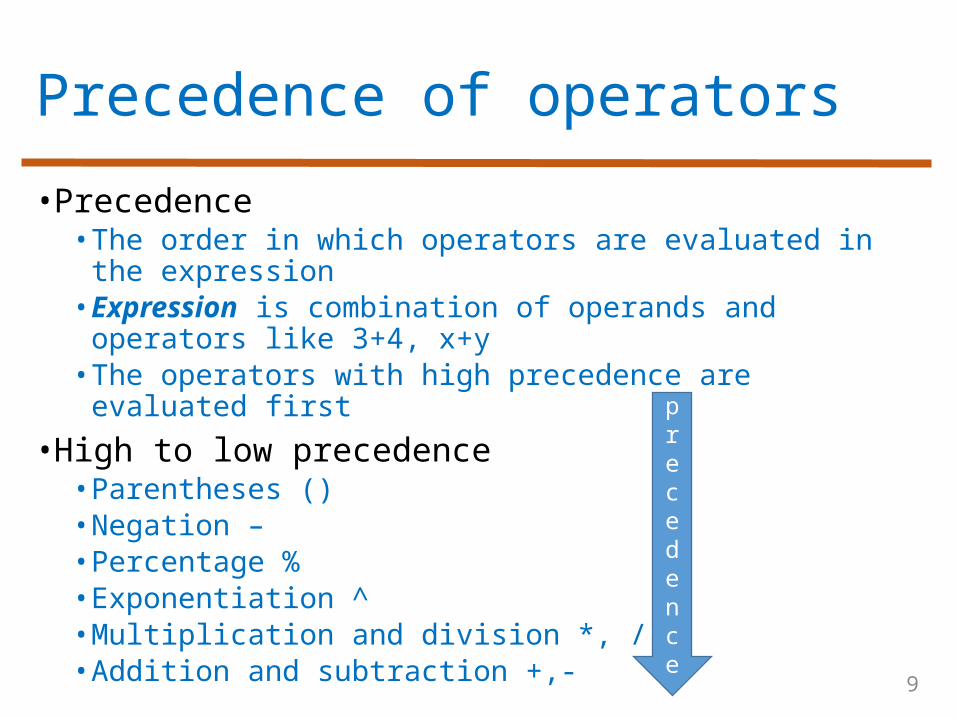
Precedence of operators
• Precedence• The order in which operators are evaluated in the
expression• Expression is combination of operands and operators
like 3+4, x+y• The operators with high precedence are evaluated
first
• High to low precedence• Parentheses ()• Negation –• Percentage %• Exponentiation ^• Multiplication and division *, /• Addition and subtraction +,-
precedence
10
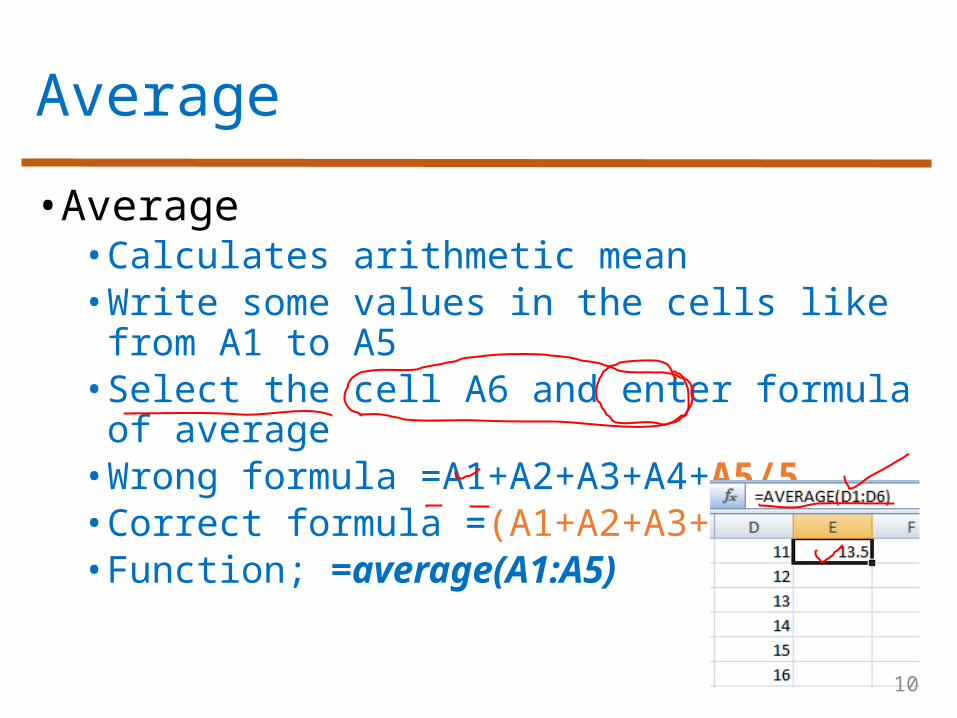
Average
• Average• Calculates arithmetic mean• Write some values in the cells like from A1
to A5• Select the cell A6 and enter formula of
average• Wrong formula =A1+A2+A3+A4+A5/5• Correct formula =(A1+A2+A3+A4+A5)/5• Function; =average(A1:A5)
11
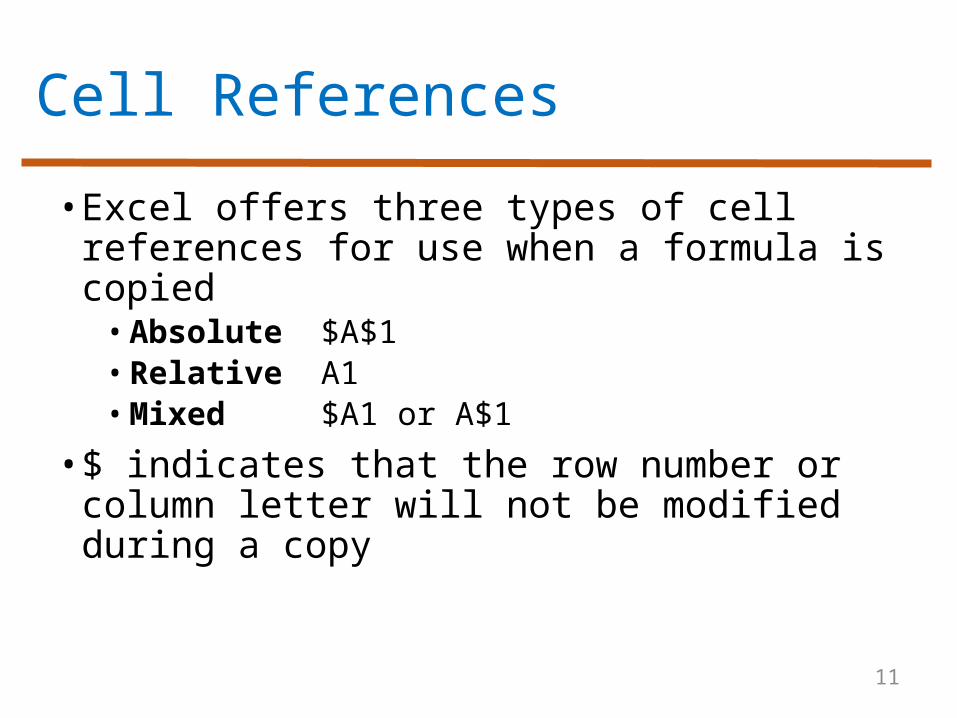
Cell References
• Excel offers three types of cell references for use when a formula is copied• Absolute $A$1• Relative A1• Mixed $A1 or A$1
• $ indicates that the row number or column letter will not be modified during a copy
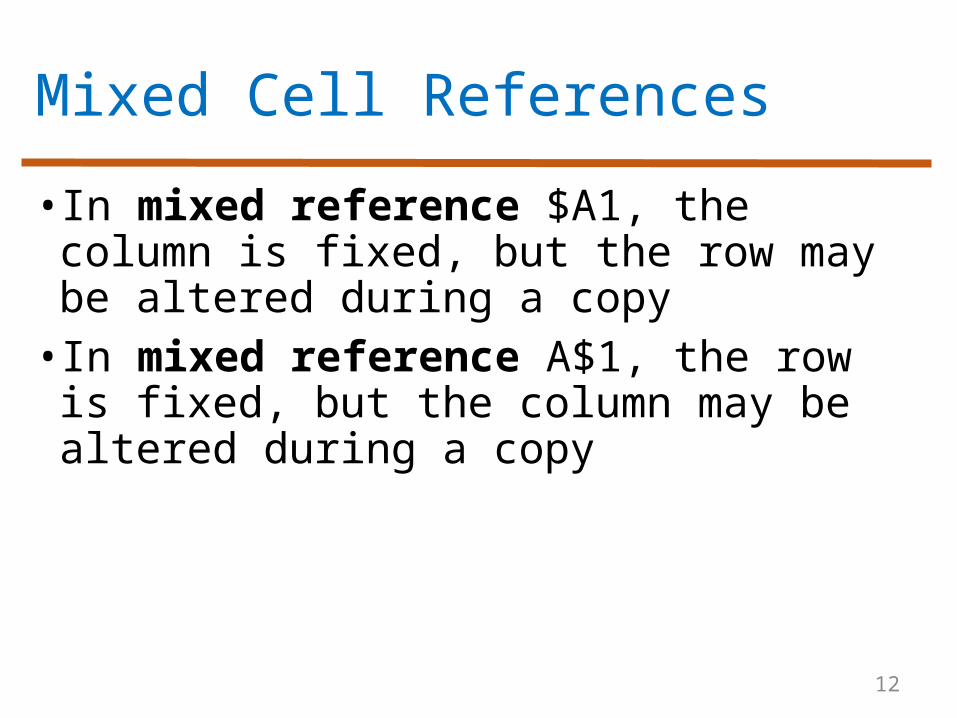
Mixed Cell References
• In mixed reference $A1, the column is fixed, but the row may be altered during a copy• In mixed reference A$1, the row is fixed, but the column may be altered during a copy
12
Functions
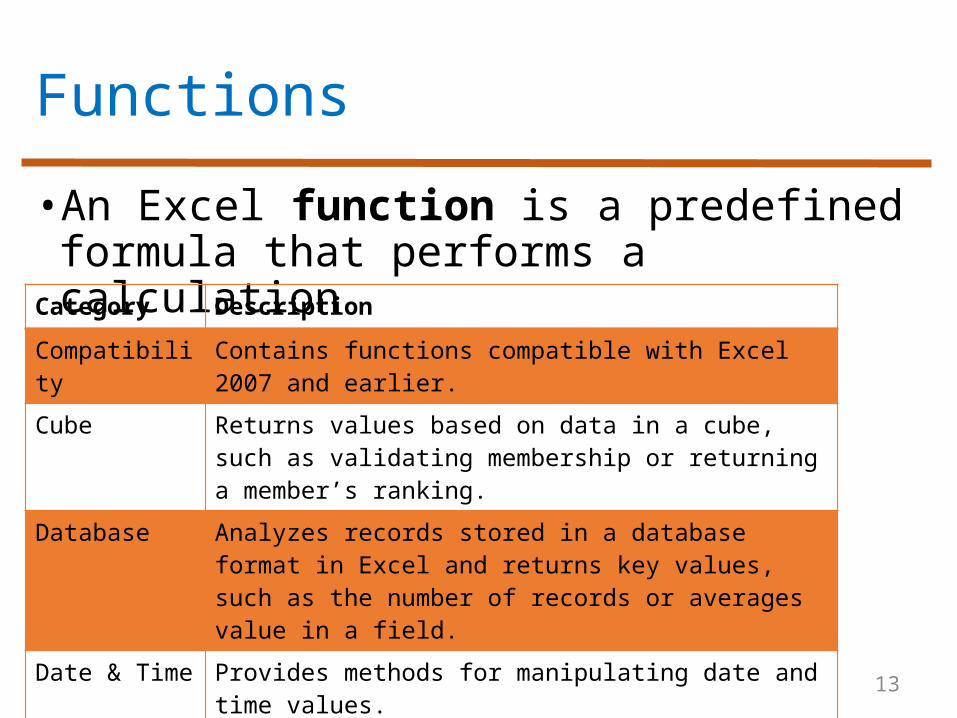
• An Excel function is a predefined formula that performs a calculation
13
Category Description
Compatibility Contains functions compatible with Excel 2007 and earlier.
Cube Returns values based on data in a cube, such as validating membership or returning a member’s ranking.
Database Analyzes records stored in a database format in Excel and returns key values, such as the number of records or averages value in a field.
Date & Time Provides methods for manipulating date and time values.
14
Category Description
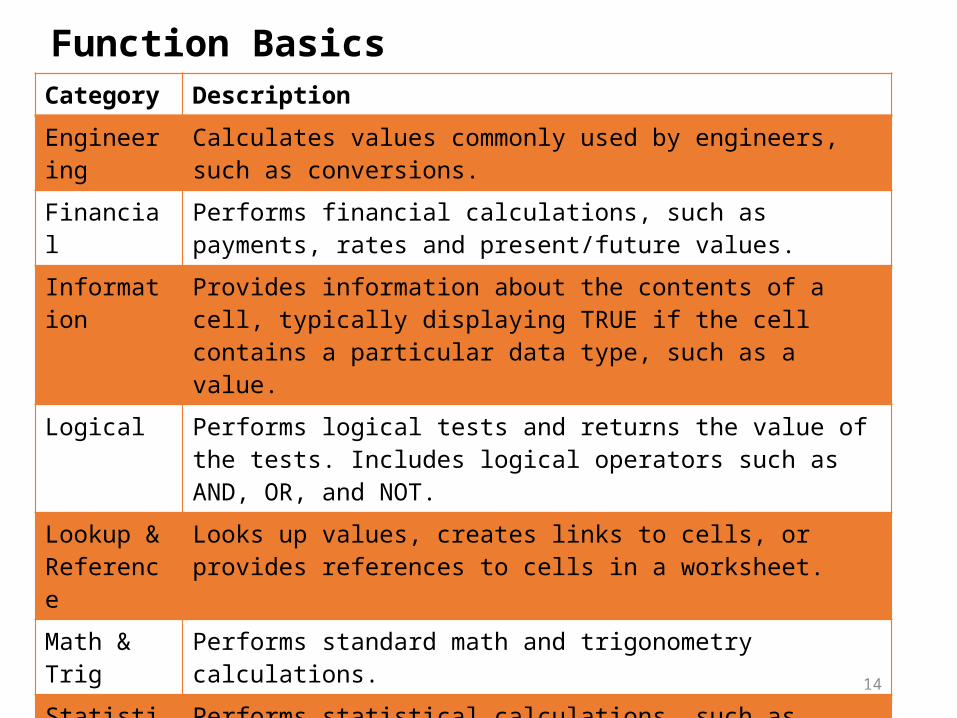
Engineering
Calculates values commonly used by engineers, such as conversions.
Financial Performs financial calculations, such as payments, rates and present/future values.
Information
Provides information about the contents of a cell, typically displaying TRUE if the cell contains a particular data type, such as a value.
Logical Performs logical tests and returns the value of the tests. Includes logical operators such as AND, OR, and NOT.
Lookup & Reference
Looks up values, creates links to cells, or provides references to cells in a worksheet.
Math & Trig
Performs standard math and trigonometry calculations.
Statistical Performs statistical calculations, such as averages or standard deviation.
Text Manipulates text strings, by combining words or converting cases.
Function Basics
Function Terminology
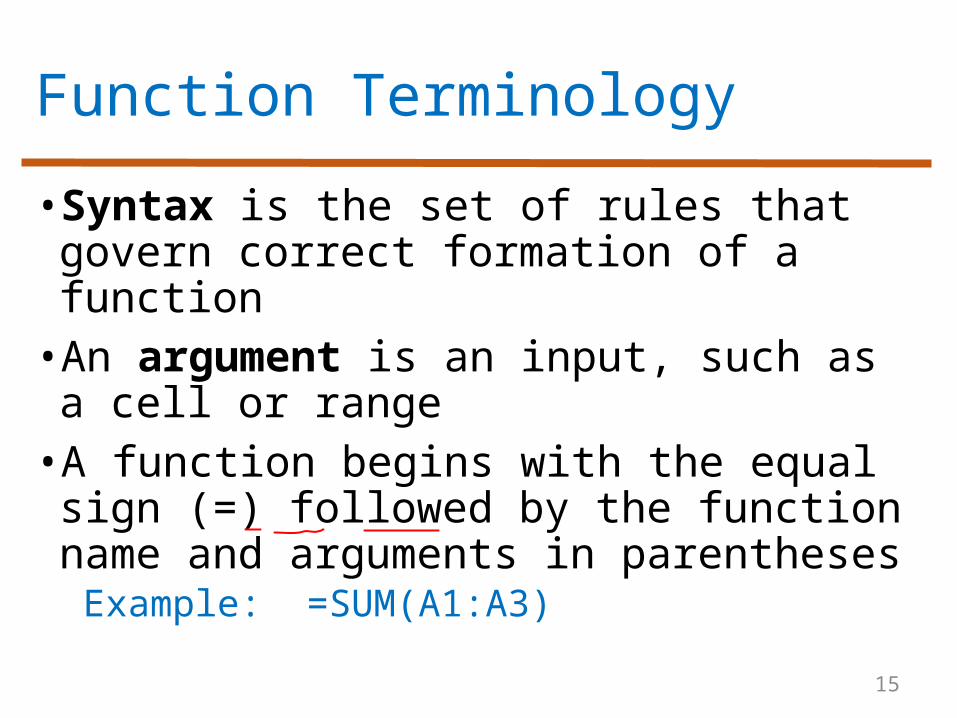
•Syntax is the set of rules that govern correct formation of a function• An argument is an input, such as a cell or range• A function begins with the equal sign (=) followed by the function name and arguments in parentheses
Example: =SUM(A1:A3)
15
Inserting a Function
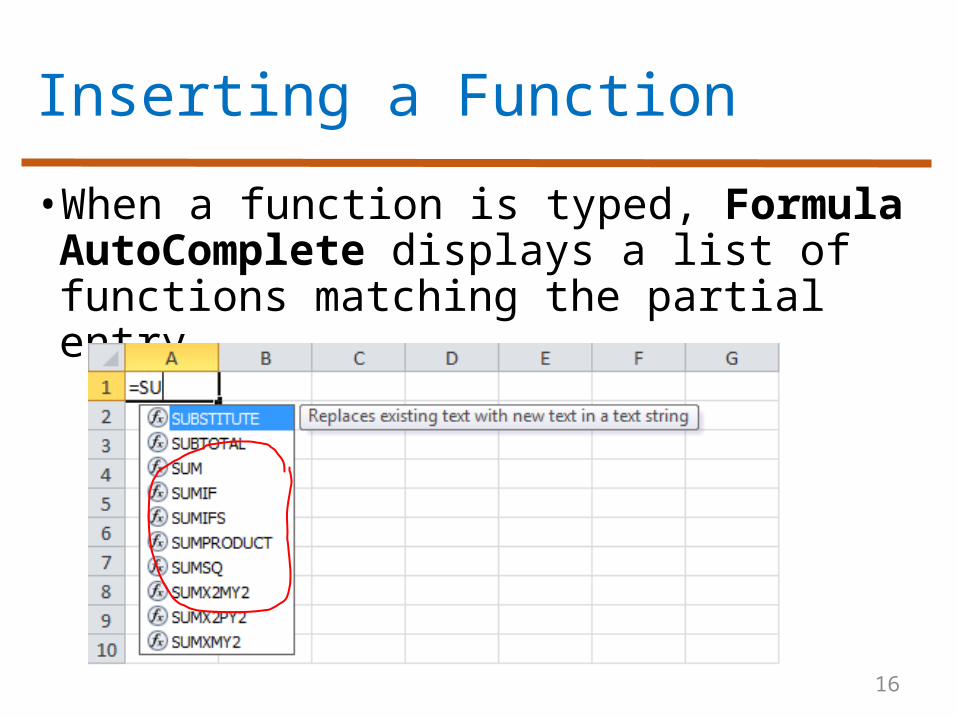
•When a function is typed, Formula AutoComplete displays a list of functions matching the partial entry
16
Inserting a Function
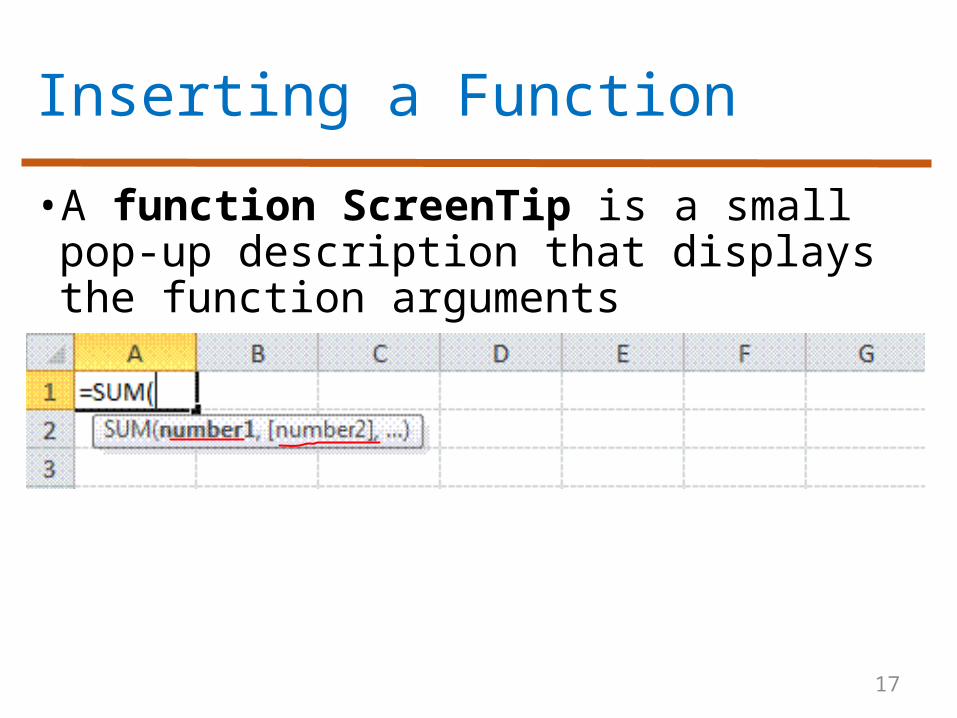
• A function ScreenTip is a small pop-up description that displays the function arguments
17
Insert Function Dialog Box
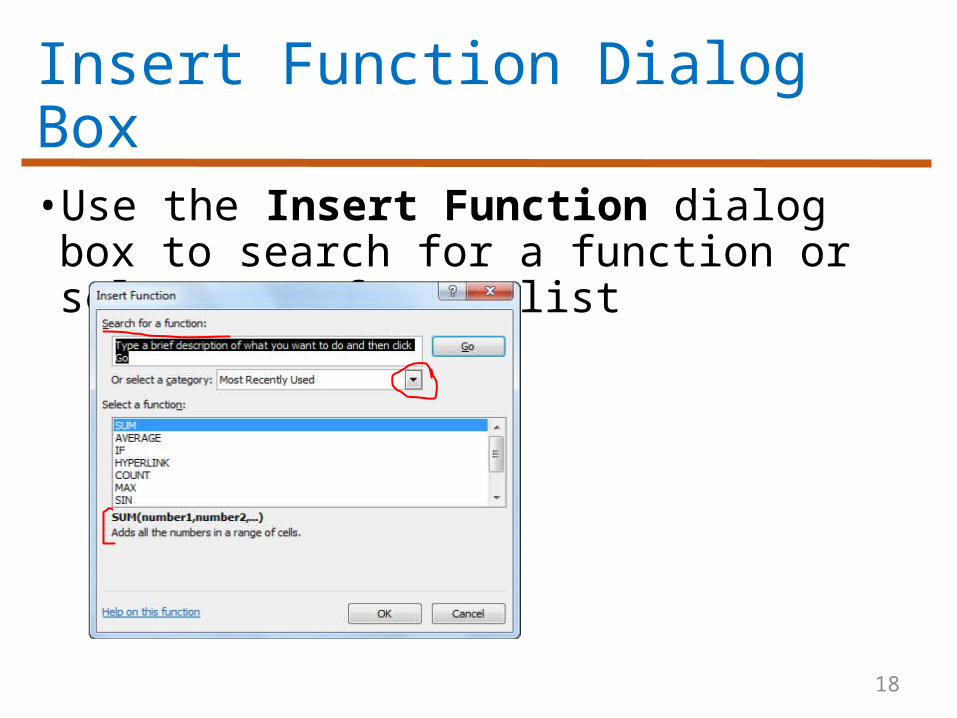
•Use the Insert Function dialog box to search for a function or select one from a list
18
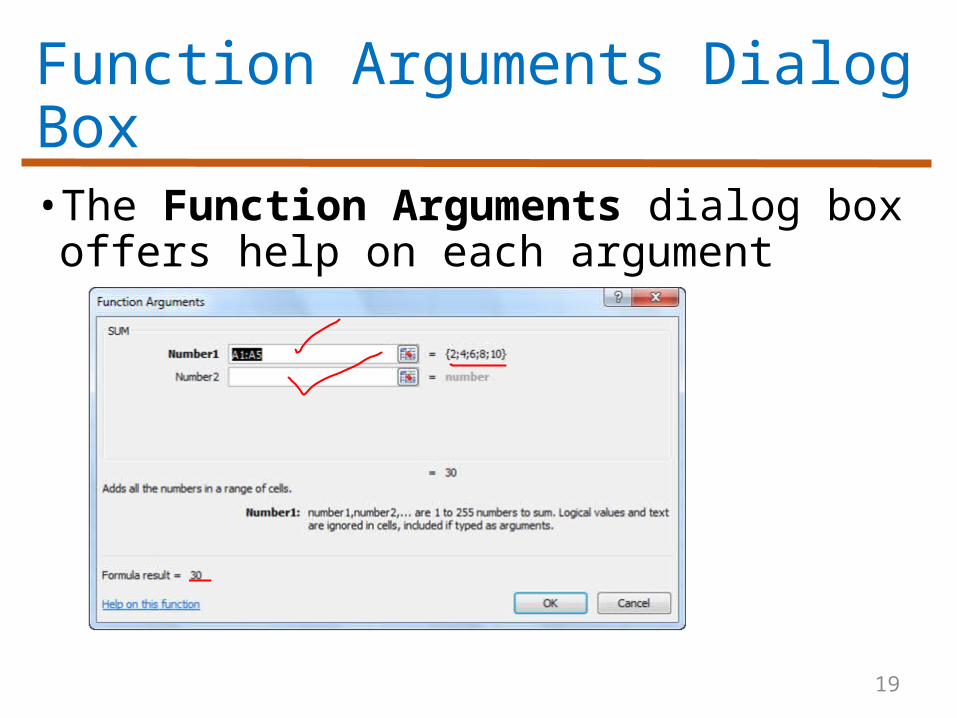
Function Arguments Dialog Box• The Function Arguments dialog box offers help on each argument
19
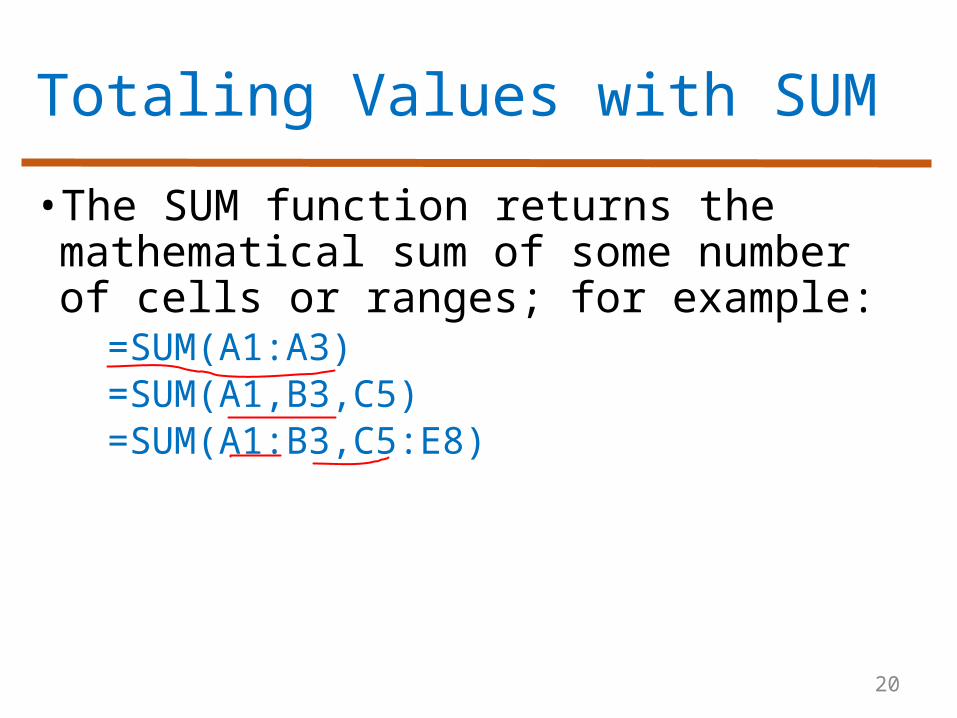
Totaling Values with SUM
• The SUM function returns the mathematical sum of some number of cells or ranges; for example:
=SUM(A1:A3)=SUM(A1,B3,C5)=SUM(A1:B3,C5:E8)
20
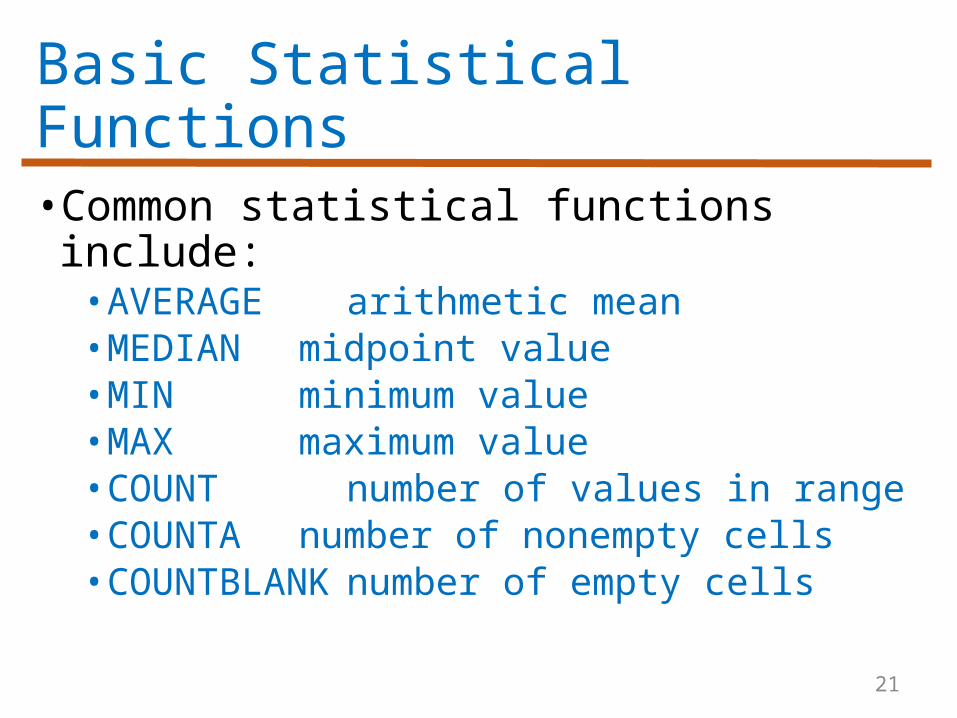
Basic Statistical Functions
• Common statistical functions include:• AVERAGE arithmetic mean• MEDIAN midpoint value• MIN minimum value• MAX maximum value• COUNT number of values in
range• COUNTA number of nonempty cells • COUNTBLANK number of empty cells
21
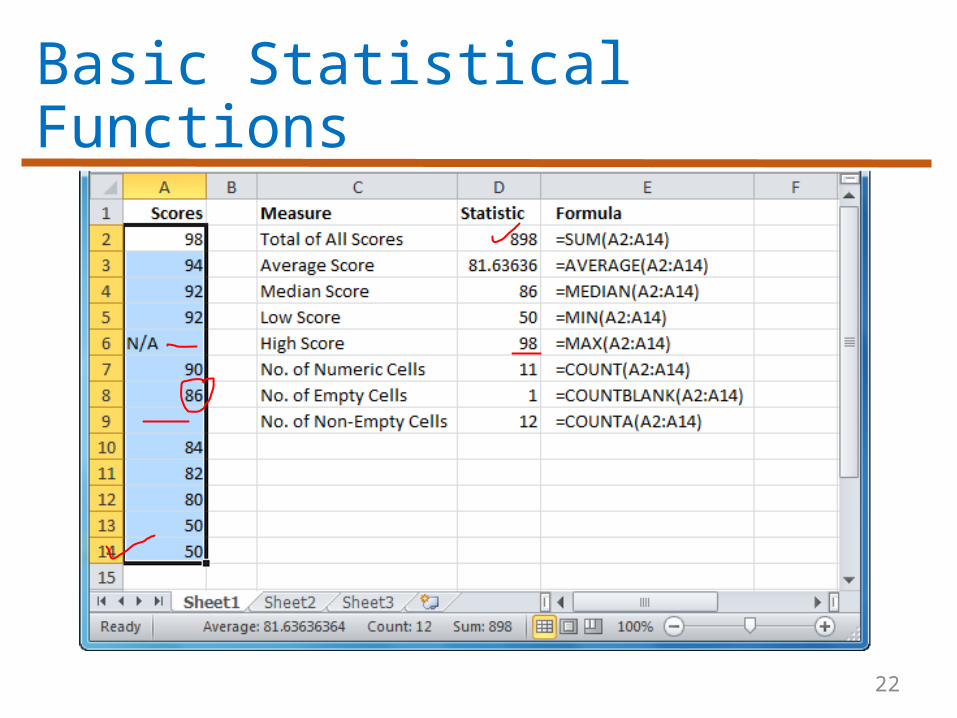
Basic Statistical Functions
22
23
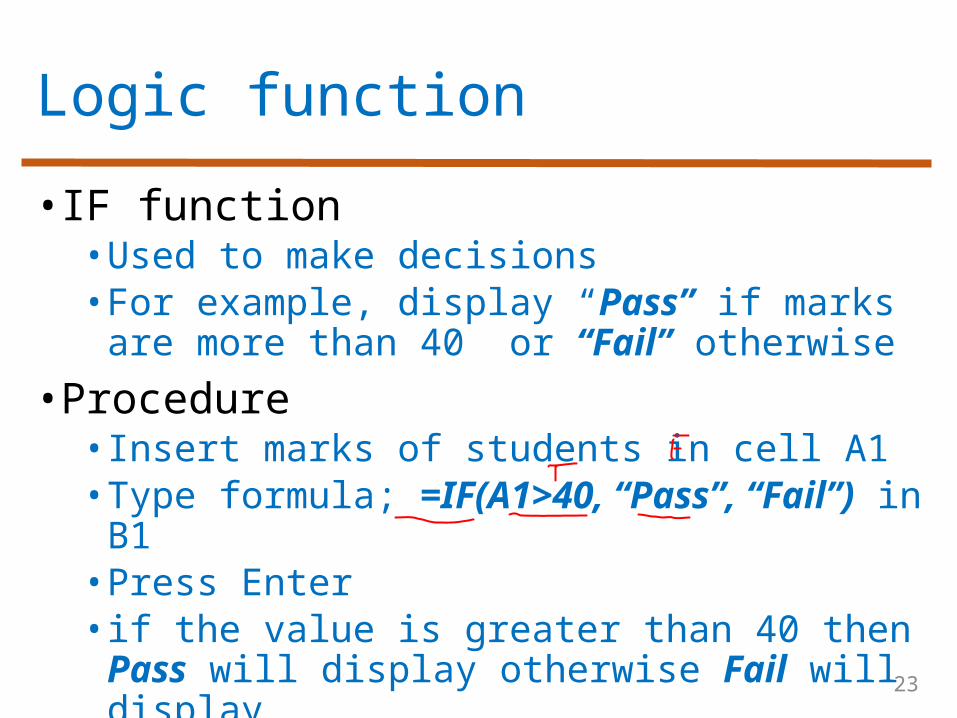
Logic function
• IF function• Used to make decisions• For example, display “Pass” if marks are
more than 40 or “Fail” otherwise
• Procedure• Insert marks of students in cell A1• Type formula; =IF(A1>40, “Pass”, “Fail”) in B1• Press Enter• if the value is greater than 40 then Pass
will display otherwise Fail will display
24
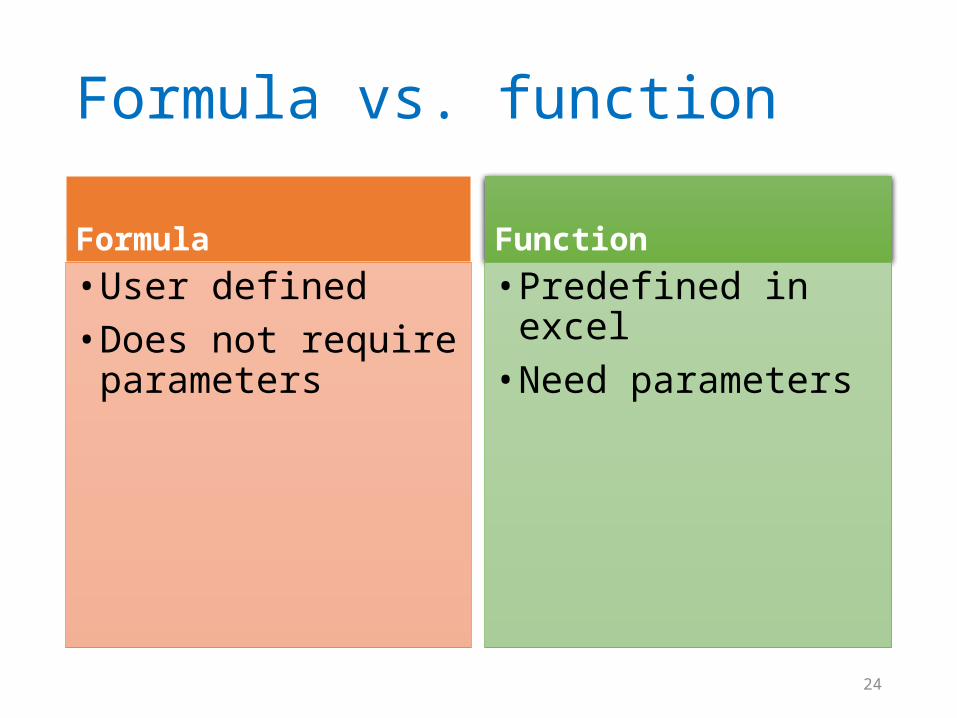
Formula vs. function
Formula
• User defined• Does not require
parameters
Function
• Predefined in excel• Need parameters
25
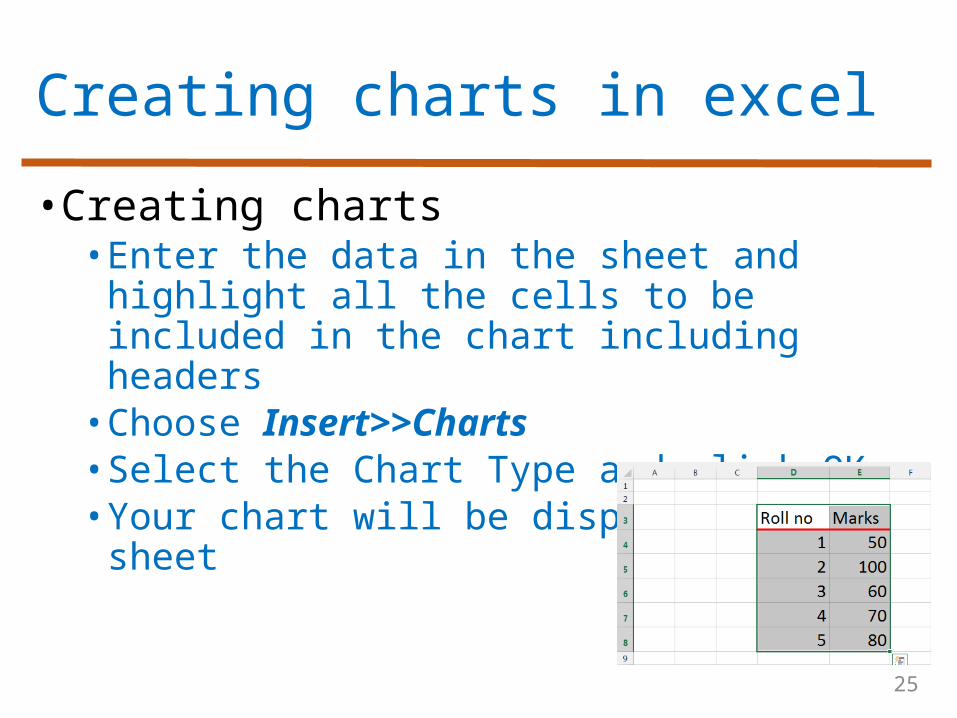
Creating charts in excel
• Creating charts• Enter the data in the sheet and highlight all
the cells to be included in the chart including headers• Choose Insert>>Charts • Select the Chart Type and click OK• Your chart will be displayed on the sheet
26
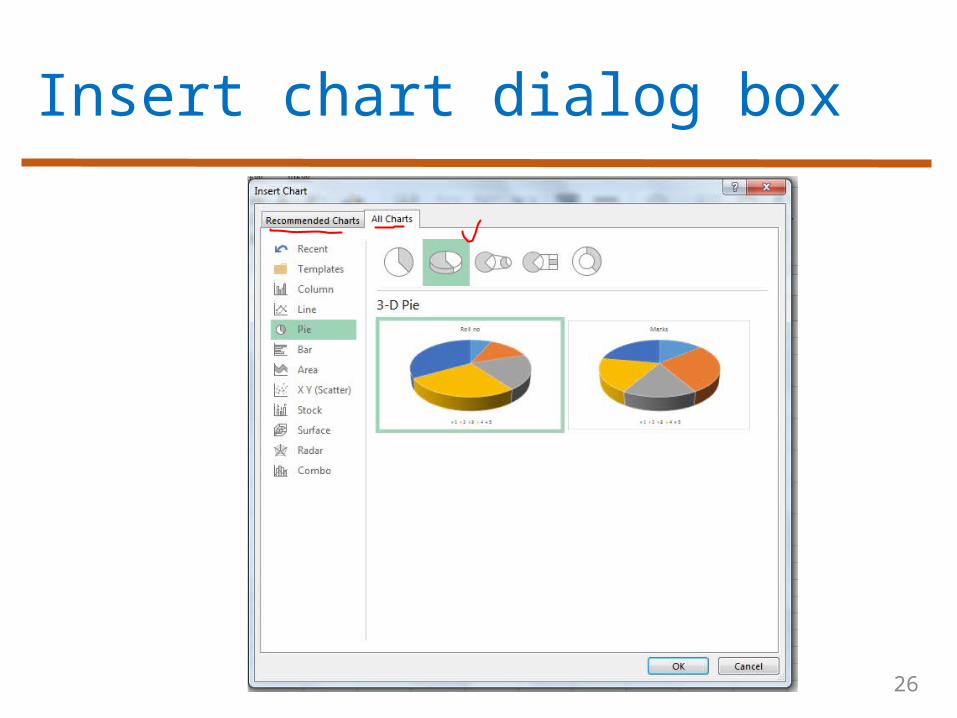
Insert chart dialog box
27
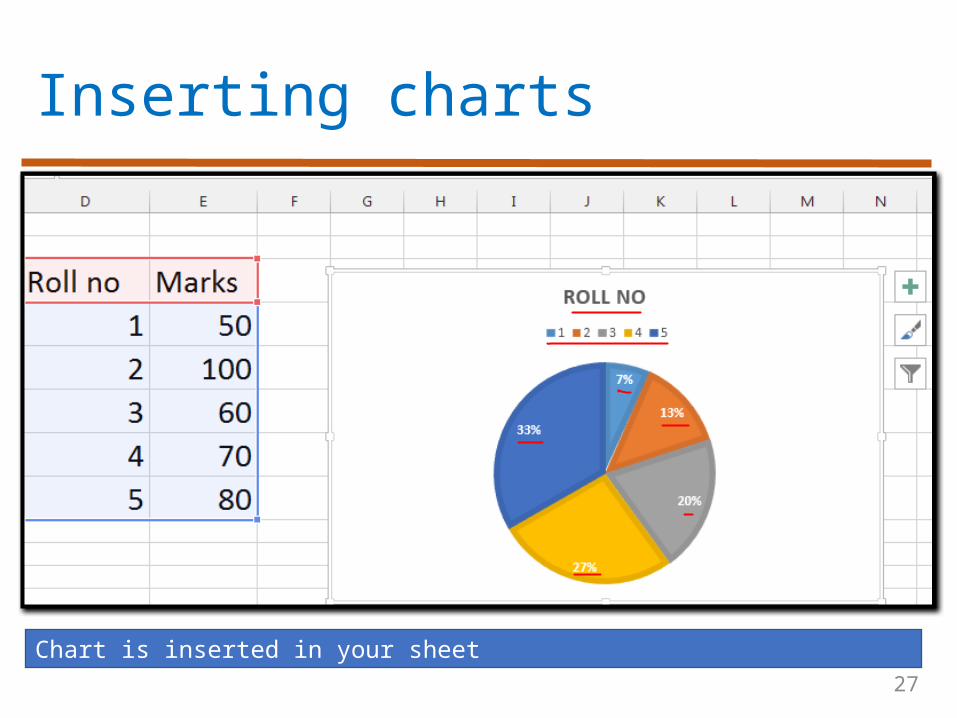
Inserting charts
Chart is inserted in your sheet
28
Formatting charts
•Moving your chart• Select your chart• Click and hold the chart• Drag the chart to the appropriate location• Release the mouse button
• Resizing your chart• Select your chart• Click and hold on one of the handles• Drag the handle in or out to adjust the size
of chart• Release the mouse button
29
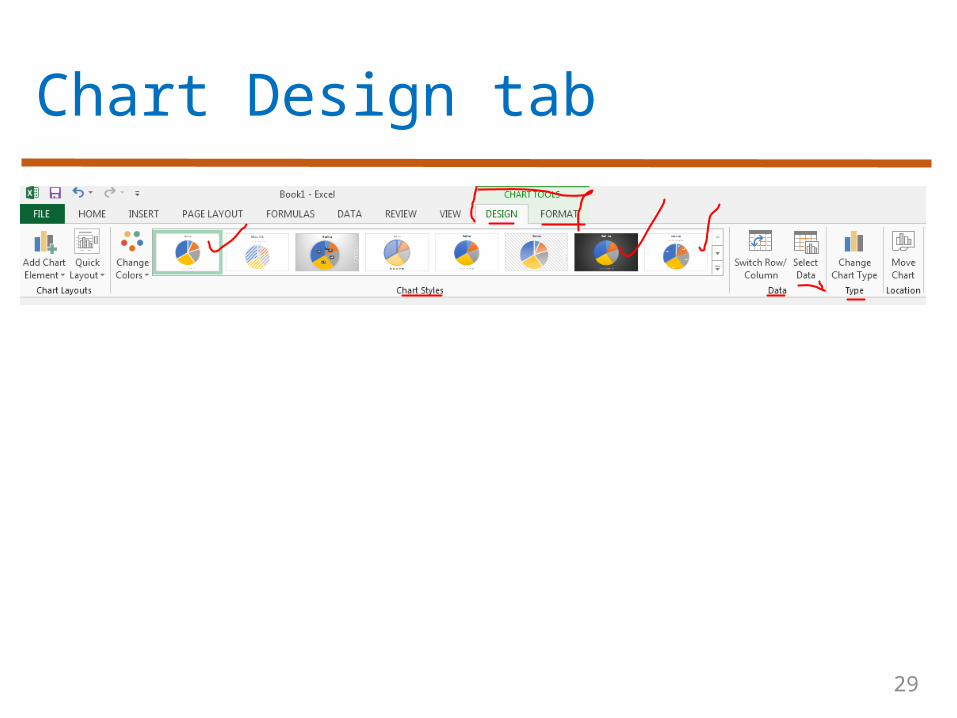
Chart Design tab
30
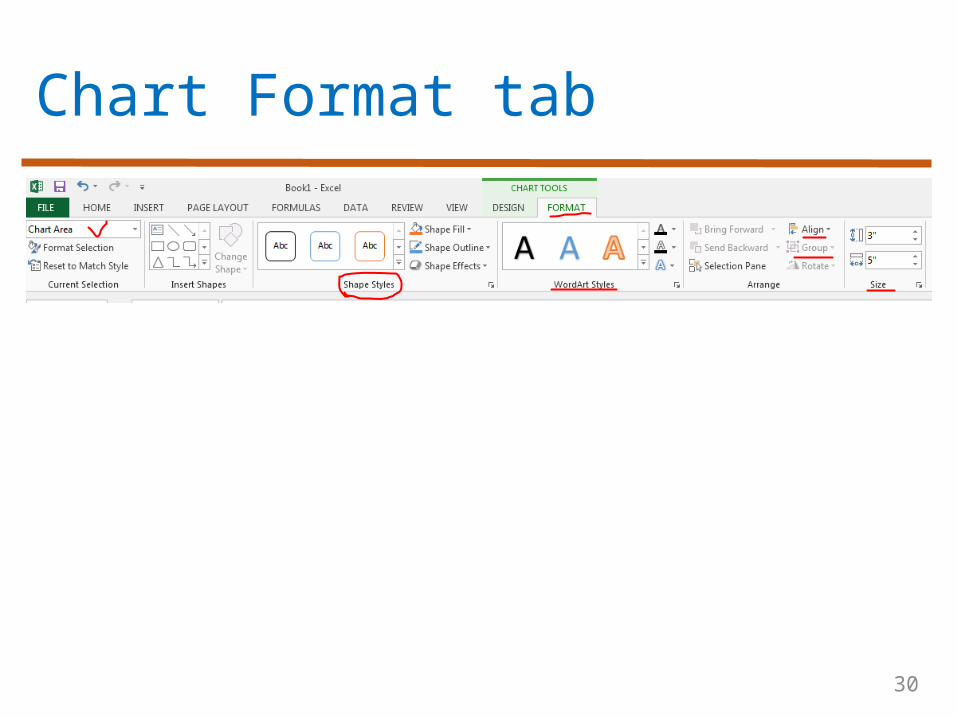
Chart Format tab
31
Activity 1
• Create examination result sheet for your own class. • You may include the following headings:• Exam title, school name• Roll no, student name, class, section• Signature line• Subject list like urdu, English,Pak. Std, etc.• Use formula in total and percentage
column
32
Activity 2
• Add some values and apply a formula of addition, subtraction and average.
• Insert a chart based on the data entered in the previous step and then modify chart settings• Chart type, chart color, etc.
33
Further reading
•Computer Applications in Business by Tasleem Mustafa• Chapter 17: Formulas and Functions• Chapter 19: Creating charts in excel

34
ThanksEnd of Lecture 17

35
Allah Hafiz