Cisco Unified IP Phone 7965G and 7945G Phone Guide for - ZID

CALCULATION OF FLOW CHARACTERISTICS IN HEAT TURBOMACHINERY TURBINE STAGE WITH DIFFERENT THREE
DIMENSIONAL SHAPE OF THE STATOR BLADE WITH ANSYS CFX SOFTWARE
A. Yangyozov*, R. Willinger**
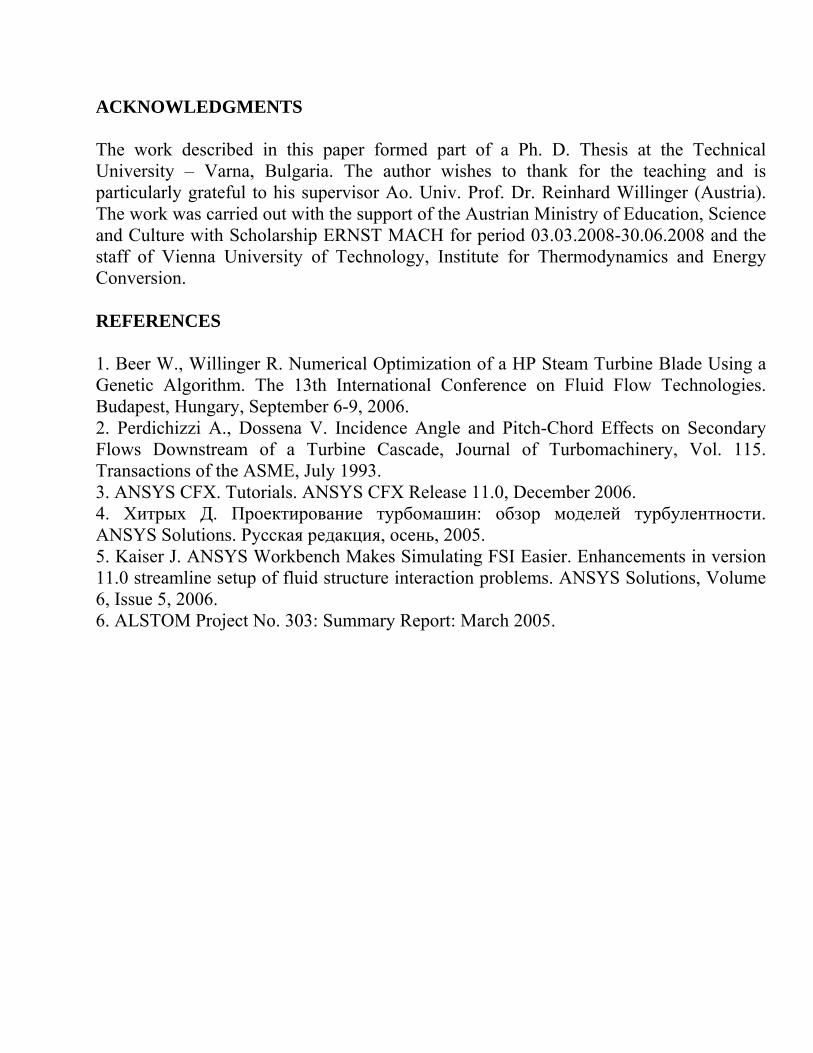
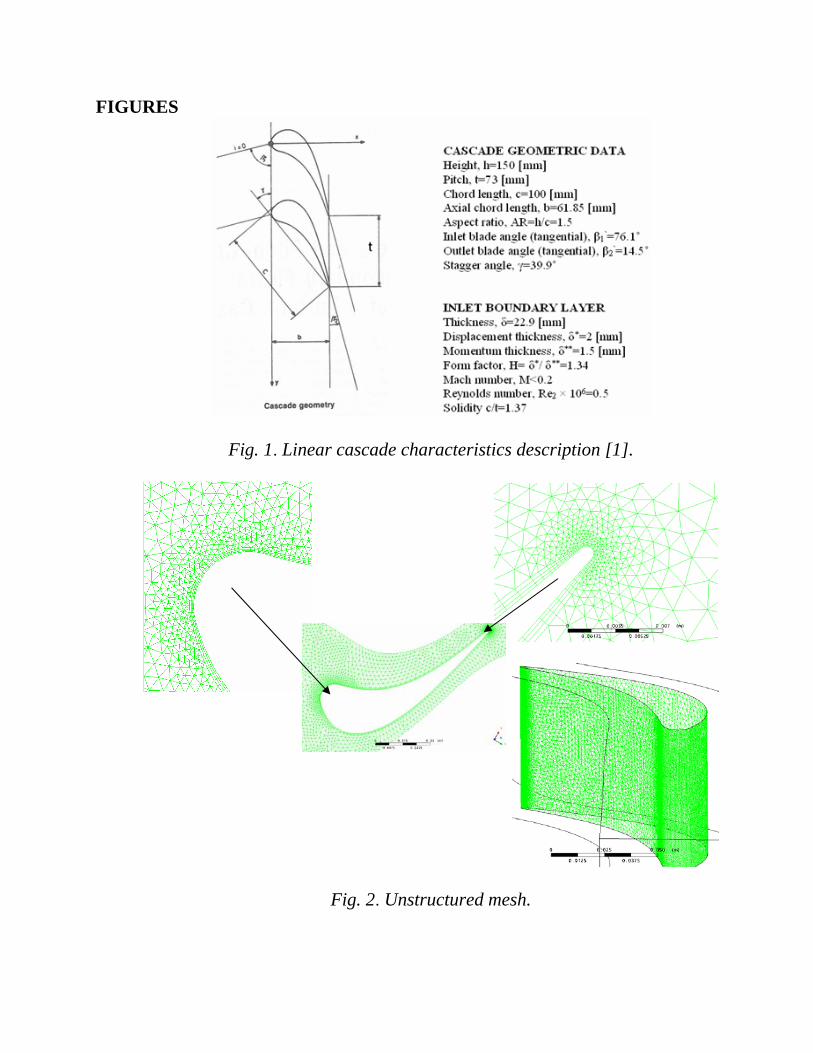
* Department of Marine Machinery, Technical University-Varna, Bulgaria, e-mail: [email protected] ** Institute for Thermodynamics and Energy Conversion, Vienna University of Technology, Austria, e-mail: [email protected] Abstract: Main purpose of the presented work was the investigation of influence of three dimensional blades over flow characteristics. The paper presents comparison between experimental and CFD (Computational Fluid Dynamics) data so called verification test, impulse turbine stage with Frozen Rotor and Transient Rotor Interface modeling. Static pressure distribution was measured at mid span of the blade. The paper discusses secondary flow phenomena. Keywords: CFD, heat turbomachinery, Compound Lean Nozzle, Controlled Flow Nozzle, efficiency. I. INTRODUCTION Before start with turbine stage modeling, especially important is for user to be sure in software capability that it can solve the problem. The most of commercial software use finite volume method and like every numerical method it also has some deviation from real parameters of the flow (errors), the same is in force for experiment. It is important this deviation to come to zero. This depends on designer experience. That’s why first step is verification test making. In TU-Vienna, Institute for Thermodynamics and Energy Conversion is build wind tunnel with linear cascade with cylindrical blades. The latter are manufactured by use of coordinates from [2]. On fig.1 are presented some geometrical characteristics of the cascade. All of these data are used to model verification test blade. On fig.2 is shown mesh. This is unstructured tetrahedral mesh. To solve this problem is necessary to apply boundary conditions. There are as follows: Inlet: velocity distribution in boundary layer is approximated by 1/7-th power law. Mid span velocity is about 18 m/s. The measured inlet turbulence intensity is Tu=4%. Turbulent length scale is 0.1% of the pitch. Outlet: At outlet plane static pressure is applied 96950 Pa. In laboratory cascade there are nine blades, in CFD simulation is modeled one, it is used also symmetry boundary condition at mid span, and periodic boundary conditions.

To make sure of mesh quality, engineer must make preliminary calculation and check y+ value. If the latter is not satisfying it is necessary to generate new mesh. In this simulation is used incompressible flow (M<0.2) [1], and different turbulence models-Shear Stress Transport, Standard k-epsilon and RNG k-epsilon. Results are presented on the next figures. Fig.4 shows secondary surface flow at hub wall comparisons between experiment with paint [2] and CFD simulation, but this is only qualitative picture of the flow in blade-to-blade channel. On this picture can be seen growing place of horseshoe vortex (only lower half part of the blade is shown). On fig.3 is visible downstream development and size decreasing of secondary vortex. For engineer is important to have quantitative comparison. In turbomachinery experiment practice is used pneumatic probe to make static pressure measurements on blade surface. This data was collected from wind tunnel. Comparisons between experiment and CFD are shown on fig.5,a. For user is interesting to check sensitivity of this software and influence of inlet boundary layer. It is not good practice to ignore velocity change in boundary layer (it is possible for initial guess). Fig.5,b proves this. Inlet velocity distribution is obtained by experiment and this data follows 1/7-th power law [1]. Results show a good agreement between experiment and calculation (fig.5, (a)). II. TURBINE STAGE CALCULATIONS 1. CFD simulation with Frozen Rotor Interface After verification test start real turbine stage modeling. It is a part of unit which works in power station in Bulgaria. From fig.6 can be seen that this is impulse stage (degree of reaction is about 20%) and some parameters calculated with one dimension theory (at mid span). With this information starts three dimensional simulation. Fig. 7 presents work steps. On next fig.8 are shown different modifications of the nozzle blades-common view of geometry [6]. The full geometry contains 30 stator blades and 124 rotor blades. The CFD turbine stage model contains four rotor blades and one stator blade. Periodic boundary conditions are also used. The geometry of the blades can be made in CATIA or SolidWorks. The rotor rotates about the Z-axis while the stator is stationary. Periodic boundaries are used to allow only a small section of the full geometry to be modeled. In this simulation is used Frozen Rotor interface, after that is made new transient simulation with a transient rotor-stator interface model. The Frozen Rotor solution is used as an initial guess for the transient rotor-stator simulation [3]. The geometry for three stator modifications and rotor are shown on fig.8. Into stator fluid domain is generated about 250,000 cells and for one rotor passage, 4x62,500=250,000 cells. ICEM-CFD can be used. Turbine stage is with 500,000

hexahedral cells. In CFX-Pre are set turbulence model- Shear Stress Transport [4], working fluid- superheated steam. For latter modelling is used the IAPWS-IF97 (International Association for the Properties of water and Steam-Industrial Formulation 1997) database. The boundary conditions are as follow: Inlet: velocity distribution in boundary layer is inhomogeneous with boundary layers. Mid span velocity is about 40 m/s. Total inlet temperature 470°C. The inlet turbulence intensity is set to Tu=5%. Outlet: At outlet plane static pressure is applied 6.78 MPa. CFX-Post is used to treat calculation results. Fast, without user effort can be checked pressure blade load at different span sections defined by engineer. In CFX-Post can be used mass averaged values of pressure and temperature to calculate isentropic efficiency. Some results are shown on fig.9 to fig.13. 2. CFD simulation with Transient Rotor Interface In this part of paper is described data preparation for transient simulation [3]. It is necessary to define time interval such that the rotor blades pass through one stator pitch (12°) using 10 time steps. The time step size is calculated as follows: Rotational Speed = 314.16 rad/s (n=3000 rev/min), Rotor Pitch Modeled = 4*(2π/124) = 0.2027 rad, Time to pass through one pitch = 0.2027/314.16 = 6.4516*10-4 s. Since 10 time steps are used over this interval each time step should be 6.4516*10-5 s. Results can be seen on fig. 14. CONCLUSIONS 1. Verification tests with ANSYS CFX software, TU-Vienna experiment description, comparison between both has been made. 2. A CFD Design Methodology has been presented. Real physical object has been modeled. 3. Comparison between turbine stages with different stator blades modifications (Lean, Inverse lean, Compound Flow Nozzle and Control Flow Nozzle) has been made. 5. Turbine stage unsteady transient simulation has been made. 6. Computational Fluid Dynamics shows that is possible to increase efficiency by 0.6%.
ACKNOWLEDGMENTS The work described in this paper formed part of a Ph. D. Thesis at the Technical University – Varna, Bulgaria. The author wishes to thank for the teaching and is particularly grateful to his supervisor Ao. Univ. Prof. Dr. Reinhard Willinger (Austria). The work was carried out with the support of the Austrian Ministry of Education, Science and Culture with Scholarship ERNST MACH for period 03.03.2008-30.06.2008 and the staff of Vienna University of Technology, Institute for Thermodynamics and Energy Conversion. REFERENCES 1. Beer W., Willinger R. Numerical Optimization of a HP Steam Turbine Blade Using a Genetic Algorithm. The 13th International Conference on Fluid Flow Technologies. Budapest, Hungary, September 6-9, 2006. 2. Perdichizzi A., Dossena V. Incidence Angle and Pitch-Chord Effects on Secondary Flows Downstream of a Turbine Cascade, Journal of Turbomachinery, Vol. 115. Transactions of the ASME, July 1993. 3. ANSYS CFX. Tutorials. ANSYS CFX Release 11.0, December 2006. 4. Хитрых Д. Проектирование турбомашин: обзор моделей турбулентности. ANSYS Solutions. Русская редакция, осень, 2005. 5. Kaiser J. ANSYS Workbench Makes Simulating FSI Easier. Enhancements in version 11.0 streamline setup of fluid structure interaction problems. ANSYS Solutions, Volume 6, Issue 5, 2006. 6. ALSTOM Project No. 303: Summary Report: March 2005.
FIGURES
Fig. 1. Linear cascade characteristics description [1].
Fig. 2. Unstructured mesh.

a) b)
Fig. 3. Some results from CFX-Post: (a) streamlines surface and three dimensional
secondary flow at hub, (b) total pressure contour lines (yellow color is vortex core, only lower half blade part is shown).
a) b)
Fig.4 . Comparisons between experiment (a) and CFD calculation (b) (only lower half blade part is shown).

a)
b)
Fig. 5. Static pressure coefficient distribution on blade surface at mean section: (a) comparison between experimental data (+) and CFD calculations with different
turbulence models, (b) comparison between experimental data (+) and two CFD calculations with RNG k-epsilon turbulence model-with inlet boundary layer and without
inlet boundary layer.
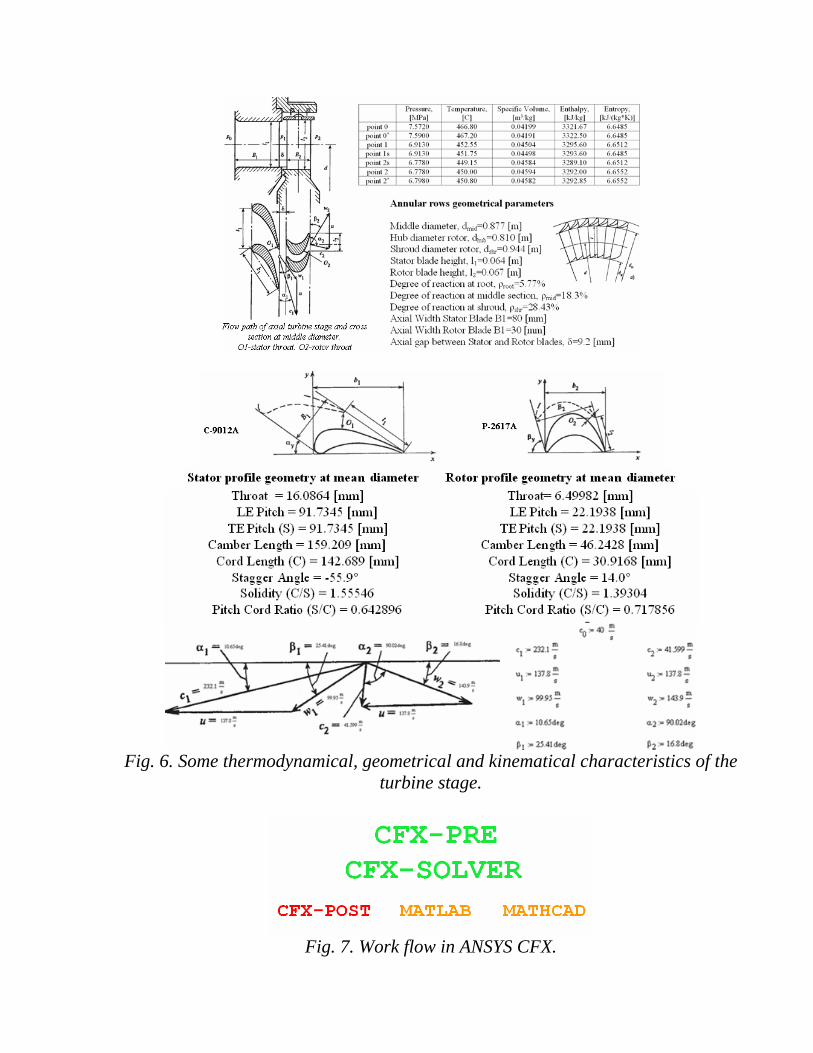
Fig. 6. Some thermodynamical, geometrical and kinematical characteristics of the
turbine stage.
Fig. 7. Work flow in ANSYS CFX.
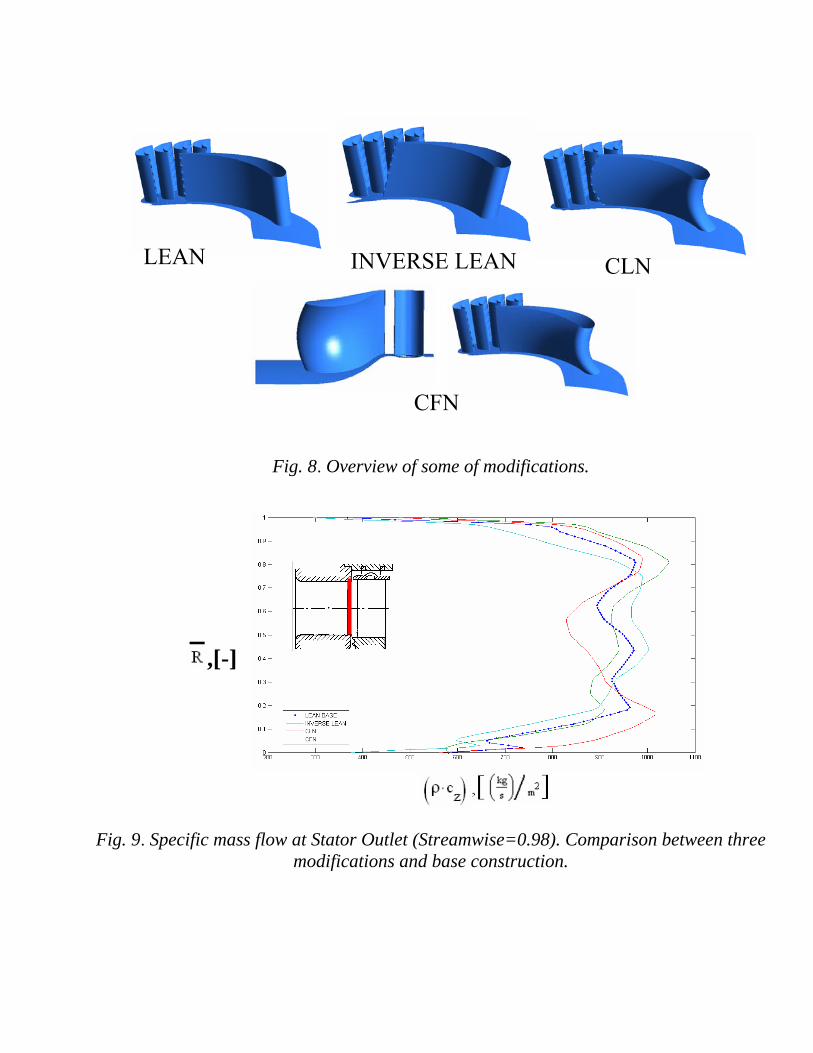
LEAN INVERSE LEAN CLN
Fig. 8. Overview of some of modifications.
Fig. 9. Specific mass flow at Stator Outlet (Streamwise=0.98). Comparison between three
modifications and base construction.
,[-]
CFN
a) b)
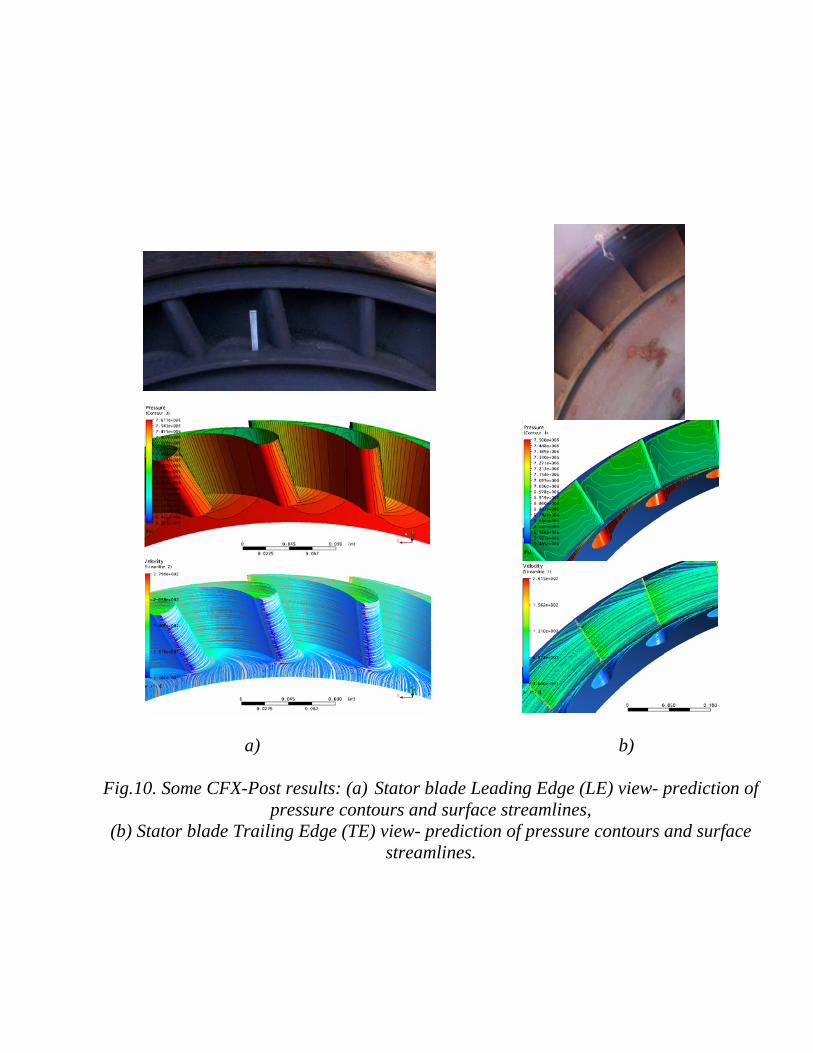
Fig.10. Some CFX-Post results: (a) Stator blade Leading Edge (LE) view- prediction of
pressure contours and surface streamlines, (b) Stator blade Trailing Edge (TE) view- prediction of pressure contours and surface
streamlines.

b)
a)
Fig. 11. Some CFX-Post results: (a) Rotor blade Leading Edge (LE) view- prediction of
pressure contours and surface streamlines, (b) Rotor blade Trailing Edge (TE) view- prediction of pressure contours and surface
streamlines.

c)
Fig. 12. Secondary flow visualization near the shroud and hub turbine blades: (a) Three-dimensional streamlines, (b) Surface streamlines stator and rotor blades, stator and rotor
hub, (c) Surface streamlines between blades at interface region.

a)
b)
Fig. 13. Secondary vortices at rotor fluid domain: (a)-Surface streamlines at plane, defined in rotor fluid domain. Secondary vortex, and velocity on this plane with vortex at
hub, (b)-Ratio eddy viscosity/dynamic viscosity isosurface.

0 [s] 0.0002 [s]
0.0006 [s] 0.0004 [s]
Fig. 14. Pressure contour change with the time.