Calculation Methods to Improve Insulation … Methods to Improve Insulation Coordination at Civil...
14
Calculation Methods to Improve Insulation Coordination at Civil Structures R.M. Paulussen 1 , P.H.F. Morshuis 2 1 ARCADIS Nederland, Amersfoort, the Netherlands, 2 Delft University of Technology, Delft, the Netherlands Abstract The main electrical traction power supply in the Netherlands consists of a 1.5 kV DC system. Exceptions are special purpose lines such as the 25 kV AC high speed line between Schiphol Airport and the Belgian border, and the 25 kV AC Betuweroute freight line connection between Rotterdam and the German border. Gauges for existing civil structures in the Netherlands are all based on the insulation distance of the 1.5 kV DC system. Infrastructure manager ProRail has recently studied the possibility of upgrading the existing power supply system to a 25 kV AC system. The results of that study showed that introducing such a power supply change will lead to tight insulation distances at more than 99% of the existing civil structures, and that even a new line like Betuweroute has to contend with reduced insulation distances underneath civil structures. This study examines three insulation coordination strategies for dealing with too tight insulation distances underneath civil structures: accepting a lower breakdown voltage, increasing the withstand voltage; and limiting the surge voltages. A calculation method was introduced to support the design of a surge protection system. This calculation method is based on a complete line approach including minimal insulation distances, field grading influence, surge arrester placing, probability of direct and indirect lightning strikes, and mean time between failures (MTBF)-values of surge arresters. Calculation results are based on Betuweroute data. The results show that accepting a lower breakdown voltage for civil structures without earthing system leads to low MTBF-values of the overhead catenary system (OCS). An increase in withstand voltage can be obtained by applying additional products, like foam insulation or the use of special products like field steering components. Not much is known, however, about the long term behavior of foam in strongly polluted areas. Increasing withstand voltage is a powerful method for (upgraded) 25 kV AC lines coping with insulation distances between 100 and 200 mm in combination with surge arresters. Limiting the surge voltages in OCS leads to complicated design questions as surge arresters have limited time to failure. In case of a close formation of civil structures the failure probability of the arresters might rise beyond the probability of a short circuit between catenary and civil structure. In those instances leaving out surge arresters is preferable. Introduction Analysis of direct and indirect lightning strikes in OCS provides insight into the reliability and sensitivity of OCS due to environmental conditions, and reduced insulation distances. Accepting lower breakdown voltages for OCS at civil structures may lead to lower reliability of the entire OCS. This introduction explains the basis for calculating flashovers due to (in)direct lightning strikes. The number of direct strikes N d in a double track line of 100 km length is given by Equation (1):
Transcript of Calculation Methods to Improve Insulation … Methods to Improve Insulation Coordination at Civil...
Calculation Methods to Improve Insulation Coordination at Civil Structures
R.M. Paulussen1, P.H.F. Morshuis2
1ARCADIS Nederland, Amersfoort, the Netherlands, 2Delft University of Technology, Delft, the Netherlands
Abstract
The main electrical traction power supply in the Netherlands consists of a 1.5 kVDC system. Exceptions are special purpose lines such as the 25 kVAC high speed line between Schiphol Airport and the Belgian border, and the 25 kVAC Betuweroute freight line connection between Rotterdam and the German border. Gauges for existing civil structures in the Netherlands are all based on the insulation distance of the 1.5 kVDC system. Infrastructure manager ProRail has recently studied the possibility of upgrading the existing power supply system to a 25 kVAC system. The results of that study showed that introducing such a power supply change will lead to tight insulation distances at more than 99% of the existing civil structures, and that even a new line like Betuweroute has to contend with reduced insulation distances underneath civil structures. This study examines three insulation coordination strategies for dealing with too tight insulation distances underneath civil structures: accepting a lower breakdown voltage, increasing the withstand voltage; and limiting the surge voltages. A calculation method was introduced to support the design of a surge protection system. This calculation method is based on a complete line approach including minimal insulation distances, field grading influence, surge arrester placing, probability of direct and indirect lightning strikes, and mean time between failures (MTBF)-values of surge arresters. Calculation results are based on Betuweroute data. The results show that accepting a lower breakdown voltage for civil structures without earthing system leads to low MTBF-values of the overhead catenary system (OCS). An increase in withstand voltage can be obtained by applying additional products, like foam insulation or the use of special products like field steering components. Not much is known, however, about the long term behavior of foam in strongly polluted areas. Increasing withstand voltage is a powerful method for (upgraded) 25 kVAC lines coping with insulation distances between 100 and 200 mm in combination with surge arresters. Limiting the surge voltages in OCS leads to complicated design questions as surge arresters have limited time to failure. In case of a close formation of civil structures the failure probability of the arresters might rise beyond the probability of a short circuit between catenary and civil structure. In those instances leaving out surge arresters is preferable.
Introduction
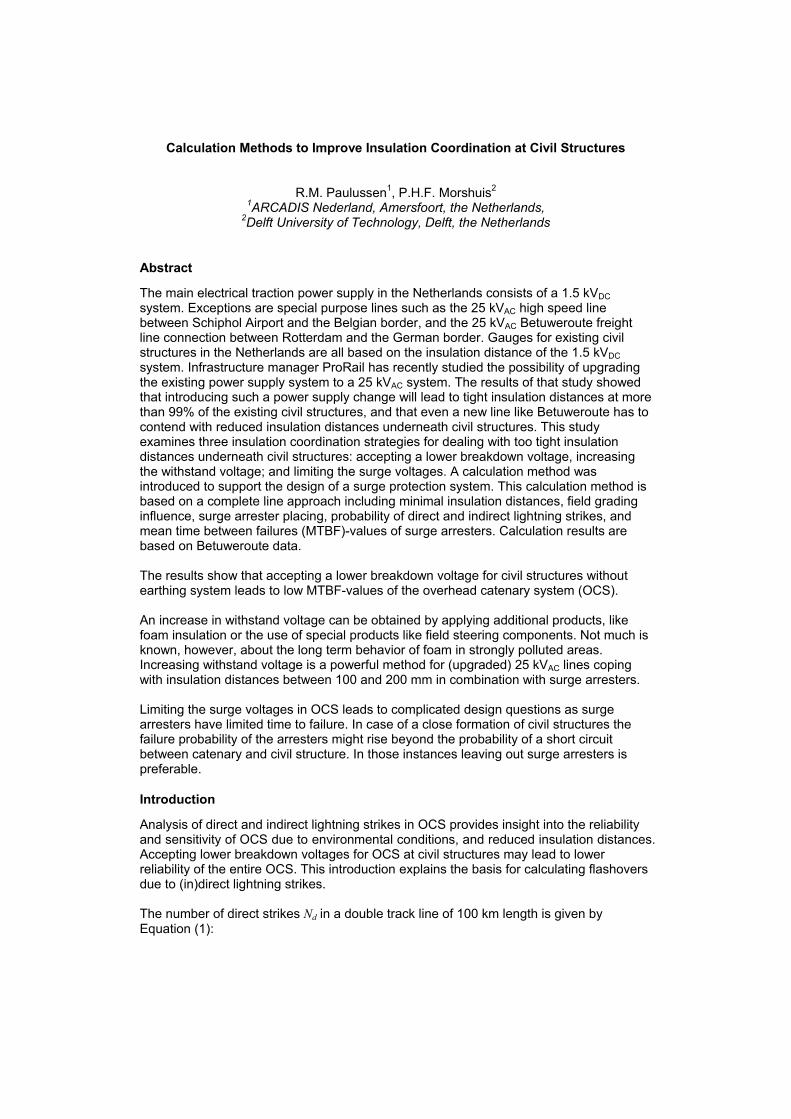
Analysis of direct and indirect lightning strikes in OCS provides insight into the reliability and sensitivity of OCS due to environmental conditions, and reduced insulation distances. Accepting lower breakdown voltages for OCS at civil structures may lead to lower reliability of the entire OCS. This introduction explains the basis for calculating flashovers due to (in)direct lightning strikes. The number of direct strikes Nd in a double track line of 100 km length is given by Equation (1):
⎟⎟⎠
⎞⎜⎜⎝
⎛ +⋅⋅=
1028 6.0 bhNN gd (1)
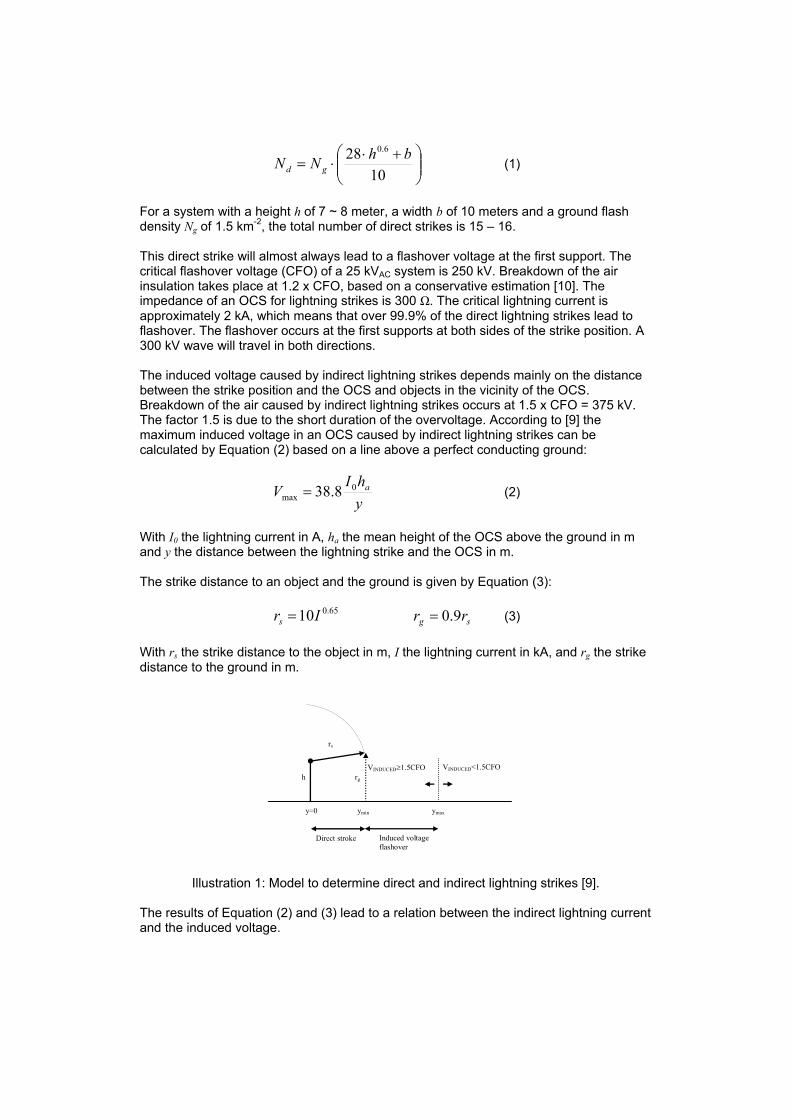
For a system with a height h of 7 ~ 8 meter, a width b of 10 meters and a ground flash density Ng of 1.5 km-2, the total number of direct strikes is 15 – 16. This direct strike will almost always lead to a flashover voltage at the first support. The critical flashover voltage (CFO) of a 25 kVAC system is 250 kV. Breakdown of the air insulation takes place at 1.2 x CFO, based on a conservative estimation [10]. The impedance of an OCS for lightning strikes is 300 Ω. The critical lightning current is approximately 2 kA, which means that over 99.9% of the direct lightning strikes lead to flashover. The flashover occurs at the first supports at both sides of the strike position. A 300 kV wave will travel in both directions. The induced voltage caused by indirect lightning strikes depends mainly on the distance between the strike position and the OCS and objects in the vicinity of the OCS. Breakdown of the air caused by indirect lightning strikes occurs at 1.5 x CFO = 375 kV. The factor 1.5 is due to the short duration of the overvoltage. According to [9] the maximum induced voltage in an OCS caused by indirect lightning strikes can be calculated by Equation (2) based on a line above a perfect conducting ground:
yhIV a0
max 8.38= (2)
With I0 the lightning current in A, ha the mean height of the OCS above the ground in m and y the distance between the lightning strike and the OCS in m. The strike distance to an object and the ground is given by Equation (3):
65.010Irs = sg rr 9.0= (3) With rs the strike distance to the object in m, I the lightning current in kA, and rg the strike distance to the ground in m.
VINDUCED≥1.5CFO VINDUCED<1.5CFO h
rs
rg
y=0 ymin ymax
Direct stroke Induced voltage flashover
Illustration 1: Model to determine direct and indirect lightning strikes [9].
The results of Equation (2) and (3) lead to a relation between the indirect lightning current and the induced voltage.
0
50
100
150
200
250
300
350
400
0 50 100 150 200
Lightning current [kA]
Indu
ced
volta
ge [k
V]
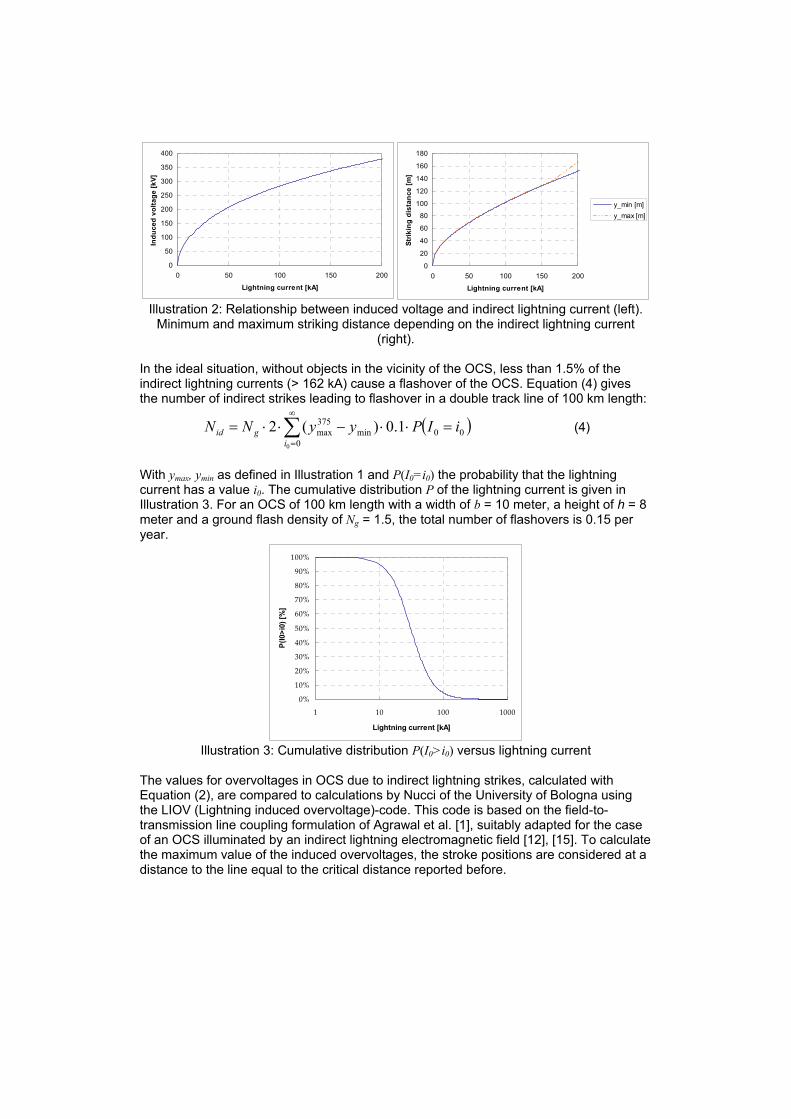
Illustration 2: Relationship between induced voltage and indirect lightning current (left).
Minimum and maximum striking distance depending on the indirect lightning current (right).
In the ideal situation, without objects in the vicinity of the OCS, less than 1.5% of the indirect lightning currents (> 162 kA) cause a flashover of the OCS. Equation (4) gives the number of indirect strikes leading to flashover in a double track line of 100 km length:
( )∑∞
=
=⋅⋅−⋅⋅=0
00min375max
0
1.0)(2i
gid iIPyyNN (4)
With ymax, ymin as defined in Illustration 1 and P(I0=i0) the probability that the lightning current has a value i0. The cumulative distribution P of the lightning current is given in Illustration 3. For an OCS of 100 km length with a width of b = 10 meter, a height of h = 8 meter and a ground flash density of Ng = 1.5, the total number of flashovers is 0.15 per year.
0%
10%
20%
30%
40%
50%
60%
70%
80%
90%
100%
1 10 100 1000
Lightning current [kA]
P(I0
>i0)
[%]
Illustration 3: Cumulative distribution P(I0>i0) versus lightning current
The values for overvoltages in OCS due to indirect lightning strikes, calculated with Equation (2), are compared to calculations by Nucci of the University of Bologna using the LIOV (Lightning induced overvoltage)-code. This code is based on the field-to-transmission line coupling formulation of Agrawal et al. [1], suitably adapted for the case of an OCS illuminated by an indirect lightning electromagnetic field [12], [15]. To calculate the maximum value of the induced overvoltages, the stroke positions are considered at a distance to the line equal to the critical distance reported before.
0
20
40
60
80
100
120
140
160
180
0 50 100 150 200
Lightning current [kA]
Strik
ing
dist
ance
[m]
y_min [m]y_max [m]
1 2 3 4 5 6 7 8 9 10 11 12 13 14 15 16 17 18 19 20 21 22 23 24 25 26 27 28 29 30 31 32 33
60 m
1980 m
600 m
0
35 m
55 m
990 m
Current A Current B
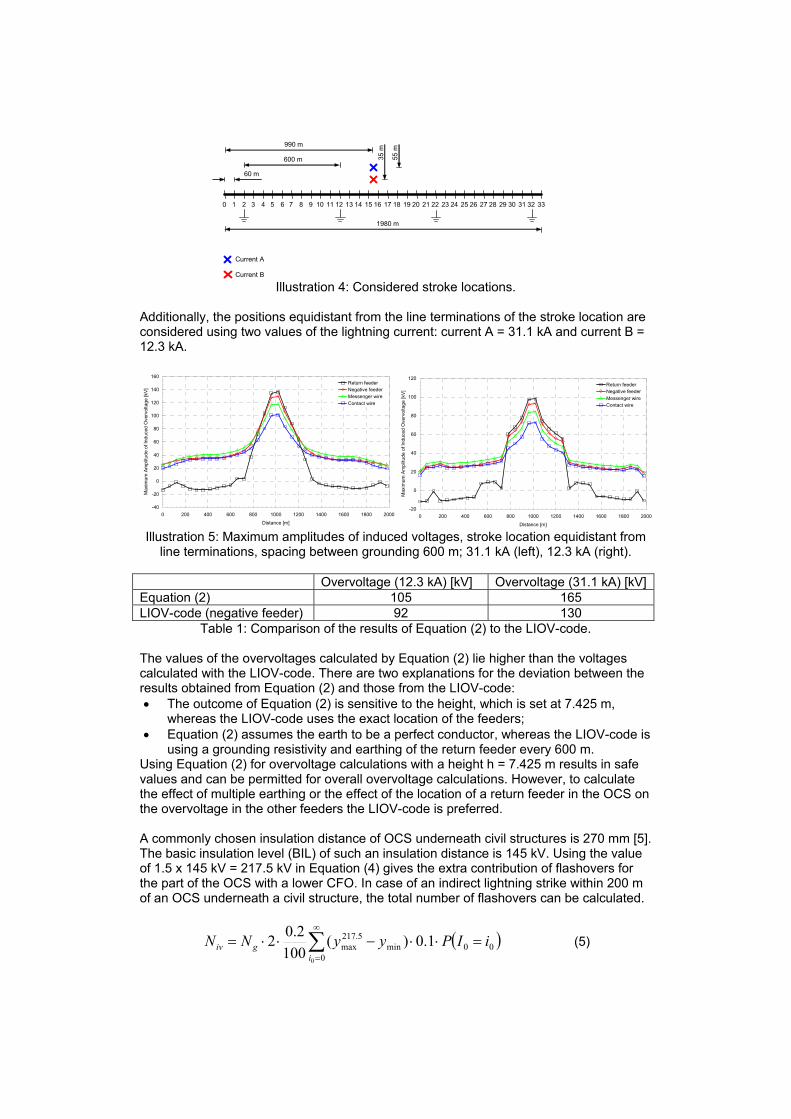
Illustration 4: Considered stroke locations. Additionally, the positions equidistant from the line terminations of the stroke location are considered using two values of the lightning current: current A = 31.1 kA and current B = 12.3 kA.
-40
-20
0
20
40
60
80
100
120
140
160
0 200 400 600 800 1000 1200 1400 1600 1800 2000
Distance [m]
Max
imum
Am
plitu
de o
f Ind
uced
Ove
rvol
tage
[kV]
Return feederNegative feederMessenger wireContact wire
Illustration 5: Maximum amplitudes of induced voltages, stroke location equidistant from
line terminations, spacing between grounding 600 m; 31.1 kA (left), 12.3 kA (right). Overvoltage (12.3 kA) [kV] Overvoltage (31.1 kA) [kV] Equation (2) 105 165 LIOV-code (negative feeder) 92 130
Table 1: Comparison of the results of Equation (2) to the LIOV-code. The values of the overvoltages calculated by Equation (2) lie higher than the voltages calculated with the LIOV-code. There are two explanations for the deviation between the results obtained from Equation (2) and those from the LIOV-code: • The outcome of Equation (2) is sensitive to the height, which is set at 7.425 m,
whereas the LIOV-code uses the exact location of the feeders; • Equation (2) assumes the earth to be a perfect conductor, whereas the LIOV-code is
using a grounding resistivity and earthing of the return feeder every 600 m. Using Equation (2) for overvoltage calculations with a height h = 7.425 m results in safe values and can be permitted for overall overvoltage calculations. However, to calculate the effect of multiple earthing or the effect of the location of a return feeder in the OCS on the overvoltage in the other feeders the LIOV-code is preferred. A commonly chosen insulation distance of OCS underneath civil structures is 270 mm [5]. The basic insulation level (BIL) of such an insulation distance is 145 kV. Using the value of 1.5 x 145 kV = 217.5 kV in Equation (4) gives the extra contribution of flashovers for the part of the OCS with a lower CFO. In case of an indirect lightning strike within 200 m of an OCS underneath a civil structure, the total number of flashovers can be calculated.
( )∑∞
=
=⋅⋅−⋅⋅=0
00min5.217
max0
1.0)(100
2.02i
giv iIPyyNN (5)
-20
0
20
40
60
80
100
120
0 200 400 600 800 1000 1200 1400 1600 1800 2000
Distance [m]
Max
imum
Am
plitu
de o
f Ind
uced
Ove
rvol
tage
[kV]
Return feederNegative feederMessenger wireContact wire
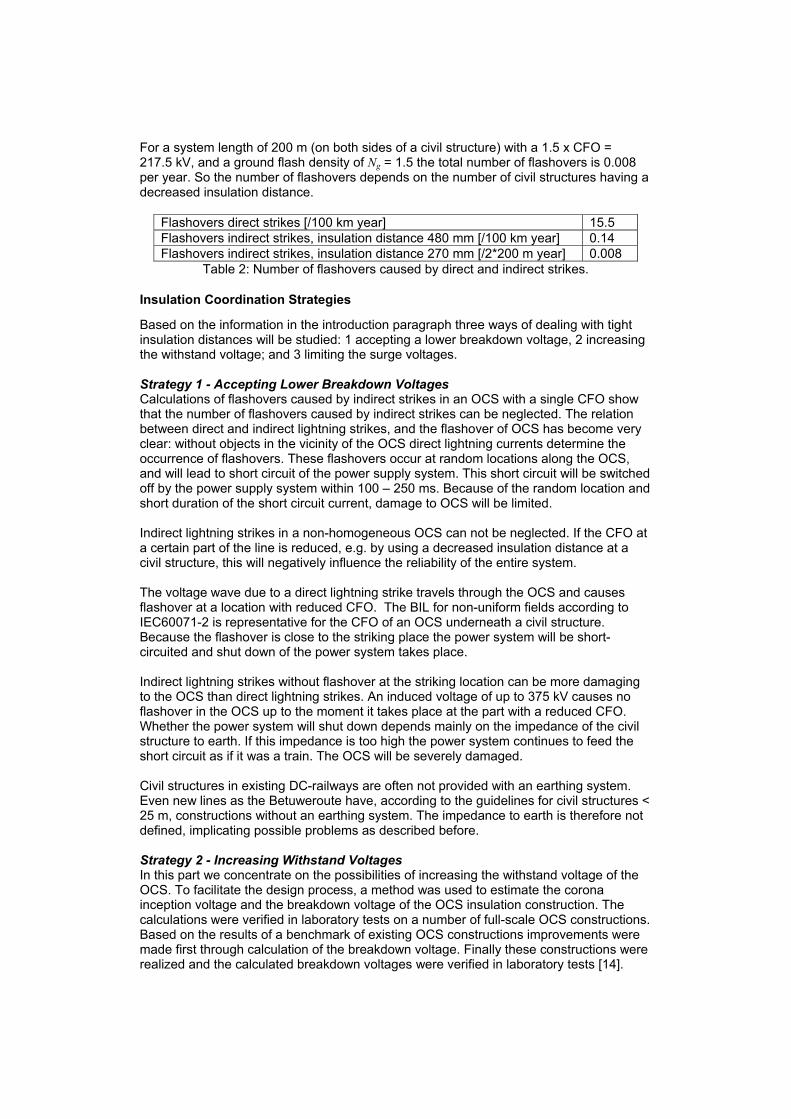
For a system length of 200 m (on both sides of a civil structure) with a 1.5 x CFO = 217.5 kV, and a ground flash density of Ng = 1.5 the total number of flashovers is 0.008 per year. So the number of flashovers depends on the number of civil structures having a decreased insulation distance.
Flashovers direct strikes [/100 km year] 15.5 Flashovers indirect strikes, insulation distance 480 mm [/100 km year] 0.14 Flashovers indirect strikes, insulation distance 270 mm [/2*200 m year] 0.008
Table 2: Number of flashovers caused by direct and indirect strikes.
Insulation Coordination Strategies
Based on the information in the introduction paragraph three ways of dealing with tight insulation distances will be studied: 1 accepting a lower breakdown voltage, 2 increasing the withstand voltage; and 3 limiting the surge voltages. Strategy 1 - Accepting Lower Breakdown Voltages Calculations of flashovers caused by indirect strikes in an OCS with a single CFO show that the number of flashovers caused by indirect strikes can be neglected. The relation between direct and indirect lightning strikes, and the flashover of OCS has become very clear: without objects in the vicinity of the OCS direct lightning currents determine the occurrence of flashovers. These flashovers occur at random locations along the OCS, and will lead to short circuit of the power supply system. This short circuit will be switched off by the power supply system within 100 – 250 ms. Because of the random location and short duration of the short circuit current, damage to OCS will be limited. Indirect lightning strikes in a non-homogeneous OCS can not be neglected. If the CFO at a certain part of the line is reduced, e.g. by using a decreased insulation distance at a civil structure, this will negatively influence the reliability of the entire system. The voltage wave due to a direct lightning strike travels through the OCS and causes flashover at a location with reduced CFO. The BIL for non-uniform fields according to IEC60071-2 is representative for the CFO of an OCS underneath a civil structure. Because the flashover is close to the striking place the power system will be short-circuited and shut down of the power system takes place. Indirect lightning strikes without flashover at the striking location can be more damaging to the OCS than direct lightning strikes. An induced voltage of up to 375 kV causes no flashover in the OCS up to the moment it takes place at the part with a reduced CFO. Whether the power system will shut down depends mainly on the impedance of the civil structure to earth. If this impedance is too high the power system continues to feed the short circuit as if it was a train. The OCS will be severely damaged. Civil structures in existing DC-railways are often not provided with an earthing system. Even new lines as the Betuweroute have, according to the guidelines for civil structures < 25 m, constructions without an earthing system. The impedance to earth is therefore not defined, implicating possible problems as described before. Strategy 2 - Increasing Withstand Voltages In this part we concentrate on the possibilities of increasing the withstand voltage of the OCS. To facilitate the design process, a method was used to estimate the corona inception voltage and the breakdown voltage of the OCS insulation construction. The calculations were verified in laboratory tests on a number of full-scale OCS constructions. Based on the results of a benchmark of existing OCS constructions improvements were made first through calculation of the breakdown voltage. Finally these constructions were realized and the calculated breakdown voltages were verified in laboratory tests [14].
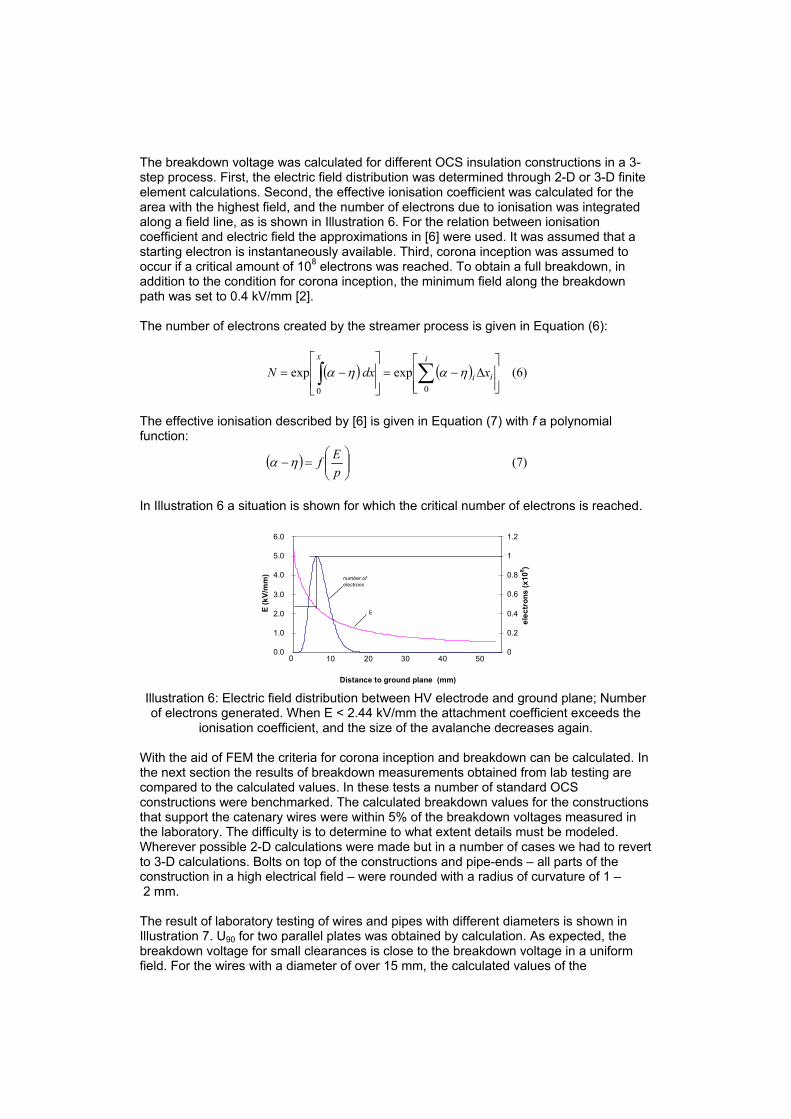
The breakdown voltage was calculated for different OCS insulation constructions in a 3-step process. First, the electric field distribution was determined through 2-D or 3-D finite element calculations. Second, the effective ionisation coefficient was calculated for the area with the highest field, and the number of electrons due to ionisation was integrated along a field line, as is shown in Illustration 6. For the relation between ionisation coefficient and electric field the approximations in [6] were used. It was assumed that a starting electron is instantaneously available. Third, corona inception was assumed to occur if a critical amount of 108 electrons was reached. To obtain a full breakdown, in addition to the condition for corona inception, the minimum field along the breakdown path was set to 0.4 kV/mm [2]. The number of electrons created by the streamer process is given in Equation (6):
( ) ( )⎥⎥⎦
⎤
⎢⎢⎣
⎡Δ−=
⎥⎥⎦
⎤
⎢⎢⎣
⎡−= ∑∫
i
ii
x
xdxN00
expexp ηαηα (6)
The effective ionisation described by [6] is given in Equation (7) with f a polynomial function:
( ) ⎟⎟⎠
⎞⎜⎜⎝
⎛=−
pEfηα (7)
In Illustration 6 a situation is shown for which the critical number of electrons is reached.
0.0 1.0 2.0 3.0 4.0 5.0 6.0
0 10 20 30 40 50
Distance to ground plane (mm)
E (k
V/m
m)
0
0.2
0.4
0.6
0.8
1
1.2el
ectr
ons
(x10
8 )
E
number of electrons
Illustration 6: Electric field distribution between HV electrode and ground plane; Number of electrons generated. When E < 2.44 kV/mm the attachment coefficient exceeds the
ionisation coefficient, and the size of the avalanche decreases again. With the aid of FEM the criteria for corona inception and breakdown can be calculated. In the next section the results of breakdown measurements obtained from lab testing are compared to the calculated values. In these tests a number of standard OCS constructions were benchmarked. The calculated breakdown values for the constructions that support the catenary wires were within 5% of the breakdown voltages measured in the laboratory. The difficulty is to determine to what extent details must be modeled. Wherever possible 2-D calculations were made but in a number of cases we had to revert to 3-D calculations. Bolts on top of the constructions and pipe-ends – all parts of the construction in a high electrical field – were rounded with a radius of curvature of 1 – 2 mm. The result of laboratory testing of wires and pipes with different diameters is shown in Illustration 7. U90 for two parallel plates was obtained by calculation. As expected, the breakdown voltage for small clearances is close to the breakdown voltage in a uniform field. For the wires with a diameter of over 15 mm, the calculated values of the
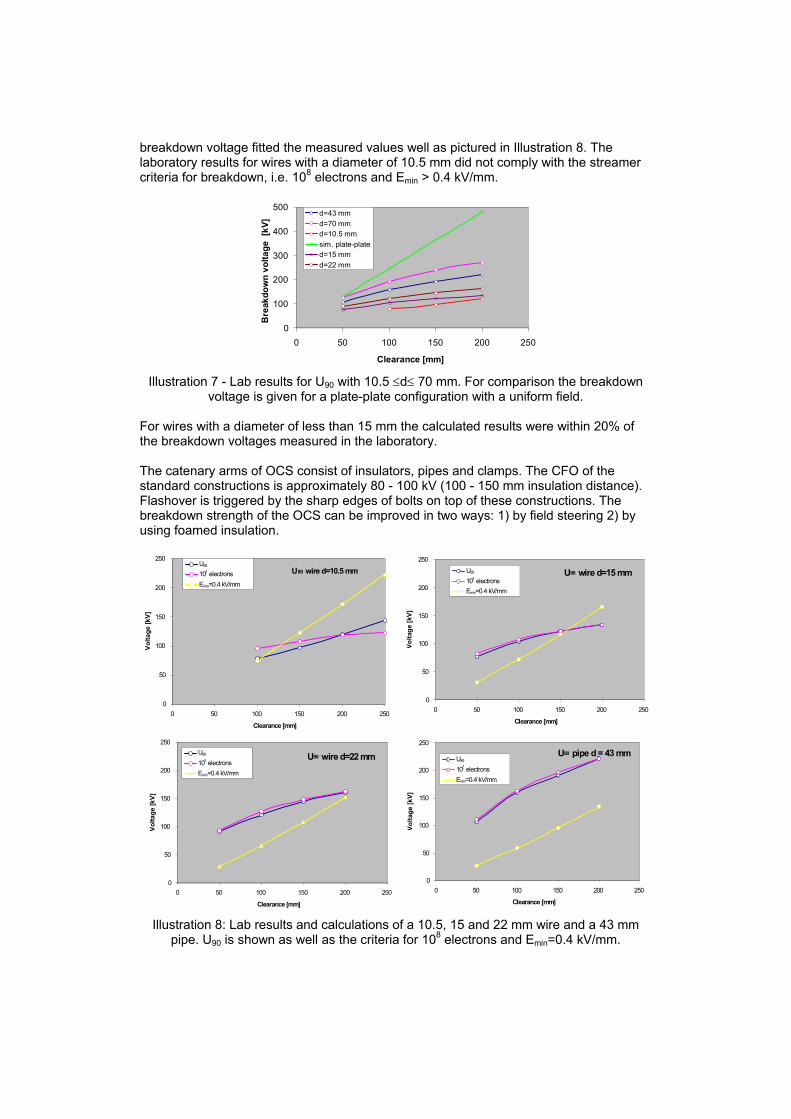
breakdown voltage fitted the measured values well as pictured in Illustration 8. The laboratory results for wires with a diameter of 10.5 mm did not comply with the streamer criteria for breakdown, i.e. 108 electrons and Emin > 0.4 kV/mm.
0 100 200 300 400 500
0 50 100 150 200 250
Clearance [mm]
Bre
akdo
wn
volta
ge [
kV]
d=43 mmd=70 mmd=10.5 mmsim. plate-plated=15 mmd=22 mm
Illustration 7 - Lab results for U90 with 10.5 ≤d≤ 70 mm. For comparison the breakdown
voltage is given for a plate-plate configuration with a uniform field. For wires with a diameter of less than 15 mm the calculated results were within 20% of the breakdown voltages measured in the laboratory. The catenary arms of OCS consist of insulators, pipes and clamps. The CFO of the standard constructions is approximately 80 - 100 kV (100 - 150 mm insulation distance). Flashover is triggered by the sharp edges of bolts on top of these constructions. The breakdown strength of the OCS can be improved in two ways: 1) by field steering 2) by using foamed insulation.
U 90 wire d=10.5 mm
0
50
100
150
200
250
0 50 100 150 200 250
Clearance [mm]
Volta
ge [k
V]
U90 108 electronsEmin=0.4 kV/mm
U 90 wire d=22 mm
0
50
100
150
200
250
0 50 100 150 200 250
Clearance [mm]
Volta
ge [k
V]
U90 108 electrons Emin=0.4 kV/mm
Illustration 8: Lab results and calculations of a 10.5, 15 and 22 mm wire and a 43 mm
pipe. U90 is shown as well as the criteria for 108 electrons and Emin=0.4 kV/mm.
U 90 wire d=15 mm
0
50
100
150
200
250
0 50 100 150 200 250 Clearance [mm]
Volta
ge [k
V]
U90
108 electronsEmin=0.4 kV/mm
U 90 pipe d = 43 mm
0
50
100
150
200
250
0 50 100 150 200 250 Clearance [mm]
Volta
ge [k
V]
U90
108 electronsEmin=0.4 kV/mm
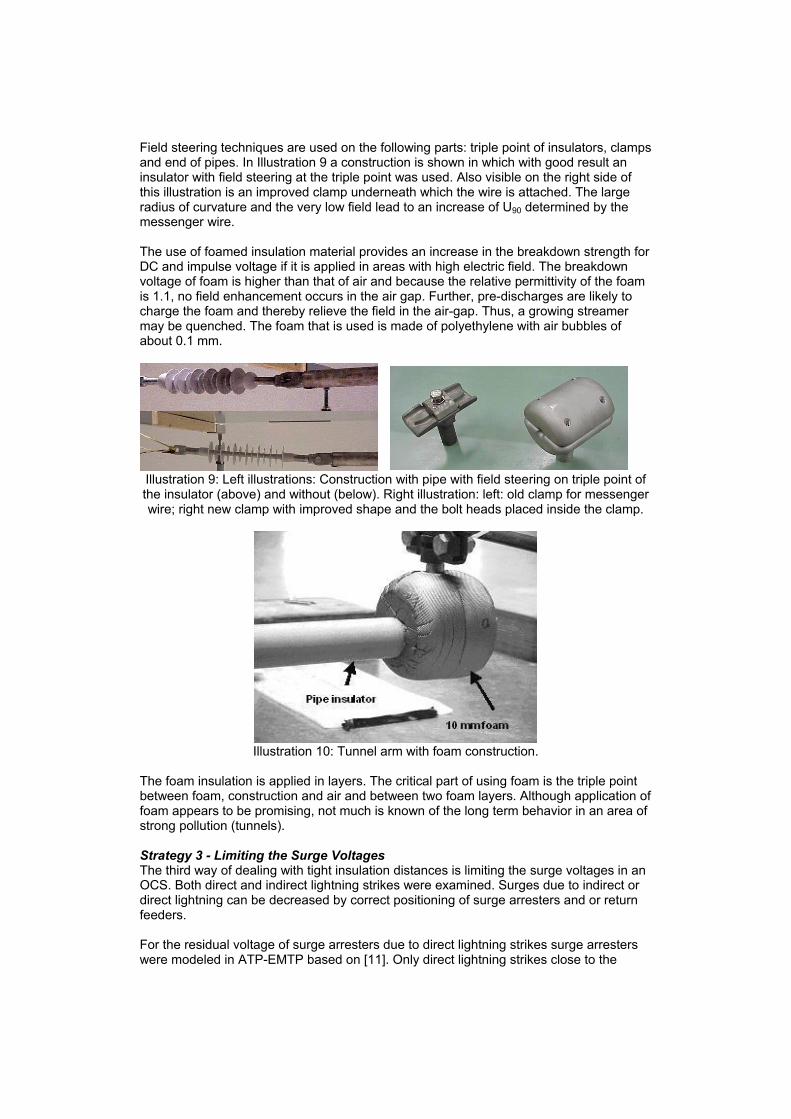
Field steering techniques are used on the following parts: triple point of insulators, clamps and end of pipes. In Illustration 9 a construction is shown in which with good result an insulator with field steering at the triple point was used. Also visible on the right side of this illustration is an improved clamp underneath which the wire is attached. The large radius of curvature and the very low field lead to an increase of U90 determined by the messenger wire. The use of foamed insulation material provides an increase in the breakdown strength for DC and impulse voltage if it is applied in areas with high electric field. The breakdown voltage of foam is higher than that of air and because the relative permittivity of the foam is 1.1, no field enhancement occurs in the air gap. Further, pre-discharges are likely to charge the foam and thereby relieve the field in the air-gap. Thus, a growing streamer may be quenched. The foam that is used is made of polyethylene with air bubbles of about 0.1 mm.
Illustration 9: Left illustrations: Construction with pipe with field steering on triple point of the insulator (above) and without (below). Right illustration: left: old clamp for messenger wire; right new clamp with improved shape and the bolt heads placed inside the clamp.
Illustration 10: Tunnel arm with foam construction.
The foam insulation is applied in layers. The critical part of using foam is the triple point between foam, construction and air and between two foam layers. Although application of foam appears to be promising, not much is known of the long term behavior in an area of strong pollution (tunnels). Strategy 3 - Limiting the Surge Voltages The third way of dealing with tight insulation distances is limiting the surge voltages in an OCS. Both direct and indirect lightning strikes were examined. Surges due to indirect or direct lightning can be decreased by correct positioning of surge arresters and or return feeders. For the residual voltage of surge arresters due to direct lightning strikes surge arresters were modeled in ATP-EMTP based on [11]. Only direct lightning strikes close to the
surge arrester are able to cause flashovers. Indirect lightning strikes will be reduced to below 100 kV by surge arresters. In most instances of direct lightning strikes a surge arrester just needs to cope with the rest voltage of about 300 kV in the OCS. With a 300 Ω impedance of the OCS the surge arrester only has to handle a current of 1 kA. A Polim S30 has a residual voltage of 80 kV at 1 kA (which represents 130 mm according to IEC60071-2). Two situations of direct lightning strikes close to the arrester are studied: in the first field behind the surge arrester, and between civil structure and surge arrester. In the First Field behind the Surge Arrester If the direct strike occurs in the catenary field of the surge arrester then the mean current through the arrester will be 50% of the lightning current. According to a BIL of 145 kV (belonging to an insulation distance of 270 mm) only lightning currents of 130 kA can cause flashover between OCS and civil structure. Equation (15) gives the number of flashovers for two sides of a civil structure:
( )010
2 51 iIPxNN bds >⋅⋅= (15)
with xb the length of the first catenary field after the surge arrester in m and i0 = 130 kA. Between Civil Structure and Surge Arrester A low cost solution is placing the surge arrester on the first catenary pole after the civil structure. This results in a low impedance path towards earth formed by the metal construction. However, when the first pole is over 15 meters away from the civil structure, a negative effect is introduced by the possibility of a direct lightning strike. The relationship between lightning current and the radius rs is given in Equation (3). Equation (16) describes a balloon with middle point (a,b,c) used to calculate the maximum radius that leads to a direct strike on the OCS.
( ) ( ) ( ) 2222srczbyax =+++++ (16)
The position of the OCS is estimated in Equation (17):
exdz +⋅= (17) The point where the balloon touches the OCS is given by Equation (18):
( ) ( )222 byaxr
axd
xz
s +−+−
+==
∂∂
(18)
Based on Equation (18) the radius rs of the lightning current and, with that, the number of direct strikes between civil structure and surge arrester Nds2 are calculated for both sides of a civil structure:
( )( )0110
2 52 iIPxNN ads >−⋅⋅= (19)
with N being the total number of direct strikes in an OCS, see Equation (1), and xa the distance between the first pole and the civil structure. For indirect lightning strikes, the lightning-induced voltages were calculated using the LIOV computer code.
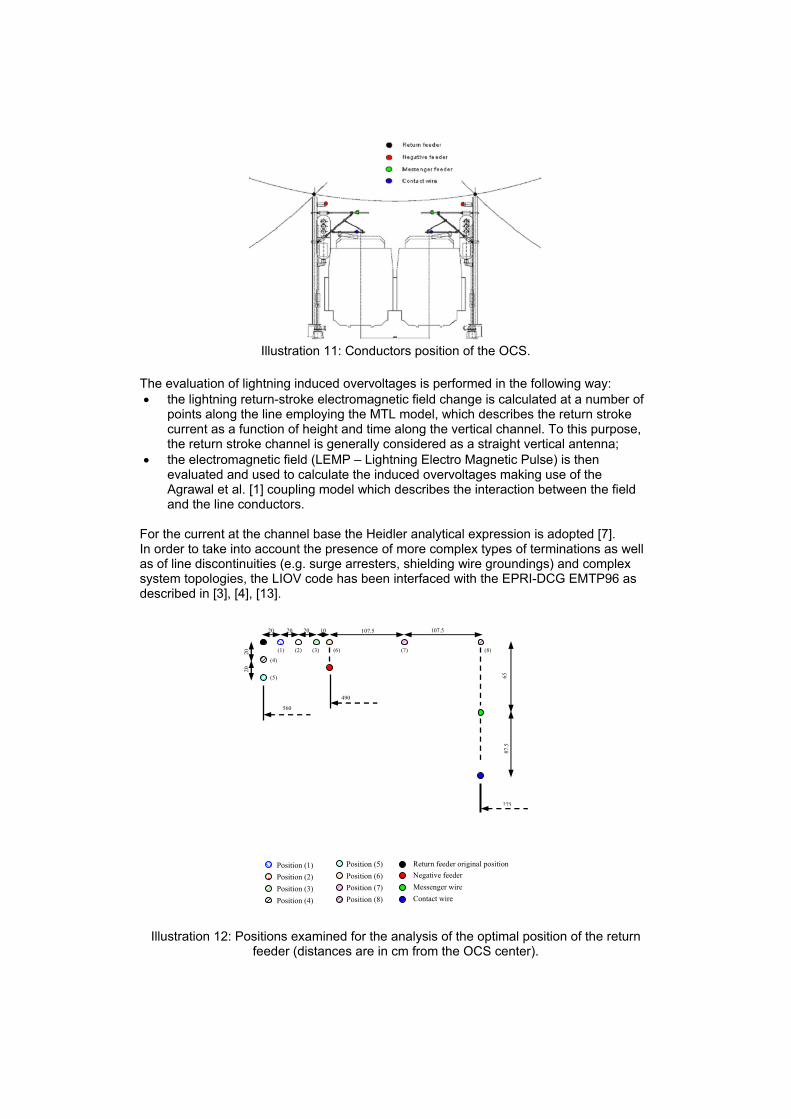
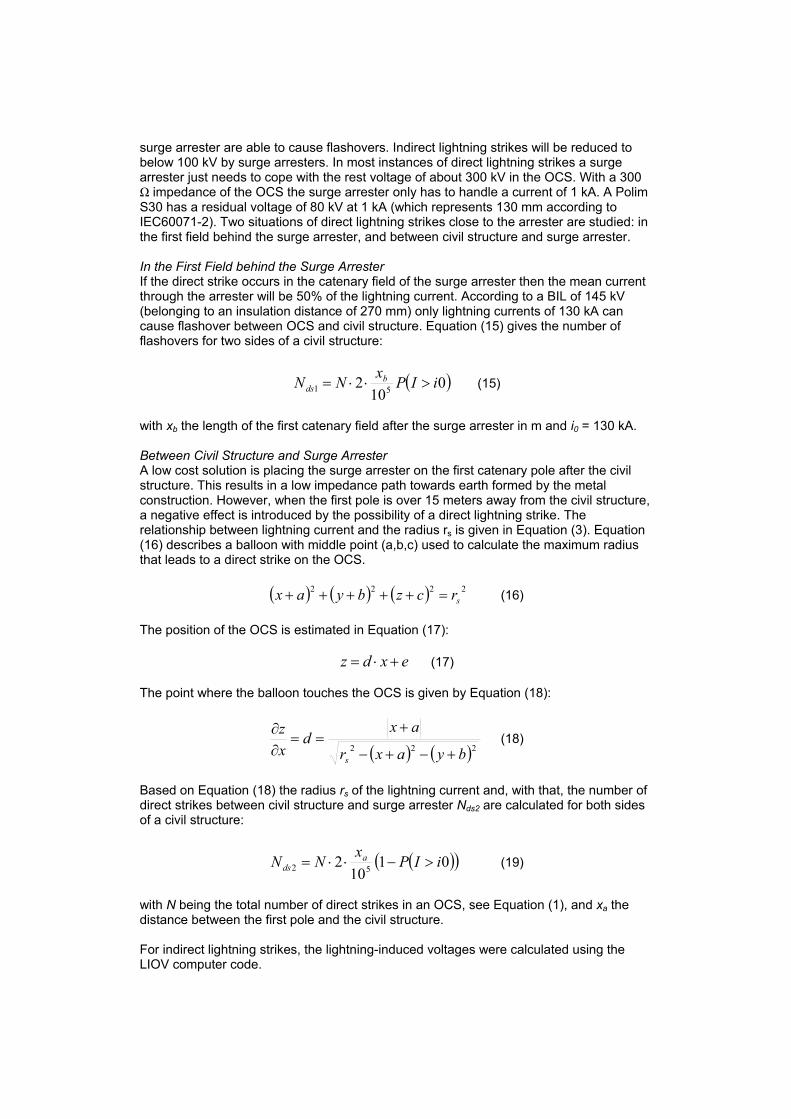
Illustration 11: Conductors position of the OCS.
The evaluation of lightning induced overvoltages is performed in the following way: • the lightning return-stroke electromagnetic field change is calculated at a number of
points along the line employing the MTL model, which describes the return stroke current as a function of height and time along the vertical channel. To this purpose, the return stroke channel is generally considered as a straight vertical antenna;
• the electromagnetic field (LEMP – Lightning Electro Magnetic Pulse) is then evaluated and used to calculate the induced overvoltages making use of the Agrawal et al. [1] coupling model which describes the interaction between the field and the line conductors.
For the current at the channel base the Heidler analytical expression is adopted [7]. In order to take into account the presence of more complex types of terminations as well as of line discontinuities (e.g. surge arresters, shielding wire groundings) and complex system topologies, the LIOV code has been interfaced with the EPRI-DCG EMTP96 as described in [3], [4], [13].
Illustration 12: Positions examined for the analysis of the optimal position of the return
feeder (distances are in cm from the OCS center).
560
20 107.5
275
490
20 20 10 107.5
Position (1) Position (2)
Return feeder original position
Position (3) Position (4)
Position (5) Position (6) Position (7) Position (8)
Negative feeder Messenger wire Contact wire
20
20
65
87.5
(1) (2) (3)
(4)
(5)
(6) (7) (8)
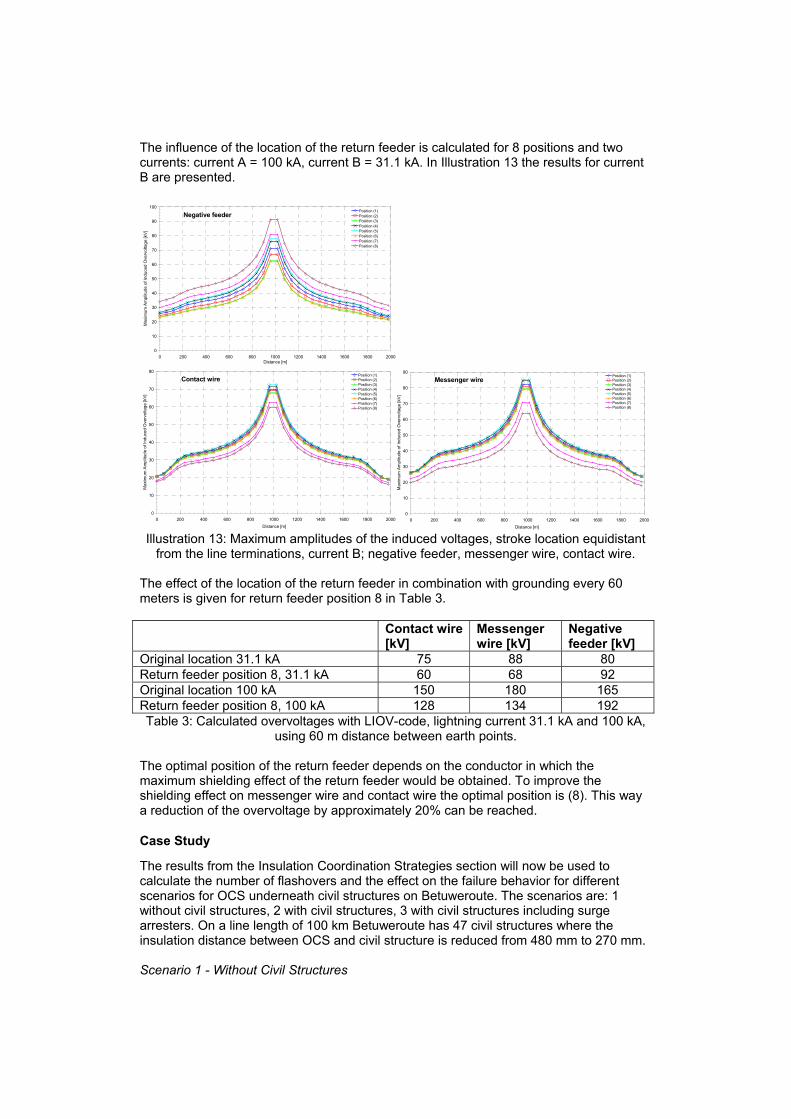
The influence of the location of the return feeder is calculated for 8 positions and two currents: current A = 100 kA, current B = 31.1 kA. In Illustration 13 the results for current B are presented.
Negative feeder
0
10
20
30
40
50
60
70
80
90
100
0 200 400 600 800 1000 1200 1400 1600 1800 2000Distance [m]
Max
imum
Am
plitu
de o
f Ind
uced
Ove
rvol
tage
[kV]
Position (1)Position (2)Position (3)Position (4)Position (5)Position (6)Position (7)Position (8)
Contact wire
0
10
20
30
40
50
60
70
80
0 200 400 600 800 1000 1200 1400 1600 1800 2000Distance [m]
Max
imum
Am
plitu
de o
f Ind
uced
Ove
rvol
tage
[kV]
Position (1)Position (2)Position (3)Position (4)Position (5)Position (6)Position (7)Position (8)
Illustration 13: Maximum amplitudes of the induced voltages, stroke location equidistant
from the line terminations, current B; negative feeder, messenger wire, contact wire. The effect of the location of the return feeder in combination with grounding every 60 meters is given for return feeder position 8 in Table 3. Contact wire
[kV] Messenger wire [kV]
Negative feeder [kV]
Original location 31.1 kA 75 88 80 Return feeder position 8, 31.1 kA 60 68 92 Original location 100 kA 150 180 165 Return feeder position 8, 100 kA 128 134 192 Table 3: Calculated overvoltages with LIOV-code, lightning current 31.1 kA and 100 kA,
using 60 m distance between earth points. The optimal position of the return feeder depends on the conductor in which the maximum shielding effect of the return feeder would be obtained. To improve the shielding effect on messenger wire and contact wire the optimal position is (8). This way a reduction of the overvoltage by approximately 20% can be reached.
Case Study
The results from the Insulation Coordination Strategies section will now be used to calculate the number of flashovers and the effect on the failure behavior for different scenarios for OCS underneath civil structures on Betuweroute. The scenarios are: 1 without civil structures, 2 with civil structures, 3 with civil structures including surge arresters. On a line length of 100 km Betuweroute has 47 civil structures where the insulation distance between OCS and civil structure is reduced from 480 mm to 270 mm. Scenario 1 - Without Civil Structures
Messenger wire
0
10
20
30
40
50
60
70
80
90
0 200 400 600 800 1000 1200 1400 1600 1800 2000Distance [m]
Max
imum
Am
plitu
de o
f Ind
uced
Ove
rvol
tage
[kV
]
Position (1)Position (2)Position (3)Position (4)Position (5)Position (6)Position (7)Position (8)
The total number of strikes leading to flashover can be calculated for a 25 kVAC OCS with standard insulation distance of 480 mm (BIL = 250 kV) by Equation (20):
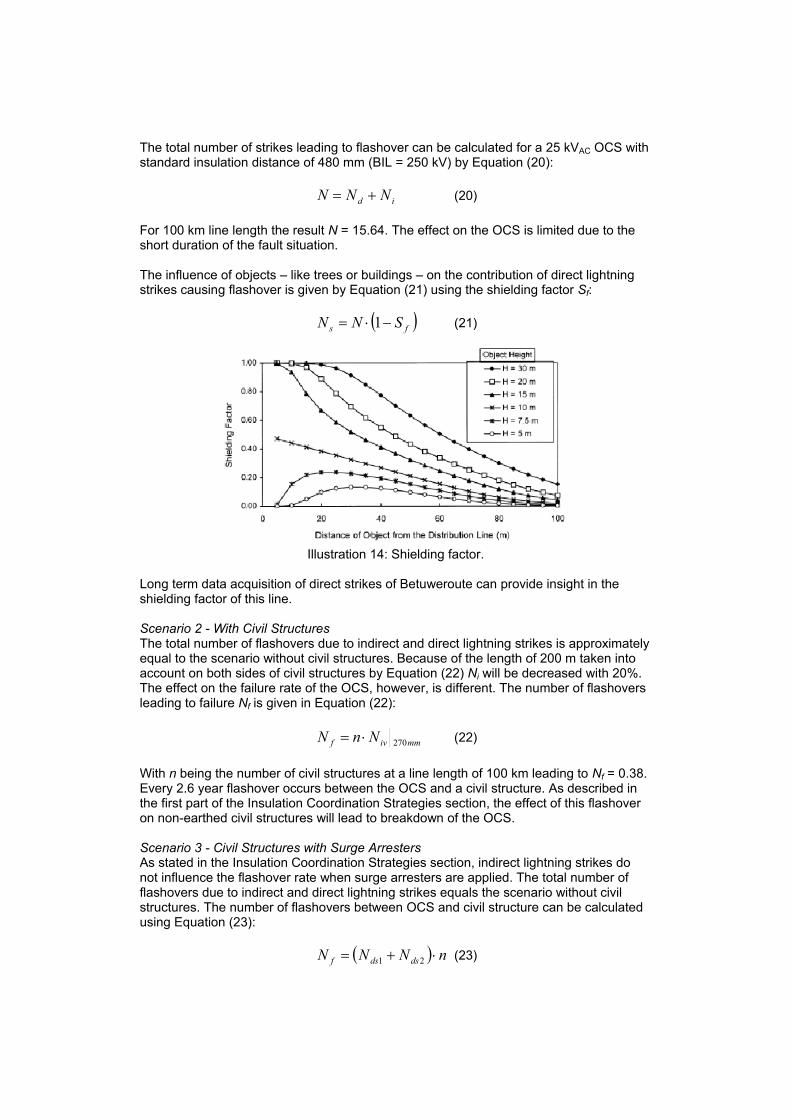
id NNN += (20) For 100 km line length the result N = 15.64. The effect on the OCS is limited due to the short duration of the fault situation. The influence of objects – like trees or buildings – on the contribution of direct lightning strikes causing flashover is given by Equation (21) using the shielding factor Sf:
( )fs SNN −⋅= 1 (21)
Illustration 14: Shielding factor.
Long term data acquisition of direct strikes of Betuweroute can provide insight in the shielding factor of this line. Scenario 2 - With Civil Structures The total number of flashovers due to indirect and direct lightning strikes is approximately equal to the scenario without civil structures. Because of the length of 200 m taken into account on both sides of civil structures by Equation (22) Ni will be decreased with 20%. The effect on the failure rate of the OCS, however, is different. The number of flashovers leading to failure Nf is given in Equation (22):
mmivf NnN 270⋅= (22) With n being the number of civil structures at a line length of 100 km leading to Nf = 0.38. Every 2.6 year flashover occurs between the OCS and a civil structure. As described in the first part of the Insulation Coordination Strategies section, the effect of this flashover on non-earthed civil structures will lead to breakdown of the OCS. Scenario 3 - Civil Structures with Surge Arresters As stated in the Insulation Coordination Strategies section, indirect lightning strikes do not influence the flashover rate when surge arresters are applied. The total number of flashovers due to indirect and direct lightning strikes equals the scenario without civil structures. The number of flashovers between OCS and civil structure can be calculated using Equation (23):
( ) nNNN dsdsf ⋅+= 21 (23)

The mean length of the first field next to a civil structure is 35 m resulting in Nds1 = 0.0003. Equation (16) to (19) have been calculated for 47 civil structures leading to n*Nds2 = 0.024. Every 28 years flashover occurs between the OCS and a civil structure (Nf = 0.036). Nevertheless, application of surge arresters also introduces failure of the OCS. In the following table information on MTBF from different sources is provided. Calculations were made with the minimum value of the prescription of ProRail and the worst case value of the manufacturers.
Source MTBF [hours] Assumption of prescription of ProRail 20.000.000 BBRail “minor failures” 50.000.000 Tridelta 118.260.000
Table 4: MTBF information surge arresters. In the case that all n = 47 civil structures have nsa = 8 surge arresters, the number of failures is given by Equation (24):
safsa nnMTBF
N ⋅⋅⋅
=24365
(24)
The result of the failure of surge arrester together with the positioning of surge arresters – Nf + Nfsa – is presented in Table 5. Arrangement of arresters MTBF [years]
Ideal placing of surge arresters 5.7 – 12.8
Placing accordingly on existing poles of the catenary 5.2 – 10.1 Placing accordingly on existing poles of the catenary including reduction of surge arrester on the negative feeder at all civil structures. 8.7 – 14.8 Table 5: Result of the calculation method on 100 km freight line (Betuweroute) including
47 civil structures based on MTBF-information ProRail (left) and BBRail (right).
Conclusions
This study presents three strategies for dealing with tight insulation distances: 1 accepting a lower breakdown voltage, 2 increasing the withstand voltage, and 3 limiting the surge voltages. Acceptance of a lower breakdown voltage is possible only when the part of the OCS with lower breakdown voltage is able to withstand multiple flashovers during its lifetime. An increase in withstand voltage can be obtained by applying additional products, such as foam or the use of special products like field steering components. Not much is known, however, about the long term behavior of foam in strongly polluted areas. Increasing the withstand voltage is a powerful method for (upgraded) 25 kVAC lines coping with insulation distances between 100 and 200 mm in combination with surge arresters. The most powerful solution of dealing with tight insulation distances is obtained by application of surge arresters. However, surge arresters have limited MTBF, and should therefore be applied only on the messenger wire and contact wire. Negative feeders should be placed in such a way that an insulation distance of 480 mm is guaranteed.
Acknowledgements
The study performed by Prof. Dr. Carlo Alberto Nucci is a product of a research agreement between Delft University of Technology and the University of Bologna. The presented laboratory results are part of a larger study performed for the Dutch Rail Infra Manager ProRail and was subsidized by the Dutch Ministry of Economic Affairs via Senter.
References
[1] A.K. Agrawal, H.J. Price, S.H. Gurbaxani, “Transient response of a multiconductor transmission line excited by a nonuniform electromagnetic field”, IEEE Trans. on EMC, Vol. EMC-22, No. 2, pp. 119-129, May 1980.
[2] M. Beyer, W. Boeck, K. Möller en W. Zaengl, “Hochspannungstechnik, Theoretische und praktische Grundlagen”, Berlijn, 1986.
[3] A. Borghetti, J.A. Gutierrez, C.A. Nucci, M. Paolone, E. Petrache, F. Rachidi, “Lightning-induced voltages on complex distribution systems: models, advanced software tools and experimental validation”, in presso in Journal of Electrostatics, Elsevier.
[4] A. Borghetti, J.A. Gutierrez, C.A. Nucci, M. Paolone, E. Petrache, F. Rachidi, “Software tools for the calculation of lightning-induced voltages on complex distribution systems”, Proc. 26th International Conference on Lightning Protection, Krakow, 2002.
[5] EN 50124-1: Railway applications - Insulation Coordination, 1995; EN50124-2: Railway applications - Overvoltages and related Protection, 1995.
[6] E.H.R. Gaxiola, “Dielectric Breakdown in Insulating Gases, Space Charge Effects and Non-Uniform Fields”, PhD-thesis, Eindhoven University of Technology, 1999.
[7] F. Heidler, “Analytische Blitzstromfunktion zur LEMP- Berechnung“, (in German), paper 1.9, pp. 63-66, Munich, September 16-20, 1985.
[8] IEC 60-1; High voltage test techniques. [9] IEEE Guide for Improving the Lightning Performance of Electric Power Overhead
Distribution Lines - IEEE Std 1410-1997. [10] IEEE Guide for the Application of Insulation Coordination – IEEE Std 1313.2-
1999. [11] IEEE Guide for the Application of Metal-Oxide Surge Arresters for Alternating-
Current Systems. IEEE Std. C62.22-1997. [12] C.A. Nucci, F. Rachidi, M. Ianoz and C. Mazzetti, “Lightning-induced voltages on
overhead power lines”, IEEE Trans. Electromagnetic Compatibility, Vol. 35, Feb. 1993.
[13] M. Paolone, “Modeling of Lightning-Induced Voltages on Distribution Networks for the Solution of Power Quality Problems, and Relevant Implementation in a Transient Program”, PhD Thesis, University .of Bologna, 2001.
[14] R.M. Paulussen, P.H.F. Morshuis, “25 kV and civil assets”. XIIIth International Symposium on High Voltage Engineering, Netherlands 2003.
[15] F. Rachidi, C.A. Nucci, M. Ianoz, C. Mazzetti, “Influence of a lossy ground on lightning-induced voltages on overhead lines”, IEEE Trans. on Electromagnetic compatibility, Vol. 38, No. 3, pp. 250-263, August 1996.