Calculation and Visualisation of Radar Protection Zone · Proper visualization of ... and Google...
9
Abstract—Radar is a very important device, e.g. for flight control. In the case, the airport is located close to the settlement, it can influence people living there. Identification of radar protection zone and its intersection with surrounding buildings are useful spatial analyses which can support decision-making both in public administration and personal life of people. Proper visualization of analyses results is a very important step which helps people to understand the results. A possible way how to model radar protection zone, surrounding buildings and how to identify their intersection is described in the article. A strong attention is paid to the final visualisation of obtained results. ArcGIS Desktop, ArcScene, Google SketchUp and 3ds Max were used as software tools. Keywords—Radar protection zone, spatial analyses, visibility. visualisation. I. INTRODUCTION OST of the mankind activities are somehow located in the space [1]. Location of an activity, object or phenomena can be crucial information which can significantly influence further decision-making process. Wrong information can cause incorrect decisions with negative impacts including damages and lives losses. Many objects require protection zone to prevent such damages. Radar can be given as an example although it is a very useful device. It is a system which allows people to identify both fixed and moving objects, e.g. in the case of Manuscript received June 12, 2011: Revised version received February 12, 2012. This work was supported in parth by MV CR under the project No VF20112015018, and by the Grant Agency of the Czech Republic under Grant project No. 402/09/0219 and by Student Grant Agency of University of Pardubice. J. Hovad is with the Institute of System Engineering and Informatics, Faculty of Economics and Administration, University of Pardubice, Studentska 95, 532 10, Pardubice, Czech Republic as a Ph.D. student (corresponding author, phone: +420-466036070; fax: +420-466036010; e- mail: jitka.komarkova@ upce.cz). J. Komarkova is with the Institute of System Engineering and Informatics, Faculty of Economics and Administration, University of Pardubice, Studentska 95, 532 10, Pardubice, Czech Republic (corresponding author, phone: +420-466036070; fax: +420-466036010; e-mail: jitka.komarkova@ upce.cz). P. Sedlak is with the Institute of System Engineering and Informatics, Faculty of Economics and Administration, University of Pardubice, Studentska 95, 532 10, Pardubice, Czech Republic (e-mail: pavel.sedlak@ upce.cz). M. Tulacka is with he Institute of System Engineering and Informatics, Faculty of Economics and Administration, University of Pardubice, as a MsC. student. flight control. History of the radar systems began in the very beginning of the 20 th century [2], [3]. In this case GIS represent a very suitable tool which allows identification of real and potential conflicts and calculate limits of area development. In this article, a very brief description of radar systems is provided in the beginning. It is followed by the description of how to identify and visualize intersects of buildings (mostly houses) with radar protection zone by means of ArcGIS Desktop, ArcScene and Google SketchUp. In the end, the final visualisation in 3ds Max is deeply described. II. RADAR AND ITS PROTECTION ZONE Radar is a tool (or system) which is able to detect objects by means of electromagnetic (radio) waves. Of course, only selected parts of electromagnetic spectrum are suitable, i.e. only selected frequency bands (wavelength ranges) are used. Only frequencies from 1.3 GHz to 24 GHz are used by radar systems [4]. Radars have been explored and used since the beginning of 20th century. The first operating device was built in 1904; World War II speeded up its further development [2], [3]. The acronym RADAR was proposed by the U.S. Navy in 1940; it comes from “radio detection and ranging” [3]. One of the contemporary utilization of radars is to control air traffic [5] or airport traffic [6]. Airports are today situated close to the cities and villages so some problems connected to conflict of radar protection zone and surrounding urban area may occur. Radar protection zone should protect people from health impacts of non-ionizing radiation (e.g. [7]) so it is quite important to correctly calculate it. For the further development of region it is very important to identify limits caused by radar protection zone. GIS can be used to analyse visibility, i.e. to analyse exposure to the Sun light [8] or to calculate lines of sight in the case of wireless networks [9]. Analyses and visualisation of radar data of lightning strikes [10] or satellite tracking [11] are other examples of joint GIS and radar utilization. Adaptive Kalman procedure can be used for synthetic aperture radar (SAR) data resolution improvement [12]. Final visualisation of an area of interest by means of maps, 3D models and animations can provide easily understandable outputs. For example Yang et al. [13] proposed utilization of ArcObjects (ArcGIS extension) for the three-dimensional visualisation of radar signal coverage. The next important advantage of GIS applications is a possibility to use visual Calculation and Visualisation of Radar Protection Zone Jan Hovad, Jitka Komarkova, Pavel Sedlak, and Martin Tulacka M INTERNATIONAL JOURNAL OF MATHEMATICS AND COMPUTERS IN SIMULATION Issue 1, Volume 6, 2012 213
Transcript of Calculation and Visualisation of Radar Protection Zone · Proper visualization of ... and Google...
Abstract—Radar is a very important device, e.g. for flight
control. In the case, the airport is located close to the settlement, it can influence people living there. Identification of radar protection zone and its intersection with surrounding buildings are useful spatial analyses which can support decision-making both in public administration and personal life of people. Proper visualization of analyses results is a very important step which helps people to understand the results. A possible way how to model radar protection zone, surrounding buildings and how to identify their intersection is described in the article. A strong attention is paid to the final visualisation of obtained results. ArcGIS Desktop, ArcScene, Google SketchUp and 3ds Max were used as software tools.
Keywords—Radar protection zone, spatial analyses, visibility. visualisation.
I. INTRODUCTION
OST of the mankind activities are somehow located in the space [1]. Location of an activity, object or
phenomena can be crucial information which can significantly influence further decision-making process. Wrong information can cause incorrect decisions with negative impacts including damages and lives losses.
Many objects require protection zone to prevent such damages. Radar can be given as an example although it is a very useful device. It is a system which allows people to identify both fixed and moving objects, e.g. in the case of
Manuscript received June 12, 2011: Revised version received February 12,
2012. This work was supported in parth by MV CR under the project No VF20112015018, and by the Grant Agency of the Czech Republic under Grant project No. 402/09/0219 and by Student Grant Agency of University of Pardubice.
J. Hovad is with the Institute of System Engineering and Informatics, Faculty of Economics and Administration, University of Pardubice, Studentska 95, 532 10, Pardubice, Czech Republic as a Ph.D. student (corresponding author, phone: +420-466036070; fax: +420-466036010; e-mail: jitka.komarkova@ upce.cz).
J. Komarkova is with the Institute of System Engineering and Informatics, Faculty of Economics and Administration, University of Pardubice, Studentska 95, 532 10, Pardubice, Czech Republic (corresponding author, phone: +420-466036070; fax: +420-466036010; e-mail: jitka.komarkova@ upce.cz).
P. Sedlak is with the Institute of System Engineering and Informatics, Faculty of Economics and Administration, University of Pardubice, Studentska 95, 532 10, Pardubice, Czech Republic (e-mail: pavel.sedlak@ upce.cz).
M. Tulacka is with he Institute of System Engineering and Informatics, Faculty of Economics and Administration, University of Pardubice, as a MsC. student.
flight control. History of the radar systems began in the very beginning of the 20th century [2], [3]. In this case GIS represent a very suitable tool which allows identification of real and potential conflicts and calculate limits of area development.
In this article, a very brief description of radar systems is provided in the beginning. It is followed by the description of how to identify and visualize intersects of buildings (mostly houses) with radar protection zone by means of ArcGIS Desktop, ArcScene and Google SketchUp. In the end, the final visualisation in 3ds Max is deeply described.
II. RADAR AND ITS PROTECTION ZONE
Radar is a tool (or system) which is able to detect objects by means of electromagnetic (radio) waves. Of course, only selected parts of electromagnetic spectrum are suitable, i.e. only selected frequency bands (wavelength ranges) are used. Only frequencies from 1.3 GHz to 24 GHz are used by radar systems [4]. Radars have been explored and used since the beginning of 20th century. The first operating device was built in 1904; World War II speeded up its further development [2], [3]. The acronym RADAR was proposed by the U.S. Navy in 1940; it comes from “radio detection and ranging” [3].
One of the contemporary utilization of radars is to control air traffic [5] or airport traffic [6]. Airports are today situated close to the cities and villages so some problems connected to conflict of radar protection zone and surrounding urban area may occur. Radar protection zone should protect people from health impacts of non-ionizing radiation (e.g. [7]) so it is quite important to correctly calculate it. For the further development of region it is very important to identify limits caused by radar protection zone.
GIS can be used to analyse visibility, i.e. to analyse exposure to the Sun light [8] or to calculate lines of sight in the case of wireless networks [9]. Analyses and visualisation of radar data of lightning strikes [10] or satellite tracking [11] are other examples of joint GIS and radar utilization. Adaptive Kalman procedure can be used for synthetic aperture radar (SAR) data resolution improvement [12].
Final visualisation of an area of interest by means of maps, 3D models and animations can provide easily understandable outputs. For example Yang et al. [13] proposed utilization of ArcObjects (ArcGIS extension) for the three-dimensional visualisation of radar signal coverage. The next important advantage of GIS applications is a possibility to use visual
Calculation and Visualisation of Radar Protection Zone
Jan Hovad, Jitka Komarkova, Pavel Sedlak, and Martin Tulacka
M
INTERNATIONAL JOURNAL OF MATHEMATICS AND COMPUTERS IN SIMULATION
Issue 1, Volume 6, 2012 213

programming languages to create an analysis workflow [14].
III. SPATIAL ANALYSES TO IDENTIFY OBJECTS INTERFERING
WITH RADAR PROTECTION ZONE
The study is focused on a real area of interest. It was initiated by citizens and public administration authorities. The whole procedure proposed for this purpose consists of the following steps: 1) Problem identification: detection of conflicts of airport
radar protection zone and buildings in surrounding 2) Area of interest – its description 3) Data collection and pre-processing:
• Collection of topographical data, setting the coordinate system. Data modelling should be included in the more complex cases • Precise localisation of radar • Estimation of height of objects of interest – estimation/measurement during field research or identification from existing documentation • Preparation of the digital terrain model (DTM), in the TIN (triangulated irregular network) structure
4) Particular analyses: • Modelling radar protection zone according to its documentation • Placement of buildings into DTM • Visualisation of the situation, i.e. terrain, buildings and protection zone should be visualised; in 2D and 3D • Finding intersection of protection zone and buildings
5) Visualisation and interpretation of results • 2D visualisation of results by means of maps • 3D visualisation of results by means of ArcScene and Google SketchUp • 3D visualisation of results by means of 3ds Max • Animation of results
All the proposed steps are further described in the following
chapters
A. Problem Identification
Proposal of how to detect conflicts (intersection of airport radar protection zone and buildings in the surrounding) is the main goal of the whole study. Airport radar is located close to inhabited places. The distance from the radar to the closest houses is approx. 700 m. It is necessary to model radar protection zone and signal spreading to identify places where it is impossible to build new houses and to set height limits for buildings in the surrounding.
B. Model Area of Interest
The model area of interest of this study covers municipalities Třebosice and Staré Jesenčany – see Fig. 1. The municipalities are located close to the city of Pardubice, more precisely they are located to the south of the city. The area of interest is situated to the south from the international airport with the mixed operation – it provides both military and civil services. In the north of the airport there is the city of
Pardubice located. In the south, only small villages are situated. Třebosice and Staré Jesenčany are less then 1 km distant from the airport, namely from its runway. The surrounding terrain is flat and the land is mostly used as cultivated fields. The situation is shown in the Fig. 1.
Fig. 1 – Area of interest (Source: Authors)
C. Data Collection and Pre-processing
At first, an overview of all available data in both digital and paper form must be done. In the case of more national coordinate systems, one of them must be selected for the further work. Some comments and the most important requirements on the data follow: • Topographic data including elevation in a high level of
precision are required. In the case of this study, input data were in the scales 1 : 10 000 and 1 : 2 880 (parcels).
• Radar has to be precisely located within used topographical data. The coordinates can be verified e.g. by comparison with ortophotomaps.
• Assessed houses must be correctly located. A plan view of all houses must be covered be the data too. The data were in the scale 1 : 10 000
• Information about buildings height can be estimated during field research, if it is not available from existing documentations. This approach was used during our study.
During the pre-processing phase, DTM was prepared from
contours (scale 1 : 10 000) by means of Create TIN tool in ArcGIS Desktop. It means triangulated irregular network data structure was used. Utilization of TIN allows users to create
INTERNATIONAL JOURNAL OF MATHEMATICS AND COMPUTERS IN SIMULATION
Issue 1, Volume 6, 2012 214

a model of surface which will correctly model buildings and their heights.
D. Data Analyses
ArcGIS Desktop 10 was used to run the following steps. The whole procedure is shown in the Fig. 3. Only tool and the most important inputs/outputs are drawn.
The first step is adding buildings (including their heights) into DTM. AddBuildingsToTIN script was used to add buildings to DTM and consequently create the digital model of the surface.
Modelling of radar protection zone – a gradient angle of a radar signal spreading and the distance of the beginning of gradient must be known to model signal spreading. Then, trigonometric function can be used to model protection zone. The main principle of radar protection zone calculation and parameters used for calculations in this study are shown in the following Fig. 2.
Fig. 2 – The most important parameters for radar protection zone calculation [15]
The first visualisation of results on the screen and by means
of cartographic outputs takes part at this moment to allow the first visual interpretation.
Viewshed tool can be used to Identify and visualise buildings intersecting with radar protection zone. This tool determines visibility of target cells by means of the calculation of difference between elevation of one cell (the observer point) and the next cell (the target cell). It requires input data in a form of raster (grid). So, TIN To Raster tool was used to convert the previously obtained TIN model of surface into raster. Radar was set as an observer point. Add Surface Information tool was used to automatically add elevation to the radar point from DEM. Both azimuth and radius values were set to limit the analysis in the space. Parameter Vert2 was set as well to limit the lower horizontal angle.
Utilization of Intersect 3D lines with multipatch tool is the next step. Set of points of intersect of surface model and radar protection zone is an output. This analysis consists of several steps. TIN surface model (i.e. the one including buildings) is used as an input data layer in the beginning. Output polygon data layer is created by means of Interpolate Polygon To Multipatch tool. The output layer bears information about elevation. Next, point layers containing radar coordinates and representing protection zone in the selected distances were created. Again, all data layers contain elevation. The data were used in the next step.
Fig. 3 – The proposed analysis procedure (Source: Authors)
INTERNATIONAL JOURNAL OF MATHEMATICS AND COMPUTERS IN SIMULATION
Issue 1, Volume 6, 2012 215

The tool Construct Sight Lines was used to create lines from the points – it created lines between each of the observer points and each of the target points. Intersect of the lines with radar protection zone was calculated by means of the Intersect tool. Elevation values were added to the resulting points. The sight lines were converted to the point data layer and the tool Construct Sight Lines was used once more to create the final lines representing radar protection zone. Next, the tool Intersect 3D lines With Multipatch was used to obtain the new point data layer containing all points of intersection of the surface model and radar protection zone (multipatch was obtained during the first step of this analysis. Finally, the tool Add Z Information was used to add the elevation to each point.
Identification of the intersecting parts of buildings and calculation of their size is the next step. At first, elevation obtained during the previous analysis, must be added to the polygon layer representing buildings. This step is based on the location of buildings and points of intersection. Then, the Polygon To Raster tool is used to transform polygons representing buildings into raster. Elevation must be set as a cell value. Very fine resolution was chosen (cell size = 0.5 m) to keep shapes of the buildings as precisely as it is possible. The next step is based on a simple subtraction. Map algebra allows us to subtract altitudes of the surface model and points of intersection to get only parts of buildings which are inside the protection zone. Back transformation to polygons (Raster To Polygon) and calculating their area (Calculate Areas) provides the required results.
The next step is a calculation of acceptable heights of new buildings (with respecting this height a building will not intersect with a protection zone (see Fig. 4). In this case, cadastral data in the scale 1 : 2 880 were used too. The secure heights were calculated as a difference between terrain elevation and radar protection zone. The 41 % of polygons (from 778 polygons in total) belong to the interval 6 – 10 m, i.e. it is the most suitable height for buildings. It is followed by the interval 10 – 12 m (12 %) [15].
Fig. 4 – Secure heights of new buildings (units: meters) [15]
E. Visualisation and Interpretation of Results in ArcScene and Google SktechUp
At first, visualisation by means of maps, in ArcScene, Google SketchUp and using both ArcScene and Google SketchUp together is used. Outputs clearly show situation in the area of interest. The final output, created in ArcScene and using models from Google SketchUp, is shown in the following Fig. 5 to provide one example of possible outputs.
It is good to remember that digital surface model should be visualized, i.e. terrain including all buildings, trees and all other landscape features should be covered.
Fig. 5 – Final visualisation in ArcScene, using models from Google SketchUp [15]
F. Visualisation in 3ds Max
Visualisation of showed example requires specialized software. Using ArcGIS respectively ArcScene is used only to create a digital terrain model (DTM). For the following operations DTM is used as a base for application 3D Studio Max 2011, renderer V-Ray 2.0 and any graphic editor to edit textures. How to use the DTM for the visualisation will be shown in the following paragraphs. The problems which author encountered are also discussed.
Visualisation scheme
The progress for visualisation can be generally imagined as an illustrated diagram (Fig. 6)
INTERNATIONAL JOURNAL OF MATHEMATICS AND COMPUTERS IN SIMULATION
Issue 1, Volume 6, 2012 216

Fig. 6 – Visualisation scheme (Source: Authors)
Import of DTM into the 3D Studio Max
Because of the previous progress made in Google Sketchup 8.0 the export of data into the native file format was made in this application. An important aspect for the export is the version of application. Free software licenses allows to export only formats like Collada (*.dae) or Google Earth (*.kmz). Paid license expands this options widely. For the choice there are included formats like 3D Studio (*.3ds), AutoCad (*.dwg) and many others. There are many applications on the market suitable for visualisation. With 3D Studio Max which was already mentioned there is also Autodesk Maya, Rhino, Softimage or freely available Blender. Software from Autodesk can be obtained even in the student version. The use is free of charge for non-commercial purposes. After importing the DTM into the 3D Studio Max there must be performed a scale check or global modification of the model to match the real world distance units. This can be easily verified using Google map services. Spatial resolution can be seen on the model which consists of contour lines (Fig. 7).
Because of relatively small elevation differences in the area of interest, the rest of the surface is automatically divided, interpolated using the triangles. The accuracy is sufficient. The surface can be optionally divided further - such as
agricultural, residential areas etc.. Subdivision of surface helps with texturing or mounting the models.
Fig. 7 – Surface interpolation with triangles in the 3ds Max (Source: Authors)
Global parameters and setup of the scene
The scene is set using the render plugin from ChaosGroup called V-Ray 2.0. Important parameters are: the output resolution 720p (1280×720, 16:9), work in an environment with gamma 2.2, used anti-aliasing filter is adaptive DMC Catmul-Rom with size of the sample equal to min = 1, max = 8, simulation of skylight by V-Ray Sky, linear mapping on, realistic simulation of camera (V-Ray physical camera). The basic element consists day light system that includes a simulation of the Sun, thus it includes the Earth's position and realistic simulation of light at any given time of year. Indirect illumination is calculated using Irradiance map and Light cache (primary/secondary engine). To work with such a large model is used 4 core i7 processor with support for HTT (8 cores), 16 GB of system memory and graphics card GeForce GTX 460. To take a full advantage of memory it was necessary to increase the base size of dynamic memory in V-Ray plugin from 400 MB to couple of GB. The model consumed about 10 GB of memory and constant reading from the hard drive would unnecessarily protracted time required to develop the project. Because of this the SATA III SSD drive with write speed of 500MB/s was used. This parameter proved to be crucial for fast and frequent store of the scene which size is close to 1 GB.
Creating models
The same rule is applied for the DTM. Formation of models is possible in any program that allows to export the data in one of the frequently used formats. Complex models whose shape can vary, for example because of mathematical description, are better to be modelled using parametrical modelling in software such as Autodesk Inventor 2011 (Fig. 8). Change of parameters allows fast and automatic model redraw or a quick and accurate creation of documentation. Models of houses were made in Google Sketch-Up and then imported into 3D Studio Max. Relatively complex models used for terrain environment like a grass and the fields were
INTERNATIONAL JOURNAL OF MATHEMATICS AND COMPUTERS IN SIMULATION
Issue 1, Volume 6, 2012 217
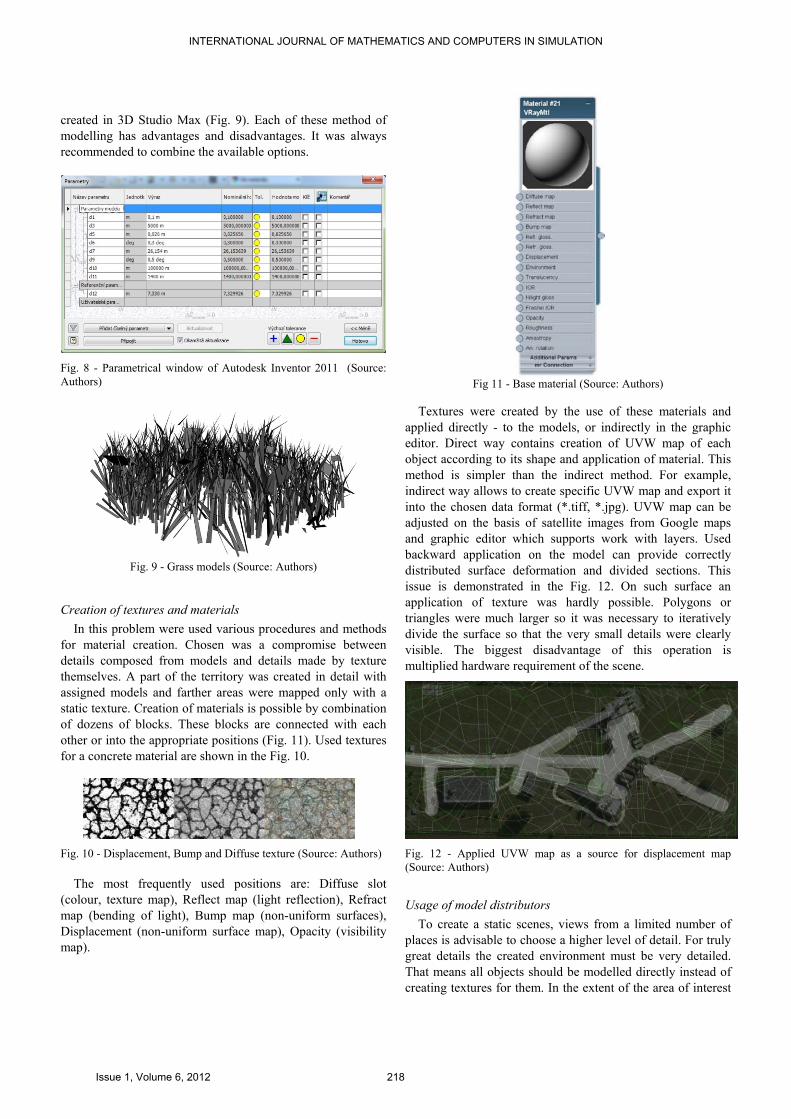
created in 3D Studio Max (Fig. 9). Each of these method of modelling has advantages and disadvantages. It was always recommended to combine the available options.
Fig. 8 - Parametrical window of Autodesk Inventor 2011 (Source: Authors)
Fig. 9 - Grass models (Source: Authors)
Creation of textures and materials
In this problem were used various procedures and methods for material creation. Chosen was a compromise between details composed from models and details made by texture themselves. A part of the territory was created in detail with assigned models and farther areas were mapped only with a static texture. Creation of materials is possible by combination of dozens of blocks. These blocks are connected with each other or into the appropriate positions (Fig. 11). Used textures for a concrete material are shown in the Fig. 10.
Fig. 10 - Displacement, Bump and Diffuse texture (Source: Authors)
The most frequently used positions are: Diffuse slot (colour, texture map), Reflect map (light reflection), Refract map (bending of light), Bump map (non-uniform surfaces), Displacement (non-uniform surface map), Opacity (visibility map).
Fig 11 - Base material (Source: Authors)
Textures were created by the use of these materials and applied directly - to the models, or indirectly in the graphic editor. Direct way contains creation of UVW map of each object according to its shape and application of material. This method is simpler than the indirect method. For example, indirect way allows to create specific UVW map and export it into the chosen data format (*.tiff, *.jpg). UVW map can be adjusted on the basis of satellite images from Google maps and graphic editor which supports work with layers. Used backward application on the model can provide correctly distributed surface deformation and divided sections. This issue is demonstrated in the Fig. 12. On such surface an application of texture was hardly possible. Polygons or triangles were much larger so it was necessary to iteratively divide the surface so that the very small details were clearly visible. The biggest disadvantage of this operation is multiplied hardware requirement of the scene.
Fig. 12 - Applied UVW map as a source for displacement map (Source: Authors)
Usage of model distributors
To create a static scenes, views from a limited number of places is advisable to choose a higher level of detail. For truly great details the created environment must be very detailed. That means all objects should be modelled directly instead of creating textures for them. In the extent of the area of interest
INTERNATIONAL JOURNAL OF MATHEMATICS AND COMPUTERS IN SIMULATION
Issue 1, Volume 6, 2012 218

is this process possible only partly. Time consumption is for one person very large. This activity starts by creating a set of unique models, such as 5 unique blades of grass, houses, stones or leaves. Textures must be correctly assigned to these models as it was described above. In the next step one of the distribution plugin is selected (Scatter, V-Ray Scatter or Multi Painter/Scatter). After setting the various parameters, probability of collisions, rotate/move/scale factor and many others to archive uniform or random distribution of small number of models, the large area is equipped. The Acropora software can be used for terrain modelling in high detail (grooves, ridges, streams ...). Usage of this software was not applied in this case.
Oppositely, for dynamic visualisation - animation, it is preferable to use less hardware-demanding process in terms of replacing the models for detailed textures.
Output selection
Creation of simple output, image from the scene, equipped with a large number of models, can be time consuming. Render times can reach several hours for one frame even when the high performance PC is used. In the case the output is the animation, user can reach times much higher in ranks of
several weeks or months. For this purpose there are computer clusters called computer farms available. User can upload all scene files directly to this cloud and wait much shorter time for the result. It is because of slightly increased CPU power which equals to couple of hundreds of interconnected computers. All renders in this scene were created on the single computer because the hardware requirements weren't so high. Scene includes only limited count of objects and views and it wasn't created for animation purposes. Creation of several outputs is task for couple of hours. The biggest advantage in advanced visualisation is possibility to split the output into the layers. These layers are used for further work with mathematical operators. Because of them there is a chance to combine inputs so the output varies. Because of this task there is no need to re-render all scenes again.
For example the adjustment of light can be created only by editing the render layer which contains the light information. Similarly can be performed adjustment in any other part of image, in shadows, reflections, refractions or colour of object. This procedure which requires fairly good knowledge of the problem can be done for example in Composite 2011.
Fig. 13 - View from village Staré Jesenčany (Source: Authors)
INTERNATIONAL JOURNAL OF MATHEMATICS AND COMPUTERS IN SIMULATION
Issue 1, Volume 6, 2012 219

Fig. 14 - Protected zone in the direction of Staré Jesenčany (Source: Authors)
Visualisation of protected zone of villages Staré Jesenčany and Třebosice
There have been created two views to create concrete visualisation of the protection zones. The first view (Fig. 13) shows the intrusion of protection zone with houses in the village of Staré Jesenčany. The second view (Fig. 14) is situated in an area of the radar signal source.
IV. CONCLUSION
People have to solve many spatially-oriented problems during their lives. GIS can be used as a tool significantly supporting the decision-making process. Identification of buildings which intersect protection zone of radar is an example. By means of suitable tools, available in GIS software, it is possible to find out intersecting buildings and sizes of the parts of buildings which are inside the protection zone. Next, it is possible to calculate in advance height of newly planned buildings to prevent their intersection with the protection zone.
Results of these analyses can be very interesting and important for many people. From the above described procedure it can be concluded that most of the analyses and visualisations must be run by GIS specialists and by means of special software tools. Anyway, GIS applications provide an environment to make the workflow easier and repeatable – visual programming languages [14]. In all cases, visualisation of obtained results of analyses is a very important step because it influences quality and understandability of results
by the target group of users. In the paper, at first the suitable analysis procedure for the
Czech conditions was proposed. It means, official Czech data sources were used. The complete way of data processing and analysis in ArcGIS Desktop is described. In the end, utilization of Google SketchUp and consequently 3D Studio Max are newly proposed to use to highly improve the visual quality of outputs.
Only the last step – selection of a house of interest can be easily implemented in user-friendly software tools, like Web-based GIS applications. Thus, GIS specialists have to focus on the good quality of results visualisation and suitable ways of their publishing. In many applications, both usability and security have to be taken into account to provide secure but easy-to-use access for the target group of users [16].
So, optimization of all obtained outputs for their secure and usable publishing by means of Web applications is planned for the future work.
REFERENCES [1] P. A. Longley, M. F. Goodchild, D. J. Maguire, and D. W. Rhind,
Geographic information systems and science. 2nd ed. New York: John Wiley & Sons, 2005, chap. 7 and 11.
[2] V. S. Chernyak, I. Immoreev, A Brief History of Radar, Aerospace and Electronic Systems Magazine, Vol. 24, Is. 9, 2009, pp. B1 - B32.
[3] M. Guarnieri, The Early History of Radar, Industrial Electronics Magazine, Vol. 4, Is. 3, 2010, pp. 36-42.
[4] J.M. Chaduc, G. Pogorel, The Radio Spectrum: Managing a Strategic Resource, John Wiley & Sons, 2008.
[5] D. M. A. Hussain, et al., A Framework Model through Data Flow Diagrams to Model an Air Traffic Control System, In: CIMMACS'07: Proceedings of the 6th WSEAS international conference on
INTERNATIONAL JOURNAL OF MATHEMATICS AND COMPUTERS IN SIMULATION
Issue 1, Volume 6, 2012 220

Computational intelligence, man-machine systems and cybernetics, Tenerife, Spain, December 14-16, WSEAS, 2007, pp. 231-236.
[6] T. Zelinka, M. Svitek, Identification of Communication Solution designated for Transport Telematic Applications, WSEAS Transactions on Communications, Vol. 7, Is. 2, 2008, pp. 114-122.
[7] L. Hardell, C. Sage, Biological effects from electromagnetic field exposure and public exposure standards, Biomedicine & Pharmacotherapy, Vol. 62, Is. 2, 2008, pp. 104-109.
[8] C. Chalkias, A. Faka, A GIS-based spatiotemporal analysis of the exposure to direct sun light on rural highways, WSEAS Transactions on Information Science and Applications, Vol. 7, Is. 1, pp. 142-151.
[9] F. Lazarakis, et al., A GIS-Based Methodology for Designing Wireless Links [online], In: Proc. WSEAS, Skiathos, September 2002. WSEAS, 2002. Available from: <http://www.wseas.us/e-library/conferences/skiathos2002/papers/447-389.pdf>
[10] R. Snow, M. Snow, N. Kufa, GIS Analysis of Lightning Strikes within a Tornadic Environment, In: Proc. of the 3rd IASME/WSEAS Int. Conf. on Energy, Environment, Ecosystems and Sustainable Development, Agios Nikolaos, Greece, July 24-26, 2007, WSEAS, 2007. pp. 466-471.
[11] S. Cakaj, Practical Horizon Plane and Communication Duration for Low Earth Orbiting (LEO) Satellite Ground Stations, WSEAS Transactions on Communications, Vol. 8, Is. 4, 2009, pp. 373-383.
[12] L. Li, et al, Adaptive Kalman Procedure for SAR High Resolution Image Reconstruction in the Planning Phase of Land Consolidation, WSEAS Transactions on Computers, Vol. 7, Is. 7, 2008, pp. 899-908.
[13] L.-S. Yang, et al., A Novel Three-dimensional Coverage Visualization System of Netted Radars Based on ArcObjects. In: Radar Conference 2009 IET International [online], 2009, [cited 2011-04-16]. Available from: <http://ieeexplore.ieee.org/xpl/freeabs_all.jsp?arnumber=5367544>. ISSN 0537-9989>.
[14] Z. Dobesova, Visual programming language in geographic information systems, In: Recent Researches in Applied Informatics, Proceedings of the 2nd International Conference on Applied Informatics and Computing Theory, AICT `11, Prague, WSEAS Press, 2011. pp. 276-280.
[15] M. Tulacka, Using GIS in Vizualization Radiolocation Signal in the Surroundings of Pardubice Airport, Master Thesis, Supervisor: Pavel Sedlak, University of Pardubice, 2011. Available in the Czech only (Title: Využití GIS při vizualizaci šíření radiolokačního signálu v okolí Letiště Pardubice).
[16] M. Hub, J. Čapek, R. Myšková, R. Roudn,. Usability versus security of authentication. In: International Conference on Communication and Management in Technological Innovation and Academic Globalization (COMATIA '10). Tenerife: WSEAS Press, 2010. pp. 57-61.
INTERNATIONAL JOURNAL OF MATHEMATICS AND COMPUTERS IN SIMULATION
Issue 1, Volume 6, 2012 221