Calculating Paint Area in Engineering Virtual Models
7
Abstract The maintenance of equipment painting in maritime oil platforms is an expensive and important activity, especially because the equipment is exposed to high corrosion rates due to the corrosive sea air. This paper presents a vr tool that uses the platform cad model to allow the planning of the maintenance of the painting of platform elements, calculating the paint areas of different equipment, in defined regions. The tool is useful for precisely estimating the resources needed for the maintenance, and for estimating the correct moment to effectuate the paint of each part of the platform. 1. Introduction The idea of digital oilfields is a strong trend in the oil & gas industry, since the access to remote sites is expensive and dangerous, and, in addition, the optimization of the production is a necessity due to the constant increasing costs [1, 2]. One of the main efforts in this direction is the search for technologies that reduce the number of people working on deep sea oil platforms. The maintenance of these platforms is an activity that demands great effort, and the reduction of its associated costs, especially in terms of needed workforce, is an important challenge. Among the maintenance activities, the painting of platform equipment is very important, because the equipment is exposed to high corrosion rates due to the corrosive sea air. Therefore, the maintenance of a platform painting is not limited to aesthetical aspects. Actually, its main function is to protect the equipment, avoiding the premature deterioration of structures and pipings. The maintenance of platforms painting demands the frequent transportation of technicians to the platform in order to evaluate the conditions of the equipment, estimate the necessary amount of paint, and set dates for each maintenance, which involves a complex logistics of embarking people and the resources needed. Having the challenges of digital oilfields in mind, we developed a vr (Virtual Reality) tool for calculating the paint area of a platform based on its cad model. Using this tool, technicians may analyze the painting areas and calculate the amount of paint without the necessity of being on the platform, simplifying and reducing the costs of the process. This work presents the solution created to estimate with adequate precision the necessary resources to maintain the platform painting. This solution was built using Environ, a software for real time visualization of cad models [3]. In the following section we introduce Environ. In Section 3 we detail the painting area problem and describe the developed solution. Section 4 describes the use of the developed tool, and Section 5 concludes the paper. 2. Environ The applicability of vr techniques for 3d geometric cad models initially has been Calculating Paint Area in Engineering Virtual Models Gustavo Wagner 1 , Rafael Delerue 1 , Alberto Raposo 1 , Eduardo Corseuil 1 , Ismael Santos 2 1 Tecgraf, Dept. of Informatics PUC-Rio, Brazil 2 CENPES - Petrobras Research Center, Brazil {gustavow, delerue, abraposo, thadeu, ismael} @tecgraf.puc-rio.br 161
Transcript of Calculating Paint Area in Engineering Virtual Models

Abstract
The maintenance of equipment painting in maritime oil platforms is an expensive and important activity, especially because the equipment is exposed to high corrosion rates due to the corrosive sea air. This paper presents a vr tool that uses the platform cad model to allow the planning of the maintenance of the painting of platform elements, calculating the paint areas of different equipment, in defined regions. The tool is useful for precisely estimating the resources needed for the maintenance, and for estimating the correct moment to effectuate the paint of each part of the platform.
1. Introduction
The idea of digital oilfields is a strong trend in the oil & gas industry, since the access to remote sites is expensive and dangerous, and, in addition, the optimization of the production is a necessity due to the constant increasing costs [1, 2]. One of the main efforts in this direction is the search for technologies that reduce the number of people working on deep sea oil platforms.
The maintenance of these platforms is an activity that demands great effort, and the reduction of its associated costs, especially in terms of needed workforce, is an important challenge. Among the maintenance activities, the painting of platform equipment is very important, because the equipment is exposed to high corrosion rates due to the corrosive sea air. Therefore, the maintenance of a
platform painting is not limited to aesthetical aspects. Actually, its main function is to protect the equipment, avoiding the premature deterioration of structures and pipings.
The maintenance of platforms painting demands the frequent transportation of technicians to the platform in order to evaluate the conditions of the equipment, estimate the necessary amount of paint, and set dates for each maintenance, which involves a complex logistics of embarking people and the resources needed. Having the challenges of digital oilfields in mind, we developed a vr (Virtual Reality) tool for calculating the paint area of a platform based on its cad model. Using this tool, technicians may analyze the painting areas and calculate the amount of paint without the necessity of being on the platform, simplifying and reducing the costs of the process.
This work presents the solution created to estimate with adequate precision the necessary resources to maintain the platform painting. This solution was built using Environ, a software for real time visualization of cad models [3].
In the following section we introduce Environ. In Section 3 we detail the painting area problem and describe the developed solution. Section 4 describes the use of the developed tool, and Section 5 concludes the paper.
2. Environ
The applicability of vr techniques for 3d geometric cad models initially has been
Calculating Paint Area in Engineering Virtual Models
Gustavo Wagner1, Rafael Delerue1, Alberto Raposo1, Eduardo Corseuil1, Ismael Santos2
1 Tecgraf, Dept. of InformaticsPUC-Rio, Brazil
2 CENPES - Petrobras Research Center, Brazil
{gustavow, delerue, abraposo, thadeu, ismael} @tecgraf.puc-rio.br
161

restricted to design review, virtual prototyping and marketing purposes, mainly in the automotive and aircraft industries. More recently, 3d cad models are starting to show their potential in vr applications for diverse purposes, such as ergonomic studies [4], safety training for Health, Safety Environments [5], visualization of physical simulations, project documentation, maintenance, and real-time operational data.
One of the main objectives in engineering departments of large industries is the implementation of integrated information systems to manage their projects’ life cycle. Environ (ENvironment for VIRtual Objects Navigation) is an application motivated by the demand to use vr in large industrial engineering models generated by cad tools. Environ’s main goal is to offer 3d visualization resources for cad models with enough realism to be used for virtual prototyping, collaborative design review, change management systems and training, among other activities.
Environ is part of a research initiative to create an infrastructure for the “immediate” generation of vr environments from cad models, a task that currently requires significant effort from vr teams in the industry. In this context, Environ has been designed to be an extensible tool, with flexibility to receive new functionalities and to incorporate plug-ins, according to different requirements of the industry. This concept is
the opposite of that available in commercial solutions, normally offered as “black boxes”, with enhancements implemented by the developer on demand. We have successfully overcome cad-to-vr conversion problems, being able to include visual effects while ensuring the interactive visualization of complex models.
Figure 1 illustrates the components of Environ. It is composed of a Graphical User Interface on top of core visualization classes. Attached to this visualization core, there are several model components used to visualize different kinds of file formats, simulations, and the paint area tool.
Regarding file formats, we have developed export plug-ins for pdms (Plant Design Management System) [6] and MicroStation [7], the cad tool used in pds (Plant Design System) [8]. The goal of both exporters is not only to convert cad files into a graphic format that enables real-time interaction and navigation in the model, but also to recover and export the semantic information associated to cad objects. In parallel, a 3ds Max [9] plug-in enables the use of more photo-realistic models, not necessarily generated by a cad tool.
Also regarding file formats, Environ allows real world terrain data to be imported. These data are usually represented as height fields stored in a cad file. They can be easily converted into a 3d mesh, which can be used in our real-time 3d visualization. As the information present in this data is geo-referenced, it can be merged
Figure 1. Environ’s components
162

with existing aerial or satellite photos, as long as these are also georeferenced. These photos can be painted over the existing terrain mesh to allow the identification of real characteristics of the region in the visual simulation. Existing cad models can be inserted at their correct positions on the terrain mesh, allowing users to make advanced analysis involving terrain and cad models.
Regarding the visualization of engineering simulations, an important simulation visualized by Environ is based on Computational Fluid Dynamics (cfd). Particles are used to show the flow movement, with additional information included in color. Using this kind of simulation, it is possible to analyze smoke dispersion in case of accidents, for instance.
Another important simulation visualized by Environ is riser simulation. Oil platforms use ascending pipes, called risers, to bring the oil from the wellhead on the sea floor to the oil platform’s separator system tanks. The risers are connected to the platform using special connections called “joints”. To validate the operation of the risers during their life cycle (around 20 years or so), simulations of the stress applied to the riser system are conducted based on meteo-oceanographic information about wind, tide and water currents. In order to avoid operational problems, simulations are made under extreme wave conditions to test stress resistance. One of the riser analysis software used is Anflex [10], a Finite-Element-based structural analysis package which is quite precise but has a poor built-in graphical representation. Environ uses sophisticated graphical techniques to present these simulations in an immersive virtual environment. Since risers can be represented, in a simplified way, as a sequence of annular cylinders, gpu primitives are used to render the whole stream, enabling users to have a close view of the pipes without losing resolution. Figure 2 shows a screenshot of Environ’s riser visualization.
There is another module of oceanic simulations under development, called p2d xsd, that is going to be attached to Environ as a plugin.
Finally, the paint area module is also attached to Environ, with the specific goal of facilitating the paint area calculation for platform maintenance, as will be described in the following sections.
3. Paint Area
A tool that precisely estimates the resources needed for the maintenance of equipment painting is quite useful, especially in sea platforms, since the costs of keeping a maintenance team on board are prohibitive, and the logistics of embarkment of people and material is also complicated.
Using the paint area module of Environ, it is possible to estimate the correct moment to effectuate the paint of each part of the platform, since it helps the composition of a database containing the elements that are subject to painting. This database contains information about the spatial localization of the elements and the material they are made of. This information, together with the information about the painting area (obtained from the cad representation), enables the estimation of the resources to be embarked.
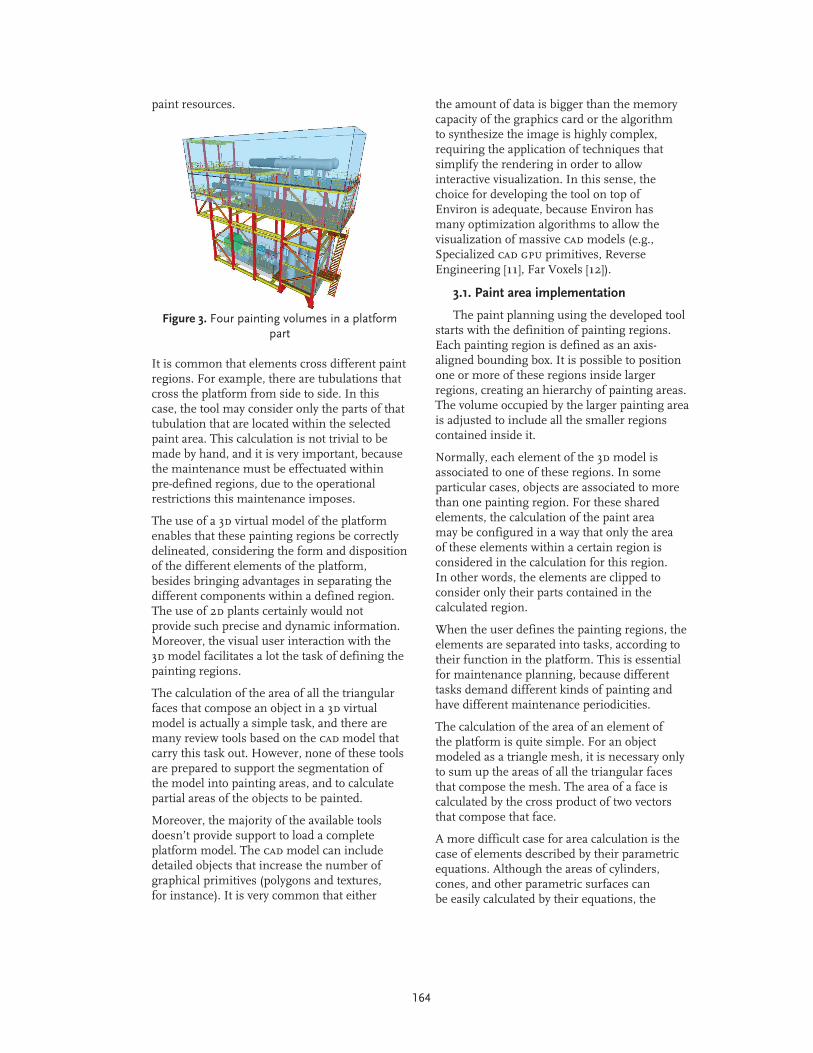
In order to allow the maintenance planning, each equipment, piping, or structure must be carefully catalogued and separated into logical unities. This division is normally defined before the platform construction, during the phase of the engineering plant project, and it is already represented in the cad model. Each one of these logical units are divided into sectors. Within each sector, equipments are divided into tasks, such as process water piping, gas piping, structure, equipment, etc. Therefore, each element of the platform is associated to at least one of these groups. Figure 3 shows a part of a platform divided into four volumes, representing the four deck levels. Within each volume, there are different kinds of equipments and structures, which may demand different
Figure 2. Screenshot for riser simulation in Environ
163
paint resources. the amount of data is bigger than the memory capacity of the graphics card or the algorithm to synthesize the image is highly complex, requiring the application of techniques that simplify the rendering in order to allow interactive visualization. In this sense, the choice for developing the tool on top of Environ is adequate, because Environ has many optimization algorithms to allow the visualization of massive cad models (e.g., Specialized cad gpu primitives, Reverse Engineering [11], Far Voxels [12]).
3.1. Paint area implementation
The paint planning using the developed tool starts with the definition of painting regions. Each painting region is defined as an axis-aligned bounding box. It is possible to position one or more of these regions inside larger regions, creating an hierarchy of painting areas. The volume occupied by the larger painting area is adjusted to include all the smaller regions contained inside it.
Normally, each element of the 3d model is associated to one of these regions. In some particular cases, objects are associated to more than one painting region. For these shared elements, the calculation of the paint area may be configured in a way that only the area of these elements within a certain region is considered in the calculation for this region. In other words, the elements are clipped to consider only their parts contained in the calculated region.
When the user defines the painting regions, the elements are separated into tasks, according to their function in the platform. This is essential for maintenance planning, because different tasks demand different kinds of painting and have different maintenance periodicities.
The calculation of the area of an element of the platform is quite simple. For an object modeled as a triangle mesh, it is necessary only to sum up the areas of all the triangular faces that compose the mesh. The area of a face is calculated by the cross product of two vectors that compose that face.
A more difficult case for area calculation is the case of elements described by their parametric equations. Although the areas of cylinders, cones, and other parametric surfaces can be easily calculated by their equations, the
It is common that elements cross different paint regions. For example, there are tubulations that cross the platform from side to side. In this case, the tool may consider only the parts of that tubulation that are located within the selected paint area. This calculation is not trivial to be made by hand, and it is very important, because the maintenance must be effectuated within pre-defined regions, due to the operational restrictions this maintenance imposes.
The use of a 3d virtual model of the platform enables that these painting regions be correctly delineated, considering the form and disposition of the different elements of the platform, besides bringing advantages in separating the different components within a defined region. The use of 2d plants certainly would not provide such precise and dynamic information. Moreover, the visual user interaction with the 3d model facilitates a lot the task of defining the painting regions.
The calculation of the area of all the triangular faces that compose an object in a 3d virtual model is actually a simple task, and there are many review tools based on the cad model that carry this task out. However, none of these tools are prepared to support the segmentation of the model into painting areas, and to calculate partial areas of the objects to be painted.
Moreover, the majority of the available tools doesn’t provide support to load a complete platform model. The cad model can include detailed objects that increase the number of graphical primitives (polygons and textures, for instance). It is very common that either
Figure 3. Four painting volumes in a platform part
164

situation when these volumes are clipped by the bounding box may generate complex calculations. However, this difficulty doesn’t appear in our implementation because Environ converts all parametric surfaces of the cad model into triangle meshes when it loads a model.
If an element is shared by more than one painting region, it is necessary to consider only the faces that are within the region being calculated. Each face of the element is then tested against the bounding box. If it is completely within the bounding box, its area is considered. If it is completely outside, its area is disregarded. Faces in the border of the bounding region must be clipped. We used the Sutherland-Hodgman clipping algorithm for that [13].
This algorithm begins with a set of all vertices in the subject polygon. Let’s assume the clip polygon is a rectangle, with no loss of generality. Start by extending the upper side segment to a line across the whole of the 2d space considered. Next, starting from the first vertex of the subject polygon, follow the path of the polygon to the next vertex in the subject polygon. New vertices will be created where the path crosses the extended clip polygon line. Repeat this for all vertices in the polygon. The old set of vertices is discarded and a new set of vertices is formed with vertices that are on or beneath the extended clip polygon line, and vertices from the clip polygon segment that are within the subject polygon. The core of the algorithm, which is iterated over all segments of the polygon is presented in the following:
This process is repeated for each clip polygon side, with new vertex sets being created at every iteration and used at the next. The resulting vertex set will define a new single polygon that is entirely within the clip rectangle. One thing to note is that this algorithm is best suited for convex polygons, which is obviously the case for triangles. With a concave subject polygon, the resulting polygon may have coincident (i.e. overlapping) edges. This is acceptable for rendering and area calculation, but not for more complex applications such as shadow computation algorithms.
Although we used only axis-aligned bounding boxes to define the painting regions in Environ, the method discussed above could be applied to any convex region formed by planar faces.
4. Utilization of the System
In order to use the resource of paint area calculation in Environ, it is necessary to initially open a cad model. Then, the user must select the objects of which paint areas are going to be calculated. This selection may be done directly in the visual representation of the objects, or in the objects’ hierarchical tree. The dialogue presented in Figure 4 appears when the user selects “Paint Area” in the Environ’s toolbar.
arrayLength = array.size;vertex PREV = array[arrayLength - 1]for i from 0 to arrayLength - 1{ vertex NEXT = array[i] if( isInside( NEXT, clipPlane ) ) { if( !isInside( PREV, clipPlane ) ) { output.add( findIntersection(PREV, NEXT, clipPlane ) ) } output.add ( NEXT ) } else if( isInside( PREV, clipPlane ) ) { output.add ( findIntersection( NEXT, PREV, clipPlane ) ); } PREV = NEXT}
By clicking on the button with the box, it is possible to delimit the painting volume. This volume will be graphically represented as a semi-transparent blue bounding box that covers the selected elements. This volume is then
Figure 4. Paint volume involving the selected element. The Paint Volumes folder is located in
the hierarchical structure window, at right
165

added to the Paint Volumes folder in the model structure (tree) window, as illustrated in Figure 4.
By clicking on the second button (“Properties”), it is possible to manually alter the size of the selected volume, as well as to configure the objects and associated volumes to ignore or to consider the external faces and to classify the objects according to their tasks (e.g., piping, equipment, structure, among others). The properties window (Figure 5) may also be accessed via the structure window, by clicking with the right button over the volume’s name.
5. Conclusions
This paper presented a vr based solution to calculate paint areas of platform elements in defined painting regions. Although the implementation was aimed at platform elements, due to the difficulties of embarkment, it is general enough to be used for any kind of industrial plant represented by cad models, such as refineries, for instance.
Besides the operational utility of the tool, an important aspect that should be highlighted is that the paint area calculation tool is a good example of how a relatively simple vr application can be useful in the “real world”, if it is designed focusing on real problems.
6. Acknoledgements
The authors would like to thank Petrobras and Tecgraf/puc-rj for their expressive support. Tecgraf is a laboratory mainly funded by petrobras. Alberto Raposo is partially funded by cnpq, process number 472769/2007-0.
7. References[1] IBM. “The Intelligent oilfield: meeting the challenges of today’s oil and gas exploration and production industry”. Executive brief, 2006.
[2] S. Vatland, P. Doyle, and T. M. Andersen. “Integrated operations: Creating the oil company of the future”, ABB Review, 3/2007, pp. 72-75.
[3] I. H. F. dos Santos, A. B. Raposo, L. P. Soares et al. “EnViron: An Integrated VR Tool for Engineering Projects”. Proceedings of the 12th International Conference on CSCW in Design – CSCWD 2008, Vol. II, p. 721-726. Xi’an, China.
[4] G. Monacelli, F. Sessa, and A. Milite. “An Integrated Approach to Evaluate Engineering Simulations and Ergonomics Aspects of a New Vehicle in a Virtual Environment: Physical and Virtual Correlation Methods”, FISITA 2004 30th World Automotive Congress, pp. 23-27. Barcelona, Spain.
[5] M. Haller, R. Holm, J. Volkert, and R. A. Wagner. “VR based safety training in a petroleum refinery”. 20th Annual Conf. of the European Association of CG, Eurographics, 1999. Milano, Italy.
[6] AVEVA. “AVEVA PDMS 12.0”. 2008. http://www. aveva.com/products_services_aveva_plant_pdms.php
[7] Bentley. “Microstation Ref. Guide, Bentley Systems incorporated: Intergraph Standard File Formats”. 1995.
Figure 5. Properties dialogue for a painting volume.
If the user wants to add more elements to the painting volume, she/he may select these new elements and click the “Add Selection” button in the Properties dialogue.
To create a new volume, the user can select different elements and click the “Box” button again. The new painting volume will appear in the structure window as a second volume.
Finally, once the user finished the definition of the volumes, s/he can click the third button in the control dialogue (“Area Calculation”) to show the window referring to the areas of the elements of the selected volume, as illustrated in Figure 6.
Figure 6. Result of the paint area calculation for different sub-regions.
166

[8] Intergraph. “SmartPlant Enterprise, Plant and Ship Design and Engineering”. 2007. http://www.intergraph.com/
[9] AUTODESK. 3ds Max. 2005. http://www.autodesk.com.
[10] M. M. Mourelle, E. C. Gonzalez, and B. P. Jacob. “ANFLEX - Computational System for Flexible and Rigid Riser Analysis”. Proceedings of the 9th International Symposium on Offshore Engineering. 1995.
[11] R. Toledo, B. Levy, and J. C. Paul. “Iterative Methods for Visualization of Implicit Surfaces on GPU”. Proc. 3rd International Symposium on Visual Computing, 2007, LNCS 4841, pp. 598-609.
[12] G. N. Wagner, A. Raposo, and M. Gattass. “An antialiasing technique for voxel-based massive model visualization strategies”. Proc. 3rd International Symposium on Visual Computing, 2007, LNCS 4841, pp. 288-297.
[13] “Sutherland-Hodgman clipping algorithm”. Wikipedia. http://en.wikipedia.org/wiki/Sutherland-Hodgeman
167