Calculating Climate Extremes CEI Case Study: Africa
22
Lezlie C. Moriniere, ATMO529 (Fall07) Arid Land Resources Sciences / Global Change Focus: Climate ChangeXevents Human Migration
-
Upload
orlando-gilmore -
Category
Documents
-
view
33 -
download
1
description
Calculating Climate Extremes CEI Case Study: Africa. Lezlie C. Moriniere , ATMO529 (Fall07) Arid Land Resources Sciences / Global Change Focus: Climate Change Xevents Human Migration. Presentation Outline. Scientific Motivation Introduction Terms IPCC Dataset Analysis Methods - PowerPoint PPT Presentation
Transcript of Calculating Climate Extremes CEI Case Study: Africa

Lezlie C. Moriniere, ATMO529 (Fall07)
Arid Land Resources Sciences / Global Change
Focus: Climate ChangeXevents Human Migration

Presentation OutlineScientific MotivationIntroduction
TermsIPCCDataset
Analysis MethodsNOAA Standard
ResultsSummary and Steps Ahead

Scientific Motivation: Climate Refugees?
1. CREATE EXTREMES
INDEX USING CLIMATE
VARIABLES
3.ALIGN WITH MIGRATION
STATISTICS TO DETECT TRENDS

What is an Extreme Event?“an event that is rare within the statistical
reference distribution at a particular place” (IPCC, 2001)Rare: x ≤ 10th percentile or x ≥ 90th percentile
4 attributes: rate of exceedence, mean excess, volatility, clustering in time (Stephenson, 2002)
Measures: scale parameter (β), percentile thresholds empirical ranking
Comfort in the Means vs. Intrigue in the Extremes

IPCC EXTREME EVENT Prediction: FAR
Phenomenon AspectDirection and
Likelihood
TEMPERATURE Intensity and Frequency ↑ >90% probability
PRECIPITATION Intensity and Frequency ↑ > 90 to 99%
probability
DROUGHT Area ↑ 66 to 90%
probability
CYCLONES Intensity ↑ 66 to 90%
probability
SEA LEVEL RISE Frequency ↑ 66 to 90%
probability
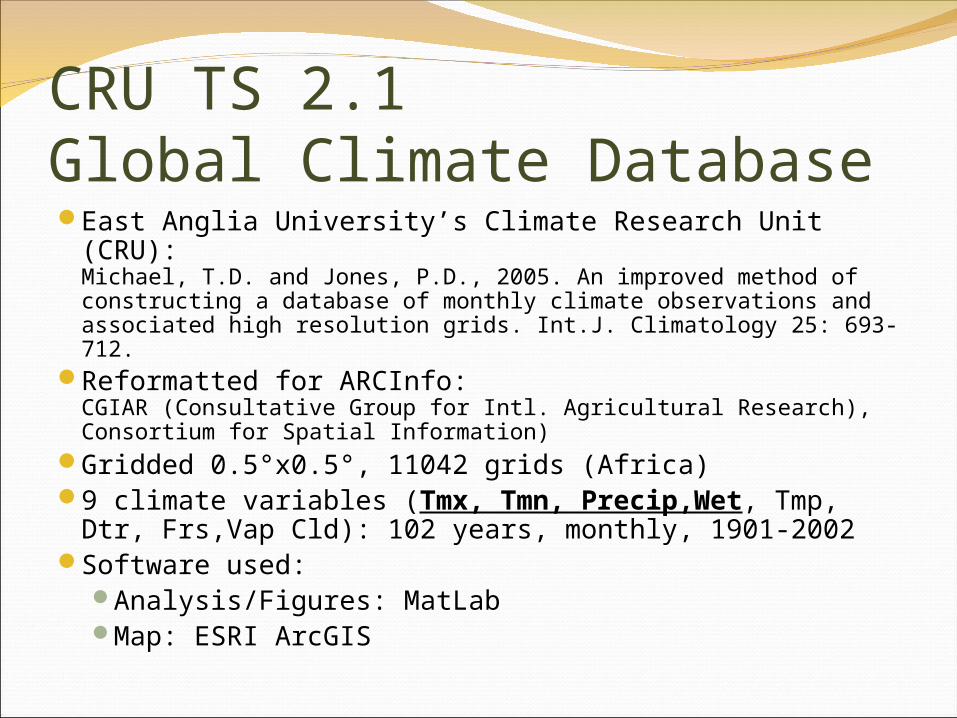
CRU TS 2.1 Global Climate DatabaseEast Anglia University’s Climate Research Unit
(CRU):Michael, T.D. and Jones, P.D., 2005. An improved method of constructing a database of monthly climate observations and associated high resolution grids. Int.J. Climatology 25: 693-712.
Reformatted for ARCInfo: CGIAR (Consultative Group for Intl. Agricultural Research), Consortium for Spatial Information)
Gridded 0.5°x0.5°, 11042 grids (Africa) 9 climate variables (Tmx, Tmn, Precip,Wet, Tmp,
Dtr, Frs,Vap Cld): 102 years, monthly, 1901-2002Software used:
Analysis/Figures: MatLabMap: ESRI ArcGIS

Analysis MethodsPrecipitation: Beta Produce SPI for Continent of Africa
Local SignificanceComposites
Climate Extreme Index2-tailed Exceedence per VariableCalculate Index CompositesLocal Significance
All: Temporal Trends Spatial Trends

Climate Extremes Index (CEI)NOAA (Policy) coterminous USA, 1910-present Seasonal/Annual, 1° x 1 ° Grids Arithmetic average of 6 indicators:
PERCENTAGE of AREA EXCEEDENCE :
1.∑ (Max.Temperature HI , Max.Temperature LO )
2.∑ (Min.Temperature HI , Min.Temperature LO )
3.∑ ( PDSI HI , PDSI LO )
4.2 * ( 1-day Precipitation HI )
5.∑( WetDays HI DryDays HI )
6.∑ (Wind velocities^2)

Africa_CEI
Tmx_m
5.1 - 24
25 - 28
29 - 31
32 - 34
35 - 38
Step 1: Max. Monthly Temp

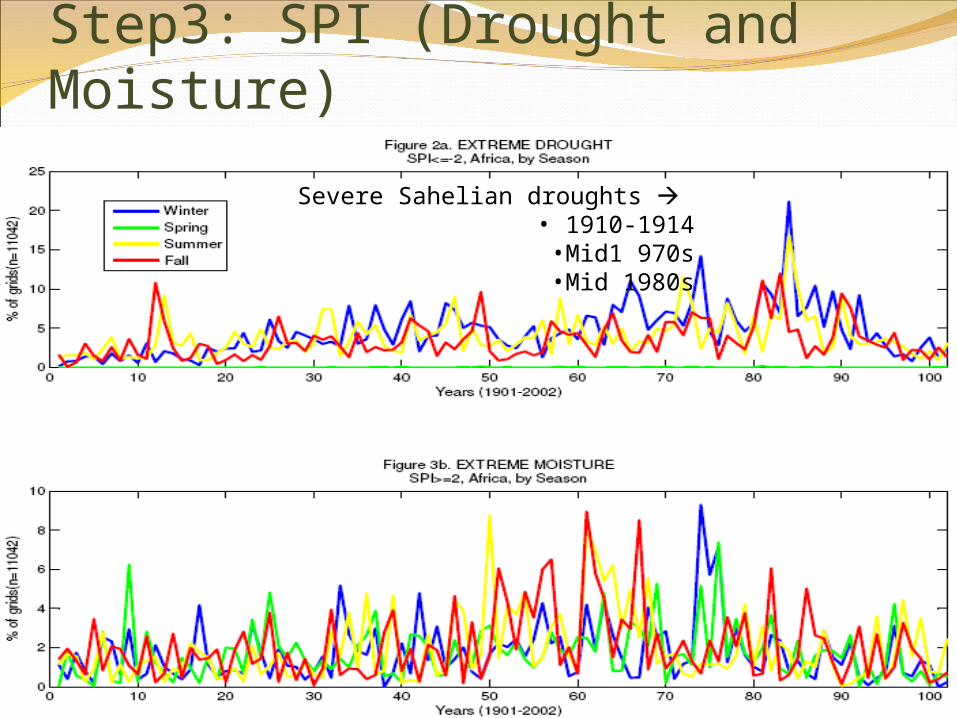
Step3: SPI (Drought and Moisture)
Severe Sahelian droughts • 1910-1914•Mid1 970s•Mid 1980s

Africa SPI
Africa_CEI
SPI_m
-1.2 - -0.51
-0.5 - -0.12
-0.11 - 0.13
0.14 - 0.4
0.41 - 0.92
Africa_CEI
SPI_m
-1.2 - -0.51
-0.5 - -0.12
-0.11 - 0.13
0.14 - 0.4
0.41 - 0.92
102 Year Monthly SPI
Africa_CEI
SPISUMm_HI
-1.9 - -0.69
-0.68 - -0.28
-0.27 - 0.067
0.068 - 0.48
0.49 - 1.4
Africa_CEI
SPISUMm_LO
-2.8 - -1.1
-1 - -0.54
-0.53 - -0.099
-0.098 - 0.35
0.36 - 1.3

Precip: Winter Beta
Precip:Summer Beta

Africa_CEI
Wet_aa
0.29 - 31
32 - 67
68 - 110
120 - 150
160 - 320
Africa_CEI
Wet_aa
0.29 - 31
32 - 67
68 - 110
120 - 150
160 - 320
Step5: Wet/Dry Days
Africa_CEI
Dry_aa
44 - 210
220 - 260
270 - 300
310 - 330
340 - 360
Africa_CEI
Dry_aa
44 - 210
220 - 260
270 - 300
310 - 330
340 - 360

CEIComposite:
High >21% 1967,1968,1970,1974,1975,1976,1995
Low <18%1925,1927,1940,1943,1944,1948

CEI
cru_af_grd1.img
CEI_m
0 - 0.117
0.117 - 0.184
0.184 - 0.2608
0.2608 - 0.3706
0.3706 - 1.6
Africa_CEI
CEI_m
0 - 0.12
0.13 - 0.18
0.19 - 0.26
0.27 - 0.37
0.38 - 1.6
CEI: Century and Seasonal Means
CEI: Winter CEI: Spring
CEI: Summer CEI: Fall
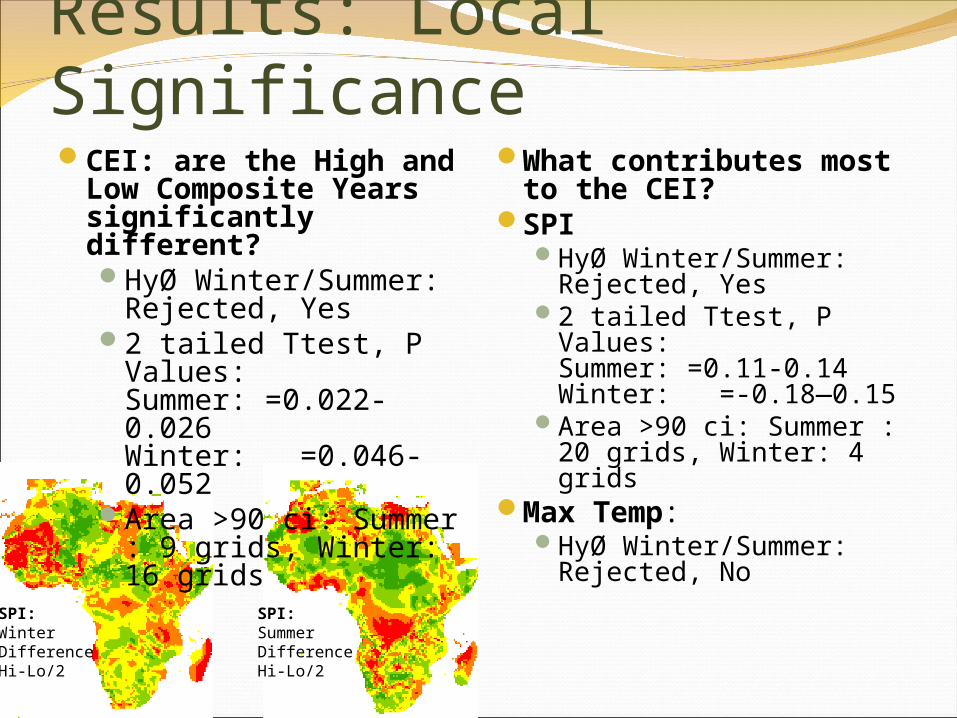
Results: Local SignificanceWhat contributes
most to the CEI?SPI
HyØ Winter/Summer: Rejected, Yes
2 tailed Ttest, P Values: Summer: =0.11-0.14Winter: =-0.18—0.15
Area >90 ci: Summer : 20 grids, Winter: 4 grids
Max Temp: HyØ Winter/Summer:
Rejected, NoAfrica_CEI
SPIwindif
-1.4 - -0.55
-0.54 - -0.21
-0.2 - 0.049
0.05 - 0.33
0.34 - 1.5
SPI: Winter DifferenceHi-Lo/2
Africa_CEI
SPIsumdif
-1.1 - -0.35
-0.34 - -0.047
-0.046 - 0.23
0.24 - 0.56
0.57 - 1.9
SPI: Summer DifferenceHi-Lo/2
CEI: are the High and Low Composite Years significantly different?HyØ Winter/Summer:
Rejected, Yes2 tailed Ttest, P
Values: Summer: =0.022-0.026Winter: =0.046-0.052
Area >90 ci: Summer : 9 grids, Winter: 16 grids

Ttest resultsSPI Winter
Africa_tt.img
SPIT_win
<-.90
-0.9 to 0.9
>0.90

SummarySPI and other variables complement each other
Different perspectives on extremesAfrica Xtremes beg confirmation and monitoringDetails are lost:
Africa: huge and heterogeneousMany confounding factors and widely varying
climatic influences on the continent:Hadley Cell CirculationMid-latitude CirculationEver-mobile ITCZEl Nino Southern Oscillation, and NAO
Steps AheadMaster statistics specifically for extremes…Data acquisition: cyclone, 2002+Spatial disaggregating (latitude or country )Field SignificanceGlobal Triangulation:
Disaster Events (lag time?)Human Migration