
Calculated Bets: Computers, Gambling, and Mathematical ...
38
Calculated Bets: Computers, Gambling, and Mathematical Modeling to Win Steven Skiena Department of Computer Science State University of New York Stony Brook, NY 11794–4400 http://www.cs.sunysb.edu/∼skiena 28th Atlantic Provinces Council APICS October 16, 2004
Transcript of Calculated Bets: Computers, Gambling, and Mathematical ...

Calculated Bets: Computers, Gambling, andMathematical Modeling to Win
Steven Skiena
Department of Computer ScienceState University of New YorkStony Brook, NY 11794–4400
http://www.cs.sunysb.edu/∼skiena
28th Atlantic Provinces Council APICSOctober 16, 2004

Program Trading in Jai-Alai
Investing in the financial markets is often likened togambling.This is story of how I used computer simulations andmathematical modeling techniques to bet on jai-alai.

I tell it to introduce several things which interest me:
• The Joys of Jai-Alai Jai-alai is a spectator sport andgambling venue which is under-appreciated by the public.
• The Power of Mathematical Modeling Mathematicalmodels govern our economy and help forecast ourweather, but the man on the street has little understandingof what they are and how they work.
• The Craft of Computer Programming Most people donot understand how computer programs written, and theelegance and beauty behind all interesting software.

• The Mathematics of Money Gambling and mathematicshave a long and interesting history together. My jai-alaisystem functions very much as a miniature stock tradingsystem.
• The Aesthetics of Data – Data analysis is both an art anda science. The right data representation lets us hear whatthe numbers are trying to tell.
Finally, this is the story of a professor who bets real money totest if his system works.This is joint work with my students Roger Mailler, MeenaNagarajan, Dario Vlah, and San-Yiu Cheng.

Early History
I first learned to program a computer as a high school studentback in 1977, when I developed a simple little model topredict the results of NFL football games.Simply averaging points for/against and giving three pointsfor home field will predict the winner of 65% of all NFLgames.This was a big enough deal back then for me to become anewspaper columnist. . .


Lessons from Football Prediction
1. Simple mathematical models have real predictive power
2. Simple mathematical models do not have predictivepower when money is on the line
I also got interested in jai-alai during high school, after beingexposed to the game on a family vacation to Florida.

What is Jai-Alai?
Jai-alai is a sport of Basque origin also known as PelotaVasca or Cesta Punta.

It is a variation on hand ball, where the rubber-and-goatskinpelota is caught/thrown with an large basket or cesta, andbounced off a granite or concrete wall.

The game is extremely fast – pelotas have been clocked atover 180 miles-per-hour, or twice as fast as a major leaguefastball.

Jai-alai betting is legal in Connecticut, Florida, and RhodeIsland, as well as the Basque country of Spain and France.

Why Jai-Alai?
The scoring system in use in the United States is differentthan that of the Basques, and particularly interesting to amathematician or computer scientist.As a parimutuel sport, jai-alai has evolved to permit morethan two players in a match.

The Spectacular Seven Scoring System
Eight players or teams play in each match, arranged in a first-in, first-out (FIFO) queue, with two teams playing each point.The loser of the point is added to back of the queue, with thewinner staying on to play the team at the top. Play continuesuntil one team totals (typically) seven points.To reduce the disadvantage of late post positions, theSpectacular Seven scoring system increases the reward foreach score after the seventh physical point from 1 to 2 points.

Spectacular Seven Example
Queue Point Score1 2 3 4 5 6 winner 1 2 3 4 5 6 7 83 4 5 6 7 8 1-beats-2 1 0 0 0 0 0 0 04 5 6 7 8 2 1-beats-3 2 0 0 0 0 0 0 05 6 7 8 2 3 1-beats-4 3 0 0 0 0 0 0 06 7 8 2 3 4 5-beats-1 3 0 0 0 1 0 0 07 8 2 3 4 1 6-beats-5 3 0 0 0 1 1 0 08 2 3 4 1 5 7-beats-6 3 0 0 0 1 1 1 02 3 4 1 5 6 8-beats-7 3 0 0 0 1 1 1 13 4 1 5 6 7 8-beats-2 3 0 0 0 1 1 1 34 1 5 6 7 2 3-beats-8 3 0 2 0 1 1 1 31 5 6 7 2 8 3-beats-4 3 0 4 0 1 1 1 35 6 7 2 8 4 1-beats-3 5 0 4 0 1 1 1 36 7 2 8 4 3 5-beats-1 5 0 4 0 3 1 1 37 2 8 4 3 1 5-beats-6 5 0 4 0 5 1 1 32 8 4 3 1 6 5-beats-7 5 0 4 0 7 1 1 3- - - - - - 5-1-3 5 0 4 0 7 1 1 3
Note that 1 “won” as many points as 5, but not when theycounted for as much.

Breaking Ties
Various tie-breaking strategies are used to determine the placeand show positions.
Queue Point Score1 2 3 4 5 6 winner 1 2 3 4 5 6 7 83 4 5 6 7 8 1-beats-2 1 0 0 0 0 0 0 04 5 6 7 8 2 1-beats-3 2 0 0 0 0 0 0 05 6 7 8 2 3 1-beats-4 3 0 0 0 0 0 0 06 7 8 2 3 4 5-beats-1 3 0 0 0 1 0 0 07 8 2 3 4 1 6-beats-5 3 0 0 0 1 1 0 08 2 3 4 1 5 7-beats-6 3 0 0 0 1 1 1 02 3 4 1 5 6 7-beats-8 3 0 0 0 1 1 2 03 4 1 5 6 8 2-beats-7 3 2 0 0 1 1 2 04 1 5 6 8 7 2-beats-3 3 4 0 0 1 1 2 01 5 6 8 7 3 4-beats-2 3 4 0 2 1 1 2 05 6 8 7 3 2 1-beats-4 5 4 0 2 1 1 2 06 8 7 3 2 4 1-beats-5 7 4 0 2 1 1 2 0- - - - - - 7-beats-4 7 4 0 2 1 1 4 0- - - - - - 1-2-7 7 4 0 2 1 1 4 0
Since from 2 to 7 teams can all tie, the tie-breaking rules arefairly complicated.

Monte Carlo Simulation
Monte Carlo techniques use many random experiments toapproximately measure a real quantity, as in Monte Carlointegration.
Picasso
The biases inherent in the Spectacular Seven Scoring Systemcan be identified by performing a Monte Carlo simulation.

Simulating Jai-Alai
To measure scoring system bias, we can select the winner ofeach point by a random number generator.For each game, we must maintain the current score andqueues, and tabulate the results:
Initialize the current players to 1 and 2.Initialize the queue to players {3, 4, 5, 6, 7, 8}.Initialize the point total for each player to zero.So long as the current winner has less than 7 points:
Play simulated point between two current players.Add one (or if > 7th point, two) to the point
total of the winner.Put the loser at the end of the queue.Get the next player off the front of the queue.
End.Identify current point winner as match winner.

Simulation Results
Pos % Wins % Places % Shows1 16.27% 17.93% 15.18%2 16.30% 17.86% 15.27%3 13.91% 16.57% 14.66%4 12.45% 13.32% 13.79%5 10.20% 10.83% 12.92%6 10.27% 7.82% 11.07%7 8.86% 8.21% 8.87%8 11.75% 7.45% 8.24%
• 1 and 2 have a substantial advantage over the rest of thefield. Either of the initial players are almost twice as likelyto succeed than position 7.
• Doubling the value of each point after the seventh pointin the match improves player 8’s chances to win. But thereal beneficiaries of point doubling are 1/2.

Actual Results
Four years of win results from Berenson’s Jai-alai:Pos 1983 1984 1985 1986 total %wins1 437 387 451 475 1750 14.12 459 403 465 486 1813 14.63 380 403 374 435 1592 12.84 351 345 368 361 1425 11.55 371 370 357 389 1487 12.06 329 414 396 402 1541 12.47 308 371 348 343 1370 11.18 357 366 351 331 1405 11.3
totals 2992 3059 3110 3222 12383 100.0
As predicted 1 and 2 do best, 7 the worst.The bias predicted by our simulations is reduced by thematchmakers who schedule the games.

Betting on Jai-Alai
Jai-alai has been called “a lottery with seats”.Each fronton supports a variety of different types of bets:
• Win, Place, Show – You can bet your team finishes eitherfirst, second, or third.
• Quiniela – You pick two teams to finish first and second.The order of finish is irrelevant
Personally, I find the quiniela bet to be the most excitingchoice for the spectator.
• Exacta – Pick two teams to finish first and second in thatgiven order.

• Trifecta – Pick the three teams to finish first, second andthird, in that exact order. There are 8×7×6 = 336 possibletrifecta bets. Trifectas are the riskiest conventional bet,but pays the highest returns.
Our system mostly bets trifectas.Lesson: The greatest inefficiencies in a market reside in themost complex derivatives.
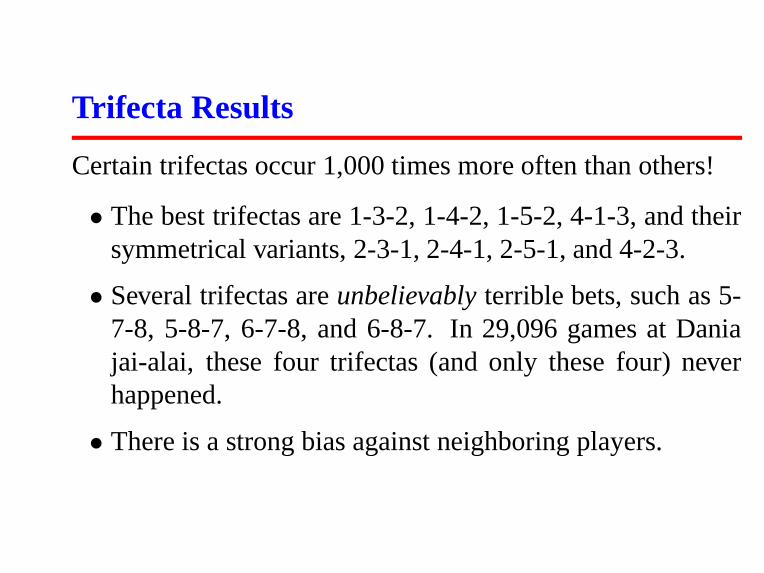
Trifecta Results
Certain trifectas occur 1,000 times more often than others!
• The best trifectas are 1-3-2, 1-4-2, 1-5-2, 4-1-3, and theirsymmetrical variants, 2-3-1, 2-4-1, 2-5-1, and 4-2-3.
• Several trifectas are unbelievably terrible bets, such as 5-7-8, 5-8-7, 6-7-8, and 6-8-7. In 29,096 games at Daniajai-alai, these four trifectas (and only these four) neverhappened.
• There is a strong bias against neighboring players.

Getting and Parsing Data
These results are not enough to bet successfully, because suchbiases are basically captured in the daily odds.We need to analyze statistical data to measure player skillsand estimate payoffs.Each night our program gets the latest data from the WWW,parses it using Perl programs, and adds it to our database.We now have collected more than four years of data foranalysis.

Are There Good Players and Bad Players?
How consistent are jai-alai players from year to year?Milford jai-alai player win and in-the-money percentages hadcorrelation coefficients of 0.492 and 0.468 from 1996 to 1997.
0.1 0.12 0.14 0.161996 Averages
0.1
0.12
0.14
0.16
1997 Averages
0.3250.350.375 0.4 0.4250.451996 Averages
0.32
0.34
0.36
0.38
0.4
0.42
0.44
0.461997 Averages
Compare to correlations of baseball batting averages (0.587AL / 0.517 NL) and pitching ERAs (0.386 AL / 0.503 NL).Thus we can use history to evaluate player skills in ameaningful way.

How Can We Rate Players?
By combining the players record in each starting positionwith data from our simulation, we can estimate what fractionof points each player wins.
Pos Winner Placer Shower Other1 78.77% 63.52% 51.76% 27.26%2 78.58% 63.29% 51.65% 26.73%3 79.58% 66.16% 54.63% 27.91%4 81.59% 67.75% 57.64% 29.45%5 82.94% 70.32% 60.72% 30.83%6 85.84% 70.18% 63.09% 31.80%7 87.21% 72.05% 63.89% 31.76%8 89.44% 70.41% 62.75% 29.96%all 82.08% 66.88% 57.16% 29.48%

How Often Does x Beat y?
The Monte Carlo simulation needs to know how often playerx wins against player y.All we know is that x wins 54.8% of his points and y wins49.3% of his, both against the world.To combine these, we need a formula which generatesprobabilities with the following properties:
• Integrity – Prob(A, B) must be a real probability value.
• Symmetry – Prob(A, B) = 1 − Prob(B, A)
• Equality – P (A) = P (B) → Prob(A, B) = 1/2.
• Generality – We need a “fudge factor” to easily changethe shape of the desired solution.

The Cesta of Skiena
The following function satisfies all of these requirements:
Prob(A, B) =1 + (P (A) − P (B))α
2if P (A) ≥ P (B)
Prob(A, B) =1 − (P (B) − P (A))α
2if P (A) ≤ P (B)
0 0.2 0.4 0.6 0.8 1Pr(B)
0.2
0.4
0.6
0.8
1
Pr(0.5,B)

How Much Does Each Bet Pay?
Jai-alai frontons make their money by taking a cut of all bets,under the parimutuel system.All money wagered on each type of bet is put into a pool, anddivided among the winners according to how much they bet.But first the house takes 20% of this pool.Thus we must do 20% better than average to make money.Frontons want you to bet, casinos want you to lose. Thus theywere happy to take my bets even if my system wins.By averaging the results of previous payoffs, we can estimatethe likely payoff for every possible bet.

How Much Do We Impact the Pool?
Our analysis shows that a small number of bets have positiveexpected return. Should we bet a lot of money on these?No! Our successful bets will lower the payoffs on theseoutcomes, eventually leading to negative expected return.This is why real investors bet at the stock market instead ofthe fronton. Jai-alai pools are small enough that very modestinvestments flood the market.This is why we will not get rich from jai-alai.By estimating the total amount bet in each pool, we canpredict the impact of our own wagering.
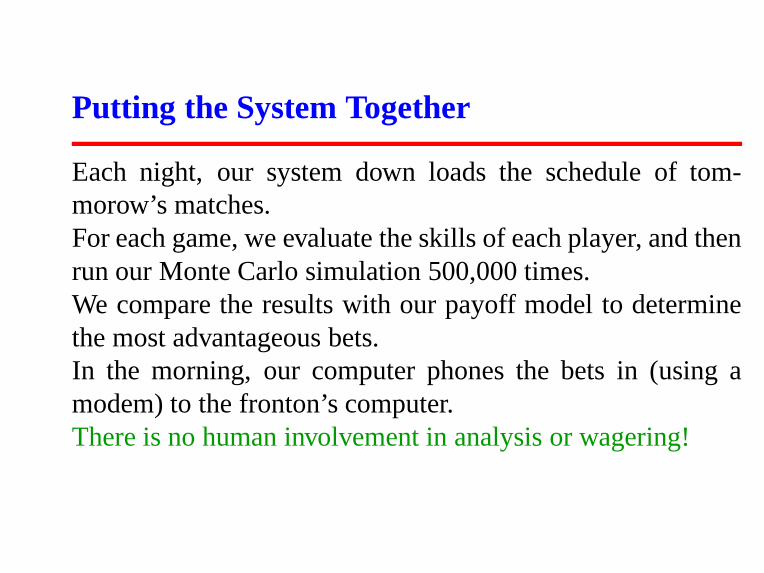
Putting the System Together
Each night, our system down loads the schedule of tom-morow’s matches.For each game, we evaluate the skills of each player, and thenrun our Monte Carlo simulation 500,000 times.We compare the results with our payoff model to determinethe most advantageous bets.In the morning, our computer phones the bets in (using amodem) to the fronton’s computer.There is no human involvement in analysis or wagering!

How Did We Do?
We carefully logged our bets from July to December, 1998.
0
100
200
300
400
500
600
700
800
900
1000
1 30 60
Acc
ount
Bal
ance
/ B
ets
Mad
e (in
dol
lars
)
Absolute Date
Betting History, August-December 1998
Account BalanceDaily Bets

We turned an initial $250 into $818.35, making a total of$3018 of bets.This is a total capital return of 227% over the period, with areturn of 18% per bet.A revised system later increased our total to $1851.70 beforebreaking due to a software bug.

Proof of Our Winnings

Epilogue
We recently restored the system to working order, includingthe Dania and Miami Frontons – however betting at thesefrontons might violate Federal law!Unfortunately, Milford Jai-alai closed in December 2001 andNewport in July 2004.All winnings have been donated to charity.I have heard from many interesting readers of my book. . .Lesson: Google people before you get involved with them!

Future Work
I have recently set up a Financial Engineering Laboratory atStony Brook to study more interesting markets.Initial projects include:
• Market timing strategies which avoid the use of sophisti-cated options.
• Data integration/analysis from eclectic web sources (e.g.Google, Amazon), with associated time series correlationanalysis.
• Natural language analysis of news streams.
Both Monte Carlo analysis and web scraping techniques areapplicable in these venues.

Advice to Young Computer Scientists
• Learn by doing cool projects. . .
• Don’t worry so much about what others have done. . .
• Be broad, not narrow. . .
• Go to a good graduate school, like Stony Brook. . .
• Learn from good books. . .

Algorithms, Programming, Discrete Math. . .

For Further Reading – www.jai-tech.com