Calcium Carbonate Scale Deposition Kinetics on...
218
i Calcium Carbonate Scale Deposition Kinetics on Stainless Steel Surfaces Omoregbe Bello Submitted in accordance with the requirement for the degree of Doctor of Philosophy The University of Leeds School of Mechanical Engineering Leeds, UK January 2017
Transcript of Calcium Carbonate Scale Deposition Kinetics on...

i
Calcium Carbonate Scale Deposition Kinetics
on Stainless Steel Surfaces
Omoregbe Bello
Submitted in accordance with the requirement for the degree of
Doctor of Philosophy
The University of Leeds
School of Mechanical Engineering
Leeds, UK
January 2017

ii
The candidate confirms that the work submitted is his own and that
appropriate credit has been given where reference has been made to the work
of others.
This copy has been supplied on the understanding that it is copyright material
and that no quotation from the thesis may be published without proper
acknowledgement.
© 2017 The University of Leeds and Omoregbe Bello

iii
Acknowledgement
All glory and thanks to God for grace, strength and motivation for the
successful completion of this research.
I would like to express my profound gratitude to Professor Anne Neville for her
thorough supervision, guidance, encouragement and support. I am very
grateful to Dr Thibaut Charpentier who has been very helpful and supportive
throughout this project. Their motivation, insight, passion, encouragement and
assistance throughout this project were the driving force for the success of
this work.
I wish to express my gratitude to the University of Leeds, United Kingdom and
Chevron technology company, Houston Texas, US, for their financial support
and technical contributions. I also appreciate the members of my research
group, the Institute of functional surfaces (iFs) especially the scale focus group
for creating a friendly and challenging atmosphere. Thanks to friends like
Doris, Leo, Ogbemi, Jide, McDonald, Lukman, Sikiru, Frederick, Obinna,
Kelvin, Omotayo, Danny, Abi and Wassim for sharing their knowledge.
The administrative and technical supports of Fiona Slade, Ron Cellier, Jordan
Thomas, Andrew O’ Brien and Michael Huggan are deeply appreciated.
Special thanks and appreciation to my mother, siblings and every member of
my family for the strong foundation and pillars upon which this success is built.
Their prayers, the bond, the constant encouragement, support and love really
made it possible.
My deepest appreciation to my beloved wife Patience Bello, for her
perseverance, support and encouragement throughout this research, and also
to my wonderful kids, Jasper, Jenkins and Janelle.

iv
Abstract
Calcium carbonate scale is one of the most common inorganic scales which
deposits on the surface of oil and gas production facilities. This causes
significant loss of production and ultimately leads to shut down of production
lines if not properly managed.
There has been a great amount of research on calcium carbonate deposition
studies, but most of these studies have been on understanding calcium
carbonate bulk precipitation process. However, little attention have been
made on calcium carbonate surface deposition mechanism, which is the main
challenge in mitigating scaling in oil and gas and desalination industries.
Understanding the mechanism of its formation at different environmental
conditions and using a methodology that would reflect the field scenario will
gives information required for a reliable predictive model.
This study investigated calcium carbonate surface build-up under flow
conditions, across a wide range of saturation ratio (SR) at 25oC and 70oC
respectively. Both bulk induction time (tind) and surface induction time, which
is referred to as scaling time (ts) were determined from capillary flow rig
experiments.
Mineral scale surface fouling was monitored by a sensitive differential
pressure technique with respect to build up of scale on the wall of the capillary
cell resulting to change of pressure across the test capillary cell.
It was found that, two scaling regimes occur within the brine composition
investigated. At SR < 80, surface fouling is controlled by nucleation and
growth, while at SR > 80, is controlled by the adhesion of pre-precipitated
crystals. This result was supported by the turbidity measurement and
inductively coupled plasma mass spectrometry (ICP-MS) analysis.
The calcium carbonate growth rate determined by measuring the amount of
scale deposited at the surface of the capillary cell by Inductively coupled
plasma mass spectrometry analysis (ICP-MS) was smaller compared to the
amount of scale predicted from Hagen Poiseuille (HP) equation, where the

v
growth rate is estimated from the pressure drop across the capillary cell as
scale build up on the wall of the capillary cell. This was attributed to non-
uniformity of the scale layer along the capillary cell which is omitted in the HP
equation.
A semi empirical model has been developed from the experimental work,
which can predict scale deposition growth rate over a period of time and as a
function of deposition flux at a given temperature.

vi
Table of Contents
Acknowledgement ......................................................................................... iii
Abstract ......................................................................................................... iv
Table of Contents .......................................................................................... vi
List of Figures ............................................................................................... xii
List of Tables ............................................................................................... xix
Nomenclature ............................................................................................... xx
CHAPTER 1. Introduction ......................................................................... 1
1.1 Research background ...................................................................... 1
1.2 Objectives of research ..................................................................... 4
1.3 Thesis outline ................................................................................... 6
CHAPTER 2. Scale formation literatures review ....................................... 7
2.1 Fundamental of scale formation ....................................................... 7
2.2 Types of oilfield scales ..................................................................... 8
2.2.1 Calcite........................................................................................ 8
2.3 Calcium carbonate scale formation .................................................. 9
2.3.1 Calcium carbonate solution equilibria ...................................... 10
2.3.2 Forms of calcium carbonate (CaCO3 polymorphs) .................. 12
2.3.3 Barite ....................................................................................... 15
2.3.4 Calcium sulphate ..................................................................... 15
2.3.5 Strontium sulphate ................................................................... 16
2.3.6 Siderite .................................................................................... 16
2.4 Chemical background of scale formation ....................................... 16
2.4.1 Solubility product ..................................................................... 16
2.5 Scale formation process ................................................................. 17
2.5.1 Chemical potential and supersaturation................................... 18
2.5.2 Induction time .......................................................................... 20

vii
2.5.3 Nucleation ................................................................................ 22
2.5.4 Primary nucleation ................................................................... 23
2.5.5 Secondary nucleation .............................................................. 28
2.5.6 Crystal growth .......................................................................... 30
2.5.7 Crystal growth mechanism and theory .................................... 30
2.6 Adhesion ........................................................................................ 34
2.6.1 Surface energy and adhesion forces ....................................... 36
2.6.2 Measuring work of adhesion and surface energy .................... 37
2.7 Factors affecting scale formation ................................................... 38
2.7.1 Effect of pH .............................................................................. 38
2.7.2 Effect of temperature ............................................................... 39
2.7.3 Effects of operating pressure ................................................... 41
2.7.4 Effects of solution supersaturation ........................................... 42
2.7.5 Effect of flow velocity and hydrodynamic conditions ................ 44
2.7.6 Effect of solution chemistry ...................................................... 45
2.7.7 Effect of impurities ................................................................... 45
2.7.8 Effect of surface roughness ..................................................... 47
2.7.9 Summary of scale formation literatures review ........................ 47
2.8 Scale deposition kinetics studies and predictive models ................ 48
2.8.1 Inorganic scale surface deposition kinetics studies and their
predictive models ................................................................................. 48
2.8.2 Asphaltene and wax deposition kinetics studies and their
predictive models ................................................................................. 55
2.8.3 Summary of scale surface deposition kinetics studies and
predictive models ................................................................................. 59
2.9 Scale formation in a pipe flow system and fluid mechanics
principles ................................................................................................. 60
2.9.1 Pressure loss in laminar flow ................................................... 61

viii
2.9.2 Hagen-Poiseuille’s law............................................................. 63
2.9.3 Dynamic tube blocking rig ........................................................ 63
CHAPTER 3. Capillary rig development and commissioning .................. 69
3.1 Introduction .................................................................................... 69
3.2 Capillary flow rig description for surface deposition test ................. 70
3.3 Capillary flow rig description for bulk analysis test ......................... 72
3.4 Capillary flow rig description for scanning electron microscope and X-
ray diffraction test .................................................................................... 73
3.4.1 Capillary tube and stainless steel extension tube design ........ 73
3.5 Capillary rig design and modification .............................................. 75
3.5.1 Entrance effect ........................................................................ 75
3.5.2 Residence time (mixing section and the capillary cell) ............ 77
3.5.3 Reynolds number .................................................................... 78
3.6 Hagen Poiseuille (HP) flow prediction ............................................ 78
3.7 Limitations of Hagen Poiseuille flow equation measurement with
reference to capillary tube blocking rig .................................................... 83
3.8 Determination of scale deposition growth rate ............................... 84
3.9 Summary ........................................................................................ 87
CHAPTER 4. Experimental procedure and methodology ........................ 88
4.1 Introduction .................................................................................... 88
4.2 Experimental conditions ................................................................. 88
4.3 Brine preparation ............................................................................ 89
4.4 Test method ................................................................................... 91
4.4.1 Bulk analysis test ..................................................................... 91
4.4.2 Inductively Coupled Plasma Mass Spectrometry (ICP-MS)
measurement ....................................................................................... 91
4.4.3 Capillary cell preparation and solution sampling for ICP-MS
analysis (bulk precipitation) .................................................................. 92

ix
4.4.4 Capillary cell preparation and solution sampling for ICP-MS
analysis (surface deposition) ................................................................ 93
4.4.5 Turbidity measurement ............................................................ 94
4.4.6 Surface analysis test ............................................................... 95
4.4.7 Scanning Electron Microscope (SEM) observation .................. 95
4.4.8 X-Ray Diffraction (XRD) observation ....................................... 96
4.4.9 Optical Microscope .................................................................. 97
4.5 Summary ........................................................................................ 98
CHAPTER 5. Bulk precipitation study of calcium carbonate (CaCO3) scale:
Influence of saturation ratio ......................................................................... 99
5.1 Introduction .................................................................................... 99
5.2 Calcium carbonate turbidity measurement at 25oC and 70oC ........ 99
5.3 Inductively Coupled Plasma Mass Spectrometry (ICP-MS)
measurement at 25oC and 70oC ............................................................ 103
5.4 Summary ...................................................................................... 105
CHAPTER 6. Calcium carbonate scale surface deposition kinetics ...... 106
6.1 Introduction .................................................................................. 106
6.1.1 The effect of flow rate on calcium carbonate surface deposition
kinetics at 25oC .................................................................................. 106
6.1.2 The effect of flow rates on calcium carbonate surface deposition
kinetics at 70oC .................................................................................. 111
6.2 Scanning Electron Microscope (SEM) observations .................... 116
6.3 X-ray Diffraction (XRD) Measurements ........................................ 119
6.4 Optical Microscope Images .......................................................... 121
6.5 Scaling time and saturation ratio at 25oC and 70oC ..................... 123
6.6 Summary ...................................................................................... 126
CHAPTER 7. Discussion ....................................................................... 127
7.1 Introduction .................................................................................. 127

x
7.2 CaCO3 scale surface deposition mechanism ............................... 128
7.3 Adhesion and crystallization mechanism ..................................... 129
7.3.1 Determination of parameters that define nucleation theory ... 134
7.4 Calcium carbonate (CaCO3) scale deposition growth kinetics ..... 138
7.5 Calcium carbonate (CaCO3) scale deposition growth kinetics at 25oC
and 70oC ................................................................................................ 140
7.6 Calcium carbonate scale deposition kinetics empirical model ...... 146
7.7 The empirical relationship between deposition growth rate and
deposition flux ........................................................................................ 149
7.7.1 The empirical relationship between deposition growth rate and
deposition flux at 25oC and 70oC ....................................................... 150
7.8 Summary ...................................................................................... 152
CHAPTER 8. Conclusions .................................................................... 154
8.1 Conclusions.................................................................................. 154
8.2 Factors influencing the formation and precipitation of CaCO3 ...... 154
8.2.1 Effect of flow rate on CaCO3 scale deposition ....................... 154
8.2.2 Effect of saturation ratio on CaCO3 scale deposition ............. 155
8.2.3 Effect of temperature on CaCO3 deposition ........................... 155
8.3 CaCO3 surface deposition kinetics mechanism ............................ 156
8.3.1 CaCO3 scale growth kinetics ................................................. 157
CHAPTER 9. Future work ..................................................................... 159
9.1 Hydrodynamic and in-situ study ................................................... 159
9.2 Inhibitor efficiency study ............................................................... 159
References ................................................................................................ 161
Appendix A: The effect of saturation ratio on calcium carbonate scale
deposition .................................................................................................. 180
Appendix B: The effect of temperature on calcium carbonate scale deposition
.................................................................................................................. 185

xi
Appendix C: Calcium carbonate scale thickness growth rate from Hagen
Poiseuille and ICP ..................................................................................... 190
Appendix D: Empirical relationship between average growth rate and
deposition flux at different temperature ..................................................... 193

xii
List of Figures
Figure 1-1. Scaling due to mixing of incompatible fluids (left) and auto scaling
(right) [9] ......................................................................................................... 2
Figure 1-2 (a) Cross section of a pipe and (b) Schematic diagram of bulk
scaling and surface scale in a flow system ................................................... 5
Figure 2-1. Image of scale deposition in a pipe [9] ......................................... 7
Figure 2-2. Effect of CO2 partial pressure on pH of water [33] ...................... 11
Figure 2-3. SEM image of calcite scale crystals [41] ..................................... 12
Figure 2-4. SEM image of aragonite scale crystals [41] ................................ 12
Figure 2-5. SEM image of vaterite scale crystals [41] ................................... 13
Figure 2-6. Crystalline structure of calcite [43] .............................................. 13
Figure 2-7: Scale formation process [53] ....................................................... 18
Figure 2-8: Induction time as a function of saturation ratio [61] ..................... 22
Figure 2-9: Types of nucleation [57] .............................................................. 23
Figure 2-10: Homogenous nucleation [67] .................................................... 24
Figure 2-11: Free energy diagram for nucleation and critical nucleus [57] .... 25
Figure 2-12: Heterogeneous nucleation[67] .................................................. 27
Figure 2-13: The interfacial energy at the boundaries between three phases
[70] ................................................................................................................ 28
Figure 2-14 : Visualisation of the difference between mechanical breeding and
surface breeding [74]..................................................................................... 29
Figure 2-15: The kinetics of scale crystal growth [63] ................................... 33
Figure 2-16: Interaction of crystals in bulk solution to the surface of a substrate
.................................................................................................................... 35
Figure 2-17: Solubility of calcium carbonate in pure water as a function of pH
[53] ................................................................................................................ 39
Figure 2-18: The effect of temperature on the solubility of inorganic scales [67]
.................................................................................................................... 41
Figure 2-19: Predicted barium sulphate supersaturation as a function of
pressure and temperature [100] ..................................................................... 42
Figure 2-20: Change in saturation index (SI) with time [104] ......................... 43
Figure 2-21: Effect of Mg2+ on the induction time of precipitates formed in the
bulk solution[115] ........................................................................................... 46

xiii
Figure 2-22: Schematic diagram of the continuous flow precipitation vessel
[105] ............................................................................................................... 50
Figure 2-23. Experimental setup for commingled injection of incompatible
waters [128] ................................................................................................... 53
Figure 2-24: Calcium carbonate scale deposition in cm/year as a function of
saturation index (SI) at 24oC and 70oC [108] ................................................. 55
Figure 2-25:Scale formation process in a pipe flow system [80] ................... 61
Figure 2-26: Pressure loss in laminar flow [138] ............................................ 62
Figure 2-27: Shearing forces on a cylinder [138] ........................................... 62
Figure 2-28: A simplified diagram of anaerobic dynamic tube-blocking rig [142]
.................................................................................................................... 64
Figure 2-29 : Dynamic loop test with FW:SW 50:50 at 70oC [143] ................. 65
Figure 2-30: The performance of selected inhibitors in dynamic tube blocking
tests in the presence of 100ppm Fe2+ [112] ................................................... 66
Figure 2-31: The effect of bicarbonate concentration on blank scaling time
[140] ............................................................................................................... 66
Figure 2-32: DETPMP performance on BaSO4, inhibitor injected step by step
(L=7.5m;ID=0.5mm;Q=30cm3/h;T=90oC) [10] ............................................... 67
Figure 3-1: Schematic diagram of the capillary tube blocking rig ................ 71
Figure 3-2: Schematic diagram of capillary rig showing the mixing part and
capillary cell ................................................................................................. 71
Figure 3-3: Capillary rig showing the bulk analysis section ......................... 73
Figure 3-4: Schematic diagram of the capillary cell ..................................... 74
Figure 3-5: Schematic diagram of the stainless steel extension tube and flat
coupon for surface analysis ......................................................................... 74
Figure 3-6: Pipe flow system showing a region of developing flow and fully
developed flow [149]. ..................................................................................... 76
Figure 3-7:(a) Scale deposited uniformly on a capillary tube (b) and (c) Cross
section of capillary tube before and after deposition ................................... 80
Figure 3-8: Differential pressure as a function of time ................................. 81
Figure 3-9: Repeatability test for SR 5, 5ml/min at 25oC ............................. 82
Figure 3-10: Repeatability test for SR 11, 10ml/min at 25oC ....................... 82
Figure 3-11: Repeatability test for SR 5,5ml/min and SR 11, 10ml/min at 25oC
.................................................................................................................... 83

xiv
Figure 3-12: Differential pressure as a function of time ............................... 85
Figure 3-13: Scale deposition growth rate as a function of saturation ratio at
5ml/min and 25oC ........................................................................................ 86
Figure 3-14: Scale deposition growth rate as a function of saturation ratio at
5ml/min and 70oC ........................................................................................ 86
Figure 3-15: Scale deposition growth rate as a function of saturation ratio at
15ml/min and 70oC ...................................................................................... 87
Figure 4-1: Schematic diagram of the bulk analysis test ............................. 91
Figure 4-2 :Inductively Coupled Plasma (ICP) [156] ...................................... 93
Figure 4-3: Typical turbidity curve ............................................................... 94
Figure 4-4: HACH colorimeter DR/890 turbidity meter [158] .......................... 95
Figure 4-5: Zeiss EVO MA15 SEM [159] ....................................................... 96
Figure 4-6: Philip Pan Alytical Pert PRO MPD [160] ...................................... 97
Figure 4-7: Leica DM 6000M Optical microscope [162] ................................. 98
Figure 5-1 (a & b): CaCO3 scale turbidity measurement at 25oC .............. 101
Figure 5-2 (a & b): CaCO3 scale turbidity measurement at 70oC .............. 102
Figure 5-3: Calcium ion concentration [Ca2+] as a function of time determined
by ICP at 25oC........................................................................................... 104
Figure 5-4: Calcium ion concentration [Ca2+] as a function of time determined
by ICP at 70oC........................................................................................... 105
Figure 6-1. Differential pressure as a function of time for saturation ratio 5,
25oC at different flow rates ........................................................................ 106
Figure 6-2: Differential pressure as a function of time for saturation ratio 11,
25oC at different flow rates ........................................................................ 107
Figure 6-3: Differential pressure as a function of time for saturation ratio 20,
25oC at different flow rates ........................................................................ 107
Figure 6-4: Differential pressure as a function of time for saturation ratio 31,
25oC at different flow rates ........................................................................ 108
Figure 6-5: Differential pressure as a function of time for saturation ratio 50,
25oC at different flow rates ........................................................................ 109
Figure 6-6: Differential pressure as a function of time for saturation ratio 80,
25oC at different flow rates ........................................................................ 110
Figure 6-7: Differential pressure as a function of time for saturation ratio 200,
25oC at different flow rates ........................................................................ 110

xv
Figure 6-8: Differential pressure as a function of time for saturation ratio 398,
25oC at different flow rates ........................................................................ 111
Figure 6-9: Differential pressure as a function of time for saturation ratio 5,
70oC at different flow rates ........................................................................ 112
Figure 6-10: Differential pressure as a function of time for saturation ratio 11,
70oC at different flow rates ........................................................................ 112
Figure 6-11: Differential pressure as a function of time for saturation ratio 20,
70oC at different flow rates ........................................................................ 113
Figure 6-12: Differential pressure as a function of time for saturation ratio 31,
70oC at different flow rates ........................................................................ 113
Figure 6-13: Differential pressure as a function of time for saturation ratio 50,
70oC at different flow rates ........................................................................ 114
Figure 6-14: Differential pressure as a function of time for saturation ratio 80,
70oC at different flow rates ........................................................................ 115
Figure 6-15: Differential pressure as a function of time for saturation ratio 200,
70oC at different flow rates ........................................................................ 115
Figure 6-16: Differential pressure as a function of time for saturation ratio 398,
70oC at different flow rates. ....................................................................... 116
Figure 6-17 : SEM image of calcium carbonate crystals at SR 31, 25oC for (a)
10ml/min and (b) 15ml/min ........................................................................ 117
Figure 6-18: SEM image of calcium carbonate crystals at SR 50, 25oC for (a)
10ml/min and (b) 15ml/min ........................................................................ 118
Figure 6-19: SEM image of calcium carbonate crystals at SR 31, 70oC for (a)
10ml/min and (b) 15ml/min ........................................................................ 118
Figure 6-20: SEM image of calcium carbonate crystals at SR 50, 70oC for (a)
10ml/min and (b) 15ml/min ........................................................................ 119
Figure 6-21: XRD diffraction pattern for calcium carbonate (CaCO3) scale
crystals for SR 50 and 25oC at flow rates 10ml/min and 15ml/min ............ 120
Figure 6-22: XRD diffraction pattern for calcium carbonate scale (CaCO3)
crystals at 25oC, 10ml/min for SR 31 and SR 50 ....................................... 121
Figure 6-23: Cross sections of optical microscope images at different
conditions .................................................................................................. 122
Figure 6-24: Scaling time (ts) determination .............................................. 123

xvi
Figure 6-25: Relationship between scaling time ts and saturation ratio at 25oC
.................................................................................................................. 124
Figure 6-26: Relationship between scaling time ts and saturation ratio at 70oC
.................................................................................................................. 125
Figure 7-1: Scale deposited on the wall of capillary cell by heterogeneous
nucleation and adhesion ........................................................................... 129
Figure 7-2: Scale deposited on the wall of the capillary cell by crystallization
process ...................................................................................................... 130
Figure 7-3: Relationship between log ts and (log SR) -2 at 25oC ................ 132
Figure 7-4: Relationship between log ts and (log SR) -2 at 70oC ................ 132
Figure 7-5: Relationship between log ts and (log SR)-2 at 25oC for
heterogeneous nucleation (crystallization process) ................................... 135
Figure 7-6: Relationship between log ts and (log SR)-2 at 70oC for
heterogeneous nucleation (crystallization process) ................................... 136
Figure 7-7: Determination of CaCO3 scale growth rate ............................. 139
Figure 7-8: The average growth rate as a function of saturation ratio at 25oC
.................................................................................................................. 140
Figure 7-9: The average growth rate as a function of saturation ratio at 25oC
.................................................................................................................. 141
Figure 7-10: The average growth rate as a function of saturation ratio at 70oC
.................................................................................................................. 142
Figure 7-11: The average growth rate as a function of saturation ratio at 70oC
.................................................................................................................. 143
Figure 7-12: Scale deposition growth rate as a function of deposition flux at
25oC and 70oC .......................................................................................... 151
Figure 9-1: Differential pressure as a function time for 25oC and 5ml/min at
different saturation ratio ............................................................................. 180
Figure 9-2: Differential pressure as a function time for 25oC and 10ml/min at
different saturation ratio ............................................................................. 181
Figure 9-3: Differential pressure as a function time for 25oC and 15ml/min at
different saturation ratio ............................................................................. 181
Figure 9-4: Differential pressure as a function of time for 25oC and 20ml/min
at different saturation ratio ......................................................................... 182

xvii
Figure 9-5: Differential pressure as a function time for 25oC and 30ml/min at
different saturation ratio ............................................................................. 182
Figure 9-6: Differential pressure as a function time for 70oC and 5ml/min at
different saturation ratio ............................................................................. 183
Figure 9-7: Differential pressure as a function time for 70oC and 10ml/min at
different saturation ratio ............................................................................. 183
Figure 9-8: Differential pressure as a function time for 70oC and 15ml/min at
different saturation ratio ............................................................................. 184
Figure 9-9: Differential pressure as a function of time for saturation ratio 5 at
10ml/min .................................................................................................... 185
Figure 9-10: Differential pressure as a function of time for saturation ratio 11
at 10ml/min ................................................................................................ 185
Figure 9-11: Differential pressure as a function of time for saturation ratio 20
at 10ml/min ................................................................................................ 186
Figure 9-12: Differential pressure as a function of time for saturation ratio 31
at 10ml/min ................................................................................................ 187
Figure 9-13: Differential pressure as a function of time for saturation ratio 50
at 10ml/min ................................................................................................ 187
Figure 9-14: Differential pressure as a function of time for saturation ratio 80
at 10ml/min ................................................................................................ 188
Figure 9-15: Differential pressure as a function of time for saturation ratio 200
at 10ml/min ................................................................................................ 188
Figure 9-16: Differential pressure as a function of time for saturation ratio 398
at 10ml/min ................................................................................................ 189
Figure 9-17: Scale deposition growth rate as a function of saturation ratio at
10ml/min and 25oC .................................................................................... 190
Figure 9-18: Scale deposition growth rate as a function of saturation ratio at
15ml/min and 25oC .................................................................................... 191
Figure 9-19 : Scale deposition growth rate as a function of saturation ratio at
10ml/min and 70oC .................................................................................... 191
Figure 9-20: Scale deposition growth rate as a function of saturation ratio at
15ml/min and 70oC .................................................................................... 192
Figure 9-21: The average growth rate as a function of deposition flux at 25oC
.................................................................................................................. 193

xviii
Figure 9-22: The average growth rate as a function of deposition flux at 70oC
.................................................................................................................. 194

xix
List of Tables
Table 2-1. Solubility constants for the different calcium carbonate polymorphs
at 25°C and in general form [45] ................................................................... 14
Table 2-2: Properties of crystals (1), substrate (2) and environment (3) that
affect the adherence of crystals to the surface of substrates ...................... 36
Table 3-1: Entrance length of the capillary mixing section .......................... 76
Table 3-2: Capillary residence time at different flow rates ........................... 77
Table 3-3: Reynolds number at different flow rates ..................................... 78
Table 4-1: Composition of stainless steel (316L) [151] .................................. 88
Table 4-2: Brine composition at 25oC .......................................................... 90
Table 4-3: Brine composition at 70oC .......................................................... 90
Table 6-1: Calcium carbonate scale deposition time for SR 5, 5ml/min at 25oC
.................................................................................................................. 109
Table 7-1: Crystallization parameters based on nucleation theory values at
25oC .......................................................................................................... 137
Table 7-2: Crystallization parameters based on nucleation theory values at
70oC .......................................................................................................... 137
Table 7-3: Comparison of calcium carbonate scale deposition growth rate with
literatures values ....................................................................................... 144
Table 7-4: Fitted equation on the experimental data at different flow rates for
25oC .......................................................................................................... 145
Table 7-5: Fitted equation on the experimental data at different flow rates for
70oC .......................................................................................................... 146
Table 7-6: Comparison of calcium carbonate scale deposit thickness growth
rate and asphaltene deposit thickness growth rate ................................... 149

xx
Nomenclature
rc: radius of critical nuclei (cm)
IP: activity product of free ions species
J: nucleation rate (cm-3 s-1)
h:height of the circular disc (cm)
ΔGcr: free energy change for the critical cluster size formation (J mole-1)
A: frequency constant (cm-3 s-1)
k: Boltzmann constant (J/K)
T: absolute temperature (K)
𝛾: Interfacial energy (mJ/m2)
: Shape factor
Vm: molecular volume (cm3 mole-1)
f(θ): correction factor
R: molar gas constant (J mole-1K-1)
SI: saturation index
SR : saturation ratio
Ka : activity based solubility product constant
tind: induction time (min)
ts : scaling time (min)
tn : time for system to reach steady state (min)
tg: time for nuclei to reach a detectable size (min)
Ksp: Solubility product constant
B: slope of the plot log tind and 1/(log SR)2

xxi
NA: Avogadro number (mol-1)
Wa: work of the adhesion (N m-1)
θ: contact angle (degs)
m: mass of solute deposited (g)
C: solute concentration (mol/l)
Ce: equilibrium saturation concentration (mol/l)
Km: mass transfer coefficient (m/s)
Kr: reaction rate constant (mol/l/s)
V :flow velocity (m/min)
Q: volumetric flow rate (ml/min)
Re: Reynolds number
Le: entrance length (mm)
𝜌: Density (Kg/m3)
ΔGw: Lifshitz van der Waal interaction component
ΔGE: electrostatic double-layer component
ΔGA: Lewis acid- based component
ΔGB: Brownian motion component
ΔGT: Total interaction energy
ΔPi :Initial pressure drop before deposition (Psi)
ΔPt: pressure drop at time t (Psi)
µi: Initial viscosity of brine (mPa.s)
µt: viscosity of brine at time t (mPa.s)
ri : initial radius of the capillary cell (mm)

xxii
R: radius of capillary cell after deposition (mm)
t: scale deposition thickness (mm)
D: internal diameter of the capillary cell (mm)
L: Length of capillary cell (mm)
pptBarite: amount of barite (ml/kg)
𝑥: mole fraction
𝛾𝐵𝑎2+: activity coefficient of barium ion
𝛾𝑆𝑂42−: activity coefficient of sulphate ion
SHMP: Sodium hexametaphosphate
Po : Initial concentration of SHMP (mol/l)
P : Final concentration of SHMP (mol/l)
rCALG: SHMP adsorption rate (L/molmin)
I : ionic strength (mol/I)
RI : mole factor
Sf : solubility factor
LSI: Langelier’s saturation index
pHs : pH of water saturated with CaCO3
TDS: total dissolved solid
Pca : negative logarithm of calcium ion concentration (mg/l)
PAIK: bicarbonate alkalinity (mg/l)
SDI : Stiff-Davis index
𝜀 : Chemical kinetics coefficient
𝛼 : Formation damage

xxiii
W : total mass of wax deposited on pipe wall (g)
𝜌𝑤 : density of wax (kg/m3)
A : pipe wall area (m2)
DT: internal diameter of test tube (m)
DR : internal diameter of reference tube (m)
ΔPT : pressure drop of the test tube (Psi)
ΔPr : pressure drop of the reference tube (Psi)
n : material constant
Wr : Wax deposition rate (cm/min)
Do : bare tube internal diameter (m)
q (t): volumetric flow rate as a function of time (ml/min)
W(t) : weight of deposit layer as a function of time (g)
I(t) : length of remaining liquid segment inside the tube at time t (m)
Pr : prandtl number
rn : radius of the tube at different location(cm)
ΔVi : volume of liquids (cm3)
Δti : change in time (min)
P: capillary pressure (Psi)

1
CHAPTER 1. Introduction
1.1 Research background
The petroleum industry provides a major source of energy supply in the world
economy .They play a vital role in creating jobs and development of nations. The
petroleum industries are being faced with production challenges to meet the
energy demand. In flow assurance these include corrosion, inorganic and organic
scale deposits and formation of stable emulsions which affect crude oil flow. One
possible way of addressing these problems is to understand the mechanism of
scale formation at the surface of facilities.
This study focuses on the deposition of inorganic scale (CaCO3) in oil and gas
production facilities. CaCO3 is one of the most common inorganic scales
encountered in crude oil production. CaCO3 scaling is triggered from pressure
drop, which promotes dissolved CO2 escaping from produced water, resulting in
an increase in the water pH and the saturation index of the brine solution being
exceeded[1, 2].
There are other inorganic scales such as BaSO4 and SrSO4 scales that occur
as a result of injecting seawater into the reservoir, where the formation water
meet and the two are incompatible [3-7]. The presence of these scales in an oilfield
can cause under deposit corrosion, reduce corrosion and scale inhibitors
efficiency, fouling of equipment, and ultimately lowering of production rates.
Scale prevention is important in oil and gas and desalination industries to ensure
optimum production. Organic and inorganic scale precipitation and deposition
have been studied and different predictive models have been developed over
many years on scale precipitation processes such as residence time, induction
time, nucleation and crystal growth. These models have been mainly based on
thermodynamic parameters.
However, little attention be made on the effect of hydrodynamic parameters on
inorganic scale surface deposition kinetics using a methodology that will reflect
the field scenario and developing a model that can predict the scale thickness

2
growth rate over a period of time and as a function of saturation index,
temperature and flow rate.
This study investigates the mechanism by which scale builds up on surface
facilities and develops an empirical kinetic model such that at different conditions
the rate of surface scale formation can be predicted.
A range of scales produced in an attempt to Enhance Oil Recovery (EOR)
operations from offshore reservoirs are shown in Figure 1-1, where pressure is
maintained by injecting sea water into the reservoir. This operation causes
severe scaling in the reservoir as a result of the different water composition
(formation water and injection water), which leads to the precipitation of barite,
celestite and gypsum. These compounds slow down the flow in production tubing
and equipment and also reduce the porosity of the surrounding rocks [8].
Figure 1-1. Scaling due to mixing of incompatible fluids (left) and auto scaling (right) [9]

3
CaCO3 precipitation, unlike other types of sulphate scale, BaSO4, CaSO4, SrSO4,
usually appears in the upper section of the production tubing, which does not
normally affect the actual formation, but it causes damage through filling of the
production string and downstream by affecting the functionality of valves and
safety equipment [10].
There are have been various methods used to mitigate inorganic scales, such as
use of hydrochloric (HCl) acid wash and mechanical scraping (pigging). These
methods are capital and labour intensive and not economically acceptable. They
do not tend to often have long term mitigation. Scale inhibitors are often deployed
to address the problem of scaling in crude oil production and desalination
industries.
The use of scale inhibitors, polyphosphino carboxylic acid (PPCA),
diethylenediamine Penta (methylene phosphonic acid) DETPMP and polyvinyl
sulfonate (PVS) have been reported to have significant effect in preventing
inorganic scale [11-15]. Shaw and Sorbie [16, 17] studied the performance of
combined effect of phosphate and polymeric inhibitors on barium sulphate scale
and compared the minimum inhibition concentration to that of the individual
inhibitors. The combined inhibitor gave better performance in terms of inhibiting
BaSO4 scale at different dosage. Chen et al [18] and Mavredaki et al [19] studied
the effect of DETPMP and PPCA on the induction time and crystal growth rate of
surface scaling, the presences of these inhibitors, changes the morphology of
calcite to at least a stable form (vaterite). However, these chemicals must be
environmentally friendly (biodegradable and bioaccumulation) in order to avoid
pollution of the environment.
Zhang et al [1] developed a kinetic and thermodynamic model to predict oilfield
down hole carbonate scales profile by studying the impact of production
parameters changes, such as increasing water cut, temperature using a tube
blocking rig, but this model did not consider the uniformity of capillary tube in
determining the scale thickness and the uncertainties of the saturation ratio of
the brine with time.
There are various organic scale models developed by Wang et al [20, 21] and Lawal
et al [22], where the thickness of asphaltene deposits across a long capillary tube

4
is determined as a function of the pressure build up across the capillary tube
during asphaltene deposition, using Hagen Poiseuille flow equation. These
models were based on the assumption that the asphaltene deposited is uniformly
deposited along the capillary.
1.2 Objectives of research
The aim of the research is to develop the understanding of scale deposition on
the surface of facilities and focuses on the kinetics of surface growth. The specific
objectives are:
To study the kinetics of calcium carbonate scale build-up on stainless steel
surfaces under hydrodynamic conditions.
To establish the influence of surface crystal growth and particle adhesion
in different environments: flow regimes, saturation ratios and presence of
particles in solution.
To develop empirical models for predicting scale deposition growth rates
under flow conditions.
Figure 1-2 (a and b), shows a cross section of a pipe and schematic diagram of
bulk scaling and surface scale in a flow system. It also illustrates the two main
locations that scale can form; as discrete particles in the bulk solution and at the
surface as a compacted solid layer. This study investigates the relationship
between bulk precipitation and surface deposition and how the deposit grows on
the facility surfaces.

5
Figure 1-2 (a) Cross section of a pipe and (b) Schematic diagram of bulk scaling and surface scale in a flow system
The formation of scale on the surface of facilities has been of a major concern in
the oil and gas industry. Understanding the mechanism of scale formation on the
surface of facilities and predicting its growth rate over a period of time will provide
better strategies for mitigating its occurrence in the field.
In this work, it is hypothesized that scale formation mechanisms can occur on the
surface of facilities, either by
Heterogeneous nucleation and crystallization processes at the
surface of the facilities or
Heterogeneous precipitation in the bulk solution and adhesion of
pre-precipitated crystals from the bulk solution to the surface of the
steel.
The methodologies used in the thesis enable these different modes of scale layer
formation to be developed.
Surface deposition
Bulk precipitation and Surface deposition
(a)
(b)

6
1.3 Thesis outline
Chapter one gives a brief overview of the scaling problem in oil and gas industry
and the current preventive methods been used within the industries and the
objectives of this study.
Chapter two provides the fundamental understanding of the scale formation,
types of oilfield scale and the factors affecting scale formation and scale
formation mechanisms and detailed preventative methods adopted in oil and gas
industries. It also includes a review of some previous work carried out by various
authors and scale deposition models.
Chapter three focuses on flow capillary rig commissioning, design, the working
principle and the details of flow parameters in the capillary rig.
Chapter four provides the experimental methodology, surface and bulk analysis
tests carried out, the equipment used and their working principles.
Chapter five shows the bulk analysis test results of calcium carbonate scale
precipitation at different experimental conditions and the interpretation of the
results.
Chapter six presents the results of calcium carbonate scale surface deposition
studies at different temperatures, flow rates and saturation ratios. The results of
different surface analysis techniques used for this work is also presented.
Chapter seven presents the analysed results, interpretation and discussion of
calcium carbonate surface deposition kinetics in relation to nucleation theory,
surface deposition mechanism and growth kinetics. The empirical models
established in this work are also presented.
Chapter eight shows the conclusions of the work and knowledge achieved
Chapter nine provides the recommended future work for this study and
references cited in this work.

7
CHAPTER 2. Scale formation literatures review
2.1 Fundamental of scale formation
Scale is defined as any hard insoluble salt deposit on the surface of materials in
the presences of water; the type of scale present in the water body depends on
the environment. Scales are formed due to the change in environmental
conditions such as pressure, temperature and water chemistry. This can result in
oilfield problems and they are expensive to control. The deposition of scale
deposits on tubular surfaces reduces the fluid flow by reducing cross-sectional
area and increasing surface roughness. Fluid flow within reservoirs is restricted
due to blockage of pores as shown in Figure 2-1.
Figure 2-1. Image of scale deposition in a pipe [9]
Calcium carbonate and barium sulphate scale are the major types of scaling
found in oilfield production wells and surface facilities. Carbonate and sulphate
scale formation can slow down production by blockage of tubing and flow lines,
and fouling of equipment [23, 24]. In order to control a potential scale problem, it is
important to determine the amount of calcium carbonate and barium sulphate
scale that will be deposited during oil and water production.
8
Scales are formed when brine contains dissolved solids at higher concentration
than their equilibrium concentration, which results in high supersaturation of the
solution due to change in concentration of ions in solution, temperature, pressure
and pH [25]. Water formation associated with crude oil production contains a large
concentration of chloride ion (Cl-), sodium ion (Na+), sulphate (SO42-),
bicarbonate (HCO3-), calcium ion (Ca2+), magnesium (Mg2+), barium (Ba2+),
potassium (K+), and strontium (Sr2+). Calcium carbonate (CaCO3), calcium
sulphate (CaSO4) and barium sulphate (BaSO4) are the most common scales
found in crude oil production facilities. The precipitation of these inorganic scales
can be influenced by temperature and pressure [26].
The degree of precipitation depends on the solution chemistry, the degree of
saturation, variation in turbulence, pressure, flow velocity and presence of
nucleating agent. The precipitation of inorganic scales increases with increasing
supersaturation ratio, which is a function of temperature and pressure.
According to Kan and Tomson [27], a major component of scale and corrosion
management is the ability to accurately predict the brine chemistry, pH and
scaling tendency of production system.
2.2 Types of oilfield scales
The type of scale formed in the oilfield depends on the ions present in the
environment. This can be classified according to their sensitivity to pH, some are
not sensitive to pH (CaSO4, BaSO4, SrSO4), but the carbonates of (dolomite,
calcite and siderite) are very sensitive to pH. This makes their deposition rate
difficult to predict because the solution pH influences their scaling tendencies [27].
2.2.1 Calcite
Calcite (CaCO3) is the most common scale found in crude oil production and
desalination industries. The earth contains about 12% by weight of calcite and
closely related carbonates. Calcite is often formed when pressure drops from
bottom hole to the surface.
Calcite scale formation is predominantly a consequence of the pressure drop
during production. At a pressure below the bubble point, carbon dioxide is
9
remove [27]. There are other consequence of pressure drop; the solubility of
calcite in sea water decreases with decreasing pressure. CaCO3 is the major
component of calcite crystals, but often some percentage of iron and magnesium
carbonate co-exist.
Calcite formed naturally, mainly contains pure CaCO3. The supersaturation of
CaCO3 can be determined using thermodynamic models and the brine chemistry
analysis. CaCO3 at high supersaturation will be in a metastable state in the
solution. CaCO3 will not precipitate in an unstable state. However, to predict if
CaCO3 will be a problem in a field, the kinetics of formation must be taken into
consideration [28, 29].
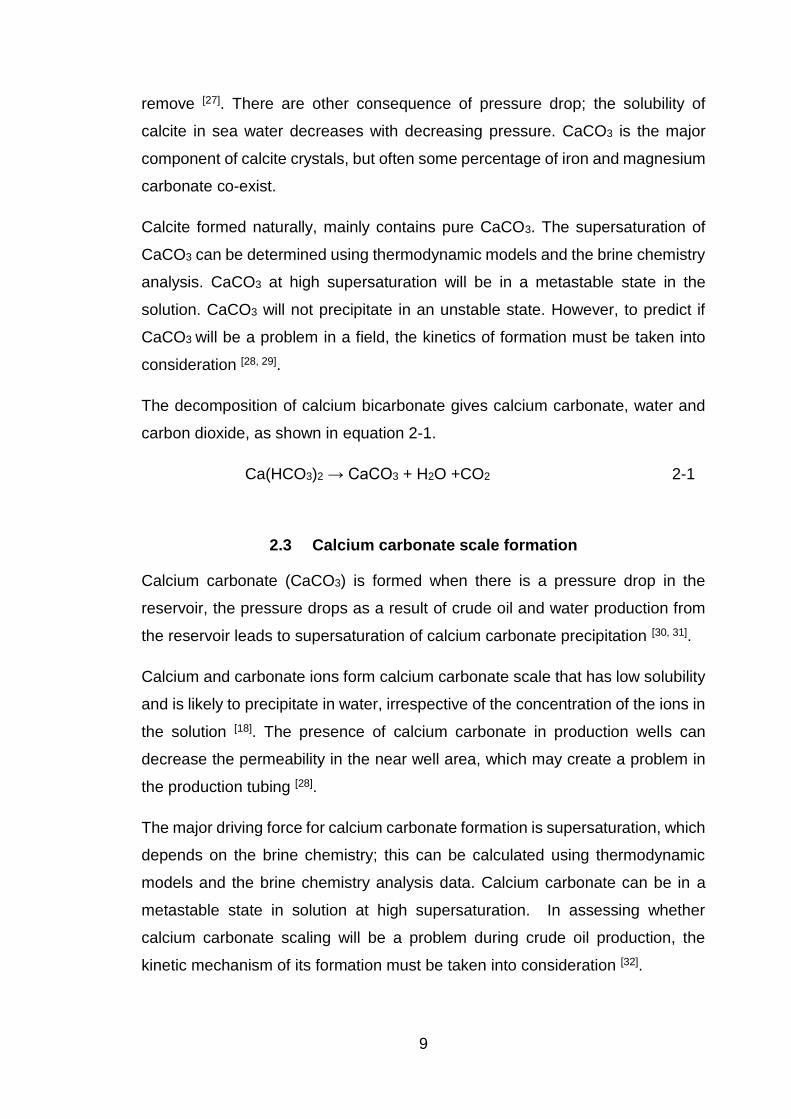
The decomposition of calcium bicarbonate gives calcium carbonate, water and
carbon dioxide, as shown in equation 2-1.
Ca(HCO3)2 → CaCO3 + H2O +CO2 2-1
2.3 Calcium carbonate scale formation
Calcium carbonate (CaCO3) is formed when there is a pressure drop in the
reservoir, the pressure drops as a result of crude oil and water production from
the reservoir leads to supersaturation of calcium carbonate precipitation [30, 31].
Calcium and carbonate ions form calcium carbonate scale that has low solubility
and is likely to precipitate in water, irrespective of the concentration of the ions in
the solution [18]. The presence of calcium carbonate in production wells can
decrease the permeability in the near well area, which may create a problem in
the production tubing [28].
The major driving force for calcium carbonate formation is supersaturation, which
depends on the brine chemistry; this can be calculated using thermodynamic
models and the brine chemistry analysis data. Calcium carbonate can be in a
metastable state in solution at high supersaturation. In assessing whether
calcium carbonate scaling will be a problem during crude oil production, the
kinetic mechanism of its formation must be taken into consideration [32].
10
Calcium carbonate is relatively easy to treat due to it solubility in acid (HCl). CO2
influences calcium carbonate formation during EOR, CO2 injected into the
reservoir generate a miscible solvent in situ through a mechanism similar to that
of high-pressure gas, but their mechanism are different.
CO2 at absolute pressure, extracts high molecular weight hydrocarbons from the
oil and concentrate them at the CO2-oil displacement front [33]. Carbonic acid
formed from the dissolution of CO2 in the formation water can dissolve carbonate
rock, which increases the concentration of calcium in the brine solution resulting
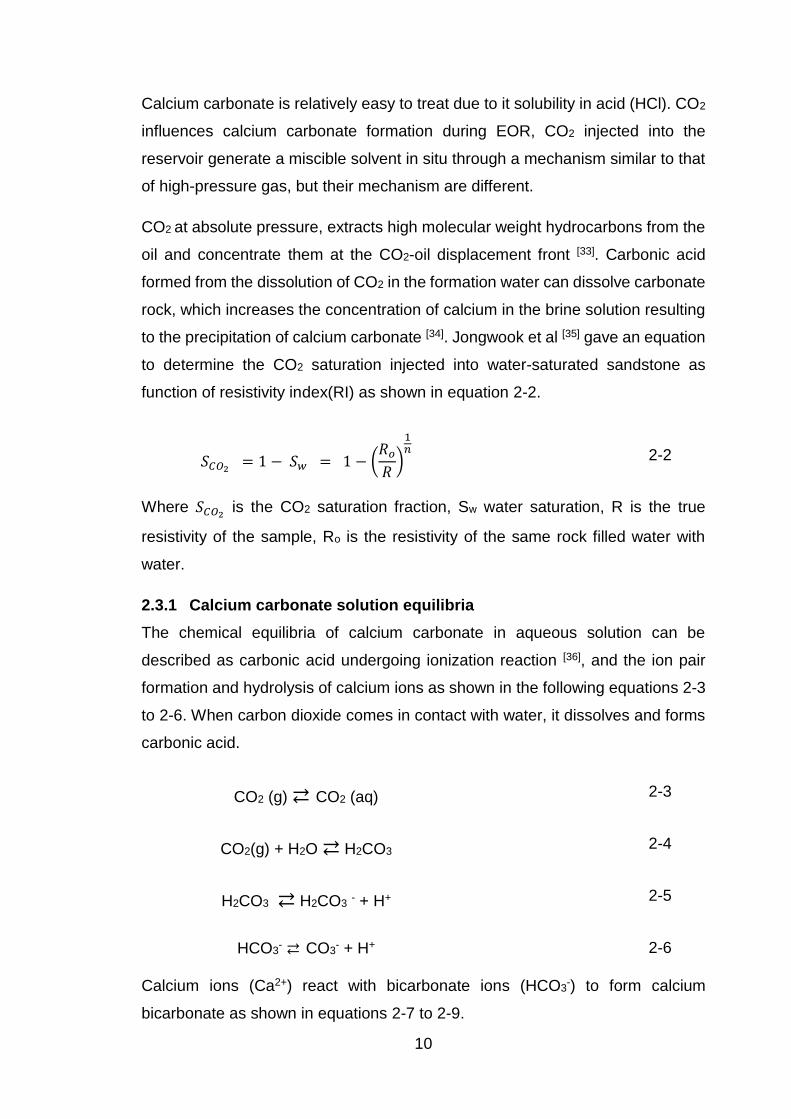
to the precipitation of calcium carbonate [34]. Jongwook et al [35] gave an equation
to determine the CO2 saturation injected into water-saturated sandstone as
function of resistivity index(RI) as shown in equation 2-2.
𝑆𝐶𝑂2 = 1 − 𝑆𝑤 = 1 − (𝑅𝑜
𝑅)
1𝑛 2-2
Where 𝑆𝐶𝑂2 is the CO2 saturation fraction, Sw water saturation, R is the true
resistivity of the sample, Ro is the resistivity of the same rock filled water with
water.
2.3.1 Calcium carbonate solution equilibria
The chemical equilibria of calcium carbonate in aqueous solution can be
described as carbonic acid undergoing ionization reaction [36], and the ion pair
formation and hydrolysis of calcium ions as shown in the following equations 2-3
to 2-6. When carbon dioxide comes in contact with water, it dissolves and forms
carbonic acid.
CO2 (g) ⇄ CO2 (aq) 2-3
CO2(g) + H2O ⇄ H2CO3 2-4
H2CO3 ⇄ H2CO3 - + H+ 2-5
HCO3- ⇄ CO3
- + H+ 2-6
Calcium ions (Ca2+) react with bicarbonate ions (HCO3-) to form calcium
bicarbonate as shown in equations 2-7 to 2-9.
11
Ca2+ + HCO3- ⇄ CaHCO3 2-7
Ca2+ + CO32- ⇄ CaCO3 2-8
Ca2+ +OH- ⇄ CaOH+ 2-9
The precipitation of calcium carbonate is given according to equation 2-10.
Ca2+ + CO32- → CaCO3 2-10
By increasing the concentration of carbon dioxide, more calcium bicarbonate is
formed. A decrease in carbon dioxide content in the system at equilibrium would
result in the formation of calcium carbonate.
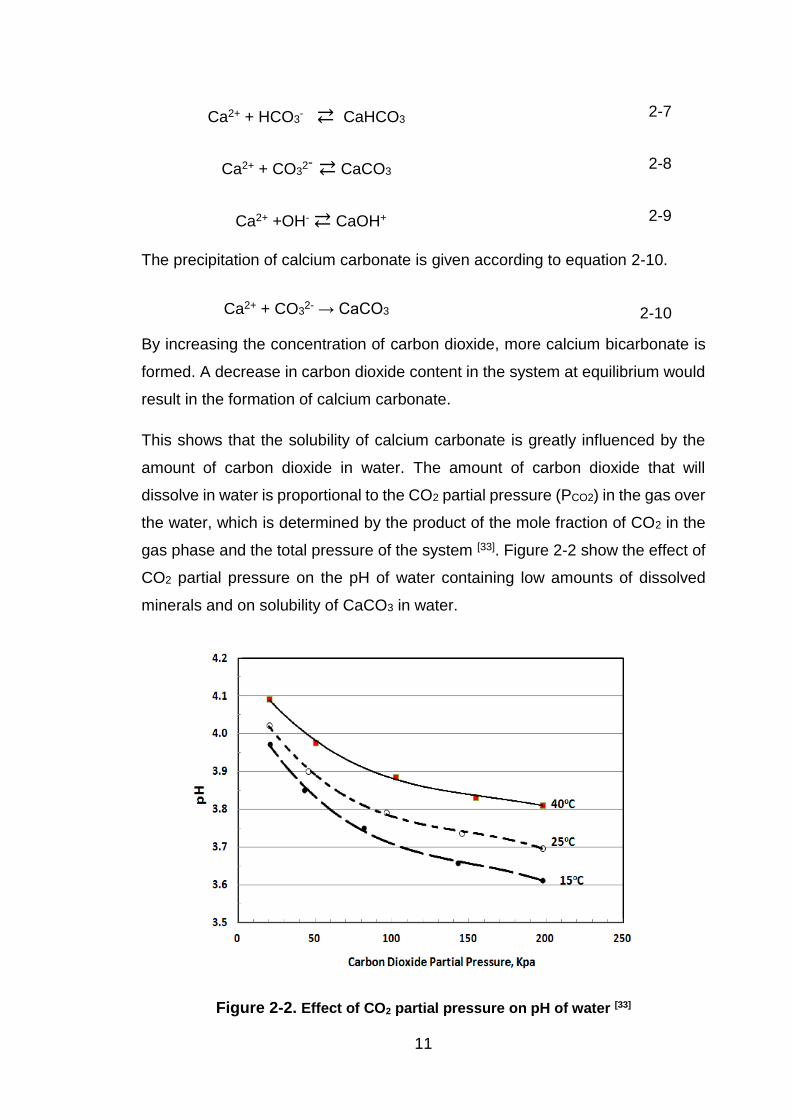
This shows that the solubility of calcium carbonate is greatly influenced by the
amount of carbon dioxide in water. The amount of carbon dioxide that will
dissolve in water is proportional to the CO2 partial pressure (PCO2) in the gas over
the water, which is determined by the product of the mole fraction of CO2 in the
gas phase and the total pressure of the system [33]. Figure 2-2 show the effect of
CO2 partial pressure on the pH of water containing low amounts of dissolved
minerals and on solubility of CaCO3 in water.
Figure 2-2. Effect of CO2 partial pressure on pH of water [33]

12
2.3.2 Forms of calcium carbonate (CaCO3 polymorphs)
Calcium carbonate occurs mainly in three anhydrous crystalline polymorphs.
These are calcite, aragonite and vaterite [37-39] . Figure 2-3 to Figure 2-5 show the
crystal images of calcium carbonate polymorphs and two hydrated crystal forms
(hexahydrate and monohydrate). It also occurs as amorphous form. Calcite is the
most stable form of calcium carbonate under room temperature; aragonite and
vaterite are metastable in nature, but vaterite is usually on an unstable state [40].
The stabilization and crystallization of these polymorphs depends on the
environmental conditions such as pH, brine chemistry (ionic medium,
concentration of ions), the degree of supersaturation, and temperature [41].
Figure 2-3. SEM image of calcite scale crystals [41]
Figure 2-4. SEM image of aragonite scale crystals [41]
13
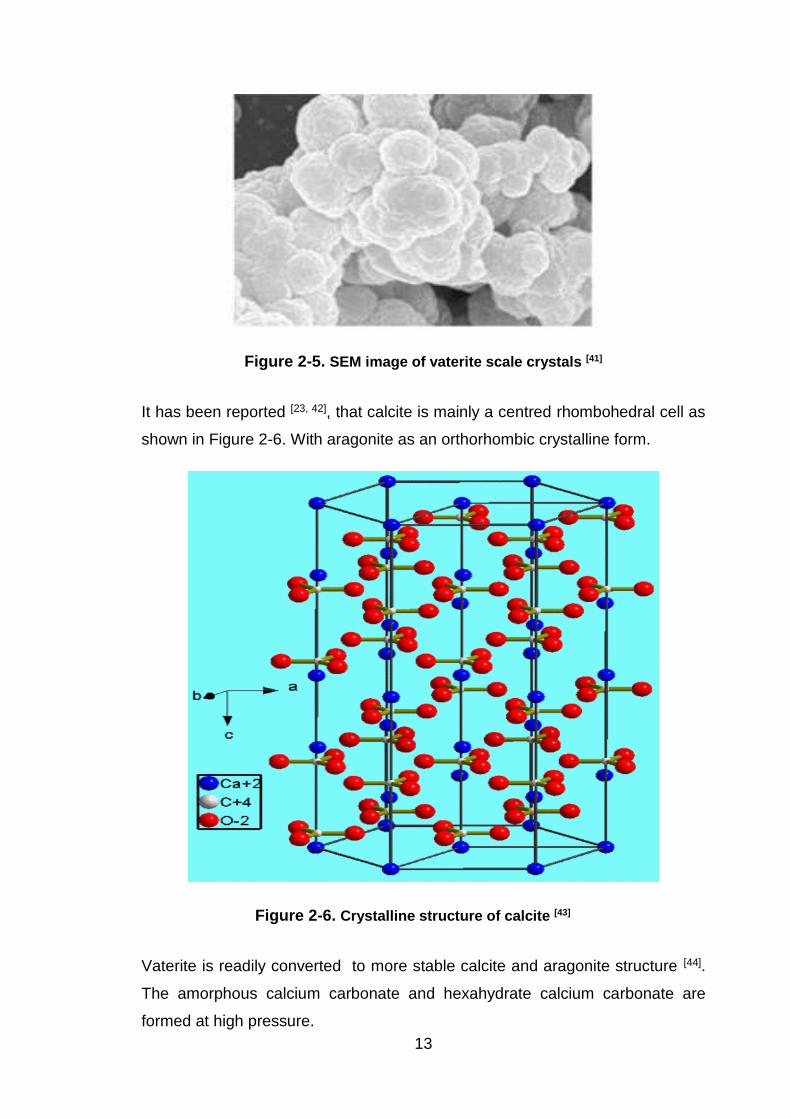
Figure 2-5. SEM image of vaterite scale crystals [41]
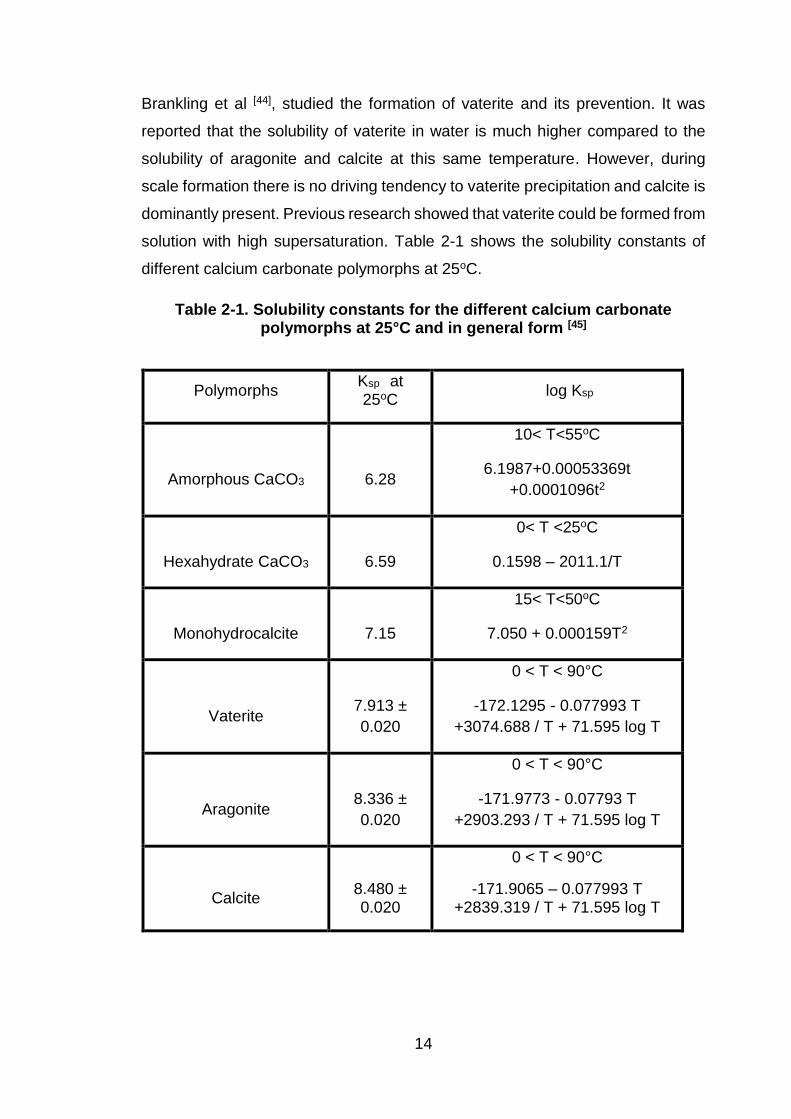
It has been reported [23, 42], that calcite is mainly a centred rhombohedral cell as
shown in Figure 2-6. With aragonite as an orthorhombic crystalline form.
Figure 2-6. Crystalline structure of calcite [43]
Vaterite is readily converted to more stable calcite and aragonite structure [44].
The amorphous calcium carbonate and hexahydrate calcium carbonate are
formed at high pressure.
14
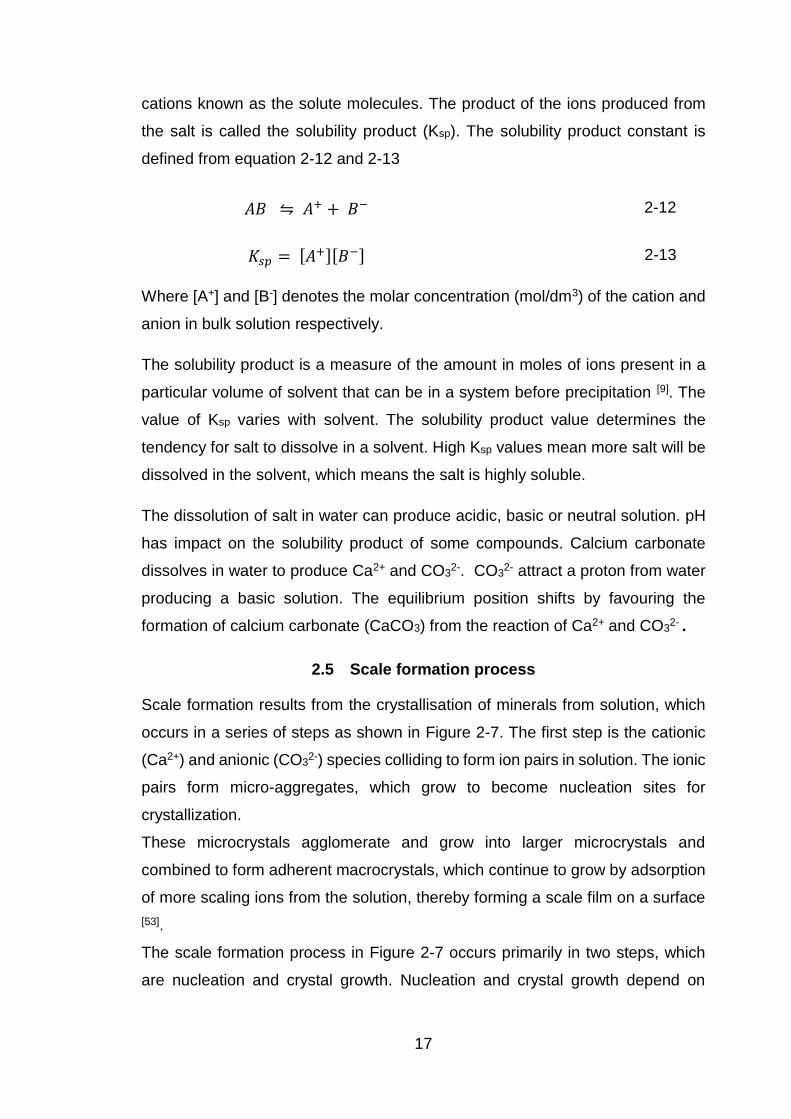
Brankling et al [44], studied the formation of vaterite and its prevention. It was
reported that the solubility of vaterite in water is much higher compared to the
solubility of aragonite and calcite at this same temperature. However, during
scale formation there is no driving tendency to vaterite precipitation and calcite is
dominantly present. Previous research showed that vaterite could be formed from
solution with high supersaturation. Table 2-1 shows the solubility constants of
different calcium carbonate polymorphs at 25oC.
Table 2-1. Solubility constants for the different calcium carbonate polymorphs at 25°C and in general form [45]
Polymorphs Ksp at 25oC
log Ksp
Amorphous CaCO3
6.28
10< T<55oC
6.1987+0.00053369t
+0.0001096t2
Hexahydrate CaCO3
6.59
0< T <25oC
0.1598 – 2011.1/T
Monohydrocalcite
7.15
15< T<50oC
7.050 + 0.000159T2
Vaterite
7.913 ±
0.020
0 < T < 90°C
-172.1295 - 0.077993 T
+3074.688 / T + 71.595 log T
Aragonite
8.336 ±
0.020
0 < T < 90°C
-171.9773 - 0.07793 T
+2903.293 / T + 71.595 log T
Calcite
8.480 ± 0.020
0 < T < 90°C
-171.9065 – 0.077993 T +2839.319 / T + 71.595 log T

15
2.3.3 Barite
Barite, also known as barium sulphate (BaSO4), is formed when two incompatible
brines are mixed together during enhanced oil recovery processes when the
pressure of the reservoir is maintained to keep the production volume of the field
[46].
Barite scale occurs when either brines (formation water and sea water) from
different oil wells are mixed or when there is flooding of high sulphate containing
water mixed with the sea water flooding. When these brines are produced and it
turns out one is high in barium and the other is high in sulphate, they mix at the
bottom of the well, but it takes some time to mix completely [27].
The saturation index of barite can be high and the precipitation is faster, which
can result in high supersaturation levels that might be difficult to control with
inhibitors, irrespective of the inhibitor dosage. Barium sulphate has very low
solubility, which makes it difficult to control. Barium ions combine with sulphate
ions to form barium sulphate as shown in equation 2-11.
Ba2+ + SO42- → BaSO4 2-11
2.3.4 Calcium sulphate
The precipitation of calcium sulphate (CaSO4) results from a mixture of
incompatible waters during water flooding. It can also result from a pressure drop
when production is from a reservoir where the brine is saturated with calcium
sulphate or from temperature increases during the processing of the brine on the
surface [27].
Calcium sulphate usually occurs in three forms, which differ by their water of
crystallization. Anhydrite (CaSO4) is the major form commonly found, gypsum
(CaSO4.2H2O) is the most stable form of calcium sulphate from temperature of
40oC to 90oC and hemihydrate (CaSO4.1/2H2O) has high total dissolved solid
content. The transition temperatures are dependent on the composition of brine
solution.

16
2.3.5 Strontium sulphate
Strontium sulphate (SrSO4) has a low solubility product constant of 3.2 × 10⁻⁷
at 25°C compared to calcium sulphates of solubility product constant of 9.1 ×
10−6 at 25°C. It occurs as a result of the mixture of incompatible brines during
water injection process.
Todd et al [47] investigated barium and strontium sulphate solid scale formation in
rock pores and discovered permeability damage and scaling crystal morphology
which was influenced by sulphate supersaturation and scaling ion concentration
ratios in the brines. The permeability was dependent on the initial rock
permeability.
2.3.6 Siderite
Iron carbonate is mainly referred to as corrosion product and not a mineral scales.
However, there is interaction between FeCO3 and CaCO3 on carbon steel
surfaces. FeCO3 will precipitate first in solution [48]. It is observed that in the
absence of corrosion, the ratio of Ca2+ to Fe2+ is approximately 100:1, due to the
corresponding solubility product (Ksp) ratios [27]. Which are 2.8 × 10⁻⁹ and 3.2 ×
10−11 respectively.
FeCO3 can be protective depending on the environmental conditions. Protective
FeCO3 films can form in wet CO2 systems provided that the pH and the dissolved
FeCO3 in the bulk solution are sufficiently high. The formation of FeCO3 film is
temperature dependent and a high supersaturation is needed to form a protective
film [49] .
2.4 Chemical background of scale formation
Formation of scales is a product of instability in the bulk solution or solution
chemistry of the scaling environments. One of the key indicators responsible for
scale formation is the solubility of the solute in solution at given temperature [50,
51] . This factor is measured by the solubility product constant (Ksp).
2.4.1 Solubility product
Solubility is the amount of solute that will dissolve in a solvent at a particular
temperature [52]. Salt is a substance formed by the reaction between positive and
negative ions. The dissolution of salt in water (solvent) produces anions and
17
cations known as the solute molecules. The product of the ions produced from
the salt is called the solubility product (Ksp). The solubility product constant is
defined from equation 2-12 and 2-13
𝐴𝐵 ⇋ 𝐴+ + 𝐵− 2-12
𝐾𝑠𝑝 = [𝐴+][𝐵−] 2-13
Where [A+] and [B-] denotes the molar concentration (mol/dm3) of the cation and
anion in bulk solution respectively.
The solubility product is a measure of the amount in moles of ions present in a
particular volume of solvent that can be in a system before precipitation [9]. The
value of Ksp varies with solvent. The solubility product value determines the
tendency for salt to dissolve in a solvent. High Ksp values mean more salt will be
dissolved in the solvent, which means the salt is highly soluble.
The dissolution of salt in water can produce acidic, basic or neutral solution. pH
has impact on the solubility product of some compounds. Calcium carbonate
dissolves in water to produce Ca2+ and CO32-. CO3
2- attract a proton from water
producing a basic solution. The equilibrium position shifts by favouring the
formation of calcium carbonate (CaCO3) from the reaction of Ca2+ and CO32- .
2.5 Scale formation process
Scale formation results from the crystallisation of minerals from solution, which
occurs in a series of steps as shown in Figure 2-7. The first step is the cationic
(Ca2+) and anionic (CO32-) species colliding to form ion pairs in solution. The ionic
pairs form micro-aggregates, which grow to become nucleation sites for
crystallization.
These microcrystals agglomerate and grow into larger microcrystals and
combined to form adherent macrocrystals, which continue to grow by adsorption
of more scaling ions from the solution, thereby forming a scale film on a surface
[53].
The scale formation process in Figure 2-7 occurs primarily in two steps, which
are nucleation and crystal growth. Nucleation and crystal growth depend on

18
temperature and the degree of supersaturation, which is the driving force for
scale formation.
Figure 2-7: Scale formation process [53]
2.5.1 Chemical potential and supersaturation
The reactivity of chemical components in solution is measured by its chemical
potential, which is determined by how the Gibbs free energy (∆G) of the system
changes when the number of moles or molecules of the reactant in the system
changes at constant pressure and temperature [54].
The system tends to minimize its Gibbs free energy by lowering its chemical
potential. The relationship between the Gibbs free energy and the chemical
activity is given in the following equation 2-14.
∆𝐺 = −1
2𝑅𝑇𝐼𝑛 (
𝐼𝑃
𝐾𝑠𝑝) 2-14
Where R denotes the molar gas constant in Jmol-1K-1, T temperature in Kelvin
(K), IP is the activity product of free ion activity [Ca2+] [CO32-] and Ksp is the
solubility product constant.
19
The chemical potential of a system is pressure and temperature dependent. The
solubility of a system is affected by the variation of chemical potential of the
system, since the solubility of a system depends on the temperature [9].
In oil and gas wells, it is very important to take into consideration the pressure
dependency due to high pressure being observed at the reservoir. The
effectiveness of chemical process is determined by thermodynamic driving force,
this driving force is represented by supersaturation. Supersaturation occurs when
there is increase in concentration of dissolved anions (CO32-) and cation (Ca2+)
to levels beyond their normal solubility limits in water [53].
Supersaturation is the driving force for scale formation; solutions can become
supersaturated as a result of changes in temperature, pressure, pH or change in
concentration of ions in solution. As the level of supersaturation increases the
system becomes thermodynamically unstable and precipitation can occur. It
should be noted that local conditions of supersaturation may occur causing scale
deposit even when the bulk average brine composition remains the same.
The scaling tendency is determined by supersaturation ratio (SR) or
supersaturation index (SI). The supersaturation ratio (SR) for calcium carbonate
is defined as:
𝑆𝑅 =[𝐶𝑎2+][𝐶𝑂3
2−]
𝐾𝑠𝑝𝐶𝑎𝐶𝑂3
2-15
The activity based supersaturation ratio for ionic compounds for crystallisation
theory is given by,
𝑆𝑎 = (𝐼𝑃
𝐾𝑎)1/𝑣 2-16
Where IP is the ionic activity product of the total number of cations and anions
which dissociate in solution and Ka is the activity based solubility product of the
salt [55]. Therefore, for calcium carbonate, the supersaturation ratio S= Sa is given
as:

20
𝑆 =
√[𝐶𝑎2+] × [𝐶𝑂32−]
𝐾𝑠𝑝 (𝐶𝑎𝐶𝑂3)
2-17
Supersaturation index is calculate from equation 2-18
𝑆𝐼 = log (𝐼𝑃
𝐾𝑠𝑝) 2-18
For scale formation to take place, there are three possibilities from the solution
with thermodynamics [56].
● SR < 1, the solution is under saturated and the tendency for scaling is not
thermodynamically feasible.
● SR= 1, the solution is at equilibrium, i.e. Scale formation and dissolution rate in
the solution is the same.
● SR > 1, the solution is supersaturated and there is high tendency for scale
formation.
2.5.2 Induction time
The induction time is the time between the occurrences of supersaturation to the
formation of stable nuclei of the precipitating salt [28]. The induction period is
greatly influence by the nature and degree of the supersaturation of the bulk
solution, the level of agitation, viscosity of the solution and presences of
impurities [57].
According to Ostvold et al [28] the measured induction time is longer than the
estimated, since the nuclei have to grow to a size that can be detected
experimentally. The induction time is determined from the equation 2-19
𝑡𝑖𝑛𝑑 = 𝑡𝑛 + 𝑡𝑔 2-19
Where tind denotes the induction time tn denotes the time for the system to reach
steady state and form the stable nuclei and tg denotes the time before the nuclei
have reached a detectable size.

21
pH can be used to monitor the start of scale precipitation, decrease in pH,
increases the rate of precipitation of inorganic scales as shown in equation 2-20
Ca2+ + HCO3- → CaCO3(s) + H+ 2-20
Ostvold et al [28], used a pH measurements as a basis to determine the induction
time for CaCO3 scales by making an assumption that the induction tind, is
inversely proportional to the nucleation rate J as given in equation 2-21
𝑡𝑖𝑛𝑑 ∝ 𝐽−1 2-21
But for a homogenous nucleation, the relationship between 𝑡𝑖𝑛𝑑 and SR is given
by equation 2-22
𝑙𝑜𝑔𝑡𝑖𝑛𝑑 ∝ [𝛾3
𝑇3(𝑙𝑜𝑔𝑆𝑅)2] 2-22
Simplifying equation 2-22 and introducing constant of proportionality A, the
relationship between (log tind) and (log SR)2 using classical nucleation theory [57,
58] as shown in equation 2-23 and 2-24
log (𝑡𝑖𝑛𝑑) = [𝐴 +𝐵
𝑇3(𝑙𝑜𝑔𝑆𝑅)2] 2-23
where 𝛾 denotes the interfacial energy (mJ/m2), between the solid phases
forming the liquid, Vm denotes the molecular volume of crystals (6.132𝑥10−23 cm3
for calcite) T the temperature (K), SR the saturation ratio, tind the induction time
(s), A an empirical constant (dimensionless), R the molar gas constant (J/mol.K),
NA denotes the Avogadro's constant (mol-1),𝑓(𝜃) is a correction factor depending
on the type of nucleation, 𝛽 is a geometric factor of 16𝜋
3 for spherical shape
crystal.
Studies [58-60], have shown a linear relationship between (log tind) and (log SR)-2,
although, most models assume homogeneous nucleation in static system, but in
reality processes such as heterogeneous nucleation might be taking place in a
flowing system [57].
B= 𝛽𝛾3𝑉𝑚2𝑁𝐴 𝑓(𝜃)
(1.3𝑅)3 2-24

22
A Study by Mavredaki and Neville[61] , shows that the induction time for nucleation
process is an important function of supersaturation, that is, increase in
supersaturation decrease the induction period for nucleation process. This
relationship is shown in Figure 2-8.
Figure 2-8: Induction time as a function of saturation ratio [61]
2.5.3 Nucleation
Nucleation occurs at nucleation sites of surfaces contacting the liquid or vapour
suspended particles. The development of crystals occurs in solution after
creation of ionic species, nuclei or seeds, which acts as sites for crystallization.
Nucleation is a process that can occur spontaneously or be induced by external
influence such as agitation, mechanical shock, pressure and friction within the
solution [62]
One of the features of nucleation is the ability to form a metastability of the old
phase. This process requires it to overcome the free energy barrier [63]. This is
clear by considering the change free energy during the formation of the nucleus.
The free energy for the bulk solution is less than that of the solvent phase, but
this does not apply.

23
The surface molecules are lightly bound to their species compared to that of bulk
solution, therefore their contribution to the free energy of the new phase is
greater. Surface energy is the term use to describe the difference between the
free energy of the bulk solution per molecules and that of the surface.
Nucleation is divided into two part, primary nucleation, where the formation of
new crystals do not depend on the presence of pre-existing crystals and
secondary nucleation, where the formation of new crystals is driven by the
presence of existing crystals in the bulk solution. Figure 2-9 shows the schematic
illustration of the two types of nucleation.
Figure 2-9: Types of nucleation [57]
2.5.4 Primary nucleation
Primary nucleation is the type of nucleation that occur, where the formation of
new crystals is independent of the pre-existing crystals. This can occur
spontaneously or induced by the presence of foreign particles in the solution.
This type of nucleation process is referred to as homogenous and heterogeneous
nucleation.
2.5.4.1 Homogenous nucleation
Homogenous nucleation is the formation of nuclei in the absences of any foreign
materials. It is much more difficult in the interior of a uniform substance.
Homogenous nucleation process is spontaneous and random, but it requires

24
superheating or super cooling of the medium [64]. The formation of interface at the
boundaries of a new phase results from the creation of nucleus.
Figure 2-10 shows the nature of homogenous nucleation process for barium
sulphate scale. Homogeneous nucleation occur at high supersaturation.
Studying the kinetics of homogeneous nucleation process is sometimes difficult
due to the challenges in designing a system free of impurities and impurities
presents in the system can accelerate the nucleation process [65, 66].
Figure 2-10: Homogenous nucleation [67]
The classical nucleation based on vapour condensation is used to describe the
homogeneous nucleation process in terms free energy in relation to the variation
to nucleus size as shown in Figure 2-11.

25
Figure 2-11: Free energy diagram for nucleation and critical nucleus [57]
The overall free energy changes in homogeneous nucleation process is given in
2-25 according to classical nucleation theory [57]
∆𝐺 = ∆𝐺𝑣 + ∆𝐺𝑠 2-25
Where ∆𝐺 denotes the overall excess free energy between a small spherical
particle of radius r and the solute in solution, ∆𝐺𝑣 denotes the free energy of
transformation between the solution and large particle. ∆𝐺𝑠 denotes the energy
related to the creation of new surface. ∆𝐺𝑠 and ∆𝐺𝑣 depend on r differently,
with ∆𝐺𝑣 negative and ∆𝐺𝑠 positive.
The overall free energy of formation ∆𝐺 may reach a maximum ∆𝐺𝑐𝑟𝑖𝑡 vaule. This
maximum value is responsible for the formation of stable particles and
corresponds to the critical size of a nucleus. The radius rc of the critical nucleus
corresponds to the minimum size at which a nucleus is stable.
The characteristics of a newly created crystalline lattice structure in a
supersaturated solution depends on its size, it may either grow or dissolve. This
depends on the following conditions [57].

26
r > rc, the particle will grow
r < rc, the particle will dissolve or evaporate due to insufficient
energy to create its surface.
The nucleation rate J in terms of free energy for the critical cluster size ∆𝐺𝑐 is
given as
𝐽 = 𝐴 exp (−∆𝐺𝑐
𝐾𝑇) 2-26
Where A denotes the experimental factor constant, ∆𝐺𝑐 denotes the free energy
change for the critical cluster size, K Boltzmann constant, T temperature.
The free energy change for the critical cluster size ∆𝐺𝑐 is given as,
∆𝐺𝑐 = 16𝜋𝛾3𝑣2
3(𝐾𝑇𝐼𝑛𝑆𝑅)2 2-27
Where ɣ denote the interfacial energy in mJ/m2, v the molecular volume in cm3
/mol and SR, saturation ratio.
2.5.4.2 Heterogeneous nucleation
Heterogeneous nucleation occurs when scale grows on pre-existing surface
defects such as rough spots on the liquid-tubing surface [67, 68] as shown in Figure
2-12. It applies to the phase transformation between any two phases of solid,
liquid or gas. Heterogeneous nucleation occurs more frequently than the
homogenous nucleation.
It forms at pre-existing surfaces. Such surfaces have low effective surface
energy, thereby decreasing the free energy needed for nucleation, which is equal
to the product of homogenous nucleation and the function of the contact angle
[57] as shown in equation 2-28.

27
Figure 2-12: Heterogeneous nucleation[67]
In heterogeneous nucleation, the total energy changes for the formation of a
critical nucleus ∆𝐺𝑐 must be less than the corresponding free energy change for
homogeneous nucleation i.e.
∆𝐺𝑐𝐻𝑒𝑡𝑒𝑟𝑜𝑔𝑒𝑛𝑒𝑜𝑢𝑠 = ∅∆𝐺𝑐𝐻𝑜𝑚𝑜𝑔𝑒𝑛𝑒𝑜𝑢𝑠 2-28
Where Ø is between 0<Ø<1.
According to classical nucleation theory [28, 69], one of the factors controlling
nucleation process is interfacial energy. Figure 2-13 shows the three interfacial
energy phases during nucleation process (solid surface, liquid and crystalline
deposit).

28
Figure 2-13: The interfacial energy at the boundaries between three phases [70]
Where 𝜸𝒄𝒍 denotes the interfacial energy between solid crystalline phase and
liquid, 𝜸𝒔𝒍 denotes the interfacial energy between the foreign solid surface and
the liquid, 𝜸𝒄𝒔 denotes the solid crystalline phase and foreign solid surface and θ
denotes the contact angle between the crystalline deposit and the foreign solid
surface, which also referred to as the angle of wetting in liquid to solid surface.
The relationship between this three phases and contact angle is given by
equation [70] 2-29 and 2-30
𝛾𝑠𝑙 = 𝛾𝑐𝑠 + 𝛾𝑐𝑙𝑐𝑜𝑠𝜃 2-29
𝑐𝑜𝑠𝜃 = 𝛾𝑠𝑙 − 𝛾𝑐𝑠
𝛾𝑐𝑙
2-30
2.5.5 Secondary nucleation
The nucleation process that occur due to the presence of pre-existing crystals of
material being crystallized is termed secondary nucleation [71]. In solid phase,
secondary nucleation process result from the presence of particles or crystals of
the same substance. Secondary nucleation is quite different from primary
nucleation (homogeneous and heterogeneous nucleation) process, as
heterogeneous nucleation occur due to the presence of foreign interface.

29
Daudey et al [72] and Elodie et al [73] define two major mechanism of secondary
nucleation in solution crystallization as a mechanical process and an activated
process. In the mechanical process, secondary nuclei are formed by attrition
which involves the disintegration of the crystals into two dissimilar parts. This
process occurs at a very low saturation ratio. The activated process is sometimes
referred to as surface nucleation. This process occurs at a certain level of
supersaturation around the crystal or activating the nuclei in the bulk solution.
Heidjen et al [74] differentiate the two secondary nucleation mechanisms as shown
in Figure 2-14.
Figure 2-14 : Visualisation of the difference between mechanical breeding and surface breeding [74]
Clifford et al [75] suggested that solution-solid interface is the main source of
secondary nucleation and identified supersaturation at the interface between the
solution and growing crystals as the main parameter for secondary nucleation
process.

30
2.5.6 Crystal growth
Crystal is a solid material whose constituent atoms, molecules or ions are
arranged repeating pattern extending in all three dimensions. Crystal growth is
a major stage of crystallization process, it consist of the addition of new atoms,
ions or polymers stings into the characteristic arrangement of a crystalline. Once
a stable nuclei is formed, whose particles is larger than the critical size, they start
to grow into a visible crystal size [57].
Crystal growth is connected with its surface area and the free energy, a low
surface energy and surface area promote crystal growth stability. Three key
mechanism of crystal growth was proposed by researchers [57]. These are,
surface energy theory, adsorption layer theory and diffusion theory.
Margrethe et al [9] reported that, in a supersaturated solution, unstable clusters of
atoms develop local fluctuations in the equilibrium concentration. This can
increase the tendency for these clusters to form seed crystals, these crystals
grow by adsorbing ions, preferably at defects in the surface.
The crystals exhibit a reduction of free energy when expanding its surface due to
critical size of the crystals, this favours the growth of a larger crystals. Crabtree
et al [67] studied that, crystal growth also tends to initiate on a pre-existing fluid-
boundary surface, called heterogeneous nucleation. That high degree of
turbulence can speed up scale deposition
2.5.7 Crystal growth mechanism and theory
The following crystal growth mechanism and theory is discussed under the
following headings.
2.5.7.1 Surface energy theory
Gibbs suggest that, the shape of a growing crystals has a minimum surface
energy, and the total free energy of a crystal in equilibrium with its surrounding
at constant temperature and pressure would be minimum for a given volume,
assuming the volume free energy per unit volume is constant throughout the
crystal [57].
Crystals developed an equilibrium shape when it is allowed to grow in a
supersaturated medium. i.e. the development of the various faces must be in
31
such manner that, the entire crystal has minimum total surface free energy for
specific volume [57].
According to Wuff [76], the equilibrium shape of a crystal is related to the free
energies of the faces. It proposed that, crystal faces would grow at rates
proportional to their respective surface energies and the total growth rate of a
face should be inversely proportional to the lattice density of the respective lattice
plane. Which implies that, high index faces grow faster than low index faces and
the velocity of growth of a crystal face is measured by the outward rate of
movement in a direction of the face.
2.5.7.2 Adsorption layer theory
The adsorption layer theory according to Volmer, assumed that crystal growth is
a discontinues process, which is based on the existence of an absorbed layer of
solute molecules or atom on a crystal face [57, 77]. The theory also suggested that
when units of the crystallizing substance get to the crystal face, they do not
integrate instantly into the crystal lattice. But lose its degree of freedom and
migrate over the crystal face by surface diffusion, which is loosely adsorbed at
the interface and a dynamic equilibrium is created between the layer and the bulk
solution.
The adsorption layer is important in formation of the crystal growth and secondary
nucleation. The adsorbed layer has a thickness layer not more than 10nm. Ions
or molecules link into the lattice in the position where the greatest attractive force
at the active centre, which is build stepwise under ideal condition and the ionic
continue until the entire plane face is completed before a further layer can
commence. A centre of crystallization is established on the plane surface [78].
This was suggested by Gibbs-Volmer as two-dimensional nucleus [76].
The rate of two-dimensional nucleation rate is expressed as:
𝐽 = 𝐵 ∗ 𝑒𝑥𝑝 (−∆𝐺𝑐𝑟𝑖𝑡
𝐾𝑇) 2-31
𝐽 = 𝐵 ∗ 𝑒𝑥𝑝 [−𝜋ℎ𝛾2𝑣
𝐾2𝑇2𝐼𝑛𝑆𝑅] 2-32

32
Where J denotes the two-dimensional nucleation rate, B denotes a constant
define by equation 2-23, v molecular volume of nucleus(cm3), r radius of the
circular disc (cm), h height of the circular disc, 𝛾, interfacial energy (mJ/m2), K
Boltzmann constant (J/K), T temperature (K)
2.5.7.3 Diffusion Theory
Noyes and Whitney considered that the deposition of solid on the face of a
growing crystal is a diffusion process, and the process is controlled by the
concentration difference at the solid surface and in the bulk of the solution [57].
This assumption was represented by equation 2-33
Where m denotes the mass of solute deposited at time t, A the surface area of
crystal, C denotes solute concentration in the solution, Ce equilibrium saturation
concentration, Km mass transfer coefficient.
Berthoud and Valeton [79], modified equation 2-33 and assumed a two step
process in the mass deposition. They suggested the processes as diffusion
process, whereby the solute molecules are transported from the bulk solution of
the fluid phase to the solid surface, followed by surface reaction where the solute
molecules are integrated into the crystal lattice [57, 80]. These two processes are
influence by concentration differences at the solid surface and the bulk solution
as shown in equation 2-34 and 2-35 respectively.
Diffusion process 𝜕𝑚
𝜕𝑡= 𝐾𝑑𝐴(𝐶 − 𝐶𝑠) 2-34
Surface reaction 𝜕𝑚
𝜕𝑡= 𝐾𝑟𝐴(𝐶𝑠 − 𝐶𝑒) 2-35
Where Kd denotes the mass transfer coefficient, Kr rate constant for surface
reaction, Cs solute concentration in the solution at the crystal interface.
𝜕𝑚
𝜕𝑡= 𝐾𝑚𝐴(𝐶 − 𝐶𝑒) 2-33

33
Vekilov et al [63] illustrated the atomic processes occurring at a crystal surface.
The surface consist of flat regions called terraces and raised partial layers called
steps. The steps contains the kinks sites, which are very useful, since molecules
that attach there are bonded to the other molecules than the ones attach to the
terraces, which are more likely to attach strongly to the surface as shown in
Figure 2-15.
Figure 2-15: The kinetics of scale crystal growth [63]
(a) Illustration of the atomic processes during crystal growth. Solute molecules
enter kinks either directly from solution or after adsorbing and diffusing across
terraces. Island can nucleate on the terraces provided they overcome the free
energy barrier to 2D nucleation illustrated in (b). (c) Shows the geometry of a
dislocation hillock. The existence of a critical size leads to the formation of the
spiral structure, since the new segment of the step cannot move until it reaches
that size [63].

34
2.6 Adhesion
Surface scaling is a major challenge being faced in oil and gas and desalination
industry, and one of the mechanism by which scale is form on the surface of
facilities, is adhesion of pre-precipitated crystals.
Adhesion occurs when surfaces cling to one another by intermolecular forces
such as valence forces. The scale crystals can attach to the wall of the substrate
either by nucleated crystals being transported to the surface of the capillary cell
or agglomerate in the bulk where they attach to the surface of the substrate. This
process can occur through intermolecular forces such as Van der Waals force,
electrostatic interaction and chemical bonding [81-84]. Adhesion is complex
phenomenon as Physicists and Engineers define adhesion as the total force
exerted when two adhered materials are separated [70, 85] .
According to Collins [86], the mechanism by which scale crystals deposit on the
surface of facilities under flow conditions, depends on the size of the crystals,
geometry of the substrate and the flow regime of the system.
In scaling, the question in relation to adhesion relates to how the scale crystals
can attach to the surface of substrates. The key questions are:
Do the nucleated crystals evolve from the flow and are they transported to
the surface of the steel?
Do the crystals form and agglomerate in the bulk and transport to the
surface where they adhere?
Which forces are responsible for the adhering of these crystals
Studies [85, 86], suggested that, pre-precipitated crystals from the bulk solution are
transported to the surface of the substrates or wall of the pipe through the
following mechanism.
Transport due to inertial forces
Brownian diffusion

35
Eddy diffusion
Deposition due to shear dispersion and forces
Deposition resulting from gravity forces
Particle motion resulting from electrostatic forces
However, these transport mechanisms depends on the flow regime, pipe
geometry and the particle size. Figure 2-16 labelled 1, 2 and 3, show the
interaction of crystals in bulk solution to the surface of substrates. For a pre-
precipitated crystal to adhere to the surface of the substrate, it depends on the
following conditions stated in Table 2-2
Figure 2-16: Interaction of crystals in bulk solution to the surface of a substrate

36
Table 2-2: Properties of crystals (1), substrate (2) and environment (3) that affect the adherence of crystals to the surface of substrates
Crystal properties(1) Substrate Properties (2) Environment (3)
Particle size and shape distribution
Surface roughness Salinity
Concentration Material type (charge, energy)
Temperature
Flow rate Wettability Flow regime
Surface charge
The adherence of crystals to the surface of substrate does not occur instantly
when particles gets to the surface due to the presences of energy barrier to
deposition [86].
2.6.1 Surface energy and adhesion forces
The adhesion process is best described in terms of colloid chemistry, which is
mainly associated with a fouling process. Adherence of scales to the surface of
materials is governed by Derjaguin, Landau, Verwey and Overbeck (DLVO)
theory [83]
The total interaction energy ΔGT between a deposit and a metal surface is given
as the sum of the individual interaction parameters [86] as shown in equation 2-36.
∆𝐺𝑇 = ∆𝐺𝑊 + ∆𝐺𝐸 + ∆𝐺𝐴 + ∆𝐺𝐵 2-36
Where ΔGw denotes the Lifshitz –van der Waals interaction component, ΔGE,
electrostatic double-layer component, ΔGA, Lewis acid-base component, ΔGB,
Brownian motion component. Adhesion or deposition will take place when ∆𝐺𝑇 is
negative.
The DLVO theory is the combined effect of Van der Waals and double layer force.
The Van der Waals forces correspond to low strength interactions between
molecules, atoms and crystals. The repulsion is due to the formation of an
electrical double layer close to the surface when immersed in a liquid [86] Van der
37
Waals force comprises of different forces acting, this include dipole-dipole force,
dipole–induced force and dispersion forces, the dispersion forces are always
present.
The double layer force is associated with a surface in a liquid which may be
charged by adsorption of charged molecules such as polyelectrolyte from the
solution and is effected by the presences of the surrounding ions. This results in
development of a wall surface potentials which will attract counter ions from the
surrounding solution and repel surface charge balanced by opposite charged
counter ions in the solution. In electric double layer, ions in the region closer to
the wall surface are strongly bound to the surface [87].
A study by Malte [87] reported that increasing the distance of substrate surfaces,
the ionic concentrations values of the solution changes. The layer of ions in rapid
thermal motion is referred to as diffused electric double layer. Surface energy
has been reported as one of the factors influencing the adherence of scale
crystals to the surface of substrates [70, 88].
Surface energy is the energy required to build an area of a particular surface or
the corresponding energy required by solid to attract or repel different substance.
Surface energy is a key parameter in describing adhesion properties of any solid
materials.
2.6.2 Measuring work of adhesion and surface energy
There are different methods of measuring work of adhesion, one of the method
is by measuring the contact angle formed when a drop of liquid is applied to a
solid surface [70]. Work of adhesion is the energy released in the process of
wetting, it is a measure of the strength of the contact between two phases.
Recalling equation 2-29 and 2-30,Young established the relationship between
surface free energies and contact angle [70] as stated.
𝛾𝑠𝑙 = 𝛾𝑐𝑠 + 𝛾𝑐𝑙𝑐𝑜𝑠𝜃 2-37
𝑐𝑜𝑠𝜃 = 𝛾𝑠𝑙 − 𝛾𝑐𝑠
𝛾𝑐𝑙
2-38
38
Where 𝛾𝑐𝑙 denotes the interfacial energy between solid crystalline phase and
liquid, 𝛾𝑠𝑙 denotes the interfacial energy between the foreign solid surface and
the liquid, 𝛾𝑐𝑙 denotes the solid crystalline phase and foreign solid surface and θ
denote the contact angle between the crystalline deposit and the foreign solid
surface.
Dupre [70], define work of adhesion, using equation 2-39
𝑊𝑎 = 𝛾𝑠𝑙(1 + 𝑐𝑜𝑠𝜃) 2-39
Where 𝛾𝑠𝑙 and θ are determined experimentally.
2.7 Factors affecting scale formation
Various operating factors can influence the formation of scale. It is well known
that pH, temperature, operating pressure, flow velocity, degree of
supersaturation and presence of other salts or interference ions in solution can
influence scale formation [89].
2.7.1 Effect of pH
The pH of a solution determines the degree of alkalinity or acidity of the solution.
pH is one of the major factors which influence the scale formation process. The
pH of scale solution influences the saturation and precipitation. As the pH of a
solution increases, the conversion of bicarbonate to carbonate also increases,
hence the tendency for calcium carbonate formation.
Gomez [90], studied the influence of the initial pH and supersaturation on the
induction times by carrying out a series of experiments at 25oC, in 2.2dm3
capacity batch reactor, he observed that the pH decreases along the process.
The crystallization produces a progressive local accumulation of protons near the
crystal surface, which also reflected in the decrease of the pH in the bulk solution.
Andritsos and Karabelas [91], reported the effect of pH on calcium carbonate scale
formation. The study showed that increasing the pH of solution leads to rapid
deposition of calcium carbonate scale from 2mgcm-2 to 12mgcm-2, after 2hours
tests of experiment. And also between the pH of 8 and 8.8, there was no

39
spontaneous precipitation of calcium carbonate scale observed for up to 2hours
of the run.
Prassad [53] study the dependency of solubility on pH. The study showed that, pH
affects the formation of calcium carbonate by controlling the level of CO32-
present in the solution since both the carbonate and bicarbonate ionic pair of
weak acid. The pH also have effect on the equilibrium of hydronium ion (H3O+).
The effect of solubility dependency on pH is shown in Figure 2-17.
Figure 2-17: Solubility of calcium carbonate in pure water as a function of pH [53]
2.7.2 Effect of temperature
Temperature is one of the crystallization parameters that affects the degree of
precipitation and supersaturation of inorganic scales [27, 89]. The kinetics of
calcium carbonate scale increases with increasing temperatures and increases
rapidly at a temperature above 60oC [92].
According to Troup et al [93], solubility of salts is a function of temperature and
pressure, which means supersaturation can occur as a result of change in
temperature and also the solubility of inorganic salts is either partially constant or
increases with increased temperature. Nevertheless, for most alkaline scales,
their solubility decreases with increase in temperature.

40
Todd et al [47], studied the effect of temperature on barium sulfate and strontium
sulfate scale. In the study, they observed that the morphology of barium and
strontium sulfate crystals changes by increasing the precipitation temperature
from 20oC to 70oC. In the study, they concluded that crystals that precipitate at
high temperature are less defect.
Temperature influences the crystallization behaviour of polymorphs. A study by
Mitsutaka [94] showed that at a high temperature of 50oC, the nucleation of
aragonite, calcite and vaterite crystals was observed, but at lower of 25oC fine
particles of calcite and vaterite crystals were observed without the presence of
aragonite crystals.
Young et al [95], show the effect of temperature on the morphology of calcium
carbonate crystals. In the study, they observed that at 25oC, spherical particles
composed of vaterite and calcite crystals were present, whereas at a temperature
of 60oC, a needle-like particles composed of aragonite crystals were observed.
They attributed the changes in the morphology of calcium carbonate scale to
thermal vibration and effect of temperature on solubility of CaCO3 scale. It was
also observed by Feng et al [96], that temperature has an impact on the particle
size of CaCO3 scale deposition by influencing the pH of the solution. At a lower
pH of the solution, large sizes of CaCO3 were observed.
Muryanto et al [97], reported that there is a reduction in the amount of calcium
carbonate scale deposited at lower temperature with high malic acid
concentration. At higher temperature, the activation energy of the scaling ions or
molecules increases, resulting in a faster reaction rate. This invariably increasing
the deposition rate of calcium carbonate scale and it was also observed from
their study that the morphology of calcium carbonate scale changes with
increasing temperature.
Dyer et al [98], studied the effect of temperature and pressure on oilfield scale
formation. The study report that, as the temperature increase, the scaling
tendency of the carbonate scaling brine increased. The scaling tendency of
sulphate scaling system decrease with increased temperature. Which they
concluded that the effect of temperature on scaling tendency is more significant

41
than that of the pressure. Figure 2-18 shows the effect of temperature on the
solubility of inorganic scales.
Figure 2-18: The effect of temperature on the solubility of inorganic scales [67]
2.7.3 Effects of operating pressure
Scaling usually occur when there is decrease in pressure of the formation water.
Calcium carbonates precipitate from the produced water as the release of CO2
causes an increase in pH and the degree of supersaturation of the carbonate
solution [99].
According to Amer et al [100], at different operating pressure, clear water in the
reservoir, mix with the reservoir brine which might result to scale precipitation. A
decrease in pressure of the brine solution, leads to a lower solubility of the salt.
Pressure also affect the rate of permeability of scale. Increase in pressure,
decreases the rate of permeability of scales. The reaction rate of the ionic species
increases with increasing pressure. Figure 2-19 shows the predicted barium
sulphate supersaturation as a function of pressure and temperature.

42
Figure 2-19: Predicted barium sulphate supersaturation as a function of pressure and temperature [100]
2.7.4 Effects of solution supersaturation
Supersaturation is one of the driving forces for crystallization [101, 102]. The degree
of supersaturation determine the scaling tendency of oilfield brine. Scale
formation occur when the solution brine attain the supersaturation level.
Supersaturation also influences the crystal growth and agglomeration of scales,
which affects the crystal size, amount of precipitate, particle morphology and
polymorphism. Some of the effect of supersaturation on scale precipitation and
deposition from literature is presented below.
A study by Mitsutaka [94] reported that the morphology of CaCO3 is influenced by
the concentration of the reactant solutions. And also in the study, they observed
that the crystal size of CaCO3 decreases with concentration. They attributed the
change in crystal size to high nucleation rate resulting from high supersaturation.
At high supersaturation, a metastable vaterite tends to crystallize and a stable
calcite precipitate at low supersaturation. The amount of vaterite formed
increases with solution concentration.

43
Moghadasi et al [103], observed in their study that increasing the supersaturation
ratio of both barium and strontium sulphate scales produced an increased in the
amount of scale formed and the morphology of the crystals changes with
supersaturation.
Alsaiari et al [104] studied the interaction between ferrous iron and calcium iron in
supersaturated solution of calcium carbonate scale in continuous stirred tank
reactor. It was observed from their study that calcium ions greatly influence the
solubility of iron carbonate, whereas the effect of ferrous iron in the solubility of
calcium carbonate in the solution was not significant, this was attributed to the
increased stability of complex ferrous iron formed in the presences of calcium.
Different regions of variation of iron behaviour was distinguish as shown in Figure
2-20, R-1 represent the transition of solution from stable state to a metastable
state, at this region no precipitation was observed, Region R-2 indicate the
precipitation of iron with no precipitation of calcium, due to low solubility of iron.
R-3 indicate the region where the precipitation was completely stopped, while R-
4 show the region where both siderite and calcite precipitate spontaneously
resulting from high supersaturation of both iron carbonate and calcium carbonate.
Figure 2-20: Change in saturation index (SI) with time [104]

44
2.7.5 Effect of flow velocity and hydrodynamic conditions
Studies [46, 101, 105] have shown that flow velocity, Reynolds number, shear stress,
turbulence etc. affect the morphology of inorganic scale in a flow system. It is
also reported that morphology of calcium carbonate polymorphs changes with
residence time [106].
The work of Sutherland et al [46] shows that turbulence increases the likelihood
of scale formation and also has an impact on the efficiency of scale Inhibitors.
Zhang et al [1], observed that calcium carbonate scaling rate increase sharply with
increased flow velocity, which become relatively stable when the velocity is above
0.5m/s, but above 0.7m/s, the calcium carbonate scaling rate drops, which may
be due to shear forces resulting from high flow velocity.
According to Moghadasi et al [103], under dynamic flow conditions, the structure
of the crystals formed are similar to that formed under static conditions, but the
crystal faces change at high shear stress.
Hasson et al [80] studied the influence of hydrodynamics on the degree of CaCO3
formation, comparing two flow systems. One consists of a supersaturated
solution flowing as a falling film system and the other consist of a supersaturated
solution in full pipe flow. The deposition and inhibition mechanism were different
in both flow system, the inhibition of the film falling system was more effective
compared to that the full pipe flow system; however the deposition rate was
greater in the film falling system. The reason given was that, the supersaturation
level for the full pipe flow system was constant, but high supersaturation level
was observed in a significant portion of the falling film system which could create
a spontaneous nucleation in the system forming colloids particles, these particles
diffuse to the wall of the tube.
A study by Chen et al [107] showed that under hydrodynamic conditions, calcium
carbonate polymorphs which was unstable at the initial stage of crystallization
disappear and aragonite crystals were mainly present in the bulk solution.
Muryanto et al [97] reported that the mass of CaCO3 deposited increases with
increased flow rate for both blank test and addition of malic acid under laminar
flow conditions. They attributed this increase in mass of CaCO3 to the rate of

45
reaction of the scaling ions in the bulk solution. High flow rate, increases the rate
of precipitation and deposition of CaCO3.
2.7.6 Effect of solution chemistry
The formation of carbonate and sulphate scale depends mainly on the solution
composition and environmental factors. Solution chemistry has major influence
on inorganic scale formation [108-110]. The composition of the ionic species in
solution determines the degree of supersaturation. As the rate of scaling ions
increases, the solution becomes more supersaturated depending on the
environmental conditions such as temperature and pressure [26].
Maria et al [111] determined the rate of precipitation of barium and strontium
sulphate from a supersaturated solutions, by considering three deep water
operations fields with different scaling tendencies. The study shows that the rate
of precipitation decreased at lower temperature and depended on the water
chemistry of the field, in line with equation 2-40.
𝐽 ∝ 𝑇3𝑆𝑅2 2-40
2.7.7 Effect of impurities
The presence of foreign minerals or ions have strong influence on inorganic scale
formation [67, 112, 113]. The work by Karabelas [114] examined the effect of foreign
particles scale formation. A small amount of particles affect the morphology of
calcium carbonate, but it was concluded that colloidal particles such as SiO2 has
no influence on calcium carbonate formation.
Frota et al [26] stated that low concentration of metallic ions may affect nucleation
and the crystal growth of calcium carbonate. Graham et al [8], investigated the
impact of ferrous ions on the performance of scale inhibitors under calcium
carbonate scaling using dynamic tube blocking rig. From its result, the presence
of ferrous ion in the solution affect the performance of scale inhibitor by
increasing the minimum inhibitor concentration (MIC). Which was more obvious
in barium sulphate scale. The reason given as a result of this observation was
that addition of small amount of dissolved ferrous ion changes the composition
of the brine and the morphology of the scale crystals, invariably affecting the
performance of scale inhibitors.

46
Chen et al [115] studied the influence of Mg2+ on the kinetics and crystals of
polymorphs of calcium carbonate scale formation on metal surface. The study
show that, the presence of Mg2+ have a greater effect on precipitation of calcium
carbonate. They also observed that Mg2+ was incorporated into the deposit
crystals and the ratio of Mg2+ in the deposits formed was proportional to the ratio
Mg/Ca in the scale solution. In the study, the presence of Mg2+ enhance the
transformation of Vaterite to calcite which adsorbs onto the surface of vaterite
and calcite. This resulted to increase in the surface roughness. They attributed
the changes in the morphology of CaCO3 observed as a result of the poisoning
of the growth sites of the crystals by Mg2+ which inhibit the growth rate of the
deposit formed on the surface of the metal.
According to Nancollas et al [116], the presence of low amount of Mg2+ inhibit
calcite growth with the formation of magnesium calcite. Increasing the
concentration of Mg2+ leads to a rapid precipitation of aragonite, which affect the
efficiency of scale inhibitors. Figure 2-21 shows the effect of Mg2+ in bulk solution
on induction time of calcium carbonate scale.
Figure 2-21: Effect of Mg2+ on the induction time of precipitates formed in the bulk solution[115]

47
2.7.8 Effect of surface roughness
The nature of deposited surface influence the formation of inorganic scales [19,
115, 117]. Most natural surfaces have each unit area of the substrate with finite
number of nucleation sites. Nucleation depends on the number of active free
sites, surface properties of material, such as corrosiveness, ionic charges and
absorptivity, affect the formation of scales. However, if these surfaces have a
low roughness area, the minimal number of contact point may likely reduce the
possibility of adhesion by reducing the bodies contacts [118].
Eroini et al [119] studied the effect of modified substrate surface on inorganic scale
prevention, using different substrates. The study showed that, isotropic
superfinished surface, which is the only hydrophilic substrate in all the surfaces
tested has the highest ability to inhibit calcium carbonate scale formation. This
was attributed to its ability to generate a non-directional roughness profile,
making the topography of the surface uniform.
Gunn [120] examined the effect of surface roughness on the nucleation and growth
of calcium sulphate formation using heated stainless steel material. The study
observed that, increasing the surface roughness of steel, increase the rate of
nucleation of calcium sulphate scale.
2.7.9 Summary of scale formation literatures review
The formation of calcium carbonate scale in oil and gas and desalination
industries has been studied extensively by various authors, using different
techniques. These studies have investigates different environmental factors
affecting the formation of calcium carbonate scale, such as temperature,
pressure, pH, solution supersaturation, flow velocity, solution chemistry,
presence of impurities and surface roughness. The influence of these factors on
scale kinetics and induction time are not fully understood.
They have been challenges of reconciling the effects of these factors on bulk
precipitation to surface deposition processes as majority of these studies focuses
on effect of these factors on bulk precipitation processes. It has also been
investigated that the kinetics of bulk precipitation process is different from that of
surface deposition process [61, 119].

48
There are other challenges arising from the techniques being used in these
studies as they do not reflect the field scenarios in terms experimental conditions
and pipe geometry.
The effect of main driving force on scale formation, such as temperature, flow
velocity and solution supersaturation on both bulk precipitation and surface
deposition has not be study extensively.
2.8 Scale deposition kinetics studies and predictive models
Generally, the deposition of both organic and inorganic scales causes a lot of
flow assurance problems in crude oil production. This section of this work focuses
on the previous studies of scale deposition and predictive models from various
authors.
2.8.1 Inorganic scale surface deposition kinetics studies and their
predictive models
Scale prevention is important in oil and gas and desalination industries to ensure
optimum production. Several models have been developed over the past years;
these models concentrate mainly on the bulk scaling, little attempt has been
made in reconciling the bulk precipitation data with surface deposition data.
The effect of hydrodynamic parameters such as shear stress, Reynolds number,
flow velocity etc. on inorganic scales surface deposition kinetics has not be
incorporated in the previous models. Here are the summary of some previous
models.
Shipley et al [121] developed a semi empirical model to determine the effect of
hydrate inhibitors on oilfield scale formation and inhibition from experimental
solubility measurements of barite, calcite, halite and gypsum. The study,
recommended the procedures to determine the effect of hydrate inhibition on
mineral scale solubility at different experimental conditions such as temperature,
ionic strength etc. Firstly determine the thermodynamic constant from equation
2-41.

49
𝑝𝐾𝐵𝑎𝑆𝑂4= −136035 +
768041
𝑇(𝐾)+ 48595
× log10(𝑇(𝐾)) − (0.394 − 1.11910−4𝑇(℃) ×𝑃(𝑎𝑡𝑚)
500
2-41
The amount of barite (pptBarite) in mol/kg that will precipitate from a solution of
unknown composition in hydrate inhibitor/water/ salt solution was determined
from equation 2-42
𝑝𝑝𝑡𝐵𝑎𝑟𝑖𝑡𝑒 = [𝐵𝑎2+]0 + [𝑆𝑂4
2−]0 − 𝑥
2 2-42
𝑥 = √([𝐵𝑎2+]0 + [𝑆𝑂42−]0)2
− 4([𝐵𝑎2+]0 [𝑆𝑂42−]0 −
𝐾𝐵𝑎𝑟𝑖𝑡𝑒𝑠𝑝
𝛾𝐵𝑎2+.𝛾𝑆𝑂42− .𝛾𝐵𝑎𝑆𝑂4
) 2-43
Where x denotes the mole fraction, 𝛾𝐵𝑎2+ , 𝛾𝑆𝑂42− , are the activity coefficients.
Hasson and Cornel [105] studied the kinetics of CaCO3 precipitation in a
continuous stirred tank vessel in the presence of sodium hexametaphosphate
(SHMP) as shown in Figure 2-22. The study showed that the rate of SHMP
adsorption on the precipitation of calcium carbonate crystals was inversely
proportional to the square root of residence time. The following adsorption and
residual supersaturation model was developed, as shown in equation 2-44 and
2-45 respectively.
𝑟𝐶𝐴𝐿𝐺 =
𝑃𝑜 − 𝑃
𝜏= 𝐴𝑝𝑛 . √
9𝐷𝐸𝐹𝐹
𝜋𝑅2 . 𝜏 = 𝑐𝑜𝑛𝑠𝑡 .
𝑃𝑛
𝜏0.5 2-44
Where 𝐷𝐸𝐹𝐹 denote the effective diffusivity (m2/min), 𝑟𝐶𝐴𝐿𝐺 SHMP adsorption
rate (L/mol min), Po and P initial and final concentration of SHMP (mol/l) 𝜏 is the
residence time (min)
Residual supersaturation is given by equation 2-45,
[𝐶𝑎2+]. [𝐶𝑂32−] = 1.66 𝑥 104 (𝑃0.67. √𝜏)0.65 (𝑝𝑝𝑚 𝑎𝑠 𝐶𝑎𝐶𝑂3 )2 2-45

50
Figure 2-22: Schematic diagram of the continuous flow precipitation vessel [105]
Dyer et al [98], studied the effect of temperature and pressure on oilfield scale
formation. The prediction model showed that an increase in temperature,
increased the scaling tendency for carbonate scaling brine. However, an increase
in temperature decreased the scaling tendency of sulphate scaling brine. It was
concluded that pressure had little effect on both carbonate and sulphate scaling
brines.
Alireza et al [122], developed a predictive model to evaluate CaCO3 scale
formation as a function of temperature, ionic strength, pH, calcium ion
concentration, bicarbonate ion concentration and CO2 mole fraction in a condition
of CO2 saturated water. The model work by determining the ionic strength from
a correlation factors, followed by other experimental conditions based on
equations 2-46 to 2-50.
𝐼𝑛(𝐾) = 𝑎 + 𝑏𝐼 + 𝑐𝐼2 + 𝑑𝐼3 2-46
Where 𝑎 = 𝐴1 + 𝐵1
𝑇+
𝐶1
𝑇2+
𝐷1
𝑇3 2-47
𝑏 = 𝐴2 + 𝐵2
𝑇+
𝐶2
𝑇2+
𝐷2
𝑇3
2-48

51
𝑐 = 𝐴3 + 𝐵3
𝑇+
𝐶3
𝑇2+
𝐷3
𝑇3
2-49
𝑑 = 𝐴4 + 𝐵4
𝑇+
𝐶4
𝑇2+
𝐷4
𝑇3
2-50
Where A1 to D4 denotes tuned coefficient factors as a function of temperature
and I is the ionic strength.
The RI factor is determined from the solubility factor and mole fraction of CO2,
𝑅𝐼 = 𝐶𝐻𝐶𝑂3− ×0.82
𝑥𝐶𝑂2 × 𝑆𝑓
2-51
𝑝𝐻 = (0.4341)𝐼𝑛(𝑅𝐼) + 6.2964 2-52
Abbe and Ajienka [123], predicted the scaling tendency of calcium carbonate from
an oilfield brine, using a software program Scale-check. Their prediction was
based on Stiff-Davis predictive model, which is established on the principle of
saturation and pH of unsaturated water and the pH when saturated with calcium
carbonate. The programme was able to predict scaling tendency of calcium
carbonate to some extent, which could help in developing a preventive measure
for calcium carbonate scaling under the environmental conditions investigated.
Langelier [124] compared the actual pH with the pHs when saturated with CaCO3
as stated in equation 2-53.
𝐿𝑆𝐼 = 𝑝𝐻 − 𝑝𝐻𝑠 2-53
Where LSI is the Langelier’s saturation index. The model is applied to non-oilfield
brine. If the LSI is positive, the water has scale forming tendency and is likely to
be relatively non-corrosive, but if LSI is negative, the water has no scaling
tendency and likely to be corrosive. However, this model only considered the
thermodynamic driving force of scale formation, whereas the amount of calcium
carbonate scale that will precipitate at equilibrium was not considered.
Stiff and Davis [125, 126], developed a scale predictive model to improve on the
limitation of Langelier saturation index as a function of the total dissolved solids
(TDS). The model considered the pH of unsaturated and saturated water

52
containing calcium carbonate scale. This index is applied to oilfield brines, where
the total dissolved solid (TDS) is greater than 5000 ppm, and the pH, is calculated
from equation 2-54
𝑝𝐻𝑠 = 𝑃𝐶𝑎+ + 𝑃𝐴𝐼𝑘 + 𝐾 2-54
Where K takes into account the influence of the higher overall concentration of
ions in the water, PAIK = bicarbonate [M] alkalinity (mg/l).
𝑆𝐷𝐼 = 𝑝𝐻 − 𝑃𝐶𝑎 − 𝑃𝐴𝐼𝑘 − 𝐾 2-55
Where 𝑃𝐶𝑎 = − log[𝐶𝑎2+] 2-56
K denotes a constant, whose value depends on the temperature and salt
concentration. SDI denotes Stiff-Davis index, pH of water sample Pca is the,
negative logarithm of calcium ion concentration. PAIK, the negative logarithm of
total alkalinity.
If the SDI is positive, it indicates that the water has a scaling tendency and is
likely to be relatively non-corrosive. If the SDI is negative, indicates that the water
has no scaling tendency and is likely to be corrosive. The limitation to this model
is that beyond a temperature of 90oC, the value of constant K cannot be
determined as the total dissolve solid limit is exceeded.
Vetter [127], studied the effect of different environmental factors such as
temperature, pressure and brine composition on the precipitation of BaSO4
formation. In the study, the time delay between initial precipitation and actual
precipitation of BaSO4 is inversely proportional to the magnitude of
supersaturation. The deposition of barium sulphate is a function of pressure drop.
This was concluded that the hydrodynamics, long residence time and the
inclusion of hydrodynamic factors in a predictive model enhanced the prediction
of BaSO4 formation in oilfield.
Carageorgos et al [128] developed a laboratory technique for the determination of
model coefficient from pressure measurements for sulfate scaling in the reservoir
cores, as shown in Figure 2-23 . The model coefficients are the reaction rate
constant and the formation-damage parameter showing the rock porosity due to
the deposit of barium sulfate. This coefficients depends on temperature, brine
concentration and the pore space structure of the rock.

53
Figure 2-23. Experimental setup for commingled injection of incompatible waters [128]
From their study they proposed equation 2-57 and 2-58 to determine the [Ba2+]
and [SO42-] concentration profiles.
𝐶𝐵𝑎 =(1 − 𝛼)
𝑒 −𝜀𝑘(1−𝛼)𝑥𝐷− 𝛼 2-57
𝐶𝑆𝑂4 = (1 − 𝛼)
1 − 𝛼𝑒 −𝜀𝑘(1−𝛼)𝑥𝐷 2-58
Where εk and α are the chemical kinetics and formation damage coefficients
respectively.
Patrick et al [129], developed a prediction model for scaling conditions over life
cycle of a gas well. The model results were able to determine the zones along a
long wellbores which is more likely to have a scaling problems and the time
duration for the scaling problem to occur, the model indicates an increase in
supersaturation with reference to scaling ions as the fluids are produced.
Wright et al [130] predicted the scaling tendency of both sulfate and carbonate
scaling of Glemis field. The model observed that the rate factors controlling the
kinetics of calcium carbonated scale formation was determined and a preventive
method was designed to prevent both sulfate and carbonate scaling in the field.
Mazzollni et al [131] used a computer model to predict the scaling tendency of
BaSO4. The model calculate the level of saturation of the aqueous phase for
scaling minerals and the degree of precipitation to attain thermodynamic
equilibrium.

54
Zhang et al [1] developed a kinetics and thermodynamic model using dynamic
tube blocking rig for calcium carbonate scale prediction. The effect of
temperature, pressure and flow velocity on calcium carbonate scale formation
was determined. In the model, calcium carbonate deposition thickness rate was
determine as a function of time. The effect of flow was significant in the estimated
thickness rate at different experimental conditions. One of the limitation of this
model, is that a long capillary tube were deployed as the scaling surface and
effect of the uniformity of the scale layer was not considered.
Stamatakis et al [58] determined the induction time of calcium carbonate
precipitation in porous rocks under flow conditions between temperature of 25oC
to 100oC, using a radiotracer technique. The empirical model developed from the
study, was based on classical nucleation theory which predicted the induction
time of calcium carbonate scale under flow conditions as shown in equation 2-59.
𝑙𝑜𝑔𝑡𝑖𝑛𝑑(min) = 3.2 −3.0
𝑆𝐼−
959.8
𝑇+
1849.9
𝑆𝐼 × 𝑇 2-59
Where tind denotes the induction time in (min), SI saturation index, T absolute
temperature (K). From their study, it was reported that the equation can predict
the induction time of calcium carbonate scale formation under a specific flow
condition in the near well region and the induction time is proportional to the
inverse of the saturation index and temperature.
Setta et al [108], studied the surface kinetics of calcium carbonate formation on
austenitic stainless steel surface, using an in-situ flow rig and rotating cylinder
electrode and developed an empirical model for calcium carbonate, within a wide
range of supersaturation index. The model enables the prediction of the calcium
carbonate thickness growth over a period of time. Figure 2-24 shows calcium
carbonate scale deposition as a function of saturation index at 24oC and 70oC.

55
Figure 2-24: Calcium carbonate scale deposition in cm/year as a function of saturation index (SI) at 24oC and 70oC [108]
2.8.2 Asphaltene and wax deposition kinetics studies and their predictive
models
The deposition of asphaltene and wax cause a lot of problem in crude oil
production, extensive studies have been carried out in the past on wax and
asphaltene deposition and different predictive models have been developed.
This models tends to prevent the deposition of asphaltene and wax in oilfield to
some extent compared to that of inorganic scales such as CaCO3. Here are some
of the studies.
Kamran et al [132], used high-pressure deposition cell to measure the deposition
of asphaltene from crude oil under real field conditions. The model developed
from the study can predict the deposition of asphaltene in an oilfield under
realistic field condition of temperature, pressure and shear stress.
Wang et al [133, 134] developed asphaltene deposition tool (ADEPT) that can
predict the formation of asphaltene and determine the amount and profile of

56
asphaltene deposition in the oilfield. The tool is based on thermodynamic and
deposition properties of asphaltene. The model was validated with data obtained
from capillary deposition experiment data at different operating conditions for the
same oil-precipitant mixture. The prediction of asphaltene deposition using the
model was in agreement with results obtained experimentally from the study.
Lawal et al [22], studied the deposition of asphaltene in a glass capillary flow
experimental set up. They monitored the deposition of asphaltene by capturing
the image of the asphaltene deposition along the capillary tube and measuring
the pressure drop across the capillary. They developed a predictive model that
could determine the deposition thickness as a function of pressure drop along
the capillary tube. The model was based on Hagen-poiseuille equation, as shown
in following equation 2-60 to 2-63.
(∆𝑃𝑡)𝑟4
𝜇𝑡 =
(∆𝑃𝑖)𝑟𝑖4
𝜇𝑖 2-60
Where ∆𝑃𝑖 and ∆𝑃𝑡 denotes the initial pressure drop before deposition and at
time t, the pressure drop along the capillary (Psi). 𝜇𝑖 and 𝜇𝑡 are the initial
viscosity of the brine and average viscosity at time t respectively in (Ns/m2), 𝑟𝑖
and r are the original capillary tube radius and effective radius after deposition
respectively in (m).
Simplifying equation 2-60 by neglecting the effect of viscosity since 𝜇𝑖 ≈ 𝜇𝑡
Equation 2-60 becomes
𝑟𝑡 = 𝑟𝑖 ((∆𝑃𝑖)
(∆𝑃𝑡))
1/4
2-61
The hydrodynamic thickness (𝑒𝑡) is given by the equation 2-62,
𝑟𝑡 = 𝑟𝑖 − 𝑒𝑡 2-62
From equation 2-62 and 2-63
𝑒𝑡 = 𝑟𝑖 (1 − (∆𝑃𝑖
∆𝑃𝑇)
1/4
) 2-63

57
Equation 2-63 is valid when 𝑒𝑡 ≪ 𝑟𝑖
Hsu and Brubaker [135], developed model to predict wax deposition from waxy
crude production lines. The model can predict the deposition of wax along a cold
flowlines and the potential wax problem. The model considered both the
molecular diffusion and shear stress effect on wax deposition.
From the model, the wax deposition rate on pipe wall due to molecular diffusion
is given by equation 2-64
𝑑𝑊
𝑑𝑡= 𝜌𝑤 𝐴𝐷𝑚
𝑑𝐶
𝑑𝑟 = 𝜌𝑤𝐴 (
𝑘𝑚
𝜇 )
𝑑𝐶
𝑑𝑇
𝑑𝑇
𝑑𝑟
2-64
Where W denotes the total wax mass deposited on pipe wall, t denotes the time,
𝑘𝑚 is constant, 𝜌𝑤 denotes density of the deposited wax, 𝜇 is fluid viscosity, 𝐷𝑚
is the molecular diffusion coefficient of the precipitated wax, A is the pipe wall
area available for wax deposition, 𝐴 = 𝜋𝐷𝐿, 𝑑𝐶
𝑑𝑟 is the radial concentration
gradient of the precipitated wax, 𝑑𝐶
𝑑𝑇 is the concentration gradient of the
precipitated wax with respect to temperature. 𝑑𝑇
𝑑𝑟 is the radial temperature
gradient.
Hsu and Santamaria [136] developed a laboratory test method to measure wax
deposition of waxy live crudes under turbulent flow conditions. The equipment
consist of high pressure turbulent flow loop, the system is made of two tube units
(test tube and reference tube). The test tube is designed to monitor the wax
deposition from the oil, while the reference tube is used for measurement of wax
deposition thickness. From their studies, they determined the wax deposition
thickness using the equation 2-65 and 2-66 for both laminar and turbulent flow
respectively.
The internal diameter of test tube (ID) during wax deposition process is given by
equation 2-65
𝐷𝑇(𝑖𝑛𝑐ℎ) = 0.402
(∆𝑃𝑇
∆𝑃𝑅)(
13𝑛+1
)
2-65
For turbulent flow,

58
𝐷𝑇(𝑖𝑛𝑐ℎ) = 0.402
(∆𝑃𝑇
∆𝑃𝑅)(
14+0.75𝑛
)
2-66
Where 0.402 is the internal diameter (ID) of the reference tube, ∆𝑃𝑇 and ∆𝑃𝑅
are the pressure drop across the test tube and reference tube during wax
deposition, n is the material constant.
They also went further to determine the cumulative wax deposition rate (Wr) from
equation 2-67
𝑊𝑟= 381
𝐷𝑜2 −𝐷𝑇
2
𝐷𝑇(𝑡− 𝑡𝑜)
2-67
Where, Do is the bare tube ID (inch) of test tube, DT is the effective tube ID (inch)
of test tube, t is the time during wax deposition and to is the starting time.
Wang and Buckley [21], estimate thickness of deposit layer from displacement
test. Where the amount of asphaltene deposits on the capillary tube is removed
by nitrogen gas at high pressure. From their studies, the thickness of asphaltene
deposits were determined from equation 2-68 and 2-69 for both evenly and non-
evenly distributed deposits along a capillary tube.
For evenly distributed deposit along the tube,
𝑞(𝑡) = (𝑃 − 𝑃𝑐)𝜋𝑟4
8𝜇𝑙(𝑡) 2-68
The weight of deposit layer as a function of time,
𝑊(𝑡) = 𝜋𝑟2𝜌𝐿 {1 − [1 − 𝑃𝑟2
4𝜇𝐿2]
2
} 2-69
where q(t) denotes the volume flow rate at the outlet end at time t, and l(t) denotes
the length of the remaining liquid segment inside the tube at time t, Pr denotes
the prandtl number, L length of the tube, 𝜌 denotes the density of the liquid, the
weight of deposit displaced is measured using a non-destructive technique (N2
and glycerol probe), the value of q(t) and l(t) is calculated from W(t), using the
relationship between liquid density and the effective radius r. The thickness of

59
deposit layer is obtained from the difference between r and the original radius of
the tube ro .
For unevenly distributed deposit layer, deposit thickness at different capillary
locations was calculated from equation 2-70 and 2-71
𝑟𝑛 = [8𝜇𝐶1(∆𝑉𝑛)2
𝜋2𝑃∆𝑡𝑛
]
1/6
2-70
𝑟𝑖 = [
8𝜇𝐶1(∆𝑉𝑖)2
𝜋2∆𝑡𝑖 (𝑃−
8𝜇𝐶1∆𝑉𝑖 𝜋2∆𝑡𝑖
∑∆𝑉𝑗
𝑟𝑗2
𝑛𝑗=𝑖+1 )−1]
1/6
2-71
Where i = 1, 2… n-1, C1 is coefficient, which is 1.45033 𝑥 1017 , P is the capillary
pressure, ∆𝑉𝑖 denotes the volume of liquid, ∆𝑡𝑖 denotes the time.
2.8.3 Summary of scale surface deposition kinetics studies and
predictive models
Organic and inorganic scale precipitation and deposition have been studied and
different predictive models have been developed over many years on scale
precipitation process such as residence time, induction time, nucleation and
crystal growth. These models have been mainly based on thermodynamics
parameters. However, little attention has be made on the effect of hydrodynamic
parameters on inorganic scale surface deposition kinetics. The use of a
methodology that will reflects the field scenario has been a challenge in most
models.
Developing a model that can predict the scale thickness growth rate over a period
of time and as a function of saturation ratio, temperature and flow velocity has
been limited.
The models developed by Kurup et al [133] and Lawal et al [22] to determine the
uniformity of surface layer across the capillary as a function of differential
pressure and to determine the scale thickness growth will be investigated.
Subsequently a detailed empirical model that can predict the thickness growth
rate of both inorganic and organic scales in the field as a function of deposition
flux will be developed.

60
A different technique of estimating the amount of deposit present in the capillary
after the deposition test will be established. The results obtained will be
compared with the asphaltene models.
2.9 Scale formation in a pipe flow system and fluid mechanics principles
The main cause of scaling in any system is the change in the environmental
conditions such as temperature and pressure, which affect the degree of
saturation of the system. Considering the scenario of CaCO3 scale formation
from a supersaturated solution under turbulent flow regime in pipe system, in this
system, the gaseous phase is not in contact [80].
According to Hasson et al [105] at high supersaturation ratio, there is depletion in
the bulk solution due to scale formation and the mean supersaturation ratio in
the bulk is uniform along the pipe. And also there is a possibility of CaCO3
precipitation occurring in the bulk and at the surface of the pipe wall.
The formation of scale is favoured by pipe wall surface, depending on the
wettability and surface energy. Hasson proposes two rate determine steps in the
pipe flow system, firstly, diffusion of all ionic species towards the scale- water
interface and surface reaction of the ionic species [137] and CaCO3 crystals as
shown in Figure 2-25.

61
Figure 2-25:Scale formation process in a pipe flow system [80]
To effectively study the kinetics of scale deposition in a pipe flow system, there
must be detail understanding of the principle of fluid mechanics in a pipe flow
system. The nature of flow in fluid mechanics is generally grouped into two flow
regimes, which are laminar and turbulent flow regime, but there is a region
between this two flow boundaries called transitional flow. In this study, there will
be more emphasis on the laminar flow regime as it affects the capillary flow rig.
2.9.1 Pressure loss in laminar flow
The pressure loss in laminar flow is given by equations 2-72 to 2-75 .
Driving force due to pressure = Pressure drop x Area

62
Figure 2-26: Pressure loss in laminar flow [138]
𝐹 = ∆𝑃𝜋𝑑2
4 2-72
Retarding force due to stress by the wall = 𝜏𝑤𝜋𝑑𝑙 2-73
At equilibrium, driving force = retarding force,
∆𝑃𝜋𝑑2
4= 𝜏𝑤𝜋𝑑𝑙 2-74
∆𝑃 = 𝜏𝑤4𝑙
𝑑 2-75
At equilibrium, the shearing forces on a cylinder = pressure force as shown in
Figure 2-27.
Figure 2-27: Shearing forces on a cylinder [138]
2𝜏𝜋𝑟𝑙 = ∆𝑃𝜋𝑟2 2-76
𝜏 = ∆𝑃𝑟
2𝑙 2-77

63
Where 𝜏𝑤 denotes the wall shear stress, 𝑙 denotes the length of the pipe, 𝑑
denotes the diameter of the pipe, 𝑟 denotes the radius of the pipe, ∆𝑃 denotes
the pressure loss.
2.9.2 Hagen-Poiseuille’s law
The flow along a pipe is driven by a pressure difference, the viscosity acts to
retard the passage of the fluid along the pipe through the no-slip condition at the
wall. The flow rate is given by equation 2-78.
𝑄 = 𝜋𝐷4∆𝑃
128𝜇𝑙 2-78
From equation 2-78 above, the flow rate,
Increases when D is increased
Increases when ∆𝑃 is increased
Decreases when 𝜇 is increased
Decreased when 𝑙 is increased
However, the limitations of Hagen-poiseuille flow equation with respect to
capillary flow rig in determining the amount of deposit on the surface of substrate
are highlighted in chapter 3 of this work.
2.9.3 Dynamic tube blocking rig
The dynamic tube blocking rig (DTB) is one of the most efficient techniques to
study inorganic scale deposition kinetics as it operates at field condition of
temperature and pressure.
Various studies [10, 139-141], used the dynamic tube blocking rig for scale inhibitors
efficiency ranking under different environmental conditions by examining the
scale inhibitors ability to prevent scale adherence and growth within a tubing coil.
The dynamic tube blocking rig (DTB) examines the growth of CaCO3 and
blockage of micro bore metal cell by measuring the differential pressure as a
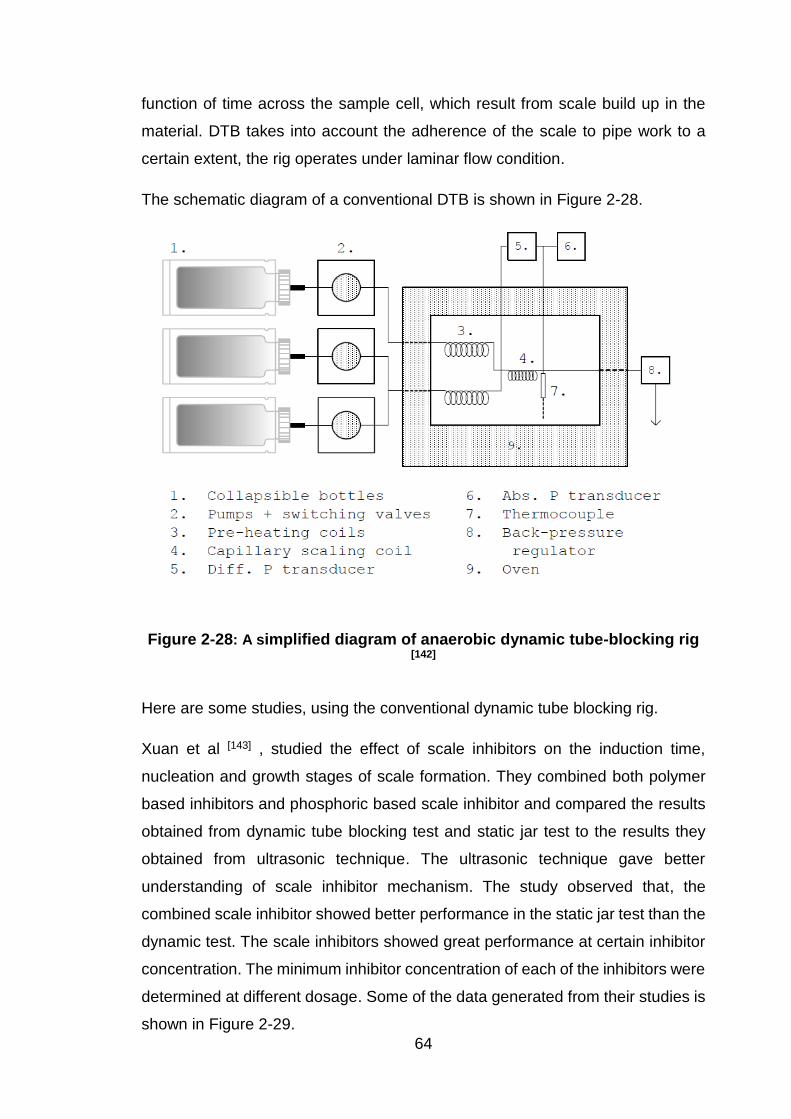
64
function of time across the sample cell, which result from scale build up in the
material. DTB takes into account the adherence of the scale to pipe work to a
certain extent, the rig operates under laminar flow condition.
The schematic diagram of a conventional DTB is shown in Figure 2-28.
Figure 2-28: A simplified diagram of anaerobic dynamic tube-blocking rig [142]
Here are some studies, using the conventional dynamic tube blocking rig.
Xuan et al [143] , studied the effect of scale inhibitors on the induction time,
nucleation and growth stages of scale formation. They combined both polymer
based inhibitors and phosphoric based scale inhibitor and compared the results
obtained from dynamic tube blocking test and static jar test to the results they
obtained from ultrasonic technique. The ultrasonic technique gave better
understanding of scale inhibitor mechanism. The study observed that, the
combined scale inhibitor showed better performance in the static jar test than the
dynamic test. The scale inhibitors showed great performance at certain inhibitor
concentration. The minimum inhibitor concentration of each of the inhibitors were
determined at different dosage. Some of the data generated from their studies is
shown in Figure 2-29.

65
Figure 2-29 : Dynamic loop test with FW:SW 50:50 at 70oC [143]
Graham et a l[144], studied the impact of ferrous ions on scale inhibitors
performance using the dynamic tube blocking. They reported that, the presences
of ferrous ions affect the minimum inhibitor concentration of scale inhibitors when
tested with CaCO3 scale, which have more impact when tested with BaSO4 scale.
Graham and McMahon [145], studied the effect of scale inhibitor performance
against bulk and surface scale nucleation and growth by the addition of film
forming corrosion inhibitors. They reported that the presence of film forming
corrosion inhibitors has the ability to reduce scale adhesion and tube blockage,
but has no impact on degree of scale precipitation in the bulk.
Dong et al [112], investigated the performance of scale inhibitor in water containing
high levels of dissolved iron by comparing the results obtained from the DTB and
static jar test. It was reported that modified phosphate inhibitors (RSI-1 and RSI-
2) show great performance compared to the conventional scale inhibitors (PPCA,
DTPMP) at different inhibitor dosage as shown in Figure 2-30.

66
Figure 2-30: The performance of selected inhibitors in dynamic tube blocking tests in the presence of 100ppm Fe2+ [112]
Graham and Williams [140], design a HT/HP stirred reactor test rig to conduct
calcium carbonate scale deposition kinetics, in order to overcome the limitation
of the DTB. From their design, the HT/HP stirred reactor rig can be used to study
calcium carbonate scale kinetics at high temperature and pressure over long
residence time, similar to the field conditions. Some of the data obtained from
their study is shown in Figure 2-31.
Figure 2-31: The effect of bicarbonate concentration on blank scaling time [140]

67
Bazin et al [10], compared the effectiveness of using DTB for minimum inhibitor
concentration determination at different flow rates and capillary geometry. It was
reported that, DTB technique is influenced by change in flow rates and capillary
geometry. The data obtained from their study at different inhibitor concentration
and flow rates is shown in Figure 2-32.
Figure 2-32: DETPMP performance on BaSO4, inhibitor injected step by step (L=7.5m;ID=0.5mm;Q=30cm3/h;T=90oC) [10]
However, none of this studies design a sample cell capillary tube, which shows
a replicate of pipe flow lines experience in the oilfield, instead they used a micro-
bore tubing coil for their studies. Using the conversional dynamic tube blocking
rig to study the deposition of scales and to develop an empirical model that can
predict scale formation maybe challenging. This is because the technique is
mainly designed for ranking and showing the effectiveness of scale inhibitors.
The technique also used a long capillary tube between 1-2m, which make it
difficult to determine the amount of deposit present in the capillary tube. This
difficulty is due to unevenly distribution of the deposited scales and saturation
ratio changes with time along the capillary.
Therefore it is worthwhile to design a technique with short capillary, which is more
reliable in determining the actual deposit present in the capillary and the
saturation ratio of the flowing brine. With the short capillary, it can be assumed
that the saturation ratio is constant due to the short resident time.

68
The sample cell capillary made of stainless steel, is used to study calcium
carbonate scale surface deposition kinetics under dynamic flow conditions. This
will reflect the field operational conditions.
Chapter 3 of this report will give details of this rig design and various experimental
parameters that can be determined from this rig.

69
CHAPTER 3. Capillary rig development and commissioning
3.1 Introduction
This chapter provides the detailed design of already commissioned capillary rig
for the surface deposition tests. The capillary flow rig was modified to
accommodate changes needed for this study and also for optimum performance
of the scaling time determination. The design changes made for the capillary flow
rig are:
Change of scaling surface from capillary coil of 1-2m to a capillary cell of
10mm length.
Change of pipe geometry from 3mm to 1mm (mixing capillary), to have a
fully developed flow from the mixing point to the capillary cell.
High resolution pressure transducer installed on the capillary flow rig for
differential pressure measurement. This enable a low pressure drop
variation to be detected by the pressure transducer.
Design of bulk and surface analysis sections of the capillary flow rig.
Design of the surface analysis test coupon.
The capillary flow rig descriptions is split into three sections with respect to the
experimental test conducted. These are:
The capillary flow rig description for surface deposition test.
Capillary flow rig description of bulk precipitation test (turbidity
measurement and inductively coupled plasma test)
Capillary flow description for scanning electron microscope (SEM) and X-
ray diffraction (XRD) test.

70
3.2 Capillary flow rig description for surface deposition test
Dynamic tube-blocking rigs are widely used for the study of scaling phenomena
and in particular for the ranking of scale inhibitors [98, 143, 146, 147]. A typical
experiment involves measurements of the differential pressure across a small
diameter bore tubing of approximately 1-2m length [10, 98, 142, 148]. If the experiment
is properly designed, the time for the pressure across the cell to increase gives a
measure of the scaling time, which is the time for the differential pressure to
deviate from 0Psi, such technique is often used to assess the efficiency of scale
inhibitors before being deployed in the production lines.
The drawback of this techniques is that the saturation ratio will drop across the
capillary cell and it is therefore difficult to use the methodology to develop a robust
kinetic models where the experimental conditions need to remain constant.
In this work, a capillary flow rig is developed to resolve this issues and study
CaCO3 surface deposition kinetics. Figure 3-1 show the modified rig, which
enables the examination of the growth and blockage of the micro bore metal cell
(a very short cell where the conditions can be considered constant across the
capillary cell) by measuring the differential pressure as a function of time across
the capillary sample cell.
These results from scale build up in the capillary cell and from the differential
pressure (ΔP) versus time gives an understanding of the growth kinetics. The
brine solutions are pumped with two reciprocating pumps (Gilson pumps type,
100SC) which drive the cation and anion brine solutions into two separate coils
made of stainless steel, immersed in a heated water bath. This raises the solution
temperature to the desired test temperature before arriving at the mixing section.

71
Figure 3-1: Schematic diagram of the capillary tube blocking rig
The test cell can be located any distance from the mixing section as shown in
Figure 3-2, this distance can be changed to alter the time the mixed solution to
reach the working section, such that the brine solution precipitation can be
controlled to either have precipitated crystals or not in the bulk solution as it flow
through the working capillary section.
Figure 3-2: Schematic diagram of capillary rig showing the mixing part and capillary cell

72
The combined solution which has a saturation ratio value greater than 1 passes
through a capillary test cell, made of stainless steel (316L) of internal diameter
1mm, length 10mm and scale crystal nucleate and grows on the surface of the
capillary cell. The saturation ratio can be assumed constant along its length due
to it short residence time (0.1sec, 0.05sec and 0.03sec for 5ml/min, 10ml/min and
15ml/min respectively).The formation of scale is monitored by measuring the
differential pressure across the capillary cell. The differential pressure transducer
(PX80D0-30-5T from Omega, 0-30Psi).
The pressure is maintained by a pressure gauge regulator leading to the effluent.
When the stainless steel capillary cell blocks, the automatic pumps shut-down
and the differential pressure and solution temperature as a function of time are
logged by the computer which contain a LabVIEW data acquisition system.
The pressure increase is measured continuously throughout the experiment. At
the end of each test, the rig is cleaned with a cleaning solution of (50% Sodium
hydroxide NaOH g/L and 50% Ethylene-diamine-acetic acid EDTA g/L) at a pH
of 10 for 30 minutes followed by distilled water for two hours.
3.3 Capillary flow rig description for bulk analysis test
The turbidity measurements and the inductively coupled plasma (ICP) test was
carried out by creating a two way control valve on the capillary pipe before the
capillary cell as shown in Figure 3-3. As such the amount of mixed brine collected
can be controlled by setting the volumetric flow rate from the pump.
The flow rate was set for 10ml/min for the turbidity test. At every minutes, 10ml
of brine solution were taken for the first five minutes, this was later increased to
every 10minutes. For the ICP test, 1ml of the brine was measure and added to
9ml of quenching solution, using micropipette. The details of the turbidity
measurements and inductively coupled plasma test is shown in chapter 4 of this
work.

73
Figure 3-3: Capillary rig showing the bulk analysis section
3.4 Capillary flow rig description for scanning electron microscope and
X-ray diffraction test
The capillary flow rig was fitted with capillary tube compartment after the capillary
cell. A flat stainless steel coupon was inserted into a stainless steel extension
tube fitted on the capillary flow rig, where deposition took place for scanning
electron microscopy (SEM) and X-ray diffraction (XRD) observation. At the end
of each deposition test, the stainless steel coupon
3.4.1 Capillary tube and stainless steel extension tube design
Figure 3-4 and Figure 3-5 show the schematic diagram of the capillary cell and
the stainless steel extension tube for surface analysis test. From the capillary rig
design, it is difficult to carry out in-situ surface analysis of the calcium carbonate
scale deposited on the capillary cell during the test. However, for this study, a
non-destructive technique is used to carry out the surface analysis test without
any damage to the surface scale and the substrate.

74
Figure 3-4: Schematic diagram of the capillary cell
The stainless steel coupon (316L) is 4.4mm in width and length 25mm, the
extension tube is of length 35mm and internal diameter of 4.6mm. This is done
before the deposition test is carried out, the flat coupon is cleaned with acetone
solvent to dissolve any interfering chemical substance or material on the surface
followed by distilled water and dried before inserting into the extension tube. At
the end of the test, the scaled coupon is dried and taken for surface analysis test.
Figure 3-5: Schematic diagram of the stainless steel extension tube and flat coupon for surface analysis

75
However, it is difficult to know which scale deposition mechanism is occurring
when scale build up in the capillary cell under flow conditions, the following three
scale deposition mechanism is being suggested:
Crystallization process,
Adhesion process,
Mixed regime.
The experimental methodology for this work will provide answers to these key
questions.
3.5 Capillary rig design and modification
In the design and modification of the capillary rig, various pipe flow parameters
were considered.
1. The entrance effect
2. The residence time (mixing section and the capillary cell)
3. Reynolds number
3.5.1 Entrance effect
Hagen Poiseuille flow equation shows that increasing the flow velocity should
increase the differential pressure as shown in equation 3-1.One of the factor to
be considered to make this assumption possible is to determine the entrance
length.
𝑄 = 𝜋𝐷4∆𝑃
128𝜇𝑙 3-1
To ensure the flow is fully developed, the capillary length after mixing must be
greater than the entrance length, and the internal diameter of the capillary before
the capillary cell must be the same. This was calculated using the relationship
between the Reynolds number (Re), internal diameter (D) and the entrance length

76
(Le) as shown in equation 3-2 [149] for laminar flow regime. Figure 3-6 shows a
schematic diagram of developing flow and fully developed flow.
𝐿𝑒
𝐷= 0.06𝑅𝑒 3-2
Figure 3-6: Pipe flow system showing a region of developing flow and fully developed flow [149].
The entrance length Le calculated from different flow rates at fluid viscosity of
8.94 × 10⁻⁴ mPa.s and 4.06 × 10⁻⁴mPa.s [150] for 25oC and 70oC respectively
is shown in Table 3-1
Table 3-1: Entrance length of the capillary mixing section
Flow rate (ml/min)
Entrance length Le (mm)
25oC 70oC
5 7.11 15.66
10 14.23 31.32
15 21.34 46.98
20 28.46 62.64
25 35.57 78.29
30 42.69 93.96
However, for sake of clarity and consistency of the interpretation of differential
pressure (ΔP) data obtained from the capillary rig, all values were normalised to

77
0 Psi as the starting differential pressure for each experiments. In reality from the
experimental results, ΔP values changes with flow rate.
3.5.2 Residence time (mixing section and the capillary cell)
The residence time for the fluid to travel through the capillary after mixing, before
it gets to the capillary cell. And also the residence time within the capillary cell to
effluent were calculated from equation 3-3. Table 3-2 shows the residence time
of the brine at different flow rates.
𝑅𝑒𝑠𝑖𝑑𝑒𝑛𝑐𝑒 𝑡𝑖𝑚𝑒 𝜏 = 𝑉𝑜𝑙𝑢𝑚𝑒 𝑜𝑓 𝑡ℎ𝑒 𝑠𝑦𝑠𝑡𝑒𝑚 (𝑉)
𝑉𝑜𝑙𝑢𝑚𝑒𝑡𝑟𝑖𝑐 𝑓𝑙𝑜𝑤 𝑟𝑎𝑡𝑒 (𝑄)
3-3
The volume of the system V (mm3) =𝜋𝑟2𝑙, where r denotes the internal radius of
the capillary (mm) and 𝑙 denotes the length of the capillary (mm). Q denotes the
volumetric flow rate (ml/min).
Table 3-2: Capillary residence time at different flow rates
Flow rate (ml/min)
Residence time (s)
Capillary cell
L= 10mm, ID = 1mm
Mixing section
L= 80mm, ID = 1mm
5 0.1 2.18
10 0.05 1.08
15 0.03 0.72
20 0.025 0.54
25 0.019 0.43
30 0.015 0.36

78
3.5.3 Reynolds number
The Reynolds number at different flow rate was calculated from equation 3-4, in
order to determine the flow regime of the fluid entering the mixing section and the
capillary cell. The Reynolds number at different temperatures and flow rates is
shown in Table 3-3
. 𝑅𝑒𝑦𝑛𝑜𝑙𝑑𝑠 𝑛𝑢𝑚𝑏𝑒𝑟 𝑅𝑒 = 𝜌𝑉𝐷
𝜇 3-4
Where 𝜌 denotes the density of fluid (kg/m3), V flow velocity (m/s), D internal
diameter of the capillary (m), µ denotes the viscosity of the fluid (Ns/m2).
Table 3-3: Reynolds number at different flow rates
Flow rate
(ml/min)
Reynolds Number Re
Capillary cell, ID = 1mm
Reynolds Number Re
Mixing section, ID = 1.6mm
25oC 70oC 25oC 70oC
5 117 261 74 163
10 237 522 148 327
15 356 783 222 489
20 474 1044 297 653
25 593 1305 371 816
30 712 1566 445 979
3.6 Hagen Poiseuille (HP) flow prediction
Recalling the Hagen Poiseuille flow equations for laminar flow condition shown
in equation 3-1, assume a uniform flow, the flow rate is a function of the diameter
D, pressure drop ΔP, viscosity of fluid µ and the capillary length L.
𝑄 = 𝜋𝐷4∆𝑃
128𝜇𝑙
3-5
The following are assumptions of Hagen Poiseuille flow equations for laminar
flow regime.

79
The flow is constant through the capillary,
The fluid is incompressible and Newtonian,
The flow is laminar through a pipe of constant cross-section,
No acceleration of fluid in the pipe,
The flow must be fully developed
In a study by Wang et al [20, 21] and Lawal et al [22], they used the pressure drop
across the capillary tube during asphaltene deposition as a measure of thickness
of asphaltene deposited across the capillary cell. The thickness of asphaltene
deposited was determined from equation 3-6 to 3-9. For a constant flow rate,
(∆𝑃𝑇)𝑟4
𝜇𝑇
= (∆𝑃𝑖)𝑅4
𝜇𝑖
3-6
Where 𝑄 denotes the flow velocity (m3/s), 𝐷 the internal diameter of the capillary
(m), ∆𝑃 the pressure drop along the capillary (Psi), 𝜇 the viscosity (NS/m2), 𝑙 the
length of the capillary (m), ∆𝑃𝑖 and ∆𝑃𝑇 are initial pressure drop before
deposition and at time T, the pressure drop along the capillary. 𝜇𝑖 and 𝜇𝑇 are the
original viscosity of the brine and average viscosity at time T respectively, R and
r are the original capillary tube radius and effective radius after deposition
respectively. The schematic diagram of the scaling process is illustrated in Figure
3-7

80
Figure 3-7:(a) Scale deposited uniformly on a capillary tube (b) and (c) Cross section of capillary tube before and after deposition
Simplifying equation 3-6 by neglecting the effect of viscosity change since 𝜇𝑖 ≈
𝜇𝑇 [22]
Therefore equation 3-6 becomes.
𝑟 = 𝑅 ((∆𝑃𝑖)
(∆𝑃𝑇))
1/4
3-7
The scale deposition thickness (𝑡) is given by the equation 3-9,
𝑡 = 𝑅 − 𝑟 3-8
From equation 3-7 and 3-8
𝑡 = 𝑅 (1 − (∆𝑃𝑖
∆𝑃𝑇)
1/4
) 3-9
However, in this study, the pressure was used to determine or monitor where to
stop the test, and at the end of the test, the deposited scale on the surface of the

81
capillary cell were dissolve and measured by Inductively coupled plasma Mass
Spectrometry (ICP-MS). It was also assumed that the initial pressure drop at the
beginning of the experiment is not significant compared to the cut off pressure
(5Psi) as the amount of CaCO3 scale measured before the scaling time (ts) is less
than 5% of the amount of scale at ts, which is the time the differential pressure
deviate from 0 Psi as shown in Figure 3-8. The value of ts varies depending on
the experimental conditions and the sensitivity of the pressure transducers. The
values of ts determined at different tests are shown in Figure 3-9 and Figure 3-10
for SR 5, 5ml/min and SR 11, 10ml/min at 25oC respectively. The repeatability of
the ts values from the two plots is shown with the error bars in Figure 3-11
determined from the average ts values of the repeated tests.
Figure 3-8: Differential pressure as a function of time

82
Figure 3-9: Repeatability test for SR 5, 5ml/min at 25oC
Figure 3-10: Repeatability test for SR 11, 10ml/min at 25oC

83
Figure 3-11: Repeatability test for SR 5,5ml/min and SR 11, 10ml/min at 25oC
It was also assumed that the growth rate is linear and from ts, a rapid pressure
increase indicating fast deposition rate (scale on substrate and scale on scale),
at that point the capillary cell is plugged and the effect of flow rate or pressure is
almost irrelevant with respect to deposition rate.
3.7 Limitations of Hagen Poiseuille flow equation measurement with
reference to capillary tube blocking rig
Hagen Poiseuille flow equation as a measure of scale deposition thickness
growth rate may not give accurate results due to the following limitations.
The scale layer is not uniform, which is more obvious in long
capillaries.
HP assumption estimate high deposition growth rate compared to
ICP-MS measurement as shown in Figure 3-13 to Figure 3-15.
The effect of surface roughness, interfacial energy, wettability is not
considered in HP flow equation.
0
500
1000
1500
2000
2500
3000
3500
4000
4500
SR 5, 5 ml/min SR 11, 10ml/min
Avera
ge scaling tim
e t
s(m
in)
Saturation ratio
84
3.8 Determination of scale deposition growth rate
To determine the amount of calcium carbonate deposited on the capillary cell,
the following method was adopted initially.
To use the HP flow equation to estimate thickness of calcium carbonate
on surface of the capillary cell.
Measurements were taken for a clean capillary cell at different diameter
and the HP values does not link.
It was decided that a better way was to set the differential pressure at 5Psi
then estimate the growth rate.
The growth rate of calcium carbonate build-up on capillary surface were
calculated as the ratio of the amount of calcium carbonate scale deposited
(measured by ICP-MS) to the change in onset pressure increase until it reaches
a pressure of 5Psi.ie. (time it takes for the differential pressure to get to 5Psi and
the scaling time) as shown in Figure 3-12.
The growth rate in mg/min was converted to cm/sec by assuming a uniform
deposition of calcite along the capillary tube as shown in equation 3-10 to 3-12.
Mass of scale deposited m = 𝜌 × 𝑣 3-10
Assuming a density of calcite 𝜌 = 2.711𝑔/𝑐𝑚3
The volume of hollow cylinder V = 𝜋ℎ(𝑅2 − 𝑟2) (cm3) 3-11
Scale deposition thickness 𝑡 = 𝑅 – 𝑟 3-12

85
Where R denotes the radius of the capillary cell before deposition and r radius of
the capillary cell after deposition (cm).
Figure 3-12: Differential pressure as a function of time

86
Figure 3-13: Scale deposition growth rate as a function of saturation ratio at 5ml/min and 25oC
Figure 3-14: Scale deposition growth rate as a function of saturation ratio at 5ml/min and 70oC
0
0.00001
0.00002
0.00003
0.00004
0.00005
0.00006
5 11 20 31 50 80
Scale deposition gro
wth
ra
te (cm
/se
c)
HP
ICP
0
0.00001
0.00002
0.00003
0.00004
0.00005
0.00006
5 11 20 31 50 80
Scale deposition gro
wth
ra
te
(cm
/se
c)
Saturation ratio SR
HP
ICP

87
Figure 3-15: Scale deposition growth rate as a function of saturation ratio at 15ml/min and 70oC
3.9 Summary
Chapter 3, gives the capillary rig design overview and shows the modification and
specification of the capillary rig to achieve the aims and objectives of the study.
It also show that Hagen Poiseuille flow equation has some limitations in terms of
estimating calcium carbonate deposition thickness growth rate.
It is therefore important to determine the amount of calcium carbonate deposited
on the surface of the capillary cell by dissolving the scale and measure by ICP-
MS technique.
The fluid flow parameters determined, enable us to work within a certain flow
conditions and to understand the fluid mechanics of the capillary rig.
The data generated from the capillary flow rig shows a good repeatability and
accuracy of the technique as shown in Figure 3-11. The next chapters of this
thesis present the experimental methodology and details of apparatus used to
carry out the bulk and surface analysis test on stainless steel sample inserted
into the capillary flow rig.
0
0.00001
0.00002
0.00003
0.00004
0.00005
0.00006
0.00007
5 11 20 31 50 80
Scale deposition gro
wth
ra
te (cm
/se
c)
Saturation ratio SR
HP
ICP

88
CHAPTER 4. Experimental procedure and methodology
4.1 Introduction
This chapter presents a description of the apparatus used during the experiments
namely, the bulk and surface analysis techniques used to study CaCO3 scale
surface deposition kinetics. It also provides the understanding of the materials
and reagents used for the preparation of the synthetic brine solutions, and scale
software used for the calculation of the saturation ratio of the brine solutions at
different temperatures.
4.2 Experimental conditions
Experiments were run at 25oC and 70oC, at different flow rates (5, 10, 15, 20 and
30 ml/min). The brine ratio was 50 vol% formation water: 50% vol sea water. The
capillary cell is made of stainless steel 316L (ID 1mm, length 10mm). This
material was chosen to prevent corrosion products e.g. (FeCO3) being formed
from carbon steel and to focus on the kinetics of CaCO3 surface deposition in the
capillary flow rig. The composition of the stainless material is shown in Table 4-1
Table 4-1: Composition of stainless steel (316L) [151]
Element Composition (Weight %)
Carbon (C) 0.03
Manganese (Mn) 2.00
Silicon (Si) 1.00
Chromium (Cr) 16.0 – 18.0
Nickel (Ni) 10.0 – 14.0
Phosphorus (P) 0.045
Sulphur (S) 0.03
Molybdenum (Mo) 2.0 – 3.0
Nitrogen (N) 0.10

89
4.3 Brine preparation
Formation water containing calcium ions (Ca2+) and sea water containing
carbonate ion (CO32-) were used for the experiments. The reagents used for the
preparation of these brines were sodium bicarbonate (NaHCO3), sodium chloride
(NaCl) and calcium chloride dihydrate (CaCl2.2H2O) which are all at different
concentrations, depending on the saturation ratio to be achieved. The
experiments were run at two different temperatures of 25oC and 70oC at 50:50
mixing ratio by varying the brine composition, but keeping the temperature
constant for each saturation ratio.
The saturation ratio of these brines was calculated using the Scale SoftPitzer
(Version 4.0). This software takes into account the co-precipitations that might
occur in complex brines. Saturation ratio is calculated generally using equation
4-1.
𝑆𝑅 = [𝐶𝑎2+][𝐶𝑂32−]
𝐾𝑠𝑝𝐶𝑎𝐶𝑂3
4-1
Where [Ca2+] denotes the concentration of calcium ion, [CO32-] denotes the
concentration of carbonate ion, Ksp denotes the solubility product constant of
calcium carbonate. The scale software is programmed to predict the scaling
tendency of mineral scales common in oil and gas production, The program
calculates the effect of temperature (T), pressure (p), total dissolved solid (TDS),
ion pairing and composition on activity coefficients [152-154]. The saturation ratio of
the brines covers a region where there is low scaling regime to a region of high
scaling regime as show in Table 4-2 and Table 4-3.

90
Table 4-2: Brine composition at 25oC
Brine (mg/l)
Na+ Cl- Ca2+ HCO3-
Formation water
29381
28135
1250,2000,2950,3600,4000,5000,
7500, 10000
-
Sea water
10666
18822
-
1850,4000,4800,
6000,8500,
10500, 15200, 18000
Saturation Ratio SR (50:50) mixed
SR 5, 11, 20, 31, 50, 80, 200, 398
SR 5, 11, 20, 31, 50 ,80, 200, 398
Table 4-3: Brine composition at 70oC
Brine (mg/l)
Na+ Cl- Ca2+ HCO3-
Formation water
29381
28135
600,1000,1450,1800,
2000,2500, 3300, 5000
-
Sea water
10666
18822
-
850,1800,2000,2600,3700,
4500, 8000, 10500
Saturation Ratio SR (50:50) mixed
SR 5, 11, 20, 31, 50, 80, 200, 398
SR 5, 11, 20, 31, 50, 80, 200, 398

91
4.4 Test method
Physical and chemical analyses were carried out, to enable the chemical
characteristics of calcium carbonate scale to be determined. A schematic outline
of the test methods is shown in Figure 4-1.
Figure 4-1: Schematic diagram of the bulk analysis test
4.4.1 Bulk analysis test
The experimental bulk measurements were conducted using different
techniques. These techniques include turbidity measurement and inductively
coupled plasma mass spectrometry (ICP-MS) measurement. This was carried
out to support the surface analysis tests.
4.4.2 Inductively Coupled Plasma Mass Spectrometry (ICP-MS)
measurement
The Inductively Coupled Plasma Mass Spectrometry (ICP-MS) is an analytical
technique used for the determination of elements in a solution. It has high
capability in detecting elements or ions and converts the atoms of the elements
in the sample ions. These ions are detected and separated by the mass

92
spectrometer [155] . After each test, the capillary test samples were dissolved in
10% acetic acid and the amount of calcium carbonate deposited on the surface
of the capillary cell was determined by ICP-MS. While for the bulk solution, the
ICP measurements were carried out by preparing a quenching (KCl/PVS)
solution of 11.42g of potassium chloride and 2g of polyvinyl sulfonate (PVS) scale
inhibitor in 2 litres of distilled water. The solution was then adjusted with 10%HCl
and concentrated NaOH solution to a pH value between 8 and 8.5. The sample
tests were prepared by taking 1ml of the test brine with a micropipette into 9ml of
the quenching solution (KCl/PVS) kept in test tube. The sample solutions were
analysed for Ca2+. The summary of the test protocol is given below. Figure 4-2
shows the ICP-MS apparatus used for the analysis.
4.4.3 Capillary cell preparation and solution sampling for ICP-MS analysis
(bulk precipitation)
Capillary cell samples were rinsed thoroughly with distilled water, followed
by drying in an oven for 1 hour before experiments.
Quenching solution was prepared by dissolving 11.42g of potassium
chloride (KCl) and 2g of polyvinyl sulfonate (PVS) scale inhibitor in 2 litres
of distilled water. PVS solution stabilise the sample and prevent further
precipitation, KCl solution act as an ionisation suppressant for Atomic
absorption determination of ions.
The Quenching solution was adjusted with 10% HCl and concentrated
NaOH solution to a pH value between 8 and 8.5.
1ml of brine solution containing formation water and sea water (FW+SW)
is placed in a test tube containing 9ml quenching solution (PVS/KCl), using
Eppendorf pipette, the test tube is shake thoroughly to ensure complete
mixing.
Brine solution is analysed by ICP for Calcium ion (Ca2+).
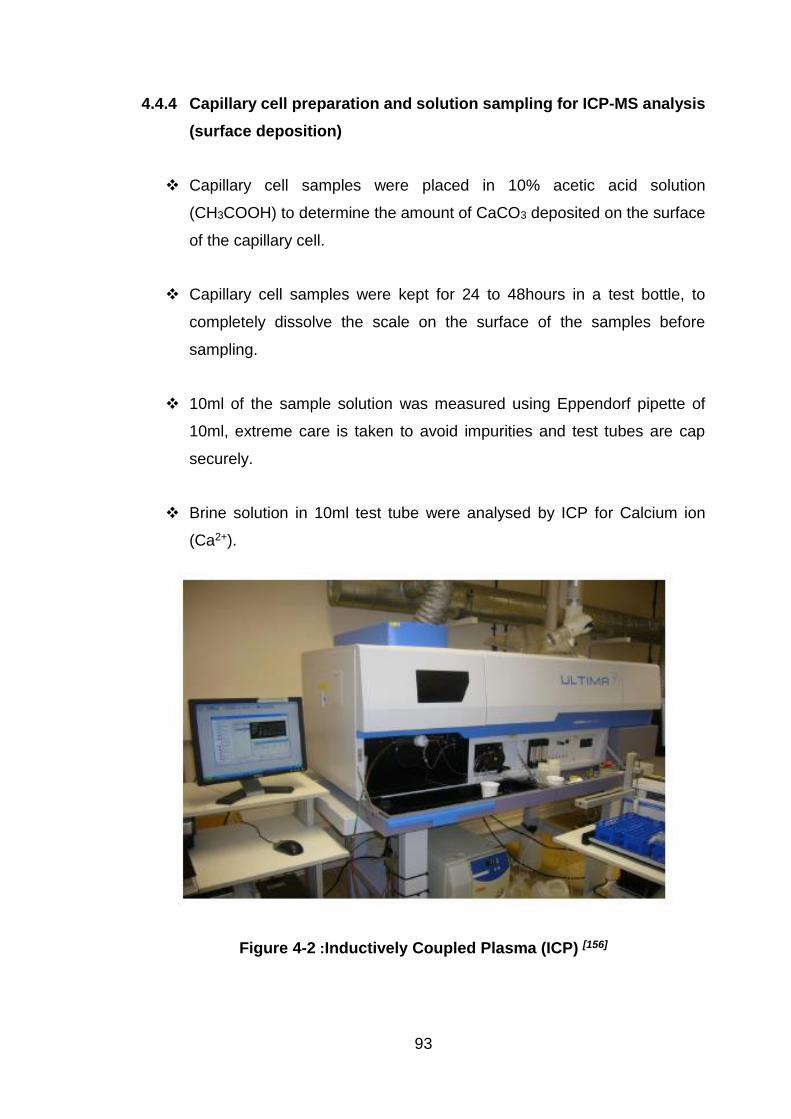
93
4.4.4 Capillary cell preparation and solution sampling for ICP-MS analysis
(surface deposition)
Capillary cell samples were placed in 10% acetic acid solution
(CH3COOH) to determine the amount of CaCO3 deposited on the surface
of the capillary cell.
Capillary cell samples were kept for 24 to 48hours in a test bottle, to
completely dissolve the scale on the surface of the samples before
sampling.
10ml of the sample solution was measured using Eppendorf pipette of
10ml, extreme care is taken to avoid impurities and test tubes are cap
securely.
Brine solution in 10ml test tube were analysed by ICP for Calcium ion
(Ca2+).
Figure 4-2 :Inductively Coupled Plasma (ICP) [156]

94
4.4.5 Turbidity measurement
Turbidity is a principal physical characteristic of the brine dispersion and is an
expression of the optical property that causes light to be scattered and absorbed
by particles and molecules, rather than transmitted in straight lines through a
water sample [157].
The bulk induction times for CaCO3 scale to form after mixing from the capillary
flow rig, were determined through turbidity measurements on the collected fluids
from the flow rig. Figure 4-3 shows a typical turbidity curve, showing three
regimes, I denotes the induction time, where the first observable change in the
turbidity of the bulk solution is observed, G is the crystal growth stage, where
there is sharp increase in turbidity and P is the plateau stage, where there is no
further precipitation or increase in turbidity.
Figure 4-3: Typical turbidity curve
Every minute, a turbidity measurement was taken for the first five minutes, further
increased to every 10minutes at a constant flow rate of 10ml/min for 25oC and
70oC respectively for all saturation ratios. The method used for this experiment

95
is a direct method which measures the attenuation (that is reduction in strength)
of light as it passes through a sample column of water. Figure 4-4 shows the
HACH colorimeter DR/890 model used for this study
Figure 4-4: HACH colorimeter DR/890 turbidity meter [158]
4.4.6 Surface analysis test
Flat stainless steel coupon was inserted into the capillary rig, where the calcium
carbonate scale deposition took place. This was analysed by Scanning Electron
Microscopy (SEM) and X-Ray Diffraction (XRD) observation, to enable the
morphology and polymorphs of calcium carbonate crystals to be determined.
Details design of the stainless steel extension tube and the flat coupon is mention
in chapter 4. Optical Microscope was used to determine the homogeneity of the
scale layers on the surface of a cross section of the capillary cell.
4.4.7 Scanning Electron Microscope (SEM) observation
A SEM was used to characterise the surface scale crystal deposited on the
stainless steel coupon. The SEM model (EVO MA15) was used for the analysis.
This SEM model is used for material analysis across a broader range of sample
dimensions. It has a wide range of application vary from surface integration,
forensics and failure analysis. Electron beam was focused on the scan samples
and the equipment deliver images with information about the samples
morphology, topography and composition of the scale deposited on the surface
of the stainless steel coupon. The EVO MA15, has a maximum specimen height
of 145mm, stage movement X,Y of 125mm, maximum specimen diameter of
250mm and maximum stage carrying capacity of 2kg [159]. The surface analysis

96
test was carried out in vacuum mode at a pressure of 3.5 𝑋 10−5𝑚𝑏𝑎𝑟 at voltage
of 10KV and working distance of 8mm. The magnification used was from 100x to
2000x. The SEM systems is shown in Figure 4-5.
Figure 4-5: Zeiss EVO MA15 SEM [159]
4.4.8 X-Ray Diffraction (XRD) observation
The morphology and crystalline species of calcium carbonate scale deposited on
the surfaces of the stainless steel coupon were analysed using a Philip Pan
Alytical X’ pert PRO diffractometer. This equipment is used to analyse single or
multiphase scale crystals. The high score plus software is used to acquire the
data and analyse the sample using a build in data bank. The assembly that
makes up of the sample holder, detector arm and the associated gearing is
shown in Figure 4-6. This instrument is powered by a Philip PW3040/60X-ray
generator and fitted with an X’celerator detector. The diffraction data is acquired
by exposing the samples to CU-Kα X-ray radiation, which has a wavelength (λ)
of 1.5418Ao, The X-rays are generated from a Cu anode supplied with 40KV and
a current of 40mA [160]. X-ray on the crystal is diffracted in a pattern
characteristics of the structure. Materials have different distinct diffraction
patterns, compounds are identified by using a database of diffractions patterns
and the purity of samples is also determine from it diffraction patterns [161]. The

97
diffraction pattern is used to determine and retrieve the lattices parameters of the
crystal structures.
Figure 4-6: Philip Pan Alytical Pert PRO MPD [160]
4.4.9 Optical Microscope
The homogeneity of the calcium carbonate scale layer on the surface of a cross
section of the capillary cell were analysed using Leica DM 6000M Optical
microscope. It operates with a motorized Z-drive, motorized nosepiece turret and
motorized stage. The motorized stages, operates as an integral part of the
system and respond to magnifications changes [162]. Figure 4-7 shows the optical
microscope used for this study.

98
Figure 4-7: Leica DM 6000M Optical microscope [162]
4.5 Summary
The equipment and techniques used for the bulk and surface analyses of calcium
carbonate scale are presented in this chapter. The bulk analysis techniques used
enable the understanding of the bulk precipitation process and also the amount
of deposited scales can be determined or quantified using ICP-MS techniques.
The surface analysis techniques help in the understanding of the nature, particle
size and homogeneity of calcium carbonate crystals formed on the surface of the
substrate.
The next chapters provide the results obtained from the capillary rig and various
bulk and surface analysis technique used in this study and their interpretation in
terms of scale precipitation and deposition kinetics.

99
CHAPTER 5. Bulk precipitation study of calcium carbonate
(CaCO3) scale: Influence of saturation ratio
5.1 Introduction
This chapter presents the bulk scaling analysis obtained from the experimental
work to support the surface deposition tests. The first section shows the results
of the turbidity measurements and the second section shows the results of the
Inductively Coupled Plasma Mass Spectrometry (ICP-MS) analysis.
Turbidity is an indication of the crystal formation of calcium carbonate scale in
the bulk solution and enables measurement of the induction time of calcium
carbonate precipitation. ICP-MS, enables the rate of consumption of calcium
ions in the bulk solution to be determined from which the amount of calcium
carbonate scale deposited on the surface of the capillary cell can be determined.
The ICP-MS measurement enables the mass balance of the calcium ions
consumed during scale formation to be completed and be reconciled with the
ionic content of the effluent after the deposition test.
5.2 Calcium carbonate turbidity measurement at 25oC and 70oC
Turbidity measurement helps in the understanding of the inorganic scale
precipitation process; the induction time of calcium carbonate scale can be
determined. As described in Chapter 3, Figure 4-3 of this thesis, the typical
turbidity curve shows three different regions of the scale precipitation process.
There is a region where the turbidity is zero; at this point there are no crystals in
the bulk solution, which is referred to as the induction period. The region of rapid
growth and finally the region where there is no further precipitation of scaling
ions, at this point the turbidity curve attains a plateau region or equilibrium [143].
In this study for the bulk analysis, our emphasis is on the initial stage of the
crystallization process and, as such, the induction time and scaling regime with
respect to the scale mechanism are established.
Figure 5-1a and Figure 5-2a show the turbidity measurement of calcium
carbonate scale at 25oC and 70oC under a laminar flow regime, while Figure 5-1b
and Figure 5-2b , show the high resolution of the turbidity measurement for the

100
first five minutes of calcium carbonate precipitation indicated with red dotted
lines.
The turbidity measurements were taken at one minute intervals for the first five
minutes of calcium carbonate precipitation as shown in Figure 5-1b and Figure
5-2b respectively, and further extended to every 10 minutes to capture the later
stages of calcium carbonate precipitation as shown in Figure 5-1a and Figure
5-2a respectively. The nucleation process for high saturation ratios 200 and 398
was rapid as expected. This is due to high ionic concentration of the brine solution
and there was no induction time recorded. This is in agreement with studies at
high concentration, representing rapid precipitation of calcium carbonate scale
[115, 163-165].
The precipitation rate of calcium carbonate scale increases with increasing
temperature. The solubility of CaCO3 decreases with increasing temperature and
also the kinetics of the scale process are enhanced. This implies that, for SR >
80, the induction time is less than the residence time (tind < tr) and so there are
crystals present in the bulk solution when it passes the capillary. The residence
time in the flow rig at a flow rate of 10ml/min is 1.08s, which is the time for the
fluid to travel from the mixing point to the working section.
The precipitation rate for lower saturation values (SR < 80) was slow compared
to high saturation ratio (SR > 80). Induction times of 5, 4, 3, 2, 1 and < 1 min
were obtained for SR 5, SR 11, SR 20, SR 31, SR 50 and SR 80 respectively at
25oC and induction times of 4, 3, 2, 1, <1 and < 1 mins was recorded for SR 5,
SR 11, SR 20, SR 31, SR 50 and SR 80 at 70oC respectively.
These results show that, at lower saturation ratio (SR < 80) there are no crystals
present in the bulk solution at the capillary, since the induction time is greater
than the residence time (tind >tr).

101
Figure 5-1 (a & b): CaCO3 scale turbidity measurement at 25oC

102
Figure 5-2 (a & b): CaCO3 scale turbidity measurement at 70oC

103
A study by Stamatakis et al [58] which determined the induction time of calcium
carbonate scale formation under dynamic flow conditions. It was reported that at
SR > 80, the induction time becomes independent of the temperature, but
depends on the initial degree of the solution saturation ratio. At very high degrees
of supersaturation, the process is dominated by solution concentration.
The turbidity curves suggest we can create two Scenarios within the brine
composition investigated; That is, a region where the SR > 80, the scale
mechanism is predominantly heterogeneous nucleation and adhesion, while the
region where the SR < 80, is dominated by crystallization process. This
hypothesis will be validated by results obtained in the surface deposition study
presented in chapter 7.
5.3 Inductively Coupled Plasma Mass Spectrometry (ICP-MS)
measurement at 25oC and 70oC
The rate of consumption of ionic species (Ca2+, CO32-) in the bulk solution gives
an understanding of the precipitation rate of calcium carbonate scale (CaCO3).
In this study, the rate of consumption of calcium ions (Ca2+) in the bulk solution
was determined at different saturation ratios and temperatures.
Figure 5-3 and Figure 5-4 show the calcium ion concentration consumption rate
in bulk solution at 25oC and 70oC for all the saturation values. At 25oC, the
calcium ion (Ca2+) concentration drops rapidly from 1250, 2000, 2950, 3600,
4000, 5000, 7500 and 10000mg/l to,875, 1035, 1643, 2021, 2053, 2226, 4024,
7036mg/l for saturation values of 5, 11, 20, 31, 50, 80, 200 and 398 respectively,
for the first few minutes, followed by a gradual decrease in calcium ion (Ca2+)
concentration. There were no further reaction or precipitation of calcium ion after
30 minutes. This corresponds to the plateau stage of the turbidity curve, while
the initial part of the rapid precipitation or consumption rate corresponds to the
growth stage of calcium carbonate as shown in the typical turbidity curve.
At 70oC, calcium ion (Ca2+) concentration drops more rapidly compared to the
condition at 25oC, as calcium ion concentration drops from 600, 1000, 1450,
1800, 2000, 2500, 3300 and 5000mg/l to 589,785, 840, 945,1020, 1950, 2025,
2636mg/l for saturation values of 5, 11, 20, 31, 50, 80, 200 and 398 respectively.

104
After 20 minutes when there was no further precipitation. As such the calcium ion
(Ca2+) concentration was constant until the end of the one hour experiment.
The calcium ion (Ca2+) concentration plateaux appear faster at 70oC compared
to 25oC due to the effect of temperature on the rate of precipitation or formation
of calcium carbonate scale (CaCO3). The rate of formation of calcium carbonate
scale increases with temperature and also higher saturation values enhance
crystal formation in the bulk solution, which could increase the tendency for
scaling process through heterogeneous nucleation.
There is a possibility of the nucleation process taking place instantaneously as
most of the calcium ion consumption takes place at the early stage of
crystallization [108]. This indicate the formation of nuclei at the same time, followed
by growth of nuclei thereafter. Until there is no further reaction showing that all
the calcium ion (Ca2+) in the bulk solution is fully consumed by the carbonate ion
(CO32-) in the solution, as shown in the plateau stage in Figure 5-3 and Figure
5-4.
Figure 5-3: Calcium ion concentration [Ca2+] as a function of time determined by ICP at 25oC
0
2000
4000
6000
8000
10000
12000
0 10 20 30 40 50 60
Calcium
ion concentration C
a2+ (m
g/l)
Time (min)
SR 5 SR 11 SR 20 SR 31
SR 50 SR 80 SR 200 SR 398

105
Figure 5-4: Calcium ion concentration [Ca2+] as a function of time determined by ICP at 70oC
5.4 Summary
The bulk analyses studies enable us to create two scenarios within the brine
composition values investigated.ie. At saturation ratio SR >80, there is no
induction time recorded. As such for the times that represent the residence time
from the mixing point to the capillary in the flow rig described in chapter 3. The
mechanism of scale is likely to be dominated by mixed regime of heterogeneous
nucleation and adhesion.
At saturation values SR < 80, the induction times recorded showed that there will
be no crystals in the bulk solution as it passes the capillary. The induction time is
greater than the residence time (tind > tr). The scale mechanism is likely to be a
crystallization process.
This two scenarios will be validated, based on the results obtained in the surface
deposition study presented in chapter 7.
0
1000
2000
3000
4000
5000
6000
0 10 20 30 40 50 60
Calcium
ion concentration C
a2+ (m
g/l)
Time (min)
SR 5 SR 11 SR 20 SR 31
SR 50 SR 80 SR 200 SR 398

106
CHAPTER 6. Calcium carbonate scale surface deposition
kinetics
6.1 Introduction
The main focus of this study is to determine the kinetics of surface scaling under
hydrodynamic conditions. This chapter shows the raw experimental results
obtained from the capillary flow rig with respect to the effect of flow rate, degree
of supersaturation and temperature on calcium carbonate scale (CaCO3)
deposition. The results obtained from various surface analysis techniques are
also presented.
6.1.1 The effect of flow rate on calcium carbonate surface deposition kinetics at 25oC
Flow rate is one of the driving forces for calcium carbonate scale precipitation
and deposition. Increasing the flow rate promotes scale precipitation by
increasing the motion of scaling ions in the bulk solution, which invariably
increases the tendency for calcium ions (Ca2+) and carbonate ions (CO32-) to
react or form clusters after the induction time. Figure 6-1 to Figure 6-8, show
differential pressure as a function of time at different flow rates for SR values of
5, 11, 20, 31, 50, 200 and 398.
Figure 6-1. Differential pressure as a function of time for saturation ratio 5, 25oC at different flow rates

107
Figure 6-2: Differential pressure as a function of time for saturation ratio 11, 25oC at different flow rates
Figure 6-3: Differential pressure as a function of time for saturation ratio 20, 25oC at different flow rates

108
Figure 6-4: Differential pressure as a function of time for saturation ratio 31, 25oC at different flow rates
From the results, it is clear that calcium carbonate scale deposition rate increases
with flow rate. At low flow rates of 5ml/min for SR 5, it takes about 4362 minutes
(72.7hours) for the differential pressure to get to 5Psi, however, when the flow
rate is increase to 30ml/min, it takes 581.9minutes (9.7 hours) to get to 5Psi. The
result observed also shows that the differential pressure value remains the same
until after 4120mins, when there was a rapid precipitation and deposition of
calcium carbonate scale on the surface of the capillary cell, resulting to a sharp
increase in the differential pressure.
A similar trend is observed for other flow rates and saturation values as shown in
Table 6-1.

109
Table 6-1: Calcium carbonate scale deposition time for SR 5, 5ml/min at
25oC
Flow rate (ml/min) Deposition time (5Psi)
(hours)
5 72.7
10 29.4
15 20.6
20 16.4
30 9.7
Figure 6-5: Differential pressure as a function of time for saturation ratio 50, 25oC at different flow rates

110
Figure 6-6: Differential pressure as a function of time for saturation ratio 80, 25oC at different flow rates
Figure 6-7: Differential pressure as a function of time for saturation ratio 200, 25oC at different flow rates
-1
0
1
2
3
4
5
6
0 20 40 60 80 100 120 140
Differe
ntial P
re
ssure
(P
si)
Time (min)
5ml/min 10ml/min 15ml/min 20ml/min 30ml/min
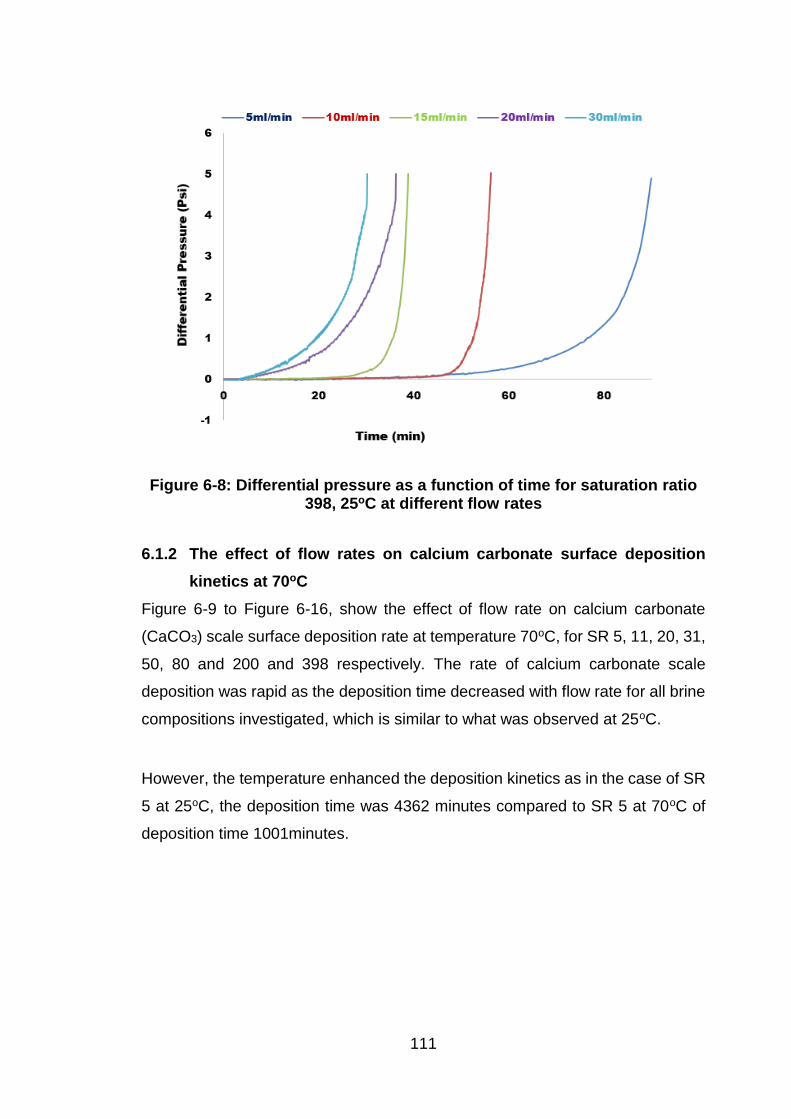
111
Figure 6-8: Differential pressure as a function of time for saturation ratio 398, 25oC at different flow rates
6.1.2 The effect of flow rates on calcium carbonate surface deposition
kinetics at 70oC
Figure 6-9 to Figure 6-16, show the effect of flow rate on calcium carbonate
(CaCO3) scale surface deposition rate at temperature 70oC, for SR 5, 11, 20, 31,
50, 80 and 200 and 398 respectively. The rate of calcium carbonate scale
deposition was rapid as the deposition time decreased with flow rate for all brine
compositions investigated, which is similar to what was observed at 25oC.
However, the temperature enhanced the deposition kinetics as in the case of SR
5 at 25oC, the deposition time was 4362 minutes compared to SR 5 at 70oC of
deposition time 1001minutes.

112
Figure 6-9: Differential pressure as a function of time for saturation ratio 5, 70oC at different flow rates
Figure 6-10: Differential pressure as a function of time for saturation ratio 11, 70oC at different flow rates

113
Figure 6-11: Differential pressure as a function of time for saturation ratio 20, 70oC at different flow rates
Figure 6-12: Differential pressure as a function of time for saturation ratio 31, 70oC at different flow rates

114
The results clearly show that, even at the same saturation ratio, temperature has
a great influence on the deposition time of calcium carbonate scale. A similar
trend was observed for all the saturation values investigated.
Figure 6-13: Differential pressure as a function of time for saturation ratio 50, 70oC at different flow rates

115
Figure 6-14: Differential pressure as a function of time for saturation ratio 80, 70oC at different flow rates
Figure 6-15: Differential pressure as a function of time for saturation ratio 200, 70oC at different flow rates

116
Figure 6-16: Differential pressure as a function of time for saturation ratio 398, 70oC at different flow rates.
The analysis of this data generated from the capillary flow rig and the discussions
in relation to nucleation theory, calcium carbonate surface kinetics mechanisms
and the growth kinetics are presented in chapter 7 of this thesis to reflect the
aims and objectives of the study.
6.2 Scanning Electron Microscope (SEM) observations
The scanning electron microscope was used to support calcium carbonate scale
surface deposition results obtained from the capillary rig and bulk analysis
results. This technique helps to determine the shape and size of calcium
carbonate (CaCO3) scale crystals as they transit from one form to another due to
experimental conditions. It is observed from Figure 6-17 to Figure 6-20, that the
degree of supersaturation influences the morphology of scale crystals [166-168] and
also flow rate changes the morphology of calcium carbonate scale [80, 101].
The SEM images shown in Figure 6-17 to Figure 6-20, indicate that the
morphology of calcium carbonate scale crystals changes with flow rate. It is also
well known from other studies [78, 169], that apart from degree of supersaturation

117
and flow rates, there are other factors which could influence the morphology and
particle size of calcium carbonate scale crystals such as temperature, pH, ionic
concentration of Ca2+ and CO32- and presence of additives.
At flow rate of 10ml/min, the crystals are predominantly cubic crystals, which are
mainly calcite and no traces of aragonite or vaterite crystals. However, calcite
crystals became larger at high flow rate of 15ml/min with more aragonite crystals
observed for SR 31, compared to a flow rate of 10ml/min which is completely
dominated with calcite crystals. A similar trend is observed for SR 50 at 25oC and
70oC respectively.
The SEM image observed is due to high supersaturation value and temperature
which enhance the kinetics of the calcium carbonate scale precipitation. There
was no presence of vaterite crystals in both conditions. This may be due to the
unstable nature of vaterite crystals at high supersaturated solution.
Figure 6-17 : SEM image of calcium carbonate crystals at SR 31, 25oC for (a) 10ml/min and (b) 15ml/min

118
Figure 6-18: SEM image of calcium carbonate crystals at SR 50, 25oC for (a) 10ml/min and (b) 15ml/min
Figure 6-19: SEM image of calcium carbonate crystals at SR 31, 70oC for (a) 10ml/min and (b) 15ml/min

119
Figure 6-20: SEM image of calcium carbonate crystals at SR 50, 70oC for (a) 10ml/min and (b) 15ml/min
6.3 X-ray Diffraction (XRD) Measurements
Figure 6-21 and Figure 6-22 show the X-ray diffraction pattern for saturation ratio
of 31 and 50 at 25oC for flow rates of 10ml/min and 15ml/min respectively. From
the results, A denotes aragonite crystals and C denotes calcite crystals. It is
observed from the results that, at flow rate of 10ml/min, the crystals are
dominated by calcite crystals, but as the flow increases to 15ml/min, the
morphology changes with traces of aragonite crystals present on the surface of
the stainless steel.
The highest peak obtained at about 29.5o is assigned to calcite, with 51.2o is
assigned to aragonite. The few traces of aragonite observed at 25oC for both flow
rates are due to the effect of low temperature on aragonite stability [170], as calcite
crystals are more stable at low temperature.
Studies [171, 172], have shown that, at high saturation ratio, a spontaneous
formation of calcium carbonate scale crystals clusters on the stainless steel
surface is increased due to high precipitation of calcium carbonate scale at high
saturation values. In terms of the morphology changes, flow rate has more
influence on the morphology of calcium carbonate (CaCO3) scale crystals than
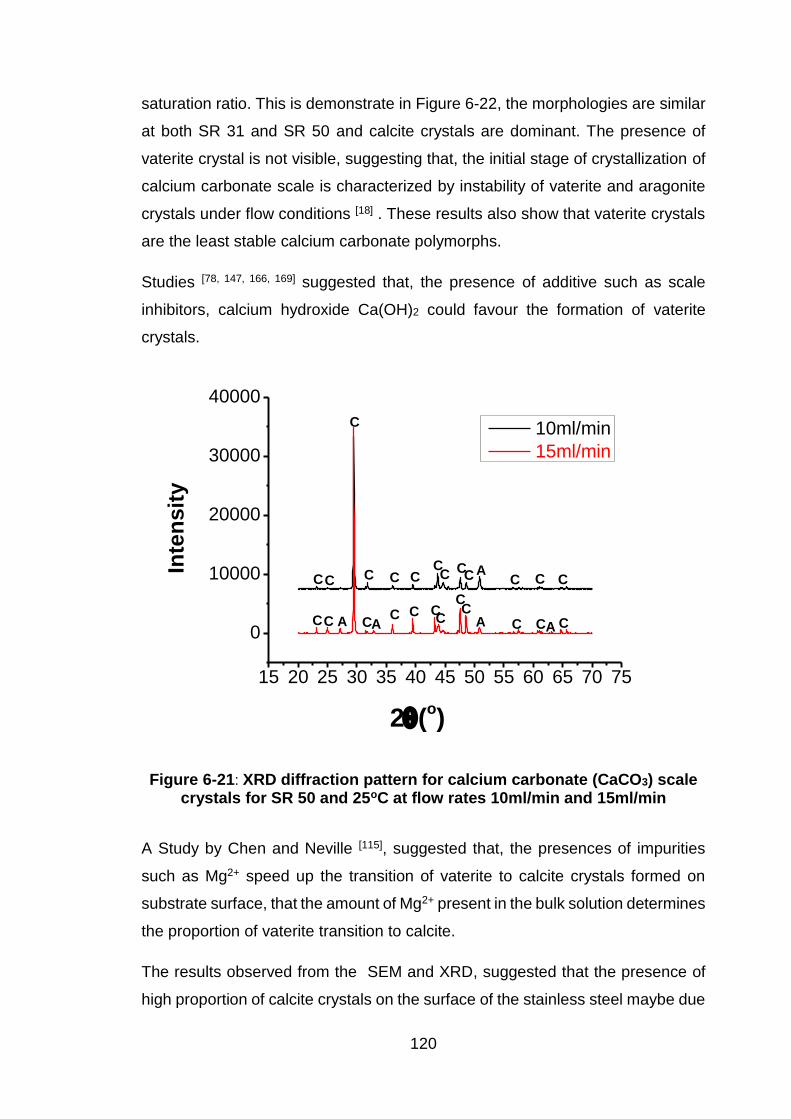
120
saturation ratio. This is demonstrate in Figure 6-22, the morphologies are similar
at both SR 31 and SR 50 and calcite crystals are dominant. The presence of
vaterite crystal is not visible, suggesting that, the initial stage of crystallization of
calcium carbonate scale is characterized by instability of vaterite and aragonite
crystals under flow conditions [18] . These results also show that vaterite crystals
are the least stable calcium carbonate polymorphs.
Studies [78, 147, 166, 169] suggested that, the presence of additive such as scale
inhibitors, calcium hydroxide Ca(OH)2 could favour the formation of vaterite
crystals.
Figure 6-21: XRD diffraction pattern for calcium carbonate (CaCO3) scale crystals for SR 50 and 25oC at flow rates 10ml/min and 15ml/min
A Study by Chen and Neville [115], suggested that, the presences of impurities
such as Mg2+ speed up the transition of vaterite to calcite crystals formed on
substrate surface, that the amount of Mg2+ present in the bulk solution determines
the proportion of vaterite transition to calcite.
The results observed from the SEM and XRD, suggested that the presence of
high proportion of calcite crystals on the surface of the stainless steel maybe due
15 20 25 30 35 40 45 50 55 60 65 70 75
0
10000
20000
30000
40000
C
C
C
C
C
C
C
C
C
C
C
CC
C
CC
C
C
C
C C
C
C
C
AA A
AInte
nsit
y
2(o)
10ml/min
15ml/min
AC

121
to the stability of calcite crystals at low temperature and high supersaturation and
also the absence of additives or impurities and scale inhibitors in the bulk
solution.
Figure 6-22: XRD diffraction pattern for calcium carbonate scale (CaCO3) crystals at 25oC, 10ml/min for SR 31 and SR 50
6.4 Optical Microscope Images
In an attempt to determine the homogeneity of calcium carbonate crystals
deposited on the capillary cell and to reconcile it with the assumption that the
scale crystals along the capillary cell is not uniform, optical microscopy
observation was carried out.
The optical microscope observations show that, irrespective of the experimental
conditions, the calcium carbonate scale crystals layers were not uniform along
the capillary cell, which may be more obvious in long capillary tube as in the case
of dynamic tube blocking rig, where a long capillary coil of length 1 to 2m is used
as the scaling surface.
Figure 6-23 (a-d) show the cross sections of the microscope image observation
at different experimental conditions. The microscope image observation show
15 20 25 30 35 40 45 50 55 60 65 70 75
0
10000
20000
30000
C
C
C
CC
C C
CA C A
A
CC
CCC
CC
CC
C
C
Inte
nsit
y
2(o)
SR 50
SR 31

122
that the deposition rate of calcium carbonate (CaCO3) scale increases with
differential pressure for saturation ratio of 11 as expected. At differential pressure
of 5Psi, the amount of calcium carbonate scale deposited on the surface of the
capillary cell is higher compared to that at 1Psi.
The optical microscope observations show that, irrespective of the experimental
conditions, the calcium carbonate scale crystals layers were not uniform along
the capillary cell, which may be more obvious in long capillary tube as in the case
of dynamic tube blocking rig, where a long capillary coil of length 1 to 2m is used
as the scaling surface.
Figure 6-23: Cross sections of optical microscope images at different conditions

123
6.5 Scaling time and saturation ratio at 25oC and 70oC
The scaling time (ts), is the time at which the differential pressure deviate from 0
Psi as shown previously in chapter 3 and Figure 6-24. The scaling time (ts) is
similar to the bulk induction time (tind) for bulk scaling process. Relating the
scaling time to saturation ratio gives the understanding of the surface scaling
mechanism under flow conditions.
Figure 6-24: Scaling time (ts) determination
Figure 6-25 and Figure 6-26 shows the relationship between scaling time (ts) and
saturation ratio (SR) for 25oC and 70oC respectively. From the results, it is
observed that the scaling time (ts), is inversely proportional to saturation ratio at
different flow rate and temperature. Increased saturation value and flow rate,
decrease the scaling time. This observation is in agreement with reported studies
[58, 61, 119, 173].
The scaling time is greatly influenced by the degree of supersaturation, flow rate
and temperature [58]. Brine with saturation value of 5 has the highest scaling time

124
of 4120 minutes compared to brine with saturation value of 398 with the lowest
scaling time of 61 minutes for 5ml/min and 25oC as shown in Figure 6-25.
Figure 6-25: Relationship between scaling time ts and saturation ratio at 25oC
The long scaling time observed at lower saturation ratio, is due to low ionic
compositions of the bulk solution, which invariably slow down the nucleation
process. At low flow rate, the formation of nuclei is slow resulting from decrease
in mass transfer of scaling ions (Ca2+, CO32-) in the bulk solution. The motion of
scaling ions in the solution determines the collision or reaction rate, which is more
rapid at moderate flow rates as observed for a flow rates of 10ml/min and
15ml/min respectively.
At 70oC, the nucleation process was rapid compared to that of low temperature
of 25oC. This is because, an increase in temperature increases the kinetic energy
of the solution, which in turn increases the reaction rate of calcium ion (Ca2+) and
0
500
1000
1500
2000
2500
3000
3500
4000
0 100 200 300 400 500
Scaling tim
e t
s(m
in)
Saturation ratio SR
5ml/min
10ml/min
15ml/min

125
bicarbonate ion (CO32-) leading to rapid formation of calcium carbonate scale,
even at the same saturation value. Temperature was the dominant parameter in
the scaling process at SR 5 at both 25oC and 70oC (Figure 6-25 and Figure 6-26)
where the highest scaling times are 4120minutes and 964minutes respectively.
A similar trends is observed for all flow rates and saturation values investigated
in this study. These results clearly shows that the degree of supersaturation and
flow rate has great influence on the rate of surface deposition, in agreement with
the bulk analysis results.
Figure 6-26: Relationship between scaling time ts and saturation ratio at 70oC
0
100
200
300
400
500
600
700
800
900
1000
0 100 200 300 400
Scaling tim
e t
s(m
in)
Saturation ratio SR
5ml/min
10ml/min
15ml/min

126
6.6 Summary
The key parameters influencing the precipitation and deposition of calcium
carbonate scale (CaCO3) was clearly demonstrated from the raw results
obtained.
The effect of flow rate on calcium carbonate scale deposition rate is due to the
collision or motion of scaling ions in the bulk solution. The collisions of ions
increases as the flow rate is increased, invariably leading to rapid formation of
calcium carbonate scale. On the other hand, the adherence of this scale to the
surface of the capillary cell is depended on different factors such as interfacial
tension, wettability, surface roughness, flow regime etc. Details of these factors
will be discussed in chapter 7.
The flow rate also affects the morphology of calcium carbonate scale crystals.
Calcite crystals were more prominent at low flow rates, while traces of aragonite
crystals were observed as the flow rate increased.
The optical microscope observations shows that the calcium carbonate crystals
were not uniform along the capillary cell, which might be the reason for the
difference in the amount of calcium carbonate scale determine by ICP-MS
measurement and Hagen Poiseuille flow assumptions.
Temperature and degree of supersaturation has also shown a great influence on
the deposition rate of calcium carbonate (CaCO3) scale as their effect was
significant in calcium carbonate scale deposition time obtained at different
experimental conditions investigated.
Chapter 7 provides the detailed analysis of the raw results obtained from this
chapter and discussions in relation to nucleation theory, calcium carbonate
(CaCO3) scale surface deposition mechanism, growth kinetics and empirical
models established in this work.

127
CHAPTER 7. Discussion
7.1 Introduction
Calcium carbonate (CaCO3) scale is one of the most widely studied inorganic
scale types; different mechanisms and prediction models of its formation have
been proposed by researchers over the years, but there are some challenges in
terms of understanding its formation mechanisms under flow conditions. Having
a reliable model that can predict its formation as a function of time and other
environmental conditions is a real and timely challenge.
Understanding both bulk and surface scaling processes of calcium carbonate
scale deposition could enable reliable strategies for mitigating its formation in the
field to be developed. The previous two chapters of this work showed the results
obtained from the capillary flow rig experiments in relation to both surface and
bulk scaling processes for different environmental conditions.
This chapter presents the analysed results from chapter 5 and 6 and a discussion
of calcium carbonate scale surface deposition mechanisms in relation to
nucleation theory, surface deposition mechanisms, growth kinetics and CaCO3
empirical models established for predicting surface scaling processes.
This chapter is split into the following key points.
Nucleation theory
Adhesion and crystallization mechanisms
Determination of classical nucleation theory parameters
CaCO3 scale deposition growth kinetics
CaCO3 surface empirical models

128
7.2 CaCO3 scale surface deposition mechanism
The mechanisms by which calcium carbonate (CaCO3) scale can form on the
surface of the capillary cell in relation to the results obtained from the capillary rig
experiment, nucleation theory and scaling time (ts) are analysed and discussed
in this chapter.
Chapters 5 and 6 showed the results of how various factors such as temperature,
flow rate and degree of supersaturation influence the bulk precipitation and
surface deposition of calcium carbonate (CaCO3) scale.
The scaling time (ts) is similar to the bulk induction time (tind) for bulk scaling
processes. It is defined as the time the differential pressure deviates from 0 Psi
as presented in chapter 6, Figure 6-24. It is assumed that at ts there is no scale
build-up on the capillary cell surface as such the onset differential pressure
remain the same. A period after ts, there is rapid increase in differential pressure
indicating the period of accelerated nucleation and growth of CaCO3 crystals.
Relating ts to SR can give the understanding of the surface scaling mechanisms
under flow conditions. Consequently the constants that describe the nucleation
theory can be determined from the relationship between (log ts) and (log SR)2
[57, 58] as shown in equation 7-1 and 7-2.
log (𝑡𝑠 ) = [𝐴 +𝐵
𝑇3(𝑙𝑜𝑔𝑆𝑅)2] 7-1
B=𝛽𝛾3𝑉𝑚2𝑁𝐴 𝑓(𝜃)
(1.3𝑅)3
7-2
From equation 7-1 and 7-2 [57], the main parameters governing the rate of
nucleation are, temperature, saturation ratio and interfacial energy
Where 𝛾 denotes the interfacial energy (mN/m), Vm is the molecular volume of
crystals (6.132𝑥10−23 cm3 for calcite), T the temperature (K), SR the saturation
ratio, ts the scaling time (s), A an empirical constant (dimensionless), R the molar
gas constant (J/mol.K), NA denotes the Avogadro's constant (mol-1),𝑓(𝜃) is a
correction factor depending on the type of nucleation, 𝛽 is a geometric factor of
16𝜋
3 for spherical shape crystal.

129
The induction period has often been used as a quantitative method for assessing
the nucleation process, but it is sometimes challenging in getting an accurate
measurement in some chemical substances due to its complexity, techniques
and the influence of some external factors. This work focuses on a surface
scaling process in relation to saturation ratio, flow rate and temperature.
7.3 Adhesion and crystallization mechanism
The deposition of calcium carbonate (CaCO3) scale on the surface of the capillary
cell can occur either by adhesion of pre-precipitated scale or a heterogeneous
nucleation (surface crystallization process).This two processes can occur
simultaneously within a given range of brine saturation ratios.
Adhesion occurs when surfaces have an affinity to one another by intermolecular
forces such as valence forces. The scale crystals can attach to the wall of the
capillary cell either by nucleated crystals being transported to the surface of the
capillary cell or by agglomerating in the bulk where they attach to the surface of
the capillary cell. This process can occur through intermolecular forces such as
Van der Waals force, electrostatic interaction and chemical bonding [81-83, 174, 175].
Adhesion of the crystals to the surface of the capillary cell is dependent on the
nature of the crystals, substrate (capillary cell) and the experimental conditions
or the environment.
A schematic diagram of the adhesion process is shown in Figure 7-1.
Figure 7-1: Scale deposited on the wall of capillary cell by heterogeneous nucleation and adhesion
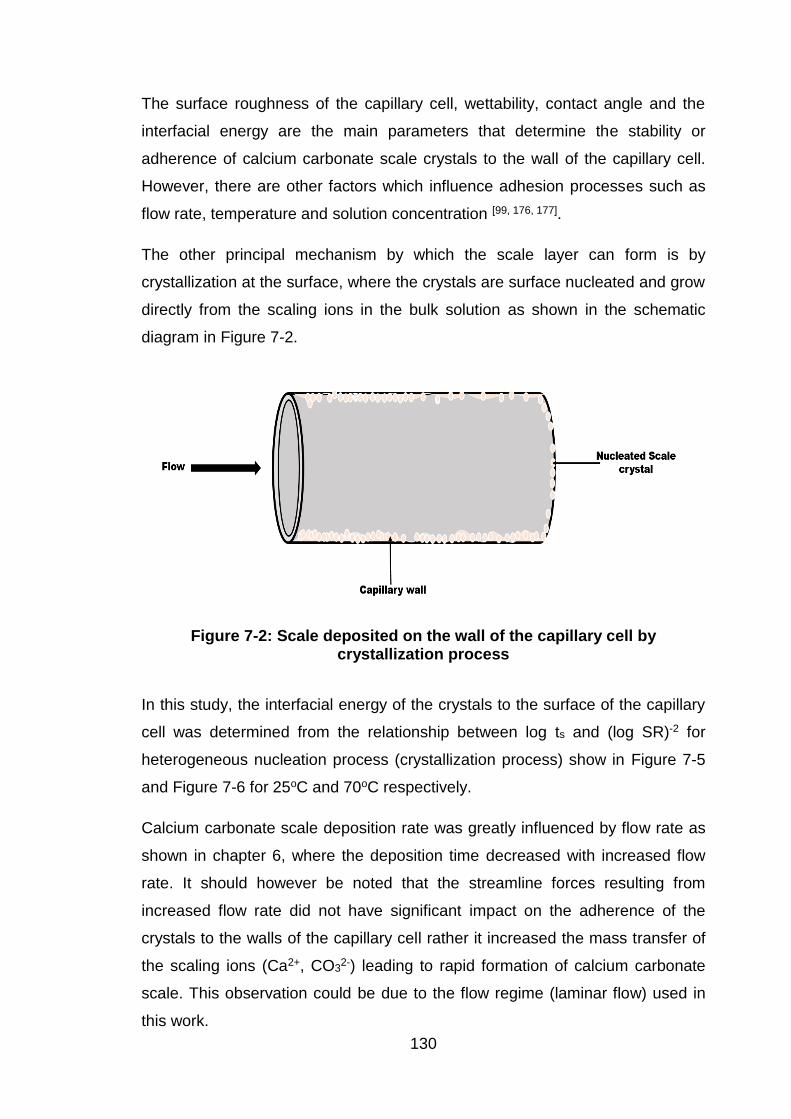
130
The surface roughness of the capillary cell, wettability, contact angle and the
interfacial energy are the main parameters that determine the stability or
adherence of calcium carbonate scale crystals to the wall of the capillary cell.
However, there are other factors which influence adhesion processes such as
flow rate, temperature and solution concentration [99, 176, 177].
The other principal mechanism by which the scale layer can form is by
crystallization at the surface, where the crystals are surface nucleated and grow
directly from the scaling ions in the bulk solution as shown in the schematic
diagram in Figure 7-2.
Figure 7-2: Scale deposited on the wall of the capillary cell by crystallization process
In this study, the interfacial energy of the crystals to the surface of the capillary
cell was determined from the relationship between log ts and (log SR)-2 for
heterogeneous nucleation process (crystallization process) show in Figure 7-5
and Figure 7-6 for 25oC and 70oC respectively.
Calcium carbonate scale deposition rate was greatly influenced by flow rate as
shown in chapter 6, where the deposition time decreased with increased flow
rate. It should however be noted that the streamline forces resulting from
increased flow rate did not have significant impact on the adherence of the
crystals to the walls of the capillary cell rather it increased the mass transfer of
the scaling ions (Ca2+, CO32-) leading to rapid formation of calcium carbonate
scale. This observation could be due to the flow regime (laminar flow) used in
this work.
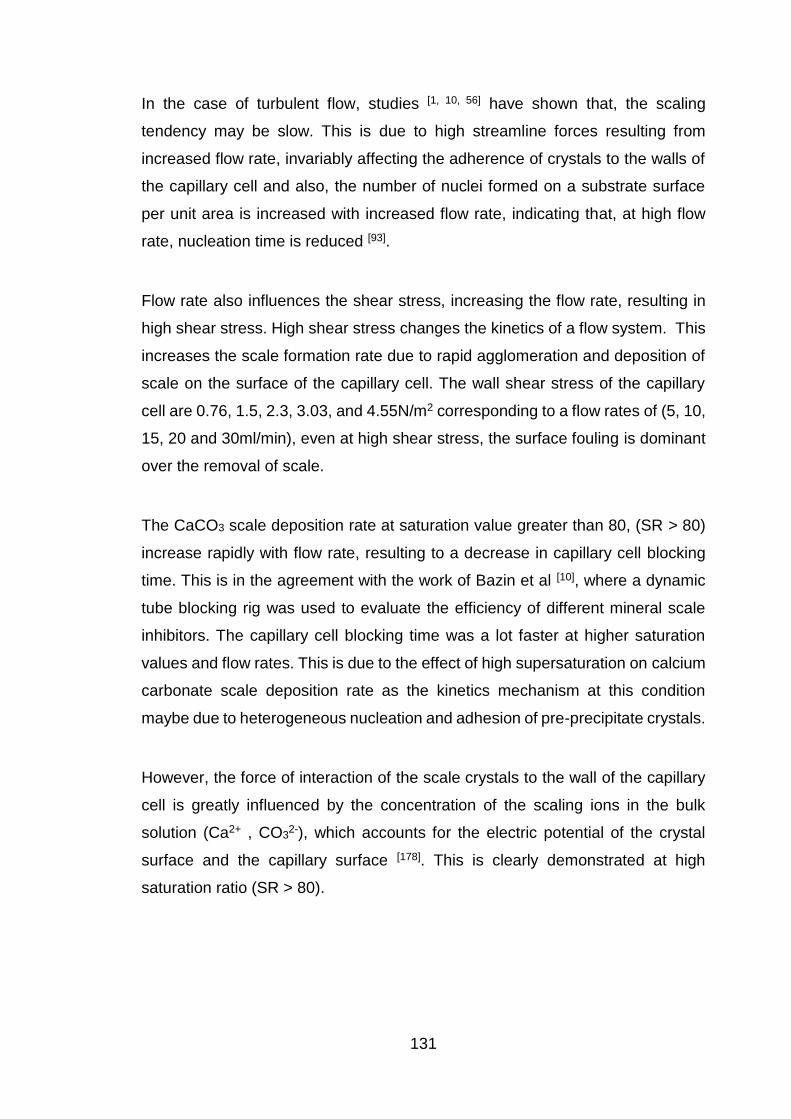
131
In the case of turbulent flow, studies [1, 10, 56] have shown that, the scaling
tendency may be slow. This is due to high streamline forces resulting from
increased flow rate, invariably affecting the adherence of crystals to the walls of
the capillary cell and also, the number of nuclei formed on a substrate surface
per unit area is increased with increased flow rate, indicating that, at high flow
rate, nucleation time is reduced [93].
Flow rate also influences the shear stress, increasing the flow rate, resulting in
high shear stress. High shear stress changes the kinetics of a flow system. This
increases the scale formation rate due to rapid agglomeration and deposition of
scale on the surface of the capillary cell. The wall shear stress of the capillary
cell are 0.76, 1.5, 2.3, 3.03, and 4.55N/m2 corresponding to a flow rates of (5, 10,
15, 20 and 30ml/min), even at high shear stress, the surface fouling is dominant
over the removal of scale.
The CaCO3 scale deposition rate at saturation value greater than 80, (SR > 80)
increase rapidly with flow rate, resulting to a decrease in capillary cell blocking
time. This is in the agreement with the work of Bazin et al [10], where a dynamic
tube blocking rig was used to evaluate the efficiency of different mineral scale
inhibitors. The capillary cell blocking time was a lot faster at higher saturation
values and flow rates. This is due to the effect of high supersaturation on calcium
carbonate scale deposition rate as the kinetics mechanism at this condition
maybe due to heterogeneous nucleation and adhesion of pre-precipitate crystals.
However, the force of interaction of the scale crystals to the wall of the capillary
cell is greatly influenced by the concentration of the scaling ions in the bulk
solution (Ca2+ , CO32-), which accounts for the electric potential of the crystal
surface and the capillary surface [178]. This is clearly demonstrated at high
saturation ratio (SR > 80).

132
Figure 7-3: Relationship between log ts and (log SR) -2 at 25oC
Figure 7-4: Relationship between log ts and (log SR) -2 at 70oC

133
Supersaturation is the driving force for crystallization, according to classical
nucleation theory [57], the main parameters governing the rate of nucleation are,
temperature, saturation ratio and interfacial energy as shown in equation 7-1 and
7-2. The effects of saturation ratio and temperature on calcium carbonate scale
nucleation processes were presented in chapter 6.
From this work, the relationship between this factors were established to
determine the boundary between the processes that occurs within the brine
composition investigated as shown in Figure 7-3 and Figure 7-4 for 25oC and
70oC respectively. This boundary is based on the fact that crystals were or were
not seen in the bulk solution as stated previous in the bulk analysis study.
Figure 7-3 and Figure 7-4 show the relationship between log ts and (log SR)-2 at
25oC and 70oC respectively, from the results, the surface scaling kinetic
mechanism were substantiated within the saturation ratios investigated.
It is observed that, there is a linear relationship between log ts and (log SR)-2 at
lower saturation values (SR < 80), indicating heterogeneous nucleation which is
purely crystallization process. In this mechanism, the nucleation process is driven
by presence of foreign material and nucleation occurs at the nucleation site. The
scaling time of this brines were quite slow due to the chemical composition or
ionic strength of the bulk solution.
However, at high saturation values (SR > 80), calcium carbonate scale is form
due to heterogeneous nucleation and adhesion. This is indicated at the left hand
section of Figure 7-3 and Figure 7-4. The scaling process is driven by mass
transport of nucleated crystals or agglomerated crystals in the bulk solution to the
surface of the capillary cell where they adhere and grow.
This process is influenced by the concentration of the scaling ions in the bulk
solution as a result, the surface charge density is affected by the ionic strength
of the scaling ions in the bulk solution. As such, at high concentration of scaling
ions (Ca2+, CO32-), the force of interaction between calcium carbonate scale
crystals and the surface of the capillary cell is increased [176].
A study by Sohnel and Mullin [59], suggested that, there is linear relationship
between log ts and (log SR)-2 at constant temperature for variety of substances,

134
however the linear relationship is within a defined range of saturation values. That
is, there is a level of supersaturation where two nucleation mechanism occurs
within the relationship as in the case of calcium carbonate scale (CaCO3), where
the plot of log ts versus (log SR)-2 is separated into two part, with each curve
having a gradient.
This two mechanisms were reported as homogeneous and heterogeneous
nucleation. In this work, the plot of log ts versus (log SR)-2 is separated into two
section with the left part is predominantly heterogeneous nucleation and
adhesion, while the right part is predominantly heterogeneous nucleation and
growth (crystallization process). This is in agreement with bulk analysis test
results obtained in chapter 5 of this work.
Similar trends occur for both temperatures (25oC and 70oC). This clearly show
that at constant temperature, there is a linear relationship between log ts and (log
SR)-2, which is in agreement with other studies [28, 58, 59, 179].
7.3.1 Determination of parameters that define nucleation theory
Prediction of calcium carbonate scale formation is often based on thermodynamic
prediction models. The bulk induction time is used as key parameters for scaling
tendency of inorganic scales.
However, there are studies [28, 58, 63, 180, 181], where emphasis is on bulk induction
time with respect to the saturation ratio in establishing a predictive models for
calcium carbonate scale deposition process.
Surface scaling is the main challenge affecting the integrity of facilities in oil and
gas and desalination industries. Understanding the mechanism of surface scaling
processes and determining the parameters that influence the deposition of
calcium carbonate scale on the surface of the facilities under flow conditions, can
give a reliable predictive models for surface scaling deposition processes.
The results obtained from the relationship between scaling time (ts) and
saturation ratio (SR) from chapter 6 was analysed and fitted into nucleation
theory equation, as such the parameters that describe the nucleation theory was
determined from crystallization process plot shown in Figure 7-5 and Figure 7-6
for 25oC and 70oC respectively.

135
Rearranging equation 7-1
logts = A + B × T−3(logSR)−2 7-3
The calculated parameters for nucleation theory and the interfacial energy at
different flow rates for 25oC and 70oC respectively are summarised in Table 7-1
and Table 7-2 respectively.
Figure 7-5: Relationship between log ts and (log SR)-2 at 25oC for heterogeneous nucleation (crystallization process)
y = 0.7141x + 2.1916
R² = 0.9942
y = 0.6733x + 1.8549
R² = 0.9947
y = 0.7918x + 1.3724
R² = 0.9992
0
0.5
1
1.5
2
2.5
3
3.5
4
0 0.5 1 1.5 2 2.5
log ts
(m
in)
(log SR)-2
5ml/min
10ml/min
15ml/min

136
Figure 7-6: Relationship between log ts and (log SR)-2 at 70oC for heterogeneous nucleation (crystallization process)
The interfacial energy values obtained for CaCO3 at 25oC range from 0.038 to
0.040 mJ/m2 compared to values between 25 to 83 mJ/m2 obtained from previous
studies [65, 69, 182, 183]. The difference in the interfacial energy values obtained could
be due to the differences in techniques used for this study, the experimental
conditions, the nature of crystals formed and heterogeneous nucleation process
taking place. However saturation ratio varies, as most studies focused on bulk
induction time from bulk scaling processes.
Spanos and Koutsoukos [182], reported in their study that very low interfacial
energy values is attributed to heterogeneous nucleation process, while high
interfacial energy relate to invalid hypothesis on data analysis. This hypothesis
was also supported by study [69]. They estimated the interfacial energy for
different calcium carbonate scale polymorphs, as each polymorphs have different
interfacial energy values due to their crystalline structures.
y = 0.494x + 1.9936
R² = 0.9908
y = 0.4909x + 1.721
R² = 0.9923
y = 0.5045x + 1.4542
R² = 0.9936
0
0.5
1
1.5
2
2.5
3
3.5
0 0.5 1 1.5 2 2.5
log ts
(m
in)
(log SR)-2
5ml/min
10ml/min
15ml/min

137
Table 7-1: Crystallization parameters based on nucleation theory values at 25oC
Flow rate
(ml/min)
A
B
𝜸 (mJ/m2)
R2
5 2.1916 1.89 × 10⁷ 0.0387 0.9942
10 1.8549 1.78 × 10⁷ 0.0380 0.9947
15 1.3724 2.1 × 10⁷ 0.0400 0.9992
Table 7-2: Crystallization parameters based on nucleation theory values at 70oC
Flow rate
(ml/min)
A
B
𝜸 (mJ/m2)
R2
5 1.9936 1.99 × 10⁷ 0.0453 0.9908
10 1.7210 1.98 × 10⁷ 0.0452 0.9947
15 1.4542 2.04 × 10⁷ 0.0456 0.9992
The empirical relationship between log (ts) and (log SR)-2 were established with
the values of constants A and B is determined from the intercepts and gradient
of Figure 7-5 and Figure 7-6.
For flow rate of 5ml/min at 25oC, log (𝑡𝑠 ) = 2.1916 + 1.8× 10⁷
𝑇3(𝑙𝑜𝑔𝑆𝑅)2
7-4
For flow rate of 5ml/min at 70oC , log (𝑡𝑠 ) = 1.9936 + 1.99× 10⁷
𝑇3(𝑙𝑜𝑔𝑆𝑅)2 7-5
The empirical relationship shown in equation 7-4 and 7-5 is a step towards
developing a semi empirical model for predicting surface scaling time of calcium
carbonate scale within the environmental conditions considered in this work.

138
Having a predictive model for both surface and bulk induction time under flow
condition and across a wide range of saturation ratios, could give more reliable
strategists for preventing or mitigating scale deposition and precipitation on the
surface of facilities. However, caution should be exercised when applying this
models to system of high turbulent regime, temperature and water salinity as the
empirical relationship may not be valid. These conditions may affects the
adherence of scale crystals.
7.4 Calcium carbonate (CaCO3) scale deposition growth kinetics
Calcium carbonate scale precipitation and deposition mechanism have been
studied over the years using different techniques such as quartz crystal
microbalance (QCM), rotary cylinder electrode (RCE), static bulk jar test, and
dynamic tube blocking rig etc.[108, 148, 171, 184-186].These studies were based on
determination of the growth kinetics through bulk analysis, gravimetric
measurement of weight gain and/or also in-situ measurement in the case of
QCM.
The QCM techniques is efficient at investigating the early stages of CaCO3
deposition on the surface of substrate, the static bulk jar test and dynamic tube
blocking rig is often used for ranking of inhibitors, while the rotary cylinder
electrode is used for CaCO3 scale study under flow conditions.
However, these techniques have some challenges with respect to understanding
the initial stage and later stages of calcium carbonate scale deposition growth
kinetics across a wide range of supersaturation values, temperature, pressures
and flow rates. It is therefore important to use a technique that can give a better
understanding of calcium carbonate scale growth kinetics. And also will that will
reflect the field conditions, for a more efficient and reliable method of estimating
growth rate.
This section of this work presents the analysed results and discussions of calcium
carbonate scale growth rate obtained at different experimental conditions. This is
one of the key aspect of this work and steps towards establishing an empirical
model for predicting calcium carbonate scale deposition growth rate across a
wide range of saturation ratios.

139
Recalling from chapter 3, Figure 3-12. Calcium carbonate scale deposition
growth rate (GR) were determined from the ratio of the amount of CaCO3 scale
measured by ICP-MS measurement (MC) to the difference in the deposition time
(t5Psi) and scaling time (ts) as shown in Figure 7-7 and equation 7-6.
Figure 7-7: Determination of CaCO3 scale growth rate
The amount of calcium carbonate scale (CaCO3) deposited were converted to
CaCO3 scale deposition thickness by assuming a uniform deposition of scale
crystal along the capillary cell and the crystal deposited as calcite, as previously
mention in chapter 3.
Scale deposition growth rate (𝐺𝑅) =scale deposition thickness (cm)
( T5Psi
−ts)
7-6

140
7.5 Calcium carbonate (CaCO3) scale deposition growth kinetics at 25oC
and 70oC
The average growth rate of calcium carbonate scale as a function of saturation
ratio at different flow rates is shown in Figure 7-8 to Figure 7-11 for 25oC and
70oC respectively. The average growth rate increase sharply with increased
saturation ratio for (SR <80) as expected for both temperatures [187]. For
saturation ratios (SR> 80), the average growth rates were not affected by
increased saturation ratio, rather forms a plateau which correspond to the
mechanism observed at high saturation ratios (SR>80) for the plot of log ts versus
(log SR)-2 shown in previous section of this work.
Figure 7-8: The average growth rate as a function of saturation ratio at 25oC

141
Figure 7-9: The average growth rate as a function of saturation ratio at 25oC
The plots shows clearly that two different scale deposition mechanism were
observed in the brine composition investigated. At saturation ratios (SR < 80),
the scale is form due to crystallization process as the formation of calcium
carbonate scale crystals is driven by the degree of the ionic strength and the
motion of scaling ions (Ca2+, CO32-) in the bulk solution. The deposition time
decrease with increased saturation ratio and flow rate, which invariably result to
increase in average growth rate observed.
The trend is different for saturation ratios (SR >80) as the scale mechanism is
predominantly adhesion of pre-precipitated crystals from the bulk solution. The
agglomerated crystals in the bulk solution are transported to the surface of the
capillary cell where they adhere and grow, which result to plugging of the capillary
cell bore, as such increasing the flow rate and the ionic strength or concentration
of the bulk solution, do not have significant effect on the average growth rate.
y = 2E-07x + 2E-07
R² = 0.9964
y = 4E-07x + 9E-07
R² = 0.9985
y = 7E-07x + 2E-06
R² = 0.9997
y = 8E-07x + 7E-06
R² = 0.9985
y = 9E-07x + 1E-05
R² = 0.9999
0
0.00001
0.00002
0.00003
0.00004
0.00005
0.00006
0.00007
0.00008
0.00009
0.0001
0 20 40 60 80 100
Avera
ge gro
wth
ra
te (cm
/se
c)
Saturation ratio SR
5ml/min
10ml/min
15ml/min
20ml/min
30ml/min

142
The average growth of calcium carbonate scale at 70oC, 5ml/min is (1.89 × 10⁻⁶
cm/sec or 0.6mm/year), much higher compared to the average growth rate of
calcium carbonate scale at 25oC, 5ml/min (6.87 × 10⁻⁷ cm/sec or 0.22mm/year)
for saturation ratio of 5 as expected. This is due to the effect of temperature on
the rate of precipitation and deposition of calcium carbonate scale. Similar trends
is observed in other conditions investigated.
Figure 7-10: The average growth rate as a function of saturation ratio at 70oC

143
Figure 7-11: The average growth rate as a function of saturation ratio at 70oC
The growth rate obtained from this work range from 6.87 × 10⁻⁷ cm/sec to
1.29 × 10⁻⁵ cm/sec for CaCO3 test conducted at 25oC. This is in close
agreement with the growth rate obtained by Tai et al [188] where crystal growth
rate of calcite was investigated as a function of ionic strength using a fluidized-
bed crystallizer. Tai’s study obtained growth trend between 4.2 × 10⁻⁷ cm/sec to
7.2 × 10⁻⁷ cm/sec for CaCO3 at 25oC. The study reported that the growth rate of
calcite is greatly influenced by the concentration of calcium ion, carbonate ion
and the fluid dynamics of the system. A linear relationship between the growth
rate of calcite and the saturation ratio was obtained. The crystal growth process
was said to be controlled by surface integration [188].
y = 9E-08x + 2E-06
R² = 0.997
y = 1E-07x + 2E-06
R² = 0.999
y = 1E-07x + 3E-06
R² = 0.9987
0
0.000002
0.000004
0.000006
0.000008
0.00001
0.000012
0.000014
0.000016
0 20 40 60 80 100
Avera
ge gro
wth
ra
te (cm
/se
c)
Saturation ratio SR
5ml/min
10ml/min
15ml/min

144
Growth rate values of 3 × 10⁻⁷ cm/sec to 9 × 10⁻⁷ cm/sec was also obtained by
Weijden et al [189] for CaCO3 at 25oC. The study reported that the growth rate of
calcium carbonate scale increased with ionic strength of bulk solution and that
linear growth rate of calcite is a function of the degree of the scaling ions (Ca2+
and CO32-) in the bulk solution.
Table 7-3, shows the comparison of calcium carbonate scale deposition growth
rate obtained from this work and other literatures values.
Table 7-3: Comparison of calcium carbonate scale deposition growth rate with literatures values
Techniques Study Sources Deposition
growth rate
(cm/sec)
Capillary flow rig CaCO3
at 25
oC
This study 6.87 × 10⁻⁷ to
1.29 × 10⁻⁵
Fluidized-bed crystallizer
CaCO3
at 25
oC
Tai et al[188]
4.2 × 10⁻⁷ to
7.2 × 10⁻⁷
Chemostat system
CaCO3
at 25
oC
Weijden et al[189]
3 × 10⁻⁷ to
9 × 10⁻⁷
The results obtained from their study is similar to what is observed from this work,
as the growth rate of calcium carbonate scale increase with increased saturation
ratio for (SR <80) and the average growth rate has a linear relationship with
saturation ratio for both temperatures and flow rates [6, 190].
The results obtained from this work, are highly reproducible as the coefficient of
determination (R2) for each of the conditions is approximately 1 as shown in Table
7-4 and Table 7-5 for 25oC and 70oC respectively.

145
The average growth rate of calcium carbonate scale deposited can be
determined as a function of saturation ratio from the linear equations shown in
Table 7-4 and Table 7-5. Where y denotes the average growth rate, x denotes
the saturation ratio. That is, at a particular flow rate and temperature, the average
growth rate of CaCO3 can be predicted as a function of saturation ratio.
The average growth rate of calcium carbonate scale increased in proportion to
the degree of supersaturation as expected, estimating the growth rate of calcium
carbonate scale within the experimental conditions from this work can give an
understanding of the growth kinetics mechanism and strategy of mitigating its
occurrence in the field.
However, having a single scale predictive empirical model which considered the
effect of flow rates into the existing empirical equations in Table 7-4 and Table 7-
5, can give more reliable prediction of average growth rate of calcium carbonate
scale as saturation ratio and flow rate are the main driving force for scale
deposition.
The next section of this work focused on the prediction of calcium carbonate
scale growth rate as a function of deposition flux (saturation ratio and flow rate)
at different temperature. Also the discussions of empirical models established in
relation to field conditions and literatures is presented.
Table 7-4: Fitted equation on the experimental data at different flow rates for 25oC
Flow rate
(ml/min)
Fitted equation Coefficient of
determination R2
5 𝑌 = 9 × 10⁻⁷𝑥 + 1 × 10⁻⁵ 0.9999
10 𝑌 = 8 × 10⁻⁷𝑥 + 7 × 10⁻⁶ 0.9985
15 𝑌 = 7 × 10⁻⁷𝑥 + 2 × 10⁻⁶ 0.9999
20 𝑌 = 4 × 10⁻⁷𝑥 + 9 × 10⁻⁷ 0.9985
30 𝑌 = 2 × 10⁻⁷𝑥 + 2 × 10⁻⁷ 0.9964

146
Table 7-5: Fitted equation on the experimental data at different flow rates for 70oC
Flow rate
(ml/min)
Fitted equation Coefficient of
determination R2
5 𝑌 = 1 × 10⁻⁷𝑥 + 3 × 10⁻⁶ 0.9987
10 𝑌 = 1 × 10⁻⁷𝑥 + 2 × 10⁻⁶ 0.999
15 𝑌 = 9 × 10⁻⁸𝑥 + 2 × 10⁻⁶ 0.997
7.6 Calcium carbonate scale deposition kinetics empirical model
Scale prevention is important in oil and gas industries to ensure optimum
production. Organic and inorganic scale precipitation and deposition have been
studied and different predictive models have been developed over many years
on scale precipitation process such as residence time, induction time, nucleation
and crystal growth.
These models have been mainly based on thermodynamics parameters.
However, little attention has be made on the effect of hydrodynamic parameters
on inorganic scale surface deposition kinetics. The use of a methodology that
will reflects the field scenario has been a challenge in most models.
To have a robust empirical model, both the thermodynamic parameters and
hydrodynamic parameters needs to be considered as this can give better
understanding of scale growth kinetics and also help in establishing a reliable
strategist for predicting the scaling rate of both organic and inorganic scales in
the field.
Researchers have often used pressure build up as method for assessing the
deposition of scales across a capillary tube, and based their prediction models
on the thickness of scales across the capillary tube due to the pressure build up
on the wall of the capillary [1].

147
Work by Wang et al [20, 21] and Lawal et al [22] as stated previously in chapter 3,
determined the thickness of asphaltene deposits across a long capillary tube as
a function of the pressure build up across the capillary tube during asphaltene
deposition, using Hagen Poiseuille flow equation shown in equation 7-7 and 7-8.
𝑄 = 𝜋𝐷4∆𝑃
128𝜇𝑙
7-7
(∆𝑃𝑇)𝑟4
𝜇𝑇 =
(∆𝑃𝑖)𝑅4
𝜇𝑖
7-8
Where 𝑄 denotes the flow velocity (m3/s), 𝐷 the internal diameter of the capillary
(m), ∆𝑃 the pressure drop along the capillary (Psi), 𝜇 the viscosity (NS/m2), 𝑙 the
length of the capillary (m), ∆𝑃𝑖 and ∆𝑃𝑡are initial pressure drop before deposition
and at time T, the pressure drop along the capillary, 𝜇𝑖 and 𝜇𝑇 are the original
viscosity of the brine and average viscosity at time T respectively, R and r are the
original capillary tube radius and effective radius after deposition respectively.
The scale deposition thickness was related to the initial radius of the tube and
1/4th of the power of the ratio of the initial pressure drop to the pressure drop with
time as shown in equation 7-9. Detailed derivation of equation 7-9 is shown in
chapter 3 of this work.
𝑡 = 𝑅 (1 − (∆𝑃𝑖
∆𝑃𝑇)
1/4
) 7-9
Nevertheless, equation 7-9 assumed a uniformly deposited scale along the
capillary tube, the optical microscopy image observations in chapter 6 showed
that calcium carbonate scale deposited on the surface of the capillary cell were
not uniform at different experimental conditions.
In this work, to ascertain the actual amount of deposit/scale present on the
capillary cell, scale deposited on the surface of the capillary was dissolved and
measured by ICP. This method gives a reliable results to use in a predictive
empirical model.
Calcium carbonate scale growth rate determined by ICP-MS measurement were
compared with the growth rate determined using Hagen Poiseuille flow equation

148
as shown previously in chapter 3, Figure 3-13 to Figure 3-15 for 25oC and 70oC
respectively, by calculating the actual differential pressure of the capillary rig at
different flow rates.
The growth rate determined by dissolving the scale and measured by ICP-MS
were much smaller compared to the growth rate determined from Hagen
Poiseuille flow prediction. This either due to non-uniformity of scale layer along
capillary cell or the capillary cell is plugged with scale at some point along the
capillary, resulting to plugged flow, which contradict the Hagen Poiseuille flow
assumption of uniform deposition and a constant flow rate.
This was in agreement with the work of Wang et al [20], where they compared the
amount of asphaltene deposited from pressure drop (Hagen Poiseuille flow
prediction) and the amount of asphaltene recovered from the capillary tube after
deposition test, using a capillary tube blocking rig. The amount of deposits were
recovered by displacement test, which involve the use of N2 gas at high pressure.
From their results, the scale thickness growth rate determined by amount of
deposits recovered after deposition test were small compared to the scale
thickness growth rate calculated from Hagen Poiseuille flow assumption. They
attributed this to the viscosity nature of asphaltene or the plugging of the capillary
tube [20]
The average deposition thickness growth rate determine from this study, the same order of magnitude as the one determine by Kurup et al [191] as
shown in
Table 7-6.
The deposition thickness growth rate of calcium carbonate scale from this work
were higher compared to the deposition thickness growth rate of asphaltene as
expected. This may be due to the solubility nature of calcium carbonate scale
and the viscosity nature of asphaltene. Similar trend occurs in all saturation ratio
and flow rates for both temperature of 25oC and 70oC respectively.
149
Table 7-6: Comparison of calcium carbonate scale deposit thickness growth rate and asphaltene deposit thickness growth rate
Scales Sources Deposit thickness growth rate (cm/sec)
CaCO3 SR5, 5ml/min, 25oC 6.9 × 10⁻⁷
Asphaltene
Kurup et al [191]
1.0 × 10⁻⁷
1.0 × 10⁻⁷
Hassi Messaoud [191] 2.0 × 10⁻⁷
Marrat [191] 2.5 × 10⁻⁷
7.7 The empirical relationship between deposition growth rate and
deposition flux
This study aimed at understanding the scale deposition kinetics mechanism and
using a robust empirical model to predict scale deposition growth rate under
hydrodynamic conditions and relating it to the influence of factors such as degree
of supersaturation, flow rate and temperature.
However, bringing this relationship into a mathematical equations or empirical
models can give understanding of predicting both organic and inorganic scales
deposition growth rate under flow conditions.
This empirical models, considered both thermodynamic parameters and flow
rates across a wide range of calcium carbonate scale saturation ratios, using a
robust technique that could be related to field scenarios.
The empirical model takes into account the challenges of dynamic tube blocking
rig, which is often used for inhibitor efficiency testing and the technique use a
long capillary tube between (1-2m) as the scaling surface. There is a high
tendency for the saturation ratio of the brine to change across the capillary tube
and also the homogeneity of the scale crystal layer is also of a major concerns
as the scale layer may not be uniform across the capillary tube.

150
Studies [1, 21, 22, 133] based their models on the data generated from pressure
measurement as a function of other parameters such as time, temperature,
solution chemistry etc. therefore, using this technique in generating data for
empirical models, may not give accurate prediction of both organic and inorganic
scales in the field.
In the empirical models established from this work, the short capillary cell and
ICP-MS technique used can give more accurate and reliable data for formulating
a empirical models as the residence time for the fluid to travel through the
capillary cell is very short and as such, the saturation ratio is assumed to be
constant across the capillary cell.
The data generated from the capillary rig is highly reproducible and reliable as
the coefficient of determination (R2) is approximately 1.
7.7.1 The empirical relationship between deposition growth rate and
deposition flux at 25oC and 70oC
Figure 7-12 shows the empirical relationship between the average growth rate of
calcium carbonate scale and deposition flux at 25oC and 70oC respectively. It is
observed that the trend of calcium carbonate scale growth rate as function of the
deposition flux is linear for both temperature with high coefficient of determination
of approximately 1.
The data generated from this work were analysed using other equation fittings
such as quadratic, polynomial, logarithm etc. These equation fittings gives
coefficient of determination (R2) of less than 0.8. The best fit of the data was
linear relationship.
It is observed from Figure 7-12 that calcium carbonate scale deposition growth
rate increase with increased deposition flux for 25oC and 70oC respectively as
expected. The concentration of the bulk solution increase the rate of precipitation
and deposition of calcium carbonate scale, which invariably increased the scaling
tendency or reaction affinity of the scaling ions (Ca2+, CO32-) in the bulk solution.
On the other hand, the motion or the collision of the scaling ions is driven by the
flow rate of the system, resulting to diffusion or mass transport of ionic species
to the surface of the capillary cell where they deposit and grow.

151
Figure 7-12: Scale deposition growth rate as a function of deposition flux at 25oC and 70oC
This is in agreement with the work of Hasson et al [80], which proposes two rate
determine steps of calcium carbonate scale deposition in pipe flow system.
Firstly, diffusion of the scaling ions in the bulk solution to CaCO3 scale and water
interface, followed by surface reaction of the ionic species. This is supported by
Berthoud [192]. The two processes are controlled by concentration gradient of the
scaling ions in the bulk solution.
The agglomeration of calcium carbonate scale crystals in the bulk solution
increase with respect to the level of the ionic concentration and degree of flow in
the capillary rig. This was clearly observed when deposition thickness growth rate
of calcium carbonate scale increase with increased deposition flux.
0
0.00001
0.00002
0.00003
0.00004
0.00005
0.00006
0.00007
0.00008
0.00009
0 0.5 1 1.5 2 2.5 3
Avera
ge gro
wth
ra
te (cm
/se
c)
SR*Q (L/sec)
25°C 70°C
y = 3E-05x + 3E-06
R² = 0.9745
y = 1E-05x + 3E-06
R² = 0.9501

152
It can be said that, two rate determining steps controlled the scaling process
within the brine composition investigated in this work, that is, mass transport of
ionic species to the surface of the capillary cell and surface reaction of the ionic
species. However, mass transport process is likely to dominate the nucleation
and growth process of CaCO3 crystals as a result of linear relationship between
the average growth rate and deposition flux observed in Figure 7-12.
Calcium carbonate scale thickness growth rate can be determined from the
empirical relationship in Figure 7-12 for 25oC and 70oC respectively. Where Y
denotes calcium carbonate scale thickness growth rate in cm/sec, x denotes the
deposition flux (L/sec), which is a function of saturation ratio and flow rate.
This empirical relationship is expected to be valid within the brine composition,
laminar flow regime and temperature investigated in this study.
However, caution should be exercised when applying this models to system of
high turbulent regime, temperature and water salinity as the empirical relationship
may not be valid. These conditions may affects the adherence of scale crystals.
7.8 Summary
This chapter presents the critical analysis, interpretation of the raw results from
the differential pressure versus time curve in relation to scaling time (ts). The
discussions in relation to calcium carbonate surface deposition mechanisms,
growth rate as a function of deposition flux and empirical models established from
this work were also presented.
The results obtained show that, the scaling time is dependent on the following
factors; degree of supersaturation, temperature and interfacial energy.
The interfacial energy values obtained from the capillary rig experiment is low
compared to what is obtained from other studies, which may be attributed to the
experimental condition used, the nature of the calcium carbonate crystals and
the techniques used in this work. However, other studies have also relate the low
interfacial energy values to heterogeneous nucleation process taking place as
most studies assumed homogeneous nucleation process.

153
The plot of log ts versus (log SR)-2 show that two scale kinetic mechanism occur
within the saturation ratios investigated, that is, at high saturation values (SR
>80), the scale mechanism is predominantly adhesion and heterogeneous
nucleation, while at saturation values (SR < 80), the scale mechanism is
predominantly crystallization process. This is in agreement with calcium
carbonate scale growth kinetics and the bulk precipitation studies.
The plot of log ts and (log SR)-2 for crystallization process show a linear
relationship. The constants that describe nucleation theory were determined from
the plot to establish an empirical predictive models for scaling time determination
at constant temperature, similar to induction time predictive model from studies
[58, 59], for bulk scaling processes at temperature of 25oC and 70oC respectively.
The average deposition thickness growth rate of calcium carbonate scale
increase with increased deposition flux for 25oC and 70oC respectively. That is,
CaCO3 scale deposition thickness growth rate is strongly influenced by the ionic
strength or degree of the supersaturation and flow rate.
There is linear relationship between the deposition thickness growth rate of
calcium carbonate scale and saturation ratio for SR < 80 as expected and the
coefficient of determination (R2) is approximately 1.
Empirical kinetic model have been developed from the data generated from this
work, which show a linear relationship between average deposition thickness
growth rate of CaCO3 scale and deposition flux for 25oC and 70oC respectively.
The empirical model can be used to predict the deposition thickness growth rate
of scales across a wide range of saturation ratios at specific temperature over a
period of time.
The empirical relationship between CaCO3 scale deposition thickness growth
rate and the deposition flux can give an understanding of the CaCO3 surface
deposition kinetics growth rate and how the growth rate is influenced by the
deposition flux and temperature. Also the scaling mechanism is likely to be
dominated by mass transport of the ionic species.

154
The deposition thickness growth rate of CaCO3 scale determined from this work
is in the same order of magnitude compared to the asphaltene deposit thickness
growth rate obtained from the work of Kurup et al [191].
155
CHAPTER 8. Conclusions
8.1 Conclusions
This chapter summarises the different findings arising from this work, which
focuses on developing the understanding of calcium carbonate scale deposition
on the surface of facilities and the kinetics of surface growth. This chapter is
divided into distinct sections. This include conclusions relating to factors
influencing the deposition and precipitation of CaCO3.Conclusions reached in
relation to CaCO3 surface deposition mechanisms, growth kinetics and empirical
models developed.
8.2 Factors influencing the formation and precipitation of CaCO3
This study has shown that flow rates, degree of supersaturation and temperature
has great influence on the CaCO3 scale deposition in terms of their induction
time, residence time, change in morphology, sizes and shapes of crystals,
thickness of scale and amount of scale deposited. The conclusion arising from
the effect of this factors on calcium carbonate scale deposition is divided into
each individual headings.
8.2.1 Effect of flow rate on CaCO3 scale deposition
The effect of flow rates on the deposition and precipitation of calcium
carbonate scale was significant. This was obvious in the deposition time
obtained from various conditions. The deposition time of calcium
carbonate scale was quite short for higher flow rates compared to low flow
rates. This was attributed to the motion of scaling ions in the bulk solution
which enhanced the reaction rate or the affinity for the scaling ions to react
or form clusters after induction.
The effect of flow rate to the adherence of calcium carbonate crystals to
the walls of the capillary cell was not significant as the flow rate was
increased. This was due to low shear stress associated with laminar flow
regime.

156
The morphology, sizes, shapes of calcium carbonate crystals changes
with flow rates as calcite crystals were prominent at low flow rates.
However, at high flow rates, calcite and aragonite were present at the
surface as observed in the scanning electron microscope (SEM) and X-
ray diffraction (XRD) results. CaCO3 scale crystals layer were not uniform
irrespective of the flow conditions.
It is demonstrated from this work that, flow rates are of paramount
important in calcium carbonate scale deposition kinetics studies and one
of the key driving force for crystallization.
8.2.2 Effect of saturation ratio on CaCO3 scale deposition
The level of supersaturation influences the deposition process of calcium
carbonate scale as shown from this work. The deposition time of calcium
carbonate scale increases at low concentration of scaling ions in the bulk
solution or saturation ratio. Also scaling time is inversely proportional to
the saturation ratio.
The influence of degree of supersaturation on calcium carbonate scale
crystals and morphology was not quite obvious compared to the impact of
flow rate. However the level of supersaturation was a key driving force for
precipitation and deposition of calcium carbonate as the nucleation
process was rapid at high saturation ratios and no induction time was
recorded at this level (SR > 80).
8.2.3 Effect of temperature on CaCO3 deposition
This work has demonstrated that temperature is one of the key driving
force for crystallization. The scaling tendency of calcium carbonate scale
increases with increase in temperature.
The influence of temperature on the precipitation and deposition of
calcium carbonate scale is due to the solubility of calcium carbonate scale

157
at high temperature, thus the solubility of CaCO3 decreases with increased
temperature.
The chemical potentials of the scaling ions (Ca2+ CO32-) in the bulk solution
increases with temperature, this influence the nucleation and growth rate
of CaCO3. Even at the same saturation ratio of 5, calcium carbonate
deposition rate was more rapid at 70oC compared to 25oC
8.3 CaCO3 surface deposition kinetics mechanism
The mechanisms occurring when scale build up in the capillary cell under
hydrodynamic conditions has be substantiated in relation to scaling time and
saturation ratio. The data generated from this work was fitted into classical
nucleation theory to establish an empirical relationship between scaling time and
saturation ratio at different temperatures and flow rates. The results obtained
were in agreement with other studies, who focus mainly on bulk scaling process.
Two scale deposition mechanism occur within the brine composition
investigated. First, at saturation ratio SR > 80, there is was no induction time
recorded. As such there was no crystals in bulk solution and the induction
time was less than the residence time. The mechanism of scale was
heterogeneous nucleation and adhesion.
At saturation ratio SR < 80, the induction times recorded showed that there
were no calcium carbonate crystals in the bulk solution as it flowed through
the capillary, the induction time is greater than the residence time. The scale
mechanism is heterogeneous nucleation or purely crystallization process.
The interfacial energy values obtained from the capillary rig experiment is
quite low compared to what is obtained from other studies, which may be
attributed to the experimental conditions used, the nature of the calcium
carbonate crystals and the techniques used in this work. However, other
studies have also related the low interfacial energy values to the
heterogeneous nucleation process taking place as most studies assumed
homogeneous nucleation process.
158
Empirical models have been established for predicting scaling time as a
function of saturation ratios, flow rate and temperature. These models will
helps in the understanding of calcium carbonate scale deposition in the field
within the laminar flow regime. The empirical models showed a linear
relationship between logarithm of scaling (log ts) and logarithm square of
saturation ratio (log SR)-2 for crystallization process.
8.3.1 CaCO3 scale growth kinetics
The use of Hagen Poiseuille flow assumption as means of estimating the
deposition thickness of scale from differential pressure measurement across a
long capillary tube may not give a reliable scale predictive models due to non-
uniformity of the scale layer along the capillary tube.
The use of short capillary cell and dissolving the scale deposited on the
surface of the capillary cell and measured the amount of scale by ICP-MS
gave more reliable scale deposition thickness rate and invariably good
predictive models.
The average deposition thickness growth rate of calcium carbonate scale
increased with increase in deposition flux. Calcium carbonate scale
deposition thickness growth rate is strongly influenced by the degree of
the supersaturation, flow rate and temperature.
Calcium carbonate deposition thickness growth shows a linear
relationship with the deposition flux at saturation ratios (SR < 80) with high
coefficient of determination (R2) approximately 1
An empirical kinetics models has been developed from the data generated
from this work, which shows a linear relationship between average
deposition thickness growth rate of calcium carbonate scale and
deposition flux for 25oC and 70oC respectively. The empirical model can
be used to predict the deposition thickness growth rate of scales across a
wide range of saturation ratios at specific temperature over a period of
time in the field.

159
The empirical relationship between calcium carbonate scale deposition
thickness growth rate and the deposition flux gives an understanding of
the calcium carbonate scale surface deposition kinetics growth rate and
how the growth rate is influence by the deposition flux and temperature.
The deposition thickness growth rate of calcium carbonate scale
determine from this work is in the same order of magnitude compared to
the Asphaltene deposit thickness growth rate obtained from the work of
Kurup et al [191] in their Asphaltene deposition study.
This work has a great impact in both the industry and academia, as most studies
focus on bulk scaling processes as the major challenge facing oil and gas and
desalination industries. Different predictive models based on thermodynamic
parameters have been developed.
Findings from this work have shown that understanding both the mechanism of
both bulk scaling and surface scaling processes and using a technique which
reflect the field scenario by considering the effect of hydrodynamics will give a
reliable strategy of mitigating scale formation in the field.
The empirical models developed from this work is expected to be valid at
saturation ratio less than 80 (SR < 80), within a temperature of 25oC and 70oC
and flow rates between 5ml/min to 30ml/min. The semi empirical models is a
framework for a more detailed models to be developed and it needs further
verifications and validations with respect to industrial applications. As such there
can be an improvement from average deposition growth rate to deposition growth
rate.

160
CHAPTER 9. Future work
The capillary flow rig used for this study, provided highly reproducible data and a
robust technique for studying scale precipitation and deposition process under
hydrodynamic conditions. The findings from this work have helped in the
understanding of mechanism of scale deposition at the surface of facilities and
development of a robust empirical models for predicting scale deposition growth
rate. This work has developed a detailed frame work of studying the kinetics of
inorganics scales under hydrodynamic conditions. Hence, the following
recommendation is suggested on how to build on this frame work.
9.1 Hydrodynamic and in-situ study
The capillary flow rig can be upgraded for turbulent flow regime as the scale
kinetics for turbulent flow regime may be different due to impact of shear stress
on the walls of the capillary cell and the flow regime may also have effect on the
residence and induction time of the flowing brine, which invariably might change
the kinetic mechanism
Developing a techniques where the scaling process can be observed inline or in-
situ by using a glass capillary cell and camera system and also inline turbidity
can be measured by using a turbidity probe for bulk precipitation study.
Designing a carbon steel (X65) capillary cell to understand how the corrosion
product (FeCO3) will affect the deposition of inorganic scales under different
experimental condition and also to have true reflection of pipe system been
deployed in the oil and gas industries and their crude oil transportation pipe lines.
9.2 Inhibitor efficiency study
Conventional inhibitors such as PPCA, PVS, and DETPMP at different dosage,
will enable the understanding of the mechanism of these inhibitors under
hydrodynamic conditions and their ranking in terms of minimum inhibitor
concentration (MIC). This will also help in the understanding and development of
a robust empirical models where the effect of inhibitors can be considered and
as such a scale mitigation strategies road map can be developed.

161
Introduction of green scale inhibitors to investigate its effectiveness on the early
stage of crystallization process as such the induction period can be determined
and surface analysis techniques can be used to observe the shape, sizes and
the polymorphs of the crystals formed on the surface of the capillary. The
efficiency of the green scale inhibitors will be compared with that of the
conventional scale inhibitors using the capillary flow rig
Developing experimental technique, where a complex inorganic brine will be
used to reflect the field scenarios of temperature, water chemistry etc. this will
help in the understanding of the scale mechanism and the data generated can
be correlated with the field data.

162
References
1. Zhang, Y. and Rod, F., Laboratory Determination of Calcium Carbonate
Scaling Rates for Oilfield Wellbore Environments, in International
Symposium on Oilfield Scale 2001, Society of Petroleum Engineers Inc.:
Aberdeen, United Kingdom.
2. Zahedzadeh, M., Karambeigi, M.S., Roayaei, E., Emadi, M.A., Radmehr,
M., Gholamianpour, H., Ashoori, S., and Shokrollahzadeh, S.,
Comprehensive management of mineral scale deposition in carbonate oil
fields – A case study. Chemical Engineering Research and Design, 2014.
92(11): p. 2264-2272.
3. Bezerra, M.C.M., Khalil, C.N., and Rosario, F.F., Barium and Strontium
Sulfate Scale Formation Due to Incompatible Water in the Namorado
Fields Campos Basin, Brazil, in SPE Latin America Petroleum Engineering
Conference1990, 1990: Rio de Janeiro, Brazil.
4. Jordan, M.M., Collins, I.R., and Mackay, E.J., Low Sulfate Seawater
Injection for Barium Sulfate Scale Control: A Life-of-Field Solution to a
Complex Challenge. SPE Production & Operations, 2008. 23(2): p. 192-
209.
5. Baraka-Lokmane, S. and Hurtevent, C., Chemical incompatibilities
between formation water and injection sea water; comparison between
modeling and site observations in fields operated by TOTAL, in Abu Dhabi
International Petroleum Conference and Exhibition2012, Society of
Petroleum Engineers: Abu Dhabi, UAE.
6. Garside, J., Gaska, C., and Mullin, J.W., Crystal growth rate studies with
potassium sulphate in a fluidized bed crystallizer. Journal of Crystal
growth, 1972. 13–14: p. 510-516.
7. Al Nasser, W.N. and Al Salhi, F.H., Kinetics determination of calcium
carbonate precipitation behavior by inline techniques. Powder
Technology, 2015. 270, Part B: p. 548-560.
8. Stalker, R., Graham, G.M., and Simpson, C., The Impact of Inorganic
Scale Deposits and Their Removal on General CO2 Corrosion Rates and
Corrosion Inhibitor Performance, in SPE International Symposium on

163
Oilfield Corrosion 2004, Society of Petroleum Engineers: Aberdeen,
United Kingdom.
9. Margrethe Nergaard, C.G., An Introduction to scaling, causes, problems
and solution. NTNU - Institutt for petroleumstekenologi og anvendt, 2010.
10. Bazin, B., Kohler, N., and Zaitoun, A., Some Insights Into the Tube
Blocking Test Method To Evaluate the Efficiency of Mineral Scale
Inhibitors, in SPE Annual Technical Conference and Exhibition 2005,
Society of Petroleum Engineers: Dallas, Texas.
11. Gill, J.S., Development of Scale Inhibitors, 1996, NACE International.
12. Duccini, Y., Dufour, A., Harm, W.M., Sanders, T.W., and Weinstein, B.,
High performance oilfield scale inhibitors, 1997, NACE International.
13. Hinrichsen, C.J., Preventing Scale Deposition in Oil Production Facilities:
An Industry Review, 1998, NACE International.
14. Ibrahim, J.M., Sorbie, K., and Boak, L.S., Coupled
Adsorption/Precipitation Experiments: 1. Static Results, 2012, Society of
Petroleum Engineers.
15. Graham, G.M., Boak, L.S., and Hobden, C.M., Examination of the Effect
of Generically Different Scale Inhibitor Species (PPCA and DETPMP) on
the Adherence and Growth of Barium Sulphate Scale on Metal Surfaces,
2001, Society of Petroleum Engineers.
16. Shaw, S.S., Sorbie, K., and Boak, L.S., The Effects of Barium Sulfate
Saturation Ratio, Calcium, and Magnesium on the Inhibition Efficiency:
Part II Polymeric Scale Inhibitors. 2012.
17. Shaw, S.S. and Sorbie, K.S., Synergistic Properties of Phosphonate and
Polymeric Scale Inhibitor Blends for Barium Sulphate Scale Inhibition,
NACE International.
18. Chen, T., Neville, A., Sorbie, K.S., and Zhong, Z., Using Synchrotron
Radiation Wide-Angle X-Ray Scattering (WAXS) To Study the Inhibition
Effect of DiEthyleneTriaminePenta (MethylenePhosphonic Acid)
(DETPMP) on CaCO3 Scale Formation, in SPE International Oilfield Scale
Symposium2006, Society of Petroleum Engineers: Aberdeen, UK.
19. Mavredaki, E., Neville, A., and Sorbie, K.S., Study of BaSO4 Formation
Kinetics and Inhibition Effect of Polyphosphino-Carboxylic Acid (PPCA) on
Barite Formation with Synchrotron X-Ray Diffraction (SXRD), in SPE

164
International Oilfield Scale Conference2008, Society of Petroleum
Engineers: Aberdeen, UK.
20. Jianxin Wang, J.S.B., And Jefferson L. Creek, Asphaltene Deposition on
Metallic Surfaces. Journal of Dispersion Science and Technology, 2004.
25: p. 287 - 298.
21. Buckley, J. and Wang, J., Estimate thickness of deposit layer from
displacement test. 2010.
22. Lawal, K.A., Crawshaw, J.P., S.Boek, E., and Vesovic, V., Experiemntal
investigation of asphaltene deposition in capillary flow. Energy & Fuels,
2012.
23. Al Nasser, W.N. and Al Salhi, F.H., Scaling and aggregation kinetics
determination of calcium carbonate using inline technique. Chemical
Engineering Science, 2013. 86: p. 70-77.
24. Al Nasser, W.N., Pitt, K., Hounslow, M.J., and Salman, A.D., Monitoring
of aggregation and scaling of calcium carbonate in the presence of
ultrasound irradiation using focused beam reflectance measurement.
Powder Technology, 2013. 238: p. 151-160.
25. Kohler, N., Courbin, G., and Ropital, F., Static and Dynamic Evaluation of
Calcium Carbonate Scale Formation and Inhibition, in SPE European
Formation Damage Conference2001, Society of Petroleum Engineers
Inc.: The Hague, Netherlands.
26. Frota, T.M.P., Silva, D.R., Aguiar, J.R., Anjos, R.B., and Silva, I.K.V.,
Assessment of scale formation in the column of an oil and natural gas
producing well: A case study. Brazillian Journal of petroleum and gas,
2013. 7(No 1 ).
27. Kan, A. and Tomson, M., Scale Prediction for Oil and Gas Production.
SPE Journal, 2012. 17(2): p. pp. 362-378.
28. Østvold, T. and Randhol, P., Kinetics of CaCO3 Scale Formation. The
Influence of Temperature, Supersaturation and Ionic Composition, in
International Symposium on Oilfield Scale 2001, Society of Petroleum
Engineers Inc.: Aberdeen, United Kingdom.
29. Mitrouli, S.T., Kostoglou, M., and Karabelas, A.J., Calcium carbonate
scaling of desalination membranes: Assessment of scaling parameters
165
from dead-end filtration experiments. Journal of Membrane Science,
2016. 510: p. 293-305.
30. Li, Z., Valladares Linares, R., Bucs, S., Aubry, C., Ghaffour, N.,
Vrouwenvelder, J.S., and Amy, G., Calcium carbonate scaling in seawater
desalination by ammonia–carbon dioxide forward osmosis: Mechanism
and implications. Journal of Membrane Science, 2015. 481: p. 36-43.
31. Al Omari, M.M.H., Rashid, I.S., Qinna, N.A., Jaber, A.M., and Badwan,
A.A., Chapter Two - Calcium Carbonate, in Profiles of Drug Substances,
Excipients and Related Methodology, G.B. Harry, Editor. 2016, Academic
Press. p. 31-132.
32. Kamari, A., Gharagheizi, F., Bahadori, A., and Mohammadi, A.H.,
Determination of the equilibrated calcium carbonate (calcite) scaling in
aqueous phase using a reliable approach. Journal of the Taiwan Institute
of Chemical Engineers, 2014. 45(4): p. 1307-1313.
33. Mahmoud, M. and Elgawad, K.A., Effect of CO2 Flooding During EOR
Process on the Rock Petrophysical and Electrical Properties, in North
Africa Technical Conference & Exhibition2013, Society of Petroleum
Engineers: InterContinental Citystar,Cairo, Egypt.
34. Kim, J.W., Xue, Z., and Matsuoka, T., Experimental Study on CO2
Monitoring and Saturation with Combined P-wave Velocity and Resistivity,
in International Oil and Gas Conference and Exhibition in China2010,
Society of Petroleum Engineers: Beijing, China.
35. Mcelhiney, J.E., Sydansk, R.D., Lintelmann, K.A., Benzel, W.M., and
Davidson, K.B., Determination of In-Situ Precipitation of Barium Sulphate
During Coreflooding, in International Symposium on Oilfield Scale2001,
Copyright 2001, Society of Petroleum Engineers Inc.: Aberdeen, United
Kingdom.
36. Michael, E.Q.P., An Introduction to the Chemistry of the Sea. 1998: p. 431.
37. Popescu, M.-A., Isopescu, R., Matei, C., Fagarasan, G., and Plesu, V.,
Thermal decomposition of calcium carbonate polymorphs precipitated in
the presence of ammonia and alkylamines. Advanced Powder
Technology, 2014. 25(2): p. 500-507.
38. Chen, H., Qing, C., Zheng, J., Liu, Y., and Wu, G., Synthesis of calcium
carbonate using extract components of croaker gill as morphology and

166
polymorph adjust control agent. Materials Science and Engineering: C,
2016. 63: p. 485-488.
39. Islam, K.N., Bakar, M.Z.B.A., Noordin, M.M., Hussein, M.Z.B., Rahman,
N.S.B.A., and Ali, M.E., Characterisation of calcium carbonate and its
polymorphs from cockle shells (Anadara granosa). Powder Technology,
2011. 213(1–3): p. 188-191.
40. Sarkar, A. and Mahapatra, S., Mechanism of unusual polymorphs
transformations in calcium carbonate: Dissolution-recrystallization vs
additive-mediated nucleation. Chemical Science, 2012. 124: p. 1399-
1404.
41. Amjad, Z. and Zuhl, R.W., Kinetic and Morphological Investigation on the
Precipitation of Calcium Carbonate in the Presence of Inhibitors, 2006,
NACE International.
42. Tong, H., Ma, W., Wang, L., Wan, P., Hu, J., and Cao, L., Control over the
crystal phase, shape, size and aggregation of calcium carbonate via a l-
aspartic acid inducing process. Biomaterials, 2004. 25(17): p. 3923-3929.
43. Crystalline structure of Calcite. Available from:
http://en.wikipedia.org/wiki/Calcite.
44. Brankling, D., Bayman, M., and Jenvey, N., Formation and Control of the
Vaterite Scale Polymorph of Calcium Carbonate in the Galley Field
Development, in International Symposium on Oilfield Scale2001,
Copyright 2001, Society of Petroleum Engineers Inc.: Aberdeen, United
Kingdom.
45. Nehrke, G., Calcite precipitation from aqueous solution: transformation
from vaterite and role of solution stoichiometry, 2007, Utrecht Universit. p.
27-40.
46. Johnston, C., Taylor, W., and Sutherland, L., The Influence of Turbulence
(or Hydrodynamic Effects) on Barium Sulphate Scale Formation and
Inhibitor Performance, in 2013 SPE International Symposium on Oilfield
Chemistry2013, 2013, Society of Petroleum Engineers: The Woodlands,
TX, USA.
47. Todd, A.C. and Yuan, M.D., Barium and Strontium Sulfate Solid-Solution
Scale Formation at Elevated Temperatures. SPE Production Engineering,
1992. 7(1): p. 85-92.

167
48. Alsaiari, H.A., Kan, A., and Tomson, M., Effect of Calcium and Iron (II)
Ions on the Precipitation of Calcium Carbonate and Ferrous Carbonate.
SPE Journal, 2010. 15(2): p. pp. 294-300.
49. Dugstad, A., Mechanism of Protective Film Formation During CO2
Corrosion of Carbon Steel, 1998, NACE International.
50. Tong, Y., Wang, Z., Yang, E., Pan, B., Jiang, J., Dang, L., and Wei, H.,
Determination and correlation of solubility and solution thermodynamics of
ethenzamide in different pure solvents. Fluid Phase Equilibria, 2016. 427:
p. 549-556.
51. Malwade, C.R. and Christensen, L.P., Simple multipurpose apparatus for
solubility measurement of solid solutes in liquids. Education for Chemical
Engineers, 2016. 16: p. 29-38.
52. Nancollas, G.H. and Reddy, M.M., The Kinetics of Crystallization of Scale-
Forming Minerals. Society of Petroleum Engineers Journal, 1974. 14(2):
p. 117-126.
53. Y.Duggirala, P., Formation of Calcium Carbonate Scale and Control
Strategies in Continuous Digeters. Pulp and Paper Research, Nalco
Company, 2007.
54. Dalas, E. and Koutsoukos, P.G., The effect of magnetic fields on calcium
carbonate scale formation. Journal of Crystal growth, 1989. 96(4): p. 802-
806.
55. Amjad, Z., Scale Inhibition in Desalination Applications: An Overview,
1996, NACE International.
56. Chen, T., Neville, A., Sorbie, K., and Zhong, Z., In-Situ Monitoring The
Inhibiting Effect Of Detpmp On Caco3 Scale Formation By Synchrotronx-
Ray Diffraction, 2007, NACE International.
57. Mullin, J.W., Crystallization, 2001, Butterworth-Heinemann.
58. Stamatakis, E., Stubos, A., Palyvos, J., Chatzichristos, C., and Muller, J.,
An improved predictive correlation for the induction time of CaCO3 scale
formation during flow in porous media. Journal of Colloid and Interface
Science, 2005: p. 7-13.
59. Söhnel, O. and Mullin, J.W., Interpretation of crystallization induction
periods. Journal of Colloid and Interface Science, 1988. 123(1): p. 43-50.

168
60. He, S., Kan, A.T., and Tomson, M.B., Mathematical Inhibitor Model for
Barium Sulfate Scale Control. Langmuir, 1996. 12(7): p. 1901-1905.
61. Mavredaki, E. and Neville, A., Prediction and evaluation of calcium
carbonate deposition at surfaces, 2014, Society of Petroleum Engineers.
62. Baraka-Lokmane, S., Charpentier, T.V.J., Hurtevent, C., Ordonez-Varela,
J.-R., Neville, A., Olsen, J.H., Bache, O., Eroini, V., Ellingsen, J.A., and
Moeller Nielsen, F., Evaluation of Anti-fouling Surfaces for Prevention of
Mineral Scaling in Sub-Surface Safety Valves, 2014, Society of Petroleum
Engineers.
63. Yoreo, J.J.D. and Vekilov, P.G., Principles of Crytsal Nucleation and
Growth, in Principle of Crystal Nucleation and Growth2003: Department of
Chemical and Biomolecular Engineering. p. 58-77.
64. Kügler, R.T., Beißert, K., and Kind, M., On heterogeneous nucleation
during the precipitation of barium sulfate. Chemical Engineering Research
and Design, 2016. 114: p. 30-38.
65. Söhnel, O. and Mullin, J.W., A method for the determination of
precipitation induction periods. Journal of Crystal growth, 1978. 44(4): p.
377-382.
66. Kashchiev, D., Chapter 11 - 11 Nucleation rate, in Nucleation. 2000,
Butterworth-Heinemann: Oxford. p. 174-177.
67. Crabtree, M., Eslinger, D., Fletcher, P., Miller, M., Johnson, A., and King,
G., Fighting Scale - Removal and prevention. Oilfield Review, 1999: p. 30-
45.
68. Ruckenstein, E., Berim, G.O., and Narsimhan, G., A novel approach to the
theory of homogeneous and heterogeneous nucleation. Advances in
Colloid and Interface Science, 2015. 215: p. 13-27.
69. Söhnel, O. and Mullin, J.W., Precipitation of calcium carbonate. Journal of
Crystal growth, 1982. 60(2): p. 239-250.
70. Baldan, A., Adhesion phenomena in bonded joints. International Journal
of Adhesion and Adhesives, 2012. 38: p. 95-116.
71. Garside, J. and Larson, M.A., Direct observation of secondary nuclei
production. Journal of Crystal growth, 1978. 43(6): p. 694-704.

169
72. Daudey, P.J., Van Rosmalen, G.M., and De Jong, E.J., Secondary
nucleation kinetcs of ammonium sulfate in a CMSMPR crystallizer. Journal
of Crystal growth, 1990. 99(1–4, Part 2): p. 1076-1081.
73. Verdurand, E., Bebon, C., Colson, D., Klein, J.P., Blandin, A.F., and
Bossoutrot, J.M., Secondary nucleation and growth of organic crystals in
industrial crystallization. Journal of Crystal growth, 2005. 275(1–2): p.
1363-1367.
74. Van Der Heijden, A.E.D.M., Van Der Eerden, J.P., and Van Rosmalen,
G.M., The secondary nucleation rate: a physical model. Chemical
Engineering Science, 1994. 49(18): p. 3103-3113.
75. Tai, C.Y., Wu, J.-F., and Rousseau, R.W., Interfacial supersaturation,
secondary nucleation, and crystal growth. Journal of Crystal growth, 1992.
116(3–4): p. 294-306.
76. Feigelson, R.S., 1 - Crystal Growth through the Ages: A Historical
Perspective A2 - Nishinaga, Tatau, in Handbook of Crystal Growth
(Second Edition). 2015, Elsevier: Boston. p. 1-83.
77. Zawala, J., Kosior, D., and Malysa, K., Formation and influence of the
dynamic adsorption layer on kinetics of the rising bubble collisions with
solution/gas and solution/solid interfaces. Advances in Colloid and
Interface Science, 2015. 222: p. 765-778.
78. Cizer, O., Van Balen, K., Elsen, J., and Van Gemert, D., Crystal
morphology of precipitated calcite crystals from accelerated carbonation
of lime binders. ACEME08, 2008: p. pp.149-158.
79. Sinha, A.P. and Parameswar, D., Mass Transport Principle and Operation,
2012, PHl Learning private limited: New Delhi. p. 513-514.
80. Hasson, D., Bramson, D., Limoni-Relis, B., and Semiat, R., Influence of
the flow system on the inhibitory action of CaCO3 scale prevention
additives. Desalination, 1997. 108(1–3): p. 67-79.
81. Johnson, K.L., Mechanics of adhesion. Tribology International, 1998.
31(8): p. 413-418.
82. Packham, D.E., Hand Book of Adhesion, S. Edition, Editor 2005, John
wiley & Son Ltd. p. 15-200.

170
83. Packham, D.E. and Johnston, C., Mechanical adhesion: were McBain and
Hopkins right? An empirical study. International Journal of Adhesion and
Adhesives, 1994. 14(2): p. 131-135.
84. Hidema, R., Toyoda, T., Suzuki, H., Komoda, Y., and Shibata, Y.,
Adhesive behavior of a calcium carbonate particle to solid walls having
different hydrophilic characteristics. International Journal of Heat and
Mass Transfer, 2016. 92: p. 603-609.
85. M.Arif Butt, A.C., Javaid Ahmad, Rafig Ahmad, Usman Majeed, I.H.Khan,
Theory of Adhesion its Practical Implications. Journal of Faculty of
Engineering & Technology, 2008: p. 21-45.
86. Collins, I.R., A New Model for Mineral Scale Adhesion, Society of
Petroleum Engineers.
87. Hermansson, M., The DLVO theory in microbial adhesion. Colloids and
Surfaces B: Biointerfaces, 1999. 14(1–4): p. 105-119.
88. Hoss, D.J., Knepper, R., Hotchkiss, P.J., Tappan, A.S., Boudouris, B.W.,
and Beaudoin, S.P., An evaluation of complementary approaches to
elucidate fundamental interfacial phenomena driving adhesion of
energetic materials. Journal of Colloid and Interface Science, 2016. 473:
p. 28-33.
89. Antony, A., Low, J.H., Gray, S., Childrss, A.E., Le-Clech, P., and Lesile,
G., Scale formation and control in high pressure membrane water
treatment systems: A review Membrane science, 2011: p. 1-16.
90. Gomez-Morales, J., Torrent-Burgues, J., and Rodrigues-Clemente, R.,
Nucleation of calcium carbonate at different initial pH conditions. Journal
of Crystal growth, 1996.
91. Andritsos, N. and Karabelas, A.J., Calcium carbonate scaling in a plate
heat exchanger in the presence of particles. International Journal of Heat
and Mass Transfer, 2003. 46(24): p. 4613-4627.
92. Macadam, J. and Parsons, S.A., Calcium carbonate scale formation and
control. Re/Views in Environmental Science & Bio/Technology, 2004. 3(2):
p. 159-169.
93. Troup, D.H. and Richardson, J.A., Scale nucleation on a heat transfer
surface and its prevention. Chemical Engineering communication 1978. 2:
p. 167-180.

171
94. Kitamura, M., Controlling factor of polymorphism in crystallization process.
Journal of Crystal growth, 2002. 237–239, Part 3: p. 2205-2214.
95. Han, Y.S., Hadiko, G., Fuji, M., and Takahashi, M., Factors affecting the
phase and morphology of CaCO3 prepared by a bubbling method. Journal
of the European Ceramic Society, 2006. 26(4–5): p. 843-847.
96. Feng, B., Yong, A.K., and An, H., Effect of various factors on the particle
size of calcium carbonate formed in a precipitation process. Materials
Science and Engineering: A, 2007. 445–446: p. 170-179.
97. Muryanto, S., Bayuseno, A.P., Ma’mun, H., Usamah, M., and Jotho,
Calcium Carbonate Scale Formation in Pipes: Effect of Flow Rates,
Temperature, and Malic Acid as Additives on the Mass and Morphology
of the Scale. Procedia Chemistry, 2014. 9: p. 69-76.
98. Dyer, S.J. and Graham, G.M., The effect of temperature and pressure on
oilfield scale formation. Journal of Petroleum Science and Engineering,
2002. 35(1–2): p. 95-107.
99. Wang, Z., Neville, A., and Meredith, A., How and Why Does Scale
Stick—Can the Surface Be Engineered To Decrease Scale Formation and
Adhesion?, in SPE International Symposium on Oilfield Scale2005,
Society of Petroleum Engineers: Aberdeen, United Kingdom.
100. Merdhah, A.B.B. and Yassin, A.a.M., Laboratory Study on Precipitation of
Barium Sulphate in Malaysia Sandstone Cores. The Open Petroleum
Engineering, 2009. 2: p. 1-11.
101. Chen, T., Sorbie, K.S., Neville, A., and Zhong, Z., Using Synchrotron
Radiation Wide Angle X Ray Scattering (WAXS) to Study the Inhibiting
Effect of Polyphosphonocarboxylic Acid (PPCA) on CaCO3 Scale
Formation, 2006, NACE International.
102. Beck, R., Seiersten, M., and Andreassen, J.P., The constant composition
method for crystallization of calcium carbonate at constant
supersaturation. Journal of Crystal growth, 2013. 380(0): p. 187-196.
103. Moghadasi, J., Jamialahmadi, M., Müller-Steinhagen, H., and Sharif, A.,
Scale Formation in Oil Reservoir and Production Equipment during Water
Injection (Kinetics of CaSO4 and CaCO3 Crystal Growth and Effect on
Formation Damage), in SPE European Formation Damage

172
Conference2003, Society of Petroleum Engineers: The Hague,
Netherlands.
104. Alsaiari, H.A., Kan, A.T., and Tomson, M.B., Molar Ratio of Ca2+ to Fe2+ in
the Supersaturated Solution of Iron Carbonate and Calcium Carbonate
and in the Precipitate: Relation and Interpretation, in SPE International
Symposium on Oilfield Chemistry2009, Society of Petroleum Engineers:
The Woodlands. Texas.
105. Hasson, D. and Cornel, A., Kinetics Of CaCO3 Precipitation In The
Presence Of Shmp, 2007, NACE International.
106. Zhu, G., Li, H., Li, S., Hou, X., Xu, D., Lin, R., and Tang, Q., Crystallization
behavior and kinetics of calcium carbonate in highly alkaline and
supersaturated system. Journal of Crystal growth, 2015. 428: p. 16-23.
107. Chen, T., Neville, A., Sorbie, K., and Zhong, Z., Following the formation of
CaCO3 scale formation by in-situ WAXS. Journal of Optoelectronics and
Advanced materials, 2007. 9(No. 5): p. 1250 - 1253.
108. Setta, F.-A., Neville, P.A., and Chen, H.J., A Surface Kinetic Scaling Model
For CaCO3 On a Stainless Steel Surface (316 L), 2012, NACE
International.
109. Amjad, Z. and Zuhl, R.W., Effect Of Heat Treatment On The Performance
Of Deposit Control Polymers As Calcium Carbonate Inhibitors, 2007,
NACE International.
110. Chaussemier, M., Pourmohtasham, E., Gelus, D., Pécoul, N., Perrot, H.,
Lédion, J., Cheap-Charpentier, H., and Horner, O., State of art of natural
inhibitors of calcium carbonate scaling. A review article. Desalination,
2015. 356: p. 47-55.
111. Bezerra, M.C.M., Rosario, F.F., and Rocha, A.A., Scale Prediction and
Remediation for Deep Water Fields, in International Symposium on Oilfield
Scale2003, Society of Petroleum Engineers Inc.: Aberdeen, United
Kingdom.
112. Shen, D., Shcolnik, D., Steiner, W.H., Horstmann, D.G., Taylor, G.N., and
Brown, M., Evaluation of Scale Inhibitors in Marcellus Waters Containing
High Levels of Dissolved Iron, in SPE International Symposium on Oilfield
Chemistry2011, Society of Petroleum Engineers: The Woodlands, Texas,
USA.

173
113. Benslimane, S., Perrot, H., Bennezar, R., and Bouhidel, K.-E.,
Thermodynamic study of Zn2 + inhibition properties and mechanism on
calcium carbonate precipitation by chemical and electrochemical
methods. Desalination, 2016. 398: p. 114-120.
114. Karabelas, A.J., Scale formation in tubular heat exchangers- research
priorities. Internation Journal of Thermal Sciences, 2002. 41: p. 682-692.
115. Chen, T., Yuan, M., and Neville, A., Influence of Mg2+ on the kinetics and
crystal morphology of CaCO3 scale formation on the metal surface and in
bulk solution, 2004, NACE International.
116. Nancollas, G.H. and Sawada, K., Formation of Scales of Calcium
Carbonate Polymorphs: The Influence of Magnesium Ion and Inhibitors.
Journal of Petroleum Technology, 1982. 34(3): p. 645-652.
117. Nancollas, G.H., Zachowicz, W., and Gerard, D., Calcium Carbonate
Scaling. A Kinetics And Surface Energy Approach, 2004, NACE
International.
118. Cheong, W.C., Neville, A., Gaskell, P., and Abbott, S., Using Nature to
Provide Solutions to Calcareous Scale Deposition, in SPE International
Oilfield Scale Conference 2008, Society of Petroleum Engineers:
Aberdeen, UK.
119. Eroini, V., Kapur, N., Neville, A., and Euvrard, M., Preventing Scale
Formation Using Modified Surfaces, 2011, NACE International.
120. Gunn, D.J., Effect of surface roughness on the nucleation and growth of
calcium sulphate on metal surfaces. Journal of Crystal growth, 1980.
50(2): p. 533-537.
121. Shipley, H.J., Kan, A.T., Fu, G., Shen, D., and Tomson, M.B., Effect of
Hydrate Inhibitors on Calcite, Sulfates, and Halite Scale Formation, in SPE
International Oilfield Scale Symposium2006, Society of Petroleum
Engineers: Aberdeen, UK.
122. Bahadori, A., Vuthaluru, H., and Ang, M., Predictive Tool for Estimation of
Potential Precipitation From an Equilibrated Calcium Carbonate Aqueous
Phase, in Trinidad and Tobago Energy Resources Conference2010,
Society of Petroleum Engineers: Port of Spain, Trinidad.
123. Eseosa, A. and Atubokiki, A.J., Prediction and Monitoring of Oilfield
Carbonate Scales Using Scale Check, in Nigeria Annual International

174
Conference and Exhibition2011, Society of Petroleum Engineers: Abuja,
Nigeria.
124. Langelier, W.F., Chemical Equilibrium in water. AMJ Water Works
Association, 1946. 38: p. 169 -178.
125. Stiff Jr, H.A. and Davis, L.E., A Method for predicting the Tendency of
Oilfield Water to Deposit Calcium Carbonate. Petroleum Transactions,
AIME, 1952. 195: p. 213-216.
126. Stiff Jr, H.A. and Davis, L.E., A method for predicting the tendency of oil
field waters to deposit calcium sulfate. 1952(195): p. 25-28.
127. Vetter, O.J.G., How Barium Sulfate Is Formed: An Interpretation. Journal
of Petroleum Technology, 1975. 27(12): p. 1515-1524.
128. Carageorgos, T., Marotti, M., and Bedrikovetsky, P., A New Laboratory
Method for Evaluation of Sulphate Scaling Parameters From Pressure
Measurements. SPE Reservoir Evaluation & Engineering, 2010. 13(3): p.
pp. 438-448.
129. Shuler, P.J., Burton, L., Chen, H.-J., and Daniels, E.J., Modeling of Scale
Deposition in Gas Wells with Very Saline Produced Water, 2000, NACE
International.
130. Wright, R.J. and Hall, J.R.F., Scale Prediction, Measurement, and Control
in a Subsea Satellite Field, in European Production Operations
Conference and Exhibition1994, Society of Petroleum Engineers, Inc.:
Aberdeen, United Kingdom.
131. Mazzolini, E.I., Bertero, L., and Truefitt, C.S., Scale Prediction and
Laboratory Evaluation of BaSO4 Scale Inhibitors for Seawater Flood in a
High-Barium Environment. SPE Production Engineering, 1992. 7(2): p.
186-192.
132. Akbarzadeh, K., Eskin, D., Ratulowski, J., and Taylor, S.D., Asphaltene
Deposition Measurement and Modeling for Flow Assurance of Subsea
Tubings and Pipelines, in OTC Brasil2011: Rio de Janeiro, Brazil.
133. Kurup, A.S., Buckley, J.S., Wang, J., Subramani, H.J., Creek, J.L., and
Chapman, W.G., Asphaltene Deposition Tool: Field Case Application
Protocol, in Offshore Technology Conference2012: Houston, Texas, USA.
175
134. Creek, J.L., Wang, J., and Buckley, J.S., Verification of Asphaltene-
Instability-Trend (ASIST) Predictions for Low-Molecular-Weight Alkanes.
SPE Production & Operations, 2009. 24(2): p. pp. 360-368.
135. Hsu, J.J.C. and Brubaker, J.P., Wax Deposition Measurement and Scale-
Up Modeling for Waxy Live Crudes under Turbulent Flow Conditions, in
International Meeting on Petroleum Engineering1995, 1995 Copyright
1995, Society of Petroleum Engineers, Inc.: Beijing, China.
136. Hsu, J.J.C., Santamaria, M.M., and Brubaker, J.P., Wax Deposition of
Waxy Live Crudes Under Turbulent Flow Conditions, in SPE Annual
Technical Conference and Exhibition1994, Society of Petroleum
Engineers: New Orleans, Louisiana.
137. Bird, R.B., Stewart, W.E., and Lightfoot, E.N., Transport Phenomena,
2007.
138. Nakayama, Y. and Boucher, R.F., Introduction to fluid mechanics.
Bulterworth Heineman, 1999.
139. Halvorsen, E.N., Halvorsen, A.M.K., Andersen, T.R., Reiersolmoen, K.,
and Biornstad, C., New Method for Scale Inhibitor Testing, in SPE
International Symposium on Oilfield Chemistry2009, Society of Petroleum
Engineers: The Woodlands. Texas.
140. Graham, G.M., Williams, H.L., Wat, R., Tau, L.A., and Wennberg, K.E.,
Design and Application of a Novel HT/HP “ Stirred Reactor” Test Rig to
Study Scale Formation and Control, in SPE International Symposium on
Oilfield Chemistry2005, Society of Petroleum Engineers Inc.: The
Woodlands, Texas.
141. Johnson, J.D., Schoppa, D., Garza, J.L., Zamora, F., Kakadjian, S., and
Fitzgerald, E., Enhancing Gas and Oil Production With Zeta Potential
Altering System, in SPE International Symposium and Exhibiton on
Formation Damage Control2010, Society of Petroleum Engineers:
Lafayette, Louisiana, USA.
142. Lopez, T.H., Yuan, M., Williamson, D.A., and Przybylinski, J.L.,
Comparing Efficacy of Scale Inhibitors for Inhibition of Zinc Sulfide and
Lead Sulfide Scales, in SPE International Symposium on Oilfield
Scale2005, Society of Petroleum Engineers: Aberdeen, United Kingdom.

176
143. Liu, X., Chen, T., Chen, P., Montgomerie, H., Hagen, T.H., Wang, B., and
Yang, X., Understanding Mechanisms of Scale inhibition Using Newly
Developed Test Method and Developing Synergistic Combined Scale
Inhibitors, in SPE International Conference on Oilfield Scale2012, Society
of Petroleum Engineers: Aberdeen, UK.
144. Graham, G.M., Stalker, R., and Mcintosh, R., The Impact of Dissolved Iron
on the Performance of Scale Inhibitors Under Carbonate Scaling
Conditions, in International Symposium on Oilfield Chemistry2003,
Society of Petroleum Engineers: Houston, Texas.
145. Graham, G.M. and Mcmahon, C.P., The Effect of Scale Inhibitor
Performance Against Bulk (Homogeneous) and Surface (Heterogeneous)
Scale Nucleation and Growth by the Addition of Film Forming Corrosion
Inhibitors, 2002, NACE International.
146. Liu, Y., Kan, A., Zhang, Z., Yan, C., Yan, F., Zhang, F., Bhandari, N., Dai,
Z., Ruan, G., Wang, L., Greenberg, J., and Tomson, M., An assay method
to determine mineral scale inhibitor efficiency in produced water. Journal
of Petroleum Science and Engineering, 2016. 143: p. 103-112.
147. Al-Roomi, Y.M., Hussain, K.F., and Al-Rifaie, M., Performance of inhibitors
on CaCO3 scale deposition in stainless steel & copper pipe surface.
Desalination, 2015. 375: p. 138-148.
148. Zidovec, D., Dynamic Method to Measure Calcium Carbonate Scaling,
NACE International.
149. Anand, K.D., Fully Developed pipe and Channel flows. 2006: p. 5-9.
150. Kestin, J., Sokolov, M., and A.Wakeham, W., Viscosity of Liquid water in
Range -8oC to 150oC. J.Phys. Chem, 1978. 7(3).
151. Boyer, H.E. and Gall, T.L., Metals hand Book D.E. Ed, Editor 1997, ASM
Intl.
152. Tomson, "Accomplishments," Rice University Brine Chemistry
Consortium. 2006.
153. Tomson, M.B. and Kan, T.A., ScaleSoftPitzer Version 4.0, 2009, Rice
University Brine Chemistry Consortium.
154. Lewis, G.N. and Randall, M., Thermodynamics, D.N. Hume, King, E.L.,
Pople, J.A., Stork, G., and Williams, H.H., Editors. 1961, Mc Graw-Hill
Book Company, INC: New York, Toronto, London. p. 242 - 332.
177
155. Wolf, R.E. What is Inductively Coupled Plasma Mass Spectrometer March
2005.
156. Oceaniques-Umr6538, L.D. ULTIMA Horiba Jobin YVON. Available from:
http://www-iuem.univ-brest.fr/ldo/fr/Equipements/geochimie/ultima-2.
157. Lawler, D.M., Turbidity, Turbidimetry, and Nephelometry, in Reference
Module in Chemistry, Molecular Sciences and Chemical Engineering.
2016, Elsevier.
158. Hach, DR/890Portable Colorimeter in HACH website.
159. Gmbh, C.Z.M. Zeiss Microscopy EVO MA15. Available from:
http://www.zeiss.com/microscopy/en_de/home.html.
160. Alytical, P., Philip Pan Alytical X'PRO MPD, in Images for philips pan
analytical x'pert.
161. Skoog, D.A., Holler, F.J., and Crouch, S.R., Principle of Instrumental
Analysis, T. Brooks/Cole, Editor 2007.
162. Gmbh, L.M.I., Leica Dm for materials sciences 2012.
163. Chen, T., Neville, A., and Yuan, M., Assessing the effect of Mg2+ on
CaCO3 Scale formation-bulk precipitation and surface deposition. Joural
of crystal growth, 2004. 275(2005).
164. Pytkowicz, R.M., Rates of Inorganic Calcium Carbonate Nucleation. The
Journal of Geology, 1965. 73(1): p. 196-199.
165. Waly, T., Kennedy, M.D., Witkamp, G.-J., Amy, G., and Schippers, J.C.,
The role of inorganic ions in the calcium carbonate scaling of seawater
reverse osmosis systems. Desalination, 2012. 284: p. 279-287.
166. Chen, C.Y.T.a.P.-C., Nucleation, Agglomeration and Crystal Morphology
of Calcium Carbonate. AIChE journal, 1995. 14.
167. Al-Hamzah, A.A., East, C.P., Doherty, W.O.S., and Fellows, C.M.,
Inhibition of homogenous formation of calcium carbonate by poly (acrylic
acid). The effect of molar mass and end-group functionality. Desalination,
2014. 338(0): p. 93-105.
168. Song, K., Kim, W., Bang, J.-H., Park, S., and Jeon, C.W., Polymorphs of
pure calcium carbonate prepared by the mineral carbonation of flue gas
desulfurization gypsum. Materials & Design, 2015. 83: p. 308-313.

178
169. Jung, W.M., Kang, S.H., Kim, W.-S., and Choi, C.K., Particle morphology
of calcium carbonate precipitated by gas–liquid reaction in a Couette–
Taylor reactor. Chemical Engineering Science, 2000. 55(4): p. 733-747.
170. Morteza Saffari, M.a.a.A., Ph.D., Nucleation Kinetics of Calcium
Carbonate in Gas Field Brine Containing Methanol. The Pacific Journal of
Science and Technology, 2011. 12(2): p. 348.
171. Chen, T., Neville, A., and Yuan, M., Calcium carbonate scale formation—
assessing the initial stages of precipitation and deposition. Journal of
Petroleum Science and Engineering, 2005. 46(3): p. 185-194.
172. Chen, J. and Xiang, L., Controllable synthesis of calcium carbonate
polymorphs at different temperatures. Powder Technology, 2009. 189(1):
p. 64-69.
173. Tolaieb, B., Bingham, R., and Neville, A., Barium Sulfate Kinetics on Steel
Surfaces at Different Supersaturation Ratios, NACE International.
174. Pedrosa, J., Gamelas, J.a.F., Lourenço, A.F., and Ferreira, P.J., Surface
properties of calcium carbonate modified with silica by sol-gel method.
Colloids and Surfaces A: Physicochemical and Engineering Aspects,
2016. 497: p. 1-7.
175. Cheong, W.C., Gaskell, P.H., and Neville, A., Substrate effect on surface
adhesion/crystallisation of calcium carbonate. Journal of Crystal growth,
2013. 363: p. 7-21.
176. Holysz, L., Chibowski, E., Wójcik, W., Busch, K.W., and Busch, M.A.,
Parameters determining the deposition of calcium carbonate into a glass
capillary. Journal of Adhesion Science and Technology, 1994. 8(2): p.
181-193.
177. Wang, H., Alfredsson, V., Tropsch, J., Ettl, R., and Nylander, T., Formation
of CaCO3 Deposits on Hard Surfaces—Effect of Bulk Solution Conditions
and Surface Properties. ACS Applied Materials & Interfaces, 2013. 5(10):
p. 4035-4045.
178. Israelachvili, J.N., Intermolecular and Surface Forces, 1985: Academic
Press, London.
179. Chien, W.-C., Lee, C.-C., and Tai, C.Y., Heterogeneous Nucleation Rate
of Calcium Carbonate Derived from Induction Period. Industrial &
Engineering Chemistry Research, 2007. 46(20): p. 6435-6441.
179
180. Bedrikovetsky, P., Mackay, E.J., Moraes, G.P., Rosario, F.F., and
Monteiro, R.P., Laboratory and Field Prediction of Sulfate Scaling
Damage, in SPE International Oilfield Scale Symposium2006, Society of
Petroleum Engineers: Aberdeen, UK.
181. Haarberg, T., Selm, I., Granbakken, D.B., Østvold, T., Read, P., and
Schmidt, T., Scale Formation in Reservoir and Production Equipment
During Oil Recovery: An Equilibrium Model. SPE Production Engineering,
1992. 7(1): p. 75-84.
182. Spanos, N. and Koutsoukos, P.G., Kinetics of Precipitation of Calcium
Carbonate in Alkaline pH at Constant Supersaturation. Spontaneous and
Seeded Growth. The Journal of Physical Chemistry B, 1998. 102(34): p.
6679-6684.
183. Lioliou, M.G., Paraskeva, C.A., Koutsoukos, P.G., and Payatakes, A.C.,
Heterogeneous nucleation and growth of calcium carbonate on calcite and
quartz. Journal of Colloid and Interface Science, 2007. 308(2): p. 421-428.
184. Zhang, Y. and Farquhar, R., Laboratory Determination of Calcium
Carbonate Scaling Rates for Oilfield Wellbore Environments, in
International Symposium on Oilfield Scale2001, Society of Petroleum
Engineers Inc.: Aberdeen, United Kingdom.
185. Quddus, A. and Al-Hadhrami, L.M., Hydrodynamically deposited CaCO3
and CaSO4 scales. Desalination, 2009. 246(1–3): p. 526-533.
186. Quddus, A. and Allam, I.M., BaSO4 scale deposition on stainless steel.
Desalination, 2000. 127(3): p. 219-224.
187. Chen, P.-C., Tai, C.Y., and Lee, K.C., Morphology and growth rate of
calcium carbonate crystals in a gas-liquid-solid reactive crystallizer.
Chemical Engineering Science, 1997. 52(21–22): p. 4171-4177.
188. Clifford Y.Tai, J.-H.L., And Jyh-Kau Wu, Crystal Growth Rate of Calcite in
a Constant-Composition Environment. J.Chin. inst. Chem Engrs, 2005.
36: p. 443-450.
189. Van Der Weijden, R.D., Van Der Heijden, A.E., Witkamp, G.J., and Van
Rosmalen, G.M., The influence of total calcium and total carbonate on the
growth rate of calcite. Journal of Crystal growth, 1997. 171(1): p. 190-196.
190. Nancollas, G.H., Kinetics of crystal growth from solution. Journal of Crystal
growth, 1968. 3: p. 335-339.

180
191. Kurup, A.S., Wang, J., Subramani, H.J., Buckley, J., Creek, J.L., and
Chapman, W.G., Revisiting Asphaltene Deposition Tool (ADEPT): Field
Application. Energy & Fuels, 2012. 26(9): p. 5702-5710.
192. Berthoud, A., Theorie de la formation des faces d' un crystal. Journal de
Chimique Physique, 1912. 10: p. 624-635.

181
Appendix A: The effect of saturation ratio on calcium carbonate
scale deposition
Figure 9-1: Differential pressure as a function time for 25oC and 5ml/min at different saturation ratio

182
Figure 9-2: Differential pressure as a function time for 25oC and 10ml/min at different saturation ratio
Figure 9-3: Differential pressure as a function time for 25oC and 15ml/min at different saturation ratio

183
Figure 9-4: Differential pressure as a function of time for 25oC and 20ml/min at different saturation ratio
Figure 9-5: Differential pressure as a function time for 25oC and 30ml/min at different saturation ratio
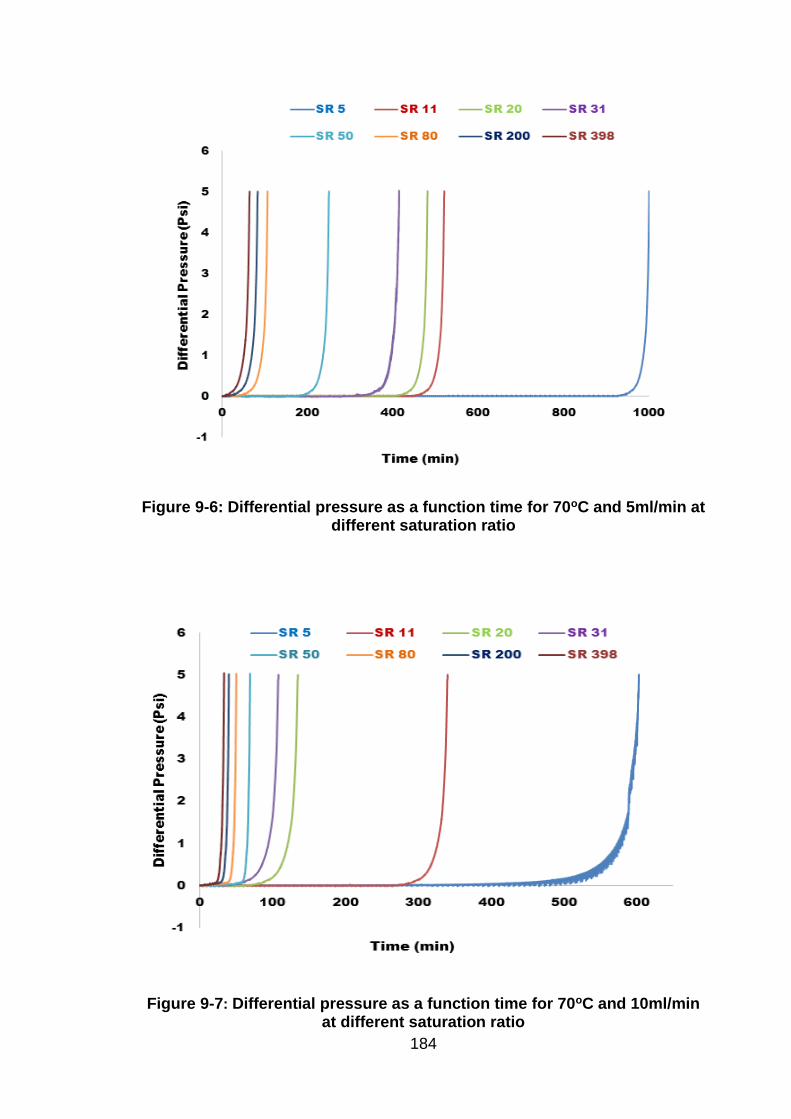
184
Figure 9-6: Differential pressure as a function time for 70oC and 5ml/min at different saturation ratio
Figure 9-7: Differential pressure as a function time for 70oC and 10ml/min at different saturation ratio

185
Figure 9-8: Differential pressure as a function time for 70oC and 15ml/min at different saturation ratio

186
Appendix B: The effect of temperature on calcium carbonate
scale deposition
Figure 9-9: Differential pressure as a function of time for saturation ratio 5 at 10ml/min
Figure 9-10: Differential pressure as a function of time for saturation ratio 11 at 10ml/min

187
Figure 9-11: Differential pressure as a function of time for saturation ratio 20 at 10ml/min

188
Figure 9-12: Differential pressure as a function of time for saturation ratio 31 at 10ml/min
Figure 9-13: Differential pressure as a function of time for saturation ratio 50 at 10ml/min

189
Figure 9-14: Differential pressure as a function of time for saturation ratio 80 at 10ml/min
Figure 9-15: Differential pressure as a function of time for saturation ratio 200 at 10ml/min

190
Figure 9-16: Differential pressure as a function of time for saturation ratio 398 at 10ml/min

191
Appendix C: Calcium carbonate scale thickness growth rate
from Hagen Poiseuille and ICP
Figure 9-17: Scale deposition growth rate as a function of saturation ratio at 10ml/min and 25oC
0
0.00005
0.0001
0.00015
0.0002
0.00025
0.0003
0.00035
5 11 20 31 50 80
Scale deposition gro
wth
ra
te (cm
/se
c)
HP
ICP

192
Figure 9-18: Scale deposition growth rate as a function of saturation ratio at 15ml/min and 25oC
Figure 9-19 : Scale deposition growth rate as a function of saturation ratio at 10ml/min and 70oC
0
0.0001
0.0002
0.0003
0.0004
0.0005
0.0006
5 11 20 31 50 80
Scale deposition gro
wth
ra
te (cm
/se
c)
HP
ICP
0
0.00001
0.00002
0.00003
0.00004
0.00005
0.00006
5 11 20 31 50 80
Scale deposition gro
wth
ra
te (cm
/se
c)
Saturation ratio SR
HP
ICP

193
Figure 9-20: Scale deposition growth rate as a function of saturation ratio at 15ml/min and 70oC
0
0.00001
0.00002
0.00003
0.00004
0.00005
0.00006
0.00007
5 11 20 31 50 80
Scale deposition gro
wth
ra
te (cm
/se
c)
Saturation ratio SR
HP
ICP

194
Appendix D: Empirical relationship between average growth
rate and deposition flux at different temperature
Figure 9-21: The average growth rate as a function of deposition flux at 25oC

195
Figure 9-22: The average growth rate as a function of deposition flux at 70oC


![Filler and Coating Pigments for Papermakers€¦ · includes SC, MFC, WFU, and WFC) are calcium carbonate (pre-cipitated calcium carbonate [PCC] and ground calcium carbonate [GCC]),](https://static.fdocuments.us/doc/165x107/5eae9d439cc5d419877523e0/filler-and-coating-pigments-for-papermakers-includes-sc-mfc-wfu-and-wfc-are.jpg)