Calamos Phineus Long/Short Fund (CPLIX) Q3 2021 Quarterly ...
16
Calamos Phineus Long/Short Fund (CPLIX) Q3 2021 Quarterly Commentary Michael Grant, Co-Chief Investment Officer, Senior Co-Portfolio Manager Unfinished Business The Calamos Phineus Long/Short Fund (CPLIX) advanced a modest 0.57% in Q3 (I shares at NAV), in line with the flattish 0.2% and -1.2% returns for the S&P 500 and MSCI World ex US Indices, respectively. This reflected the fund’s pro-cyclical tilt amidst a bifurcation of returns across investment styles. On a year-to-date basis, the fund has risen by 11.85% with an average net equity exposure of 56.6%. The past quarter was dominated by conflicting narratives at the macro level. Peaking leading indicators of activity and declining U.S. Treasury yields implied a moderating economic cycle and prompted a defensive mood. On the other hand, industrial production is accelerating and should remain robust well into 2022. These crosscurrents reflect the unusual features of this cycle versus past precedents. The summer rotation in favor of defensive and quality styles and the decline in U.S. bond yields highlight investors’ conviction that the stagnation of the past decade will persist. In contrast, we believe it is far too early to be positioning portfolios for “late-cycle.” And the fund’s positioning is anti-correlated to this consensus, partly because markets are already priced as if this outcome is certain and partly because the post-2008 era is unlikely to be a prologue for what comes next. NOT FDIC INSURED | MAY LOSE VALUE | NO BANK GUARANTEE OCTOBER 2021 EQUITY MARKET PERFORMANCE 3Q 2021 YTD S&P 500 0.2% 14.7% S&P 500 Equal Weight -0.3% 18.5% MSCI World ex US -1.2% 7.1% NASDAQ Composite -0.4% 12.1% Russell 2000 -4.6% 11.6% MSCI Emerging Markets -8.8% -3.0% MSCI Europe -2.0% 7.9% UK (FTSE 100) -1.8% 8.2% Germany (DAX) -4.0% 4.7% France (CAC 40) -2.2% 11.2% Australia (ASX) -3.5% 4.4% Italy (FTSE MIB) -0.1% 8.8% China (Shanghai Stock Exchange) -0.5% 4.1% Hong Kong (Hang Seng) -15.0% -10.1% Mexico (IPC) -1.0% 12.9% India (SENSEX) 12.8% 21.8% Brazil (Bovespa) -19.7% -11.7% Data through 9/30/2021 Note: Returns are price only in USD. Past performance is no guarantee of future results. Source: Bloomberg. Indexes are unmanaged, do not include fees or expenses and are not available for direct investment. Please see “Index Definitions” for additional information. Portfolios are managed according to their respective strategies which may differ significantly in terms of security holdings, industry weightings and asset allocation from those of the benchmark(s). Portfolio performance, characteristics and volatility may differ from the benchmark(s) shown.
Transcript of Calamos Phineus Long/Short Fund (CPLIX) Q3 2021 Quarterly ...

Calamos Phineus Long/Short Fund (CPLIX)Q3 2021 Quarterly CommentaryMichael Grant, Co-Chief Investment Officer, Senior Co-Portfolio Manager
Unfinished BusinessThe Calamos Phineus Long/Short Fund (CPLIX) advanced a modest 0.57% in Q3 (I shares at NAV), in line with the
flattish 0.2% and -1.2% returns for the S&P 500 and MSCI World ex US Indices, respectively. This reflected the fund’s
pro-cyclical tilt amidst a bifurcation of returns across investment styles. On a year-to-date basis, the fund has risen by
11.85% with an average net equity exposure of 56.6%.
The past quarter was dominated by conflicting
narratives at the macro level. Peaking leading
indicators of activity and declining U.S. Treasury
yields implied a moderating economic cycle
and prompted a defensive mood. On the other
hand, industrial production is accelerating and
should remain robust well into 2022. These
crosscurrents reflect the unusual features of this
cycle versus past precedents.
The summer rotation in favor of defensive and
quality styles and the decline in U.S. bond
yields highlight investors’ conviction that the
stagnation of the past decade will persist. In
contrast, we believe it is far too early to be
positioning portfolios for “late-cycle.” And
the fund’s positioning is anti-correlated to this
consensus, partly because markets are already
priced as if this outcome is certain and partly
because the post-2008 era is unlikely to be a
prologue for what comes next.
NOT FDIC INSURED | MAY LOSE VALUE | NO BANK GUARANTEE
OCTOBER 2021
EQUITY MARKET PERFORMANCE 3Q 2021 YTD
S&P 500 0.2% 14.7%
S&P 500 Equal Weight -0.3% 18.5%
MSCI World ex US -1.2% 7.1%
NASDAQ Composite -0.4% 12.1%
Russell 2000 -4.6% 11.6%
MSCI Emerging Markets -8.8% -3.0%
MSCI Europe -2.0% 7.9%
UK (FTSE 100) -1.8% 8.2%
Germany (DAX) -4.0% 4.7%
France (CAC 40) -2.2% 11.2%
Australia (ASX) -3.5% 4.4%
Italy (FTSE MIB) -0.1% 8.8%
China (Shanghai Stock Exchange) -0.5% 4.1%
Hong Kong (Hang Seng) -15.0% -10.1%
Mexico (IPC) -1.0% 12.9%
India (SENSEX) 12.8% 21.8%
Brazil (Bovespa) -19.7% -11.7%
Data through 9/30/2021Note: Returns are price only in USD.Past performance is no guarantee of future results. Source: Bloomberg. Indexes are unmanaged, do not include fees or expenses and are not available for direct investment. Please see “Index Definitions” for additional information. Portfolios are managed according to their respective strategies which may differ significantly in terms of security holdings, industry weightings and asset allocation from those of the benchmark(s). Portfolio performance, characteristics and volatility may differ from the benchmark(s) shown.

2 CPLIX QUARTERLY COMMENTARY | OCTOBER 2021
Sweaty Palms
The delta variant was the dominant influence in July and August, sparking a rotation back into the big-growth,
longer-duration, quality and safety parts of the market. This occurred at the expense of businesses more dependent
upon economic activity and reopening themes, where the fund is overweight. The Fed’s steps toward tapering have
led many to assume the boom phase of the recovery has been foreshortened.
Deceleration is built into any V-shaped recovery. We are entering the critical stage when the crutches of policy
support drop away and the private sector must pick up the baton and drive the expansion. The good news is that the
U.S. economy largely decoupled from the virus in late 2020, partly due to stimulus but also due to adaptability. That
learning curve has not been undone by the delta variant.
A moderating economic cycle that delivers wage and productivity gains
does not translate into the dire outcome that some are forecasting.
Corporate surveys highlight that the rate of order growth in production across much of the developed world remains
strong. The primary source of economic moderation in Q3 has been the auto sector, which is the epicenter of supply
bottlenecks. Demand outside autos has been robust and coincident with vibrant activity in the rest of the economy.
These supply issues will begin to ease as much of the world reopens for business.
Most measures of production globally will accelerate as supply-chain disruptions peak, though the latter may not
completely normalize until H2 2022. New orders versus inventories are no longer extreme and delivery times are no
longer lengthening, even for autos. Equities that benefit the most from supply shortages, such as haulage, shipping
and auto-related semis are no longer outperforming.
The downshift from V-recovery to solid and above-trend growth should
allow the risk cycle to continue despite Fed tapering.
The consensus is too bearish on the economic outlook for both Q4 and 2022. Fears of a fiscal cliff are overblown,
partly because consumers have saved the vast bulk of their fiscal transfers. Excess savings from the pandemic will
inevitably be converted into consumption, supported by the enormous gains in wealth of the past year, growing job
security and fear of rising prices.
“
“

CPLIX QUARTERLY COMMENTARY | OCTOBER 2021 3
The post-2008 decade suffered from a chronic shortage of demand. Consumers were forced to de-lever in the wake
of the housing collapse, while the corporate sector had little incentive to invest. Circumstances today are starkly
reversed. With a record number of job openings and firms struggling to fill them, the consumer is in a good position
to replace fading stimulus with employment and higher wages.
Consumer balance sheets have been truly transformed for the better,
and excess demand for labor will drive incomes.
COVID-19 has been a decisive protagonist for risk assets, yet it can be viewed as incidental to the secular changes
that have been building up for years. Some of this revolves around the retreat of globalization, which is forcing risk
assets into distinct regional regimes of governance and profitability. Unconventional policy prescriptions and the
inevitable fruits of the long stagnation that pervaded the post-2008 decade are equally obscuring the horizon.
This is creating an unfamiliar but positive demand setting coinciding with a less-elastic supply of labor and
intermediate goods. While the coronavirus is largely responsible for the restraints upon supply, the broader
reassessment of global production chains in a world fracturing into regional economic zones is unlikely to
be transitory.
Even though the array of reopening fits and starts, supply bottlenecks
and fiscal transfers has obscured the path of growth, the general
heading of travel is in the right direction.
We see the U.S. 10-year Treasury yield rising to 1.8% by year end, though bond yields have not risen to the level
implied by global PMIs due to the enormous interventions by the Federal Reserve. Since May, the Fed has purchased
about ~70% of Treasury issuance and this will diminish as the Fed tapers. Pricing pressures will persist because
they are increasingly driven by excess demand. All of this explains our reluctance to be overexposed to the equity
derivatives of long duration.
Forecasting the degree and speed of the rise in rates is challenging. On the one hand, U.S. rates reflect the global
balance of inflation versus deflation risks more than any other sovereign debt market. As we write this note, the
currency-hedged yield pickup in U.S. Treasuries for German and Japanese investors is large, helping to limit the rise
in U.S. nominal yields and, in turn, suppressing real yields.
“
“

4 CPLIX QUARTERLY COMMENTARY | OCTOBER 2021
On the other hand, there are a range of reasons to believe that today’s inflationary pressures are not as transitory as
some imagine. The reversal of globalization is forcing companies to reshore and assume greater control over supply
chains. Other factors include a structural bull market in oil, higher housing costs, less labor supply due to deteriorating
demographics, a rise in minimum wages, and the higher costs of the “environmental” component of ESG1 metrics.
Risk assets are well supported as long as credit conditions remain easy and the Fed stays pro-growth, but short-rate
expectations appear too sanguine. For the moment, monetary conditions are abnormally loose, and by some measures
looser than any point since the Global Financial Crisis. The real fed funds rate is still near 50-year lows, yet the U.S.
output gap will approach decade highs by 2023. This “best of all possible worlds” is unlikely to last beyond 2022.
Corporate Profits
For the past year, the news on corporate profitability has been stunningly positive. While market action into September
could be interpreted as a deterioration in the outlook, the key dynamic for equities will be a sustained rise in corporate
earnings into 2023.
As investors search for reasons to be cautious, one popular narrative is that rising costs will damage corporate
profitability. This narrative has been promoted as “supply-chain constraints,” with corporate transcript comments on
this topic cropping up at record levels. Some high-profile misses in recent weeks (Nike, Sherwin Williams) would seem
to support this trepidation especially in the auto, select industrial and retail industries.
But the argument that inflation pressures in the supply chain will undermine margins and profits is mistaken. The
corporate sector is a producer of intermediate value-added inputs. Rising input prices put upward pressure on
profit margins as other nominal and fixed costs tend to lag. For example, labor cost pressures are rising but lag the
momentum of other parts of the business model that are more correlated with revenue.
There is a link from pricing pressures (or supply constraints) to profits, but it does not run directly through margins.
If “supply chain issues” become a binding constraint on the output of volumes, as it has for the auto sector, that
translates into a reduction in productivity. The ratio of other costs such as labor relative to nominal value added will rise
and profits will be impacted negatively.
But the vast majority of businesses are not dealing with actual output restraints, with the implication that a robust PPI
is still indicative of healthy corporate profits. The pandemic itself was a broad “supply-side shock,” yet profits boomed.
Equally important, the supply constraints are not driven by a single cause, but by the complex interplay of ESG policies,
which impact capital flows, the onset of and recovery from COVID-19 and various geopolitical developments.
1 Environmental, Social, and Corporate Governance.

CPLIX QUARTERLY COMMENTARY | OCTOBER 2021 5
Rather than view supply-chain issues as jeopardizing the earnings cycle,
they will reinforce the rotation into cyclicals. The fundamental recovery in
cyclicals will be strong well into 2022.
Earnings concern is premature as long as the momentum in nominal GDP is above trend, probably into mid-
2022. Rising costs, either for intermediate inputs or labor, are an indication of persistent demand and should be
manageable if revenue momentum is sufficient to allow margins to expand. The time to worry is when corporate
managements enter an aggressive capital investment cycle—we are not there yet.
Our investment conclusion rests upon the observation that corporate and economic momentum will
continue to be robust well into 2022. While the monetary and positioning backdrop can pose difficulties
at any stage of the cycle, today’s historic setting argues for leaning into risk assets for as long as the
fundamental momentum is apparent.
Fund Exposures and Positioning
Net equity exposure (delta-adjusted) concluded the quarter at 59.5% and compares with net exposure at the start
of the year at 58.3%. This broadly stable positioning for equity risk is consistent (relative to our Strategic Guidelines)
with the bullish setting for equities and compares with the average net equity exposure of 26% since the Strategy’s
inception in 2002.
Through 2021, we have argued for minimal pullbacks in the major equity benchmarks due to the extraordinary policy
backdrop. However, the renewed rise in bond yields in late September implies rising vulnerability for long-duration
equities, which are weighted heavily in today’s benchmarks. The fund has therefore implemented several put option
risk-management strategies to cushion the impact of this.
The consensus interpretation of these modest consolidations is that “the worst is yet to come.” However, this view
underestimates the mix of developments that are uniquely supportive of risk assets including a sustainable recovery
in demand, historically easy policy, financial flows that favor equities, and chronic underinvestment in the supply side.
Consolidations will be limited as long as credit conditions are easy and the Fed is pro-growth.
The more recent mix of higher rates (the U.S. 10-year Treasury yield rising from 1.16% to 1.50%) and renewed debate
over the earnings cycle suggests market action through the October earnings season could be erratic with false
recoveries and relapses. We do not think any decline will be material, but the imbalanced positioning across industries
and styles argues for equity rotation as investors rediscover the enormity of the reflation theme into 2022.
“

6 CPLIX QUARTERLY COMMENTARY | OCTOBER 2021
From May to August, investor nervousness translated
into a defensive mood that has benefited health care and
technology, largely at the expense of the more cyclical
and higher beta plays. This comeback by one of the most
characteristic trends of the post-2008 era was signaled
by the decline of U.S. Treasury yields. However, this
leadership should not be extrapolated. The fund remains
biased in favor of names perceived as the more cyclical
and recovery positions.
Our broadest cyclical exposure is industrials and transports,
and then financials; we avoid the more expensive consumer
cyclicals (retailing) and longer-duration consumer equities
(food and luxury). This bias towards the industrial portion
of the economy reflects our view that IP has lagged, while
real consumer incomes could be eroded by higher prices.
Most consumption categories are above pre-COVID-19
levels, yet this is less true of the production side of the
economy, especially outside the U.S.
We view financials as the ideal hedge for a more
reflationary outcome than many expect. Banks, in particular,
are highly correlated with rising inflation expectations. We
also believe that the non-macro headwinds of the past
decade – litigation, taxation and regulatory – are largely
behind the industry. The fund has reduced exposure to
those businesses more exposed to capital markets where
upside is more limited from this point.
The fund is biased toward the retail banks as these benefit
from rising house prices and less disintermediation risk.
Abroad, Natwest Group (3.45%*) and Lloyds Banking
(3.87%*) are preferred over their continental peers as the
Bank of England is likely to raise rates more aggressively
than the market expects; both stocks will benefit from
material capital return, possibly ~15% of market cap.
SECTOR AVERAGE FOR Q3
Industrials and Transports 35.48%
Financials 22.14%
Information Technology 12.93%
Communication Services 9.19%
Consumer Discretionary 7.00%
Healthcare 4.21%
Energy 3.82%
Consumer Staples 2.46%
Materials 2.19%
Index Hedges -52.39%
Total 47.03%
Past performance is no guarantee of future results.
Q3 Average Delta-Adjusted Net Exposure by Sector
STRATEGY CONTRIBUTION OF PERFORMANCE
Long portfolio 0.98%
Short portfolio 0.42%
Cash 0.00%
Net before fees and expenses 1.40%
SECTOR CONTRIBUTION TO LONG BOOK
Financials 0.74%
Energy 0.70%
Index Hedges 0.68%
Information Technology 0.33%
Communication Services 0.30%
Healthcare 0.12%
Consumer Staples 0.10%
Materials 0.04%
Industrials and Transports -0.94%
Consumer Discretionary -1.09%
Total 0.98%
Returns by Sector (Long Strategy)
Returns by Strategy
*8/31/21 % of NAV

CPLIX QUARTERLY COMMENTARY | OCTOBER 2021 7
The energy sector has been traded long through 2021 (adding ~500 bps to returns), though exposure was reduced
materially in June. We repurchased exposure at the lows in mid-August with additions to Canadian Natural
Resources, Ltd. (2.05%*), Exxon Mobil Corp. (0.94%*) and Royal Dutch Shell (2.71%*). Energy is a hedge against a
more stagnant setting (more inflation, less growth) relative to what we expect.
Oil demand estimates for 2022 are too low and the supply side is hampered by capital discipline and regulatory risk. Oil
prices should be fundamentally supported, but the conundrum of robust spot prices but lower 5-year forward pricing
gives us pause. We are intrigued by the robust free cash flow yields on both spot and forward oil price assumptions,
though this may remain high as with other disrupted sectors like Tobacco.
While the broad themes across the portfolio have not changed, this obscures our activity at the stock level favoring
businesses that can navigate the ongoing recovery from the pandemic and, thus, produce material earnings leverage. If
our assumption of sustained economic expansion is correct, the fund’s bias toward the industrial and financial industries
will prove rewarding.
Looking at the risks, it is hard not to focus on China. Evergrande is not a “Lehman moment” due to liquidity injections and
the suppression of market-based pricing, while the government ownership of banks removes counterparty risk. Yet the
Chinese economy is entering a long period of stagnation more akin to Japan in the 1990s than the U.S. post-Lehman. With
property accounting for ~25% of the economy, an extended slowdown seems inevitable.
China’s woes underline the risk of viewing Emerging Markets or “EM” as a single asset class. Of course, many do, and
capital flows will inevitably pour out of China and be reallocated to what are perceived as quality plays elsewhere in EM.
One example of this is the leading Brazilian bank, Itau Unibanco (2.59%*), which was added to the long portfolio.
COVID-19 recovery and structural inflation in Brazil create a very attractive yield curve setting for their business model.
The fund is underweight the non-U.S.
economies and non-U.S. revenues and, thus,
more levered to U.S. domestic demand. This will
inevitably shift when the U.S. enters a sustained
slowdown, perhaps later in 2022. For now, we
struggle to allocate the long book outside the
U.S. as long as the opportunity set “close to
home” is robust. About 17.7% of the
long portfolio (versus 14.8% at end of June)
was allocated to non-U.S. opportunities at
quarter-end.
0%2%4%6%8%
10%12%14%16%
XOM RDS/A CNQ IMB LN BATS LN MO
FCF Yield at $60 Oil FCF Yield at $80 Oil Tobacco 2022 FCF Yield
CPLIX Energy Holdings Disrupted Tobacco Franchises
2022 FCF Yields at $60 versus $80 Crude Oil
Source: Macrobond. Data is seasonally adjusted.
*8/31/21 % of NAV including notional value of options

8 CPLIX QUARTERLY COMMENTARY | OCTOBER 2021
† As of 8/31/21
THEME
THESIS
HIGHLIGHTED NAMES
% OF GROSS LONG EXPOSURE†
Covid Epicenter
International travel, hospitality and leisure = epicenter of the pandemic
AirLease (AL) AerCap (AER) Delta Airlines (DAL) Southwest Airlines (LUV) British Air (IAG LN) Boeing (BA)
15.1%
Structural Underinvestment
Climate politics limit capital investment in a range of industries
Canadian Natl Res (CNQ) Exxon (XOM) Royal Dutch Shell (RDS/A) Linde (LIN)
6.8%
Rising Inflation Expectations
Financials are key hedge for a less deflationary economic cycle
Bank of America (BAC) Huntington Bank (HBAN) Morgan Stanley (MS) NatWest Group (NWG LN) Truist Financial (TFC) Legal & General (LGEN LN) Lloyds Banking (LLOY LN)
19.8%
Above-Trend Industrial Production
Supply chain disruptions peak, leading to accelerating industrial production
Raytheon Technologies (RTX) Honeywell (HON) L3Harris (LHX) CSX (CSX) Union Pacific (UNP) Volkswagen (VOW3 GY)
16.7%
Reopening Normalization of economic behavior in the services industry
Sysco (SYY) FleetCorp (FLT) Caesars (CZR) Wynn Resorts (WYNN) Boston Scientific (BSX)
17.7%
GARP Growth can win if it has a cyclical component and is reasonably priced
Facebook (FB) Alphabet (GOOGL) Salesforce (CRM) Fidelity Info Svcs (FIS)
15.0%
Innovative Growth
Growth potential greater than risk of derating
Twilio (TWLO) Paycom (PAYC) Anaplan (PLAN) Zendesk (ZEN) BioMarin (BMRN)
8.9%
Shorter Duration Business Model
Longer Duration Business Model
Portfolio Themes and Sensitivity to Duration
★★★★OVERALL MORNINGSTAR RATINGTM
Among 179 Long-Short Equity Funds
The fund’s load-waived Class I shares had 4 stars for 3 years and 4 stars for 5 years out of 179 and 157 Long-Short Equity funds, respectively, for the period ended 9/30/21
Morningstar ratings shown are for Class I shares and do not include any front-end sales load. Not all investors have access to or may invest in the share class shown. Other share classes with front-end or back-end sales charges may have different ratings than the ratings shown.
Morningstar Ratings™ are based on risk-adjusted returns for Class I shares and will differ for other share classes. Morningstar ratings are based on a risk-adjusted return measure that accounts for variation in a fund’s monthly historical performance (reflecting sales charges), placing more emphasis on downward variations and rewarding consistent performance. Within each asset class, the top 10%, the next 22.5%, 35%, 22.5%, and the bottom 10% receive 5, 4, 3, 2 or 1 star, respectively. Each fund is rated exclusively against U.S. domiciled funds. The information contained herein is proprietary to Morningstar and/or its content providers; may not be copied or distributed; and is not warranted to be accurate, complete or timely. Neither Morningstar nor its content providers are responsible for any damages or losses arising from any use of this information. Source: ©2021 Morningstar, Inc. All rights reserved.

CPLIX QUARTERLY COMMENTARY | OCTOBER 2021 9
Outlook
Today’s cross currents are preventing investors from looking beyond the pandemic. Investors are concerned that the
recovery is fully baked. They are convinced that inflation, the pandemic, fiscal cliff, fed tapering and so forth will short
circuit the recovery, returning the world to the essential characteristics of the post-2008 era.
The striking features of the market in the past quarter – the decline in bond yields and rotation to defensive
quality – were propelled by the conviction that the end of the economic recovery was in sight. To us, this underscores
the depth of today’s deflation psychology. It highlights the extent to which investors have become prisoners of the
direction of bond prices.
While “stagflation” has become a popular term for the bears, it is possible that financial markets are signaling
moderately higher inflation but significantly higher economic growth. The latter is more analogous to the U.S.
experience of the 1950s than the stagflation of the 1970s. While the outcome will not be known for years, we see
markets gravitating to the more sanguine of the two paths as the inflation data into 2022 proves tamer than feared.
The wave dynamics of COVID-19 imply improvement for at least three to four months, but possibly beyond that as
well. We believe the summer wave was the last significant one of the pandemic and might mark its conclusion. This
would echo the pattern of the 1918/1919 flu and others that were characterized by four waves and lasted not more
than two years. New treatments and infection penetration levels also support this view.
This final stretch of the pandemic and the uncertainly over inflation imply that long duration should be carefully
managed within portfolios. We are unsure how rapidly the supply constraints will ease as the world gradually
overcomes the pandemic, but the secular and cyclical circumstances of today are unprecedented. While the response
by central banks will be slow and reluctant, the tide is just beginning to turn for interest rates in the developed world.
A risk premium will gradually return to longer duration debt and all of
its equity derivatives, most notably speculative growth stocks. Duration
risk is becoming more structural and less cyclical, thereby weakening the
link between economic growth and interest rates that is embedded in
investor psychology.
*8/31/21 % of NAV including notional value of options
“

10 CPLIX QUARTERLY COMMENTARY | OCTOBER 2021
Fundamental momentum will remain above trend into 2022 and the positive productivity shock of the pandemic will
linger for profits and economic growth. This will eventually wane under the weight of rising burdens of indebtedness,
taxation and regulation. At some point, risk assets will fully discount recovery and start considering the challenge
posed by the collapse of policy discipline.
Putting the liquidity genie back in the bottle could take years and implies
a major bear market in 2023 or 2024.
In the prosaic language of our industry, the pandemic has been the great wall of worry for risk assets to climb. As
long as it dominates, the bull market is not under threat. As we progress through 2022, the mood of central banks
will shift more decisively. At some point, the economic context will be defined by negative growth surprises and
positive inflation surprises. But we are not there yet. The bullish dynamic that underpins U.S. dollar-based risk assets
is “unfinished business.”
Given the scale of reallocation of assets needed if our optimistic view
of the economic cycle unfolds, clients should consider how to hedge
themselves for a different decade ahead. The Calamos Phineus Long/
Short Fund is well positioned for that future.
–Michael Grant, October, 2021
““

CPLIX QUARTERLY COMMENTARY | OCTOBER 2021 11
Top 5 Fund Contributors for 3Q21
Caesars is a best-in-class play on the reopening of the U.S. hospitality and entertainment industry through regional and
Las Vegas hotels and casinos. In addition, we view Caesars among the more attractive ways to gain exposure to growth in
online sports betting/iGaming with the launch of a new mobile app to Caesars Rewards members (60 million+) serving as
a near-term catalyst. The acquisition of William Hill closed in Q2, and we believe that management’s strong track record
positions the combined company to grow market share going forward. We see upside to consensus numbers on the return
of conference and convention business and the durability of post-COVID-19 profit margins supporting 30% upside in the
share price.
We view Paycom as the best of several small, cloud-based human capital management (HCM) software providers that are
disrupting the $20 billion payroll services market, historically a duopoly between Automatic Data and Paychex. At a $1
billion sales run rate, Paycom has a long runway for continued 20%+ growth; it already has among the best margins of
leading SaaS vendors. We expect growth to be sustained through a combination of selling to new and larger customers,
expansion of its product footprint with existing customers, and strong pricing power. The stock had been held back by
a tight labor market that limited upside to revenue, but Q2 results proved an inflection. We look to tactically reduce the
position given our valuation sensitivity after the stock’s impressive run.
Google’s search and display advertising networks are a key beneficiary of the ad migration from legacy to digital
performance-based channels. The COVID-19 pandemic has further highlighted the importance of digital marketing
strategies, and Google has been a primary beneficiary. Its online advertising platform is most directly exposed to recovery
in the travel and services sectors. The stock grinded higher through the quarter with Q2 results sustaining the move up as
improved cost discipline drove operating margins to their best levels since 2016. Despite outperformance over the past 12
months, valuation remains reasonable at a ~10% premium to the broader market. Alphabet remains a core holding within
the growth component of the long portfolio.
NAME SYMBOL CONTRIBUTION % OF FUND NAV FIRM PROFILE
Paycom PAYC 0.61% 3.76% Long as of 8/31/21 U.S. Software
NAME SYMBOL CONTRIBUTION % OF FUND NAV FIRM PROFILE
Alphabet, Inc. GOOGL 0.46% 4.04% Long as of 9/30/21 U.S. Communication
NAME SYMBOL CONTRIBUTION % OF FUND NAV FIRM PROFILE
Caesars Entertainment, Inc. CZR 0.61% 4.69% Long as of 8/31/21 U.S. Consumer Discretionary

12 CPLIX QUARTERLY COMMENTARY | OCTOBER 2021
Salesforce provides a suite of on-demand customer relationship management services to businesses worldwide. It is
the largest and among the cheapest SaaS names at 9x forward sales versus a SaaS group average of 15x and larger
software names Oracle and Microsoft at 7x and 11x respectively. At its current multiple the stock is valued more like
a mature software company than a SaaS upstart despite a pure SaaS model that delivers 10%–12% organic growth.
With management’s M&A record (ExactTarget, Demandware, MuleSoft, Tableau and now Slack), we expect value to
shareholders to continue accruing closer to 20%. The stock outperformed in Q3 following a higher-than-expected margin
outlook for FY 2023 at the company’s Analyst Day, where management spoke to positive product momentum and the
strength of the demand environment. It remains a core holding.
NatWest is a U.K.-focused retail and commercial bank that is a prime recovery play on the U.K. economy. Its shares
continued to rise in Q3 in sympathy with interest rates, which will benefit net interest income. In addition, excess deposits
provide ample room for growth in mortgage and other forms of lending. The company’s return of capital strategy is likely
to yield close to 15% of its equity market capitalization by the end 2023, yet the stock trades at a discount to tangible
book value. We view the UK as the most attractive market in broader Europe due to a stronger economic environment and
fewer regulatory and structural headwinds than the continent.
Top 5 Stock Detractors for 3Q21
Twilio serves developers that embed messaging functionality into mobile and online apps. As such growth is driven by
1) by the preponderance of new apps, 2) more apps embedding communication functions for customer engagement
and two-factor authentication, and 3) growing usage trends. The stock underperformed in the quarter as it fell victim
to a combination of factor rotation (high multiple growth to value) and margin concerns. The company’s new call center
platform Flex is taking longer than expected to roll out but remains promising and addresses a $10 billion incremental
market. We see upside to consensus estimates and 30%–40% growth sustainable over a three to five year timeframe,
thereby supporting considerable upside in the stock over the next 18 months.
NAME SYMBOL CONTRIBUTION % OF FUND NAV FIRM PROFILE
NatWest Group, PLC NWG 0.35% 3.45% Long as of 8/31/21 U.K. Financials
NAME SYMBOL CONTRIBUTION % OF FUND NAV FIRM PROFILE
Twilio, Inc. TWLO -0.55% 2.34% Long as of 8/31/21 U.S. Software
NAME SYMBOL CONTRIBUTION % OF FUND NAV FIRM PROFILE
Salesforce.com, Inc. CRM 0.40% 3.76% Long as of 8/31/21 U.S. Software

CPLIX QUARTERLY COMMENTARY | OCTOBER 2021 13
Fidelity National Information Services (FIS) is a leading provider of technology solutions for banks, merchants and
capital-markets firms globally. Banks and capital-markets firms rely on FIS for core processing infrastructure and modern
technology solutions; merchants turn to FIS for its strong presence in eComm-payment processing and integrated
payments globally. Its underperformance during the quarter was driven by a choppy recovery in its merchant acquiring
business (especially retail and travel and entertainment spending) as well as continued concerns of permanent market-share
losses due to increasing competition from newer payment companies (for example, Square) built on modern tech stacks.
In contrast, we see FIS as a long-term market-share winner in bank technology and payment processing, and its strong
financial profile infers high-single-digit revenue growth potential (45%+ EBITDA1 margin, and 70%+ FCF conversion2). We
believe earnings-per-share estimates have bottomed and see FIS returning to a beat-and-raise story. We view the shares as
attractive trading at ~16x price-to-earnings.
Boeing is one of two dominant global manufacturers of commercial jetliners. The company also produces military
aircraft and defense, space, and security systems. Boeing’s earnings and cash flow have been decimated because of the
pandemic’s impact on global air travel and the prolonged 737 MAX grounding. The 737 MAX issues have been resolved,
deliveries have resumed and are growing, and production will follow. Additionally, the global aerospace industry is in its
first recovery year of a likely 5 to 10 year up cycle. Sentiment around Boeing’s prospects has gone from unprecedented
highs to unprecedented lows. Shares lagged in 3Q as the delta variant modestly pushed out the travel recovery and some
shorter-term production issues persisted. With Boeing a key beneficiary of both the cyclical recovery and long-term secular
growth in commercial air travel, we believe the shares set up well for a strong year in 2022.
Wynn Resorts (WYNN) is primarily a play on the recovery of the gaming market in Macau. Although recent results have
been suppressed by travel restrictions between China, Hong Kong and Macau, the company has retained its pre-COVID-19
earnings potential. Risks associated with the June 2022 gaming concession renewal weighed on the stock in Q3, particularly
after the government released a list of proposed reforms in September. However, we believe the stock prices in too
pessimistic an outcome. While travel restrictions and license renewal uncertainty could weigh on both Wynn and Las Vegas
Sands through mid-2022, the stocks could potentially double if the most likely return to normal scenario plays out. We have
switched between the stocks tactically to realize tax losses but remain constructive on both names on a two-year basis.
NAME SYMBOL CONTRIBUTION % OF FUND NAV FIRM PROFILE
Fidelity National Information Services, Inc.
FIS -0.45% 3.27% long as of 8/31/21 U.S. Information Technology
NAME SYMBOL CONTRIBUTION % OF FUND NAV FIRM PROFILE
Boeing Company BA -0.36% 1.81% Long Q3 Average U.S. Aerospace
NAME SYMBOL CONTRIBUTION % OF FUND NAV FIRM PROFILE
Wynn Resorts, Ltd. WYNN -0.33% 2.63% Long as of 8/31/21 U.S. Consumer Discretionary
1 Earnings before interest, taxes, depreciation and amortization.2 The free cash flow conversion rate is a liquidity ratio that measures a company’s ability to convert operating profits into free cash flow (FCF) in a given period.

14 CPLIX QUARTERLY COMMENTARY | OCTOBER 2021
Air Lease (AL) is a leading lessor of commercial aircraft. A young fleet and the management team that pioneered the
industry have positioned AL as the highest-quality name in the sector. As global airlines repair balance sheets following
the pandemic, lessors have increased their share of aircraft deliveries from 15% pre-COVID-19 to over 50% currently. We
believe the shift toward leasing is a long-term trend that should result in an improved growth trajectory for high-quality
lessors. Recently announced new contracts are initial indicators of lessors taking share. Following a sharp 12-month
recovery through 1Q, AL shares underperformed in Q2 and Q3 as virus fears re-emerged, and new travel restrictions were
imposed in select countries. With announcements of travel borders reopening, the recovery should continue and accelerate
from current levels. We see material upside with AL trading below trough book value and at 8x earnings, and with the
bulk of the global recovery still ahead.
LARGEST POSITIONS, LONG AND SHORT AS OF 9/30/2021 (% OF NET ASSETS)
Air Lease Corp. - Class A Long 5.3%
Facebook, Inc. - Class A Long 4.6%
Alphabet, Inc. - Class A Long 4.0%
Raytheon Technologies Corp. Long 3.7%
Paycom Software, Inc. Long 3.7%
SPDR S&P 500 ETF Trust Short -35.1%
Technology Select Sector SPDR Fund Short -5.5%
Costco Wholesale Corp. Short -2.0%
Target Corp. Short -1.3%
ARK Innovation ETF Short -1.1%
Holdings and weightings are subject to change daily. Holdings are provided for informational purposes only and should not be deemed as a recommendation to buy or sell the securities mentioned.
NAME SYMBOL CONTRIBUTION % OF FUND NAV FIRM PROFILE
Air Lease Corp. AL -0.30% 5.29% Long as of 9/30/21 U.S. Industrial
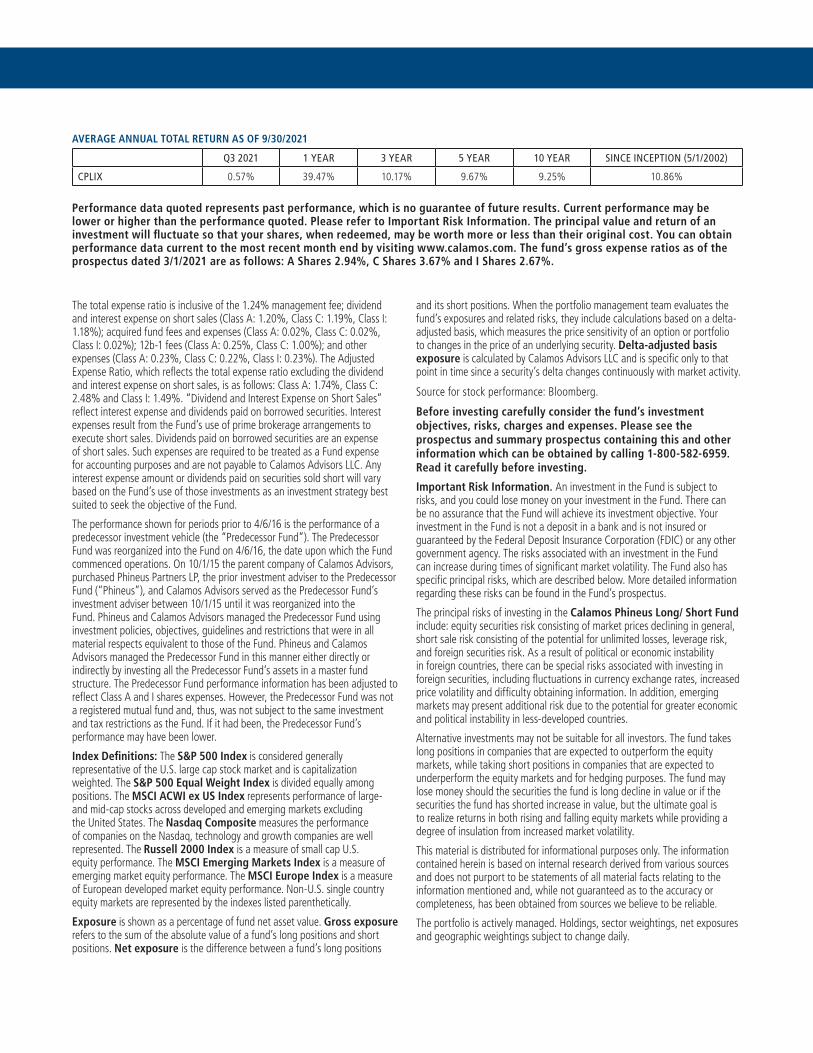
AVERAGE ANNUAL TOTAL RETURN AS OF 9/30/2021
Q3 2021 1 YEAR 3 YEAR 5 YEAR 10 YEAR SINCE INCEPTION (5/1/2002)
CPLIX 0.57% 39.47% 10.17% 9.67% 9.25% 10.86%
Performance data quoted represents past performance, which is no guarantee of future results. Current performance may be lower or higher than the performance quoted. Please refer to Important Risk Information. The principal value and return of an investment will fluctuate so that your shares, when redeemed, may be worth more or less than their original cost. You can obtain performance data current to the most recent month end by visiting www.calamos.com. The fund’s gross expense ratios as of the prospectus dated 3/1/2021 are as follows: A Shares 2.94%, C Shares 3.67% and I Shares 2.67%.
The total expense ratio is inclusive of the 1.24% management fee; dividend and interest expense on short sales (Class A: 1.20%, Class C: 1.19%, Class I: 1.18%); acquired fund fees and expenses (Class A: 0.02%, Class C: 0.02%, Class I: 0.02%); 12b-1 fees (Class A: 0.25%, Class C: 1.00%); and other expenses (Class A: 0.23%, Class C: 0.22%, Class I: 0.23%). The Adjusted Expense Ratio, which reflects the total expense ratio excluding the dividend and interest expense on short sales, is as follows: Class A: 1.74%, Class C: 2.48% and Class I: 1.49%. “Dividend and Interest Expense on Short Sales” reflect interest expense and dividends paid on borrowed securities. Interest expenses result from the Fund’s use of prime brokerage arrangements to execute short sales. Dividends paid on borrowed securities are an expense of short sales. Such expenses are required to be treated as a Fund expense for accounting purposes and are not payable to Calamos Advisors LLC. Any interest expense amount or dividends paid on securities sold short will vary based on the Fund’s use of those investments as an investment strategy best suited to seek the objective of the Fund.
The performance shown for periods prior to 4/6/16 is the performance of a predecessor investment vehicle (the “Predecessor Fund”). The Predecessor Fund was reorganized into the Fund on 4/6/16, the date upon which the Fund commenced operations. On 10/1/15 the parent company of Calamos Advisors, purchased Phineus Partners LP, the prior investment adviser to the Predecessor Fund (“Phineus”), and Calamos Advisors served as the Predecessor Fund’s investment adviser between 10/1/15 until it was reorganized into the Fund. Phineus and Calamos Advisors managed the Predecessor Fund using investment policies, objectives, guidelines and restrictions that were in all material respects equivalent to those of the Fund. Phineus and Calamos Advisors managed the Predecessor Fund in this manner either directly or indirectly by investing all the Predecessor Fund’s assets in a master fund structure. The Predecessor Fund performance information has been adjusted to reflect Class A and I shares expenses. However, the Predecessor Fund was not a registered mutual fund and, thus, was not subject to the same investment and tax restrictions as the Fund. If it had been, the Predecessor Fund’s performance may have been lower.
Index Definitions: The S&P 500 Index is considered generally representative of the U.S. large cap stock market and is capitalization weighted. The S&P 500 Equal Weight Index is divided equally among positions. The MSCI ACWI ex US Index represents performance of large- and mid-cap stocks across developed and emerging markets excluding the United States. The Nasdaq Composite measures the performance of companies on the Nasdaq, technology and growth companies are well represented. The Russell 2000 Index is a measure of small cap U.S. equity performance. The MSCI Emerging Markets Index is a measure of emerging market equity performance. The MSCI Europe Index is a measure of European developed market equity performance. Non-U.S. single country equity markets are represented by the indexes listed parenthetically.
Exposure is shown as a percentage of fund net asset value. Gross exposure refers to the sum of the absolute value of a fund’s long positions and short positions. Net exposure is the difference between a fund’s long positions
and its short positions. When the portfolio management team evaluates the fund’s exposures and related risks, they include calculations based on a delta-adjusted basis, which measures the price sensitivity of an option or portfolio to changes in the price of an underlying security. Delta-adjusted basis exposure is calculated by Calamos Advisors LLC and is specific only to that point in time since a security’s delta changes continuously with market activity.
Source for stock performance: Bloomberg.
Before investing carefully consider the fund’s investment objectives, risks, charges and expenses. Please see the prospectus and summary prospectus containing this and other information which can be obtained by calling 1-800-582-6959. Read it carefully before investing.
Important Risk Information. An investment in the Fund is subject to risks, and you could lose money on your investment in the Fund. There can be no assurance that the Fund will achieve its investment objective. Your investment in the Fund is not a deposit in a bank and is not insured or guaranteed by the Federal Deposit Insurance Corporation (FDIC) or any other government agency. The risks associated with an investment in the Fund can increase during times of significant market volatility. The Fund also has specific principal risks, which are described below. More detailed information regarding these risks can be found in the Fund’s prospectus.
The principal risks of investing in the Calamos Phineus Long/ Short Fund include: equity securities risk consisting of market prices declining in general, short sale risk consisting of the potential for unlimited losses, leverage risk, and foreign securities risk. As a result of political or economic instability in foreign countries, there can be special risks associated with investing in foreign securities, including fluctuations in currency exchange rates, increased price volatility and difficulty obtaining information. In addition, emerging markets may present additional risk due to the potential for greater economic and political instability in less-developed countries.
Alternative investments may not be suitable for all investors. The fund takes long positions in companies that are expected to outperform the equity markets, while taking short positions in companies that are expected to underperform the equity markets and for hedging purposes. The fund may lose money should the securities the fund is long decline in value or if the securities the fund has shorted increase in value, but the ultimate goal is to realize returns in both rising and falling equity markets while providing a degree of insulation from increased market volatility.
This material is distributed for informational purposes only. The information contained herein is based on internal research derived from various sources and does not purport to be statements of all material facts relating to the information mentioned and, while not guaranteed as to the accuracy or completeness, has been obtained from sources we believe to be reliable.
The portfolio is actively managed. Holdings, sector weightings, net exposures and geographic weightings subject to change daily.

Calamos Financial Services LLC, Distributor2020 Calamos Court | Naperville, IL 60563-2787 800.582.6959 | www.calamos.com | [email protected]
©2021 Calamos Investments LLC. All Rights Reserved. Calamos® and Calamos Investments® are registered trademarks of Calamos Investments LLC. PLSOUTLKCOM 18759 0921Q R