Caio A. S. Coelho e-mail: [email protected] Supervisors: D. B. Stephenson, F. J....
35
Caio A. S. Coelho e-mail: [email protected] Supervisors: D. B. Stephenson, F. J. Doblas-Reyes (*) Thanks to CAG, S. Pezzulli and M. Balmaseda (*) Department of Meteorology, University of Reading and ECMWF (*) Forecast Assimilation of DEMETER Coupled Model Seasonal Predictions
-
Upload
colin-mcdowell -
Category
Documents
-
view
218 -
download
1
Transcript of Caio A. S. Coelho e-mail: [email protected] Supervisors: D. B. Stephenson, F. J....

Caio A. S. Coelho
e-mail: [email protected]
Supervisors: D. B. Stephenson, F. J. Doblas-Reyes (*)
Thanks to CAG, S. Pezzulli and M. Balmaseda (*)
Department of Meteorology, University of Reading and ECMWF (*)
Forecast Assimilation of DEMETER Coupled Model Seasonal Predictions

Plan of talk1. Issues2. Conceptual framework (“Forecast Assimilation”)3. DEMETER4. Examples of application: 0-d, 1-d, 2-d.
5. Conclusions
•

1. Issues
• Why do forecasts need it?• Which are the best ways
to calibrate?• How to get good probability
estimates?
Calibration
Combination • Why to combine?• Should model predictions be
selected?• How best to combine?

2. Conceptual framework
)y(p
)x(p)x|y(p)y|x(p
i
iiiii
Data Assimilation “Forecast Assimilation”
)x(p
)y(p)y|x(p)x|y(p
f
fffff

3. Multi-model ensemble approach
DEMETER DEMETER Development of a European Multi-Model Ensemble
System forSeasonal to Interannual Prediction
Solution: Multi-model Ensemble
Errors: Model formulationInitial conditions
http://www.ecmwf.int/research/demeter

DEMETER Multi-model ensemble system
7 coupled global circulation models
Hindcast period: 1980-2001 (1959-2001)
9 member ensembles
ERA-40 initial conditions
SST and wind perturbations
4 start dates per year
(Feb, May, Aug and Nov)
6 month hindcasts
Model Country
ECMWF International
LODYC France
CNRM France
CERFACS France
INGV Italy
MPI Germany
UKMO U.K.

4. Examples of application
•
• Niño-3.4 index (0-d)• Equatorial Pacific SST (1-d)• South American rainfall (2-d)

Example 1: Niño-3.4 forecasts
Well-calibrated: Most observations in the 95% prediction interval (P.I.)
95% P.I.valueJulyY
valueDecemberY
),Y(N~Y|Y
5t
t
2t05t1o5tt

ECMWF coupled model ensemble forecasts
Observations not within the 95% prediction interval! Coupled model forecasts need calibration
m=9DEMETER: 5-month
lead
2X
2ttt
2ttt sˆ;Xˆ);,(N~X

Prior:
Univariate X and Y
),(N~Y 2t0t0t
)V,Y(N~Y|X tttt
'
2X
t m
m
m
sV
),(N~X|Y 2tttt
t
t
2
2t0
t02
t
t
t
2
2t0
2t
X
V
V
11
)X(p
)Y(p)Y|X(p)X|Y(p
t
ttttt
Posterior:
Likelihood:
Bayes’ theorem:

Modelling the likelihood p(X|Y)
y

Combined forecasts
Note: most observations within the 95% prediction interval!

All forecasts
Forecast MAE
(C)
MAESS (%)
BS BSS
(%)
Uncert
(C)
Climatol. 1.16 0 0.25 0 1.19
Empirical 0.53 55 0.05 79 0.61
Coupled 0.57 51 0.18 29 0.33
Combined 0.31 74 0.04 81 0.32
MAESS = [1- MAE/MAE(clim.)]*100%
Empirical Coupled
Combined
BSS = [1- BS/BS(clim.)]*100%

)C,Y(N~Y b
1TT
111T
obba
)SGCG(CGL
C)LGI()CGSG(D
)]YY(GX[LYY
)S],YY[G(N~Y|X o
Prior:
Likelihood:
Posterior:
1YYXYSSG
YGXGYo T
YYXX GGSSS
)D,Y(N~X|Y a
Multivariate X and Y
bias
qq:D
qn:Y
pn:X
qq:C q1:Yb
pp:S qn:Ya
Matrices
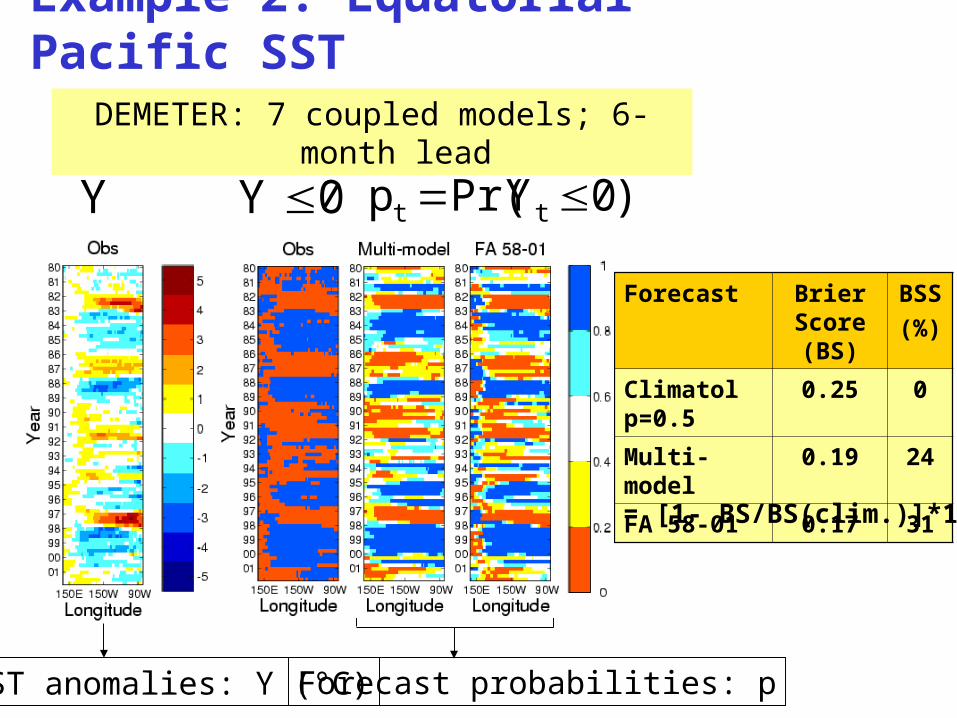
Example 2: Equatorial Pacific SST
Forecast Brier Score (BS)
BSS
(%)
Climatol p=0.5 0.25 0
Multi-model 0.19 24
FA 58-01 0.17 31
)0YPr(p tt
SST anomalies: Y (°C)Forecast probabilities: p
DEMETER: 7 coupled models; 6-month lead
BSS = [1- BS/BS(clim.)]*100%
Y 0Y

Brier Score as a function of longitude
Forecast assimilation reduces (i.e. improves) the Brier score in the eastern and western equatorial Pacific
1BS0)op(n
1BS
n
1k
2kk

Brier Score decomposition
1BS0)op(n
1BS
n
1k
2kk
)o1(o)oo(Nn
1)op(N
n
1BS
l
1i
2ii
l
1i
2iii
iNk
ki
i1i oN
1)p|o(po
n
1kko
n
1o
reliability resolution uncertainty

Forecast assimilation improves reliability in the western Pacific
Reliability as a function of longitudeReliability as a function of longitude

Resolution as a function of longitude
Forecast assimilation improves resolution in the eastern Pacific

Why South America?
El Niño (DJF)
La Niña (DJF)
Source: Climate Prediction Center (http://www.cpc.ncep.noaa.gov)
Seasonal climate potentially predictable
DEMETERMulti-model
Correlation: DJF rainfall

Why South American rainfall?
Agriculture
Electricity: More than 90% produced by hydropower stations
e.g. Itaipu (Brazil/Paraguay):• World largest hydropower plant• Installed power: 12600 MW • 18 generation units (700 MW each)• ~25% electricity consumed in Brazil• ~95% electricity consumed in Paraguay

Itaipu

Example 3: South American rainfall anomalies
Obs Multi-modelForecastAssimilation
(mm/day)
DEMETER: 3 coupled models
(ECMWF, CNRM, UKMO)
1-month lead
Start: Nov DJF
ENSO composites: 1959-2001
• 16 El Nino years
• 13 La Nina years
r=0.51
r=0.28
r=0.97
r=0.82

South American DJF rainfall anomaliesObs Multi-model Forecast
Assimilation
(mm/day)
r=-0.09
r=0.32
r=0.59
r=0.56
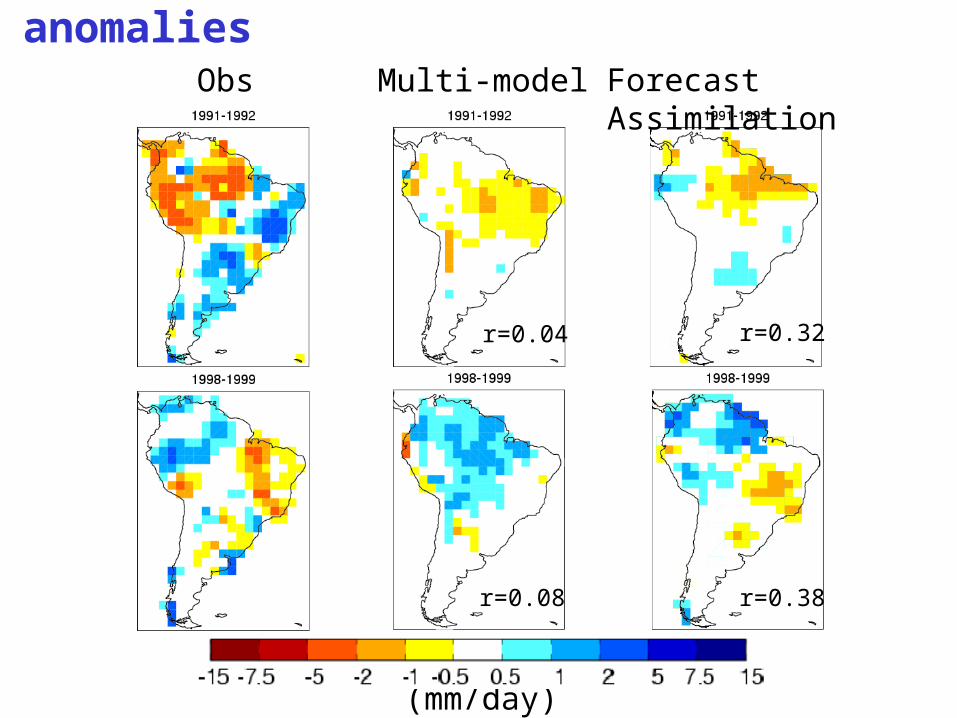
South American DJF rainfall anomaliesObs Multi-model Forecast
Assimilation
(mm/day)
r=0.04
r=0.08
r=0.32
r=0.38

Brier Skill Score for S. American rainfall
Forecast assimilation improves the Brier Skill Score (BSS) in the tropics
limcBS
BS1BSS
)0YPr(p tt

Reliability component of the BSS
Forecast assimilation improves reliability over many regions
limc
reliabreliab BS
BSBSS

Resolution component of the BSS
Forecast assimilation improves resolution in the tropics
limc
resolresol BS
BSBSS

• unified framework for the calibration and combination of predictions – “forecast assimilation”
• improves the skill of probability forecasts• Example 1: Niño-3.4
improved mean forecast value and prediction uncertainty estimate
• Example 2: Equatorial Pacific SST improved reliability (west) and resolution
(east)• Example 3: South American rainfall
improved reliability and resolution in the tropics improved reliability over subtropical and central regions
5. Conclusions:

•Coelho C.A.S. “Forecast Calibration and Combination: Bayesian Assimilation of Seasonal Climate Predictions”. PhD Thesis. University of Reading (to be submitted) • Coelho C.A.S., D. B. Stephenson, F. J. Doblas-Reyes and M. Balmaseda: “From Multi-model Ensemble Predictions to Well-calibrated Probability Forecasts: Seasonal Rainfall Forecasts over South America 1959-2001”. CLIVAR Exchanges (submitted).• Stephenson, D. B., Coelho, C. A. S., Doblas-Reyes, F.J. and Balmaseda, M.“Forecast Assimilation: A Unified Framework for the Combination of Multi-Model Weather and Climate Predictions.” Tellus A - DEMETER special issue (in press).• Coelho C.A.S., S. Pezzulli, M. Balmaseda, F. J. Doblas-Reyes and D. B. Stephenson, 2004: “Forecast Calibration and Combination: A Simple Bayesian Approach for ENSO”. Journal of Climate. Vol. 17, No. 7, 1504-1516.
• Coelho C.A.S., S. Pezzulli, M. Balmaseda, F. J. Doblas-Reyes and D. B. Stephenson, 2003: “Skill of Coupled Model Seasonal Forecasts: A Bayesian Assessment of ECMWF ENSO Forecasts”. ECMWF Technical Memorandum No. 426, 16pp. Available at http://www.met.rdg.ac.uk/~swr01cac
More information …

Reliability diagram (Multi-model)
(pi)
(oi)
o

Reliability diagram (FA 58-01)
o
(pi)
(oi)

Operational Seasonal forecasts for S. America• Coupled models
U.S.A: http://iri.columbia.edu
• Atmospheric models forced by persisted/forecast SSTs
Brazil: http://www.cptec.inpe.br
Europe: http://www.ecmwf.int
U.K: http://www.metoffice.com

Mean Anomaly Correlation Coefficient
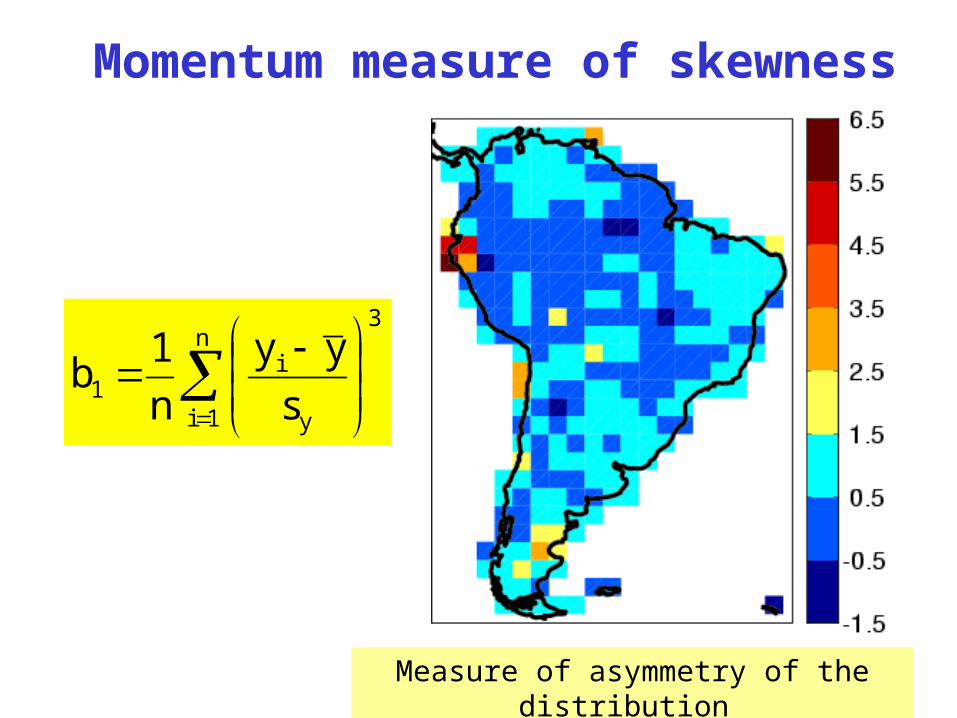
Momentum measure of skewness
n
1i
3
y
i1 s
yy
n
1b
Measure of asymmetry of the distribution