CAFOs-Chemicals Associated with Air Emissions 5-10-06€¦ · Concentrated Animal Feedlot...
21
Concentrated Animal Feedlot Operations (CAFOs) Chemicals Associated with Air Emissions May 10, 2006 Prepared by the CAFO subcommittee of the Michigan Department of Environmental Quality (MDEQ) Toxics Steering Group (TSG) Introduction In 2005, the MDCH, MDA, and MDEQ and representatives from two local health departments formed the Multidisciplinary Technical Team (MTT) to address the potential public health effects of living near CAFOs. Initial discussions indicated the need for a review of the available literature concerning chemical emissions from CAFOs. MDEQ representatives on the MTT, Frank Baldwin and Dennis Armbruster, subsequently requested that the MDEQ TSG form a subcommittee to conduct a review. In response, the TSG formed a subcommittee consisting of the following TSG members: Mary Lee Hultin, MDEQ, Air Quality Division (AQD) Shannon Briggs, MDEQ, Water Bureau (WB) Margaret Sadoff, MDEQ, AQD Linda D. Dykema, Michigan Department of Community Health (MDCH) Brian Hughes, Michigan Department of Agriculture (MDA) The charge to the TSG CAFO subcommittee was to answer the following questions: 1. What chemicals have been detected in air emissions from CAFOs? 2. What are the human health effects of exposure to these chemicals? 3. What levels of these chemicals in air are not expected to cause adverse human health effects? 4. What groups of people (e.g., asthmatics, the young or elderly) may be more sensitive to exposure to these chemicals? In addition, the subcommittee was asked to investigate any additional concerns that arose during the review process. The subcommittee performed an electronic search of the existing literature, identified relevant publications, and obtained copies of these documents, which are now stored in the MDEQ Toxicology Library in Constitution Hall. This report provides the requested summary of the chemical characteristics of these compounds, levels of concern in the environment, and potential human health effects. Chemicals Associated with CAFOs A review of the available scientific literature indicates that emissions from CAFOs include gases and vapors, particulate matter, and odors. Very little monitoring data are available from large-
Transcript of CAFOs-Chemicals Associated with Air Emissions 5-10-06€¦ · Concentrated Animal Feedlot...

Concentrated Animal Feedlot Operations (CAFOs) Chemicals Associated with Air Emissions
May 10, 2006
Prepared by the CAFO subcommittee of the Michigan Department of Environmental Quality (MDEQ)
Toxics Steering Group (TSG)
Introduction In 2005, the MDCH, MDA, and MDEQ and representatives from two local health departments formed the Multidisciplinary Technical Team (MTT) to address the potential public health effects of living near CAFOs. Initial discussions indicated the need for a review of the available literature concerning chemical emissions from CAFOs. MDEQ representatives on the MTT, Frank Baldwin and Dennis Armbruster, subsequently requested that the MDEQ TSG form a subcommittee to conduct a review. In response, the TSG formed a subcommittee consisting of the following TSG members:
Mary Lee Hultin, MDEQ, Air Quality Division (AQD) Shannon Briggs, MDEQ, Water Bureau (WB) Margaret Sadoff, MDEQ, AQD Linda D. Dykema, Michigan Department of Community Health (MDCH) Brian Hughes, Michigan Department of Agriculture (MDA)
The charge to the TSG CAFO subcommittee was to answer the following questions:
1. What chemicals have been detected in air emissions from CAFOs? 2. What are the human health effects of exposure to these chemicals? 3. What levels of these chemicals in air are not expected to cause adverse human health
effects? 4. What groups of people (e.g., asthmatics, the young or elderly) may be more sensitive to
exposure to these chemicals? In addition, the subcommittee was asked to investigate any additional concerns that arose during the review process. The subcommittee performed an electronic search of the existing literature, identified relevant publications, and obtained copies of these documents, which are now stored in the MDEQ Toxicology Library in Constitution Hall. This report provides the requested summary of the chemical characteristics of these compounds, levels of concern in the environment, and potential human health effects.
Chemicals Associated with CAFOs A review of the available scientific literature indicates that emissions from CAFOs include gases and vapors, particulate matter, and odors. Very little monitoring data are available from large-

CAFO Chemicals May 10, 2006
Page 2
scale livestock operations, however, the U.S. Environmental Protection Agency (EPA) is beginning efforts to monitor air quality at CAFOs throughout the United States. As of November 2005, 135 Michigan farms had signed agreements to participate in the monitoring study. EPA has also developed some model scenarios that estimate emissions of ammonia, nitrous oxide, hydrogen sulfide, volatile organic chemicals and particulate matter based on different types of confinement facilities, manure collection systems and storage practices (EPA 2001). Gases and vapors are emitted from animal containment buildings, manure piles and lagoons, and from land application of waste materials. These compounds result from the microbial degradation of urine and feces. While the complete list of gases and vapors emitted from CAFOs is long, those most commonly found include ammonia, hydrogen sulfide and methane (EHSRC 2002). Particulate matter emitted from CAFOs consists of fecal matter, feed materials, skin cells, and products of microbial degradation of feces and urine. Bioaerosols, which consist of particles of biological origin that are suspended in the air, are a major component of particulate matter from CAFOs. Endotoxins, which are produced by Gram-negative bacteria, are also a component of CAFO particulate matter (EHSRC 2002). Odors associated with CAFOs can be a nuisance and may induce adverse health effects. Compounds associated with CAFOs odors include hydrogen sulfide (rotten egg smell) as well as several volatile fatty acids (rotting vegetables, rancid butter, and fecal smell) (EHSRC 2002). While a multitude of compounds may be emitted from CAFOs, the type and intensity of emissions will vary between operations. This report will focus on the following emissions that have most often been associated with CAFOs.
• Ammonia and nitrogen containing compounds (NH3 and N2O) • Hydrogen Sulfide (H2S) • Methane • Particulate Matter (PM) including endotoxins • Pathogens • Volatile Organic Chemicals (VOCs) and Volatile Fatty Acids (VFAs)
The likelihood of adverse health effects following exposure to these or any other hazardous compounds is dependant on the inherent toxicity of the compound, the intensity and duration of exposure, and individual susceptibility. Acute exposures (high intensity over a short duration) and chronic exposures (lower intensity over a longer period of time) may produce different health effects and therefore, health protective values will differ depending on the exposure situation.
Explanation of Health Benchmarks and Regulatory Levels Health benchmarks and regulatory levels for chemical of concern at CAFOs will be discussed throughout this report. These include:
CAFO Chemicals May 10, 2006
Page 3
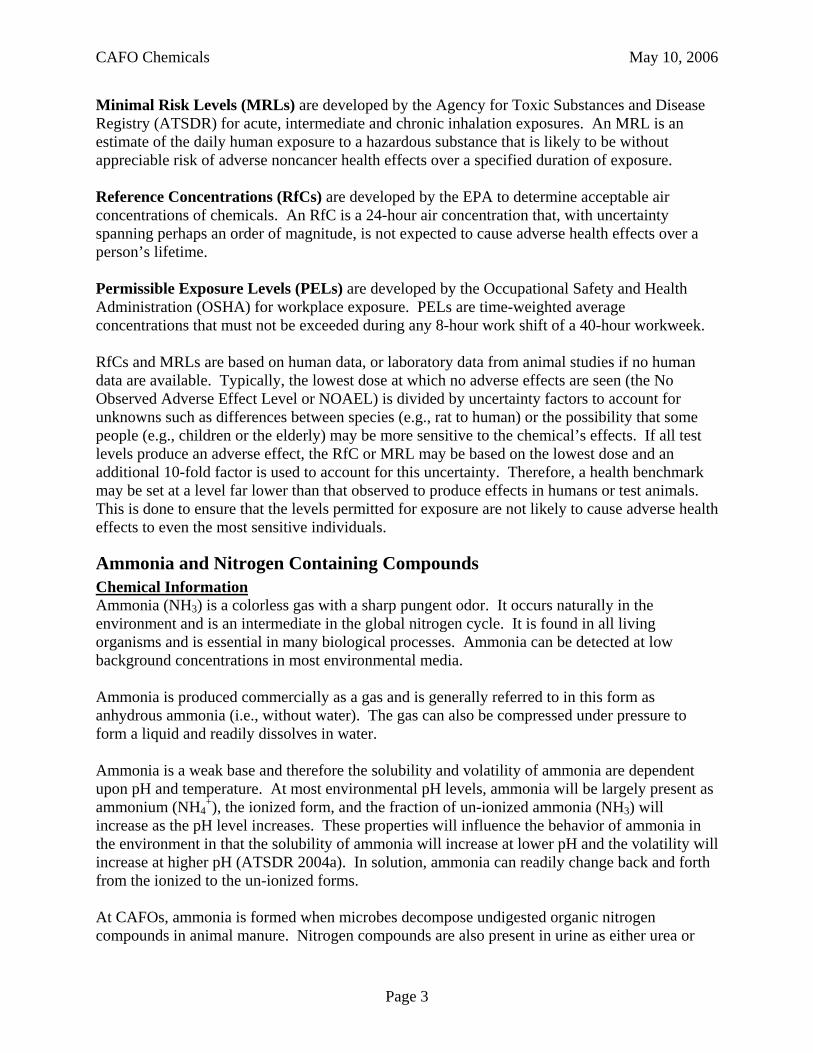
Minimal Risk Levels (MRLs) are developed by the Agency for Toxic Substances and Disease Registry (ATSDR) for acute, intermediate and chronic inhalation exposures. An MRL is an estimate of the daily human exposure to a hazardous substance that is likely to be without appreciable risk of adverse noncancer health effects over a specified duration of exposure. Reference Concentrations (RfCs) are developed by the EPA to determine acceptable air concentrations of chemicals. An RfC is a 24-hour air concentration that, with uncertainty spanning perhaps an order of magnitude, is not expected to cause adverse health effects over a person’s lifetime. Permissible Exposure Levels (PELs) are developed by the Occupational Safety and Health Administration (OSHA) for workplace exposure. PELs are time-weighted average concentrations that must not be exceeded during any 8-hour work shift of a 40-hour workweek. RfCs and MRLs are based on human data, or laboratory data from animal studies if no human data are available. Typically, the lowest dose at which no adverse effects are seen (the No Observed Adverse Effect Level or NOAEL) is divided by uncertainty factors to account for unknowns such as differences between species (e.g., rat to human) or the possibility that some people (e.g., children or the elderly) may be more sensitive to the chemical’s effects. If all test levels produce an adverse effect, the RfC or MRL may be based on the lowest dose and an additional 10-fold factor is used to account for this uncertainty. Therefore, a health benchmark may be set at a level far lower than that observed to produce effects in humans or test animals. This is done to ensure that the levels permitted for exposure are not likely to cause adverse health effects to even the most sensitive individuals.
Ammonia and Nitrogen Containing Compounds
Chemical Information Ammonia (NH3) is a colorless gas with a sharp pungent odor. It occurs naturally in the environment and is an intermediate in the global nitrogen cycle. It is found in all living organisms and is essential in many biological processes. Ammonia can be detected at low background concentrations in most environmental media. Ammonia is produced commercially as a gas and is generally referred to in this form as anhydrous ammonia (i.e., without water). The gas can also be compressed under pressure to form a liquid and readily dissolves in water. Ammonia is a weak base and therefore the solubility and volatility of ammonia are dependent upon pH and temperature. At most environmental pH levels, ammonia will be largely present as ammonium (NH4
+), the ionized form, and the fraction of un-ionized ammonia (NH3) will increase as the pH level increases. These properties will influence the behavior of ammonia in the environment in that the solubility of ammonia will increase at lower pH and the volatility will increase at higher pH (ATSDR 2004a). In solution, ammonia can readily change back and forth from the ionized to the un-ionized forms. At CAFOs, ammonia is formed when microbes decompose undigested organic nitrogen compounds in animal manure. Nitrogen compounds are also present in urine as either urea or

CAFO Chemicals May 10, 2006
Page 4
uric acid which hydrolyzes to form ammonia soon after excretion. Volatilization of ammonia from CAFOs will depend on the concentration of ammonia in the waste as well as pH and temperature. At a pH of 7.5 to 8.5, which is characteristic of most dry manures, ammonia will be rapidly volatilized. Liquid manure tends to have lower pHs and therefore less ammonia is emitted, however, because ammonia is highly soluble in water, it will be emitted to the air as the liquid waste dries (EPA 2001). Nitrous oxide (N2O) may also be emitted from CAFOs under some conditions. N2O is a colorless, almost odorless gas that has been used as an anesthetic in clinical dentistry and medicine, and as a charger in whipped cream dispensers. It is also a greenhouse gas. N2O may be emitted following application of manure to poorly drained soils where anaerobic conditions favor denitrification and retard leaching of nitrates to the groundwater. In addition, land application of manure outside the growing season or at rates higher than can be used by crops will favor N2O emissions (EPA 2001). Emission rates for N2O from CAFOs are likely to be far lower than for ammonia.
Odor Ammonia has a sharp, irritating odor. Most people are familiar with the odor of ammonia in smelling salts or household cleaning agents. Reported odor thresholds in air ranged from 0.04 to 53 parts per million (ppm). A geometric mean air odor threshold of 17 ppm has been reported for ammonia based on meta-analysis of published values (AIHA 1989). An odor threshold of 1.5 ppm has been reported for water (ATSDR 2004a). Health Effects and Levels of Concern Mode of Action Ammonia is a strong respiratory irritant and can cause chemical burns to the respiratory tract, skin, and eyes. Ammonia dissolves in the water contained in skin, mucous membranes, and eyes to form ammonium hydroxide, a weak base that disrupts cell membrane functions and extracts water from the cells causing irritation, inflammation, and cell death (ATSDR 2004a). Ammonia may also reduce the ability of cilia to clear dust and other irritants from the upper respiratory tract (Earth Tech 2001). Occupational Exposure No deaths have been reported as a result of exposure to ammonia emitted from CAFO operations. Most acute exposure to high levels of ammonia occurs as a result of the accidental release of anhydrous ammonia from a gas cylinder or from refrigerant systems. Exposure to 5,000 to 10,000 parts per million (ppm) is rapidly lethal in humans. Exposure to levels of 2,500 to 4,500 ppm is lethal in about 30 minutes. The cause of death is airway obstruction as a result of pulmonary edema and chemical burns to the respiratory tract, eyes and skin. Exposure to high concentrations for short periods of time may result in chronic lung disease (ATSDR 2004a).
Severe cough and increased mucous production result from exposure to ammonia at moderate concentrations from 50 to 150 ppm. Exposure to concentrations greater than 150 ppm may cause permanent scarring of the upper and lower respiratory passages. Reactive airways dysfunction syndrome (RADS) may result from exposures at these levels (EHSRC 2002). RADS is an

CAFO Chemicals May 10, 2006
Page 5
inflammatory disorder of the airways characterized by cough, wheezing and difficulty breathing (bronchial hyperactivity) caused by inhalation of a high concentration of irritating fumes, gases or smoke. It is also known as “irritant induced” asthma. The illness differs from bronchial and occupational asthma due to the rapid onset of symptoms resulting from a very specific single exposure to a substance in people with no apparent preexisting allergy or sensitivity to that substance. Usually the onset of symptoms occurs within 24 hours after the exposure and can persist for several months.
Exposures to levels of 100 ppm ammonia or less in air leads to irritation of eyes, sinuses, and skin. In the agricultural setting, the effects of ammonia exposure may exacerbate the irritant effects of inhaled particulates (EHSRC 2002). People who are hyperreactive to other respiratory irritants or who are asthmatic may be more susceptible to the respiratory effects of ammonia. A study of workers chronically exposed to airborne ammonia indicated that ammonia inhalation can exacerbate existing symptoms such as cough, wheeze, nasal complaints, eye irritation, throat discomfort, and skin irritation (Ballal et al. 1998 as reported in ATSDR 2004a). Epidemiological Studies Very few studies of the adverse effects of exposure to ammonia have been conducted outside of an industrial setting. Several studies have investigated effects in workers in animal confinement buildings. While all studies report an increase in respiratory symptoms, it cannot be determined if ammonia produced these effects, if other compounds produced the effects, or if the effects are a result of combined exposure to all air contaminants inside the buildings (ATSDR 2004a). In one laboratory study, human subjects exposed to 50 ppm ammonia experienced nasal irritation for the first week of exposure, but developed a tolerance for the effects over the remaining six weeks of exposure. People exposed to 25 ppm did not experience any effects. No effects were found on pulmonary function tests (ATSDR 2004a). NH3 Expsoure Levels and Associated Health Effects The table below lists some reported health effects at various exposure levels compiled from the literature:
Ammonia Effects mg/m3 ppm Detectable odor 0.028 to 37 0.04 to 53 Eye, nasal and respiratory irritation 35 to 70 50 to 100 Severe cough 35 to 105 50 to 150 Reactive airway dysfunction 105 150 Lethal in 30 minutes 1,750 to 3,150 2,500 to 4,500 Immediately lethal 3,500 to 7,000 5,000 to 10,000
Conversion Factor: 1 ppm = 0.7 mg/m3
mg/m3 = milligrams per cubic meter of air Health Benchmarks The severity of health effects following exposure to ammonia depends on the concentration present and the length of exposure. The ATSDR has established MRLs for ammonia for acute and chronic inhalation exposures. The MRL for acute exposure is based on local irritation effects to the eyes, nose and throat in exposed humans. An uncertainty factor of 30 [3 for use of

CAFO Chemicals May 10, 2006
Page 6
a lowest observed adverse effect level (LOAEL) and 10 for human variability] was applied to an exposure level of 50 ppm over 2 hours for the derivation of the acute MRL of 1.7 ppm (1.2 mg/m3). The MRL for chronic exposure is based on altered lung function in exposed workers. An uncertainty factor of 30 (10 for human variability and 3 for lack of reproductive and developmental studies) was applied to an exposure level of 9.2 ppm (the mean time weighted average exposure concentration) adjusted for continuous exposure (9.2 ppm x 8/24 hours x 5/7 days) to derive the chronic MRL of 0.1 ppm. The EPA, using the same study as for the ATSDR MRL, established an inhalation reference concentration (RfC) of 0.1 mg/m3 (0.1 ppm).
Hydrogen Sulfide Chemical Information Hydrogen sulfide (H2S) is a gas arising from storage, handling and decomposition of animal waste from CAFOs. H2S is produced by anaerobic bacterial decomposition of protein and other sulfur containing organic matter. It is heavier than air and can accumulate in manure pits, holding tanks and other low areas in a livestock facility. While the concentration of H2S found in closed animal facilities is not usually harmful (<10 ppm), the release of this gas from manure slurry agitation may produce concentrations up to 1,000 ppm or higher. (Lillie, 1972, Carson, 1998 and Donham, 2000 as cited in EHSRC, 2002). When H2S is released as a gas, it remains in the atmosphere for an average of 18 hours. During this time, H2S can change into sulfur dioxide and sulfuric acid. The amount of H2S in the air in the United States ranges from 0.11-0.33 parts per billion (ppb) (one thousandth of a ppm) (ATSDR 2004b). Odor H2S has the characteristic odor of rotten eggs and has a very low odor threshold (0.008ppm). As the concentration increases, the intensity of odor increases only modestly. Concentrations above 100-150 ppm actually begin to deaden the sense of smell (Amoore and Hautala 1983). H2S monitoring equipment is, therefore, mandatory in occupational settings (EHSRC 2002). Health Effects and Levels of Concern H2S is an irritant gas capable of producing local inflammation of the moist membranes of the eye and respiratory tract. The irritant action is fairly uniform through the respiratory tract, although deeper pulmonary structures suffer the greatest damage, often producing pulmonary edema (EHSRC 2002). Subchronic exposure in rats via inhalation resulted in nasal lesions, including olfactory neuron loss and hyperplasia (Brenneman et al. 2000). In another rodent study, body weight gain depression and feed consumption reduction were seen. Two reproductive studies indicate the possibility of developmental olfactory neuron loss. However, these effects would be adequately protected at levels below the EPA RfC (0.002 mg/m3). Critical effects, therefore, are nasal lesions due to irritant action and adult olfactory neuron loss. Mode of action H2S is an asphyxiant at the cellular level. H2S is lipid soluble and rapidly metabolized in the body. Toxic effects of H2S are related to concentration of exposure more so than duration of exposure. H2S is not believed to have cumulative effects but rather that there is some threshold

CAFO Chemicals May 10, 2006
Page 7
which must be exceeded to achieve toxicity. Conversely, there is some threshold limit below which there are no adverse effects. Occupational H2S has been implicated in a number of deaths when encountered in confined spaces in agricultural settings. Very high exposures to H2S, which can occur during pit agitation, may result in death from asphyxia and respiratory arrest; those who survive such high dose exposures often develop reactive airways syndrome, bronchiolitis obliterans and severe respiratory impairment (EHSRC 2002). Epidemiological studies Studies support the view that peak concentration is more important for triggering health effects than average daily concentration. Experimental exposure to healthy volunteers showed the following results: inhalation of 5 ppm by exercising men led to a significant decrease in the concentration of citrate synthase, a marker of aerobic metabolism, in muscle biopsy tissue. Levels of 10 ppm caused a significant decline in maximal oxygen uptake and associated increase in blood lactate in exercising men and women (Bhambani, et al, 1996a, as cited in EHSRC 2002). Asthmatics exposed to 2 ppm hydrogen sulfide for 30 minutes showed changes in pulmonary function tests that indicated bronchial obstruction (Jappienen et al. 1990 as reported in ATSDR 2004b). Asthmatic symptoms may also be exacerbated by odors and this may account for the effects observed in asthmatics following exposure to hydrogen sulfide (ATSDR 2004b). Few studies (Kilburn et al, 1997, 2003; Hirsch, 2002) report human health effects from chronic, low level exposures to H2S (not specifically from CAFOs). Chronic effects reported in these studies (retrospective occupational) include impaired sense of smell, problems with balance, visual acuity, recall and memory. However, exposure concentrations were not known or reported in these studies. Neurological effects such as these have also been reported as chronic effects after high dose H2S poisoning (loss of consciousness). Chronic studies in rats reported no neurotoxic effects from long term exposures up to 50-80 ppm H2S. H2S Exposure Levels and Associated Health Effects The table below lists some reported health effects at various exposure levels compiled from the literature (based on all sources, mainly industrial):
H2S Effects mg/m3 ppm Detectable odor 0.011 to 0.14 0.008 to 0.1 Ambient air levels in the U.S. 1.5 to 4.6 x 10⁻⁴ 1.1 to 3.3 x 10⁻⁴
Offensive odor, headache 0.35 to 0.42 0.25 to 0.3 Very offensive odor 4.2 to 7 3 to 5 Adverse changes in exercising adults 7 to 14 5 to10 Eye and respiratory irritation 28 to 140 20 to100 Loss of sense of smell 210 to 350 150 to 250 Loss of consciousness 700 to 1,400 500 to 1,000 Difficulty breathing, collapse, death 1,400 to 2,800 1,000 to 2,000
Conversion Factor: 1 ppm = 1.4 mg/m3

CAFO Chemicals May 10, 2006
Page 8
Methane Chemical Information Methane is a colorless, odorless gas. It is highly flammable and has a lower explosive limit of 50,000 ppm (5%). Methane is not toxic below this lower explosive limit but acts as an asphyxiant at concentrations high enough to displace oxygen to below 18% of ambient air. Methane displaces oxygen in air when it reaches concentrations of 140,000 ppm (14%). (Canadian Centre for Occupational Health and Safety 2006). The typical residence time for methane in the planetary boundary is approximately 8 years. [Note: An atmospheric residence time is the time required to reduce concentration to 1/e (or 0.37) of the original concentration. This is different from half-life.] The primary degradation product is carbon monoxide (NRC 2002). Methane is produced by the microbial degradation of organic matter under anaerobic conditions. The primary source of methane in agriculture is from the digestive processes of ruminant animals and the storage, treatment and handling of manure. Anaerobic decomposition of manure yields the following approximate percentages of gases: methane (60%), carbon dioxide (40%), ammonia, hydrogen sulfide, various other trace gases and odorants (EarthTech 2001). Manure handled as solids is generally not a concern for methane production due to low moisture and adequate oxygenation which precludes anaerobic activity and allows for oxidation of any methane generated. Since methane is insoluble in water, it volatilizes from solution as rapidly as it is generated. This means that land application of manure is not a source of methane emissions because the methane will have already volatilized. Methanogen (microbial) activity also produces carbon dioxide, therefore methane emissions correlate well with carbon dioxide emissions. The mixture of these two gases is often referred to as biogas (EPA 2001). Methane emissions from CAFOs do not pose a health threat to surrounding communities, however, methane is a greenhouse gas that contributes significantly to regional haze and to global climate change. For example, an adult cow produces 80 to 120 kg of methane annually, on average. In the U.S., livestock emissions contribute about 18.5% to the total anthropogenic sources of methane. (NRC 2003). Iowa identified methane from CAFOs as a significant contributor to greenhouse gas emissions in that state, with 25% of the total methane contribution coming from manure management (EHSRC 2002). Odor Methane is odorless. Health Effects and Levels of Concern Human health effects from off-site concentrations of methane are not expected. Control techniques generally involve good manure management practices. Specific control measures include covering lagoons or oxidation of liquid manure by aeration or use of chemical oxidants (EPA 2001). The potential fuel value of this effluent has prompted some large facilities to invest in equipment to recover and use this biogas for on-site heating (EarthTech 2001).
CAFO Chemicals May 10, 2006
Page 9
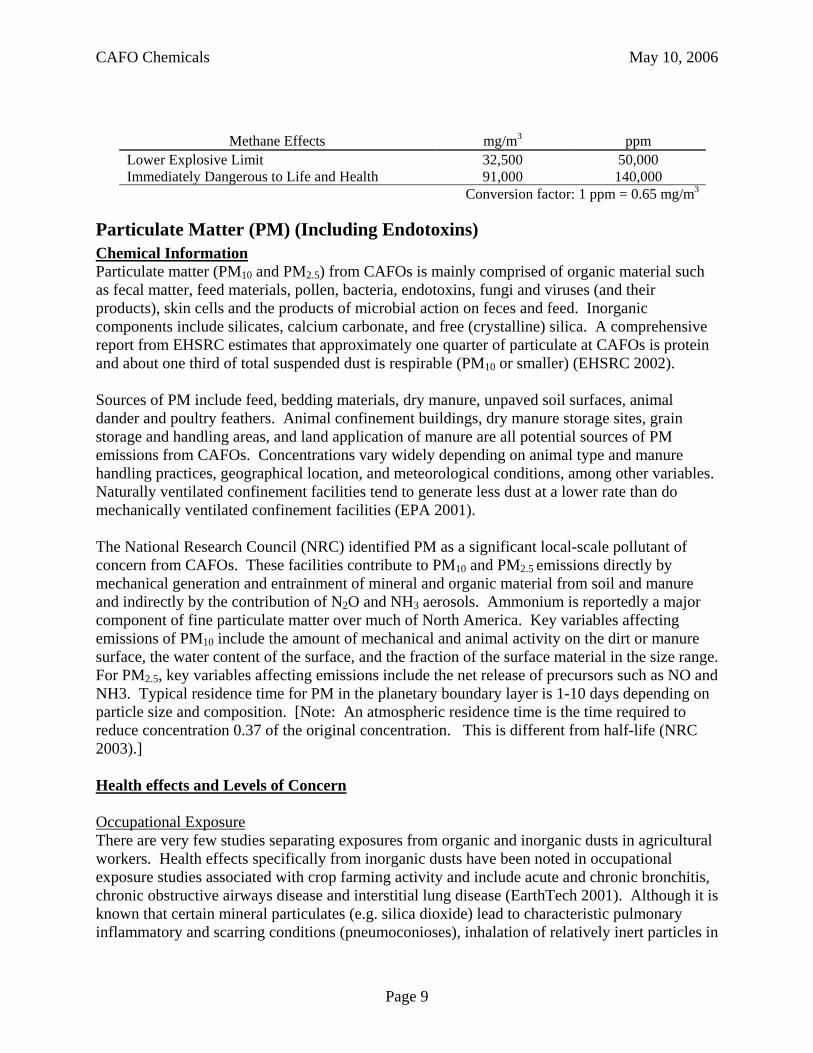
Methane Effects mg/m3 ppm Lower Explosive Limit 32,500 50,000 Immediately Dangerous to Life and Health 91,000 140,000
Conversion factor: 1 ppm = 0.65 mg/m3
Particulate Matter (PM) (Including Endotoxins) Chemical Information Particulate matter (PM10 and PM2.5) from CAFOs is mainly comprised of organic material such as fecal matter, feed materials, pollen, bacteria, endotoxins, fungi and viruses (and their products), skin cells and the products of microbial action on feces and feed. Inorganic components include silicates, calcium carbonate, and free (crystalline) silica. A comprehensive report from EHSRC estimates that approximately one quarter of particulate at CAFOs is protein and about one third of total suspended dust is respirable (PM10 or smaller) (EHSRC 2002). Sources of PM include feed, bedding materials, dry manure, unpaved soil surfaces, animal dander and poultry feathers. Animal confinement buildings, dry manure storage sites, grain storage and handling areas, and land application of manure are all potential sources of PM emissions from CAFOs. Concentrations vary widely depending on animal type and manure handling practices, geographical location, and meteorological conditions, among other variables. Naturally ventilated confinement facilities tend to generate less dust at a lower rate than do mechanically ventilated confinement facilities (EPA 2001). The National Research Council (NRC) identified PM as a significant local-scale pollutant of concern from CAFOs. These facilities contribute to PM10 and PM2.5 emissions directly by mechanical generation and entrainment of mineral and organic material from soil and manure and indirectly by the contribution of N2O and NH3 aerosols. Ammonium is reportedly a major component of fine particulate matter over much of North America. Key variables affecting emissions of PM10 include the amount of mechanical and animal activity on the dirt or manure surface, the water content of the surface, and the fraction of the surface material in the size range. For PM2.5, key variables affecting emissions include the net release of precursors such as NO and NH3. Typical residence time for PM in the planetary boundary layer is 1-10 days depending on particle size and composition. [Note: An atmospheric residence time is the time required to reduce concentration 0.37 of the original concentration. This is different from half-life (NRC 2003).] Health effects and Levels of Concern Occupational Exposure There are very few studies separating exposures from organic and inorganic dusts in agricultural workers. Health effects specifically from inorganic dusts have been noted in occupational exposure studies associated with crop farming activity and include acute and chronic bronchitis, chronic obstructive airways disease and interstitial lung disease (EarthTech 2001). Although it is known that certain mineral particulates (e.g. silica dioxide) lead to characteristic pulmonary inflammatory and scarring conditions (pneumoconioses), inhalation of relatively inert particles in

CAFO Chemicals May 10, 2006
Page 10
the respirable range can also cause chronic respiratory symptoms and progressive declines in lung function (EHSRC 2002). Endotoxins are lipopolysaccharides that are products of the bacterial cell walls of gram-negative bacteria and are present in CAFO dusts. Endotoxins are largely responsible for the adverse health effects resulting from exposure to agricultural dusts. Worker exposures to endotoxin-rich dusts from agriculture operations have shown declines in lung function over time. Organic dust toxic syndrome (ODTS) has been reported by 33% of swine producers following exposure to a higher than usual dust load (e.g. moving and sorting hogs). ODTS symptoms are flu-like and include headache, joint and muscle pain, fever, fatigue, weakness, cough, shortness of breath, and irritation (EHSRC 2002). Asthmatics can become sensitized to allergens in grain dust, dust mites, animal dander, pollen grains, and other components of PM (EPA 2001). A few studies have examined the interactive effects of PM with other toxic emissions from farms. Exposure to PM and endotoxin show the strongest and most consistent dose-response relationship with respect to respiratory effects and declines in lung function (Donham et al. 1989, 1995; Reynolds et al. 1996; EPA 2001). Interactive effects between PM and/or endotoxin and/or ammonia have also been examined. Exposure-response studies in poultry workers revealed prominent interaction between NH3 and PM (Donham et al. 2000, 2002). Exposure concentrations to NH3 and PM individually were less than one-half of occupational safety standards, but adverse respiratory effects were 53-156% greater than individual effects. A likely mechanism for this synergism is that ammonia can damage clearance mechanisms (cilia) in the upper respiratory tract thereby increasing inhalation of particles. In another study, a cohort of 171 pig farmers was followed over a 3 year period to assess the long-term development of bronchial hyperresponsiveness and inflammation of the airways. Long-term average exposure to inhalable dust and endotoxin was determined by personal monitoring using data on farm characteristics and activities. Time-weighted personal exposure to ammonia was also measured. Based on associations between ammonia exposure and lung function decrements over a work shift, a threshold of 5.4 mg/m3 was recommended for ammonia in confinement areas. A lower occupational threshold of 2.8 mg/m3 for organic dusts has been proposed. Observed health effects in this study occurred at an average exposure level of 2.6 mg/m3 swine dust which supports this proposed occupational standard (Vogelzang et al. 2000). Donham et al. (2000) investigated respiratory effects in 257 poultry workers exposed to total and respirable dust, endotoxin and ammonia. Relationships between exposure and response were studied by correlation and multiple regression. There were statistically significant dose-response relationships between exposures and pulmonary function decrements over a work shift. Exposure concentrations associated with significant pulmonary functions decrements were reported as 2.4 mg/m3 total dust, 0.16 mg/m3 respirable dust, 614 endotoxin units per cubit meter of air (EU/m3) total endotoxin, 0.35 EU/m3 respirable endotoxin, and 12 ppm ammonia (Donham et al. 2000). Epidemiological Studies One non-occupational human study exposed six healthy subjects and eight subjects with mild asthma to ammonia (16-25 ppm) and/or endotoxin-rich grain dust (4 mg/m3 total; 1 mg/m3 respirable; 4 ug/m3 endotoxin) in three 30 minute sessions over the course of 3 weeks. There

CAFO Chemicals May 10, 2006
Page 11
was no significant change in healthy subjects following any of the exposure conditions. In asthmatics, a significant transient decrease in lung function and increased bronchial hyperactivity was induced by grain dust alone and by the combination of ammonia and grain dust exposure. Decreased lung function from the combined exposure scenario was sustained over a longer period of time (decreased lung function sustained for 60 minutes compared to 30 minutes when exposed to grain dust alone). No significant effects were noted in asthmatics upon exposure to ammonia alone. Failure to detect the synergistic effects noted in occupational studies may be due to the lower exposure concentrations utilized and the lower relative humidity (< 20%) in the experimental conditions (Sigurdarson et al. 2004). Considerable uncertainty exists with regard to the off-site transport and bioactivity of particulates, although there is potential for dispersion when liquid manure is sprayed on fields or when dry manure is transported off-site. One study conducted to determine the safe proximity of a pig nursery to an adult hog confinement facility reported that viable bioaerosol particles were carried as far as 200 meters (0.12 miles). (Homes et al., 2005) PM Exposure Levels and Associated Health Effects Chronic exposure to elevated levels of PM10 and PM2.5 and acute exposure to higher spikes of PM (particularly fine and ultra fine) from any source have been linked to various health endpoints in numerous studies. Documented adverse health impacts include premature mortality, exacerbation of asthma and other chronic respiratory conditions, and adverse cardiovascular outcomes. Effects may be due to the nature (size) and/or composition of the particle or interactive effects with other pollutants. PM, especially fine particulate, has inherent health effect regardless of the nature of the particle (because of induction of inflammatory responses) but particulates also act as carriers of toxic components (e.g., NH3, bacteria, endotoxins). Much of the research and focus has been on PM2.5 which has greater potential for deposition in small airways and therefore greater bioavailability.
Particulate Effects Ambient Concentration CAFO Related Decreased lung function in poultry workers 2.4 mg/m3 total dusta Decreased lung function in poultry workers 0.16 mg/m3 respirable dusta Non CAFO Related 2.5 to 5% increased mortality* 0.05 mg/m3 PM10 increaseb 3% increased mortality* 0.025 mg/m3 PM2.5 increaseb Reversible blood and immune system effects 0.023 to 0.311 mg/m3c
(Donham et al. 2000a, EPA 2003bb, Ghio et al. 2000c) * For cardiovascular effects, there may be no threshold.
Pathogens Chemical Information Pathogens are biological agents that occur naturally and can cause disease. Some microorganisms found in bioaerosols emanating from CAFOs are pathogenic in themselves and some can serve as vehicles for other pathogens. Pathogens at CAFOs can be spread from animal to animal, from human to human, and from direct contact between human and production animal (EPA 2004; Valcour et al. 2002). Manure is the greatest source of pathogenic contamination and has the potential to enter air, surface water, or groundwater sources if not properly managed.

CAFO Chemicals May 10, 2006
Page 12
It has been well documented that the air within swine CAFOs is highly contaminated with bacteria, yeasts, and molds (Chapin et al. 2005). Mean total bacteria concentration can range from 104 to 107 colony-forming units per cubic meter of filtered air (CFU/m3) (Clark et al., 1983; Cormier et al., 1990; Crook et al. 1991; Predicala et al. 2002). Health Effects and Levels of Concern The incidence of pathogens present in manure will vary. A list of pathogens that cause severe diseases and are most prevalent in manure is provided in the table below.
Pathogen Human Disease Animal Source Camypylobacter Campylobacteriosis;
Guillain-Barre syndrome; reactive arthritis
Swine, poultry, and cattle
Cryptosporidium parvum Cryptosporosis Cattle Escherichia coli 0157:H7 Hemorrhagic colitis;
Hemolytic uremic syndrome (HUS); Enterohaemorrhagic colibacillosis
Cattle
Giardia Giardiasis Cattle Listeria monocytogenes Listeriosis Cattle Salmonella Salmonellosis Swine, poultry, and cattle Yersinia enterocolitica Yersiniosis Swine
(Buzby 2001; Hill 2003; Mead et al. 1999; EPA 2004)
The use of nontherapeutic levels of antibiotics as growth promoters in animal production has been shown to develop drug resistance in bacteria. Retail meat products, surface water, and groundwater contaminated with animal waste have been shown to be routes of exposure for antibiotic-resistant bacteria to humans. Inhalation of air from animal facilities is also a potential route of exposure for antibiotic-resistant bacteria (Chapin et al. 2005).
VOCs and Volatile Fatty Acids Chemical Information Volatile organic contaminants (VOCs) and volatile fatty acids (VFAs) emitted from concentrated animal feeding operations constitute a mixture of chemicals comprised of various acids, esters, alcohols, aldehydes, ketones, halogenates, amines, and hydrocarbons (Rabaud et al. 2003). Researchers have suggested that between 100 to 330 different VOCs/VFAs are generated depending on the type of animals and the practices found at each concentrated animal feeding operation (Schiffman et al. 2001, Powers and Bastyr 2004). Most of the gases are present in very low amounts with only a few contributing to odor. The concentration of VOCs at concentrated animal facilities is dependant on climatic conditions and is a direct result of incomplete anaerobic digestion. When the activity of the methanogenic bacteria is not inhibited, virtually all of the VOCs are metabolized to simpler compounds and the potential for VOC emissions is nominal. The inhibition of methane formation results in a VOC buildup and subsequent volatilization to the air. VOC emissions will be minimal from a properly

CAFO Chemicals May 10, 2006
Page 13
designed and operated stabilization process and the associated manure application site. However, VOC emissions will be higher from storage tanks, ponds, overloaded anaerobic lagoons and associated land application sites (EPA 2001). Odor The VOCs and VFAs that contribute to odor are volatile acids such as acetic, propionic, formic, and valeric acids and indoles, phenols, volatile amines, methyl mercaptan, and skatoles. The compounds can be further divided into those that have irritant effects on the respiratory system and those that are sensory irritants. Sensory irritants are those that contribute to odor problems and as such may elicit certain physical and psychological responses. However, it should be noted that low odor thresholds exist for many of these compounds; therefore, compounds with the most intense odor signatures may not be present at the highest concentrations. Odors emanating from CAFOs can be a nuisance and a concern for near-by communities. The table below provides some examples of odors that are associated with CAFO emissions.
Chemical Smell Hydrogen sulfide Rotten eggs Dimethyl sulfide Rotting vegetables Butyric, isibutyric acid Rancid butter Valeric acid Putrid, fecal smell Isovaleric acid Stinky feet Skatole Fecal, nauseating Indole Intense fecal
(EHSRC 2002) Health Effects and Levels of Concern Due to the variation and complexity of the VOC and VFA mixture, a toxicological evaluation of the VOCs and VFAs resulting from CAFOs has not been conducted. Occupational Studies Several reviews have been conducted regarding the health of those working at CAFOs. No studies were found that measured VOCs and VFAs in relation to occupational health effects. Furthermore, the majority of the studies were conducted on swine operations. However, it is well established that swine confinement workers report more chronic bronchitis and asthma. Reported symptoms include wheezing, coughing, sinusitis, fever, chest tightness, nasal irritation, phlegm, throat irritations, and sneezing (Cole et al. 2000). Human subjects exposed to diluted air samples from swine operations were significantly more likely to report eye irritation, nausea, and headaches than controls (Schiffman et al. 2005).
Community Exposure to CAFO Emissions Based on respiratory effects and declines in respiratory function in farm workers (swine and poultry most extensively reported), there are clearly human health effects from exposure to complex mixtures of particulates, gases and vapors from CAFO emissions. Reported health complaints include sinusitis, chronic bronchitis, irritation of nose and throat, headaches, muscle aches and pains. However, it is difficult to extrapolate these findings in healthy workers exposed to high concentrations to ambient exposures which differ in composition and concentration as

CAFO Chemicals May 10, 2006
Page 14
they move from the source and generally affect more susceptible subpopulations (EHSRC 2002). Sensitive subpopulations such as children and infants, the elderly, and people with existing respiratory impairment are likely to be more susceptible to the health effects associated with CAFO emissions. Several community studies have been conducted to determine the association between various health effects and living near a CAFO:
• Schiffman et al. (1995) studied a group of 44 volunteers who recorded the psychological impacts of odor emanating from a swine facility. These subjects recorded more tension, depression, anger, fatigue, confusion and less vigor than their matched controls.
• Thu et al. (1997) examined the physical and psychological health data from 18 residents living within 2 miles of a swine containment facility. Those living near a large-scale swine operation experienced increased rates of respiratory problems, eye irritation, nausea, weakness, and chest tightness. However, the evidence did not suggest increased rates of anxiety or depression.
• Avery et al. (2004) found that increased odor intensity correlated with an increase in secretory IgA (a psychophysiologically mediated immune response), however the number of participants was small (n=15).
• Wing and Wolf (2000) studied three rural communities in North Carolina, one near a hog operation, one near two cattle operations, and another in an area without livestock operations. The researchers completed 155 interviews. Those living near the hog operation reported increased headaches, runny nose, sore throat, excessive coughing, diarrhea, and burning eyes. These respondents also reported greatly reduced quality of life measurements.
• A more recent study of 155 residents near a swine operation found a significant increase in the frequency of headaches, excessive coughing, burning eyes, and diarrhea as compared to a control group (NRC 2002). Other studies exist but it is clear that VOCs and VFAs can be sensory and respiratory irritants eliciting physical and psychological effects to varying degrees. As a caveat to these studies, the National Resource Council states, “Caution must be exercised in interpreting the studies because environmental exposure data were not reported.” (Powers and Bastyr 2004). Furthermore, symptoms reported by individuals who are near environmental odor sources are acute in onset, self-limited in duration, and subjective (Shusterman 1992).
• An epidemiological study examined a cohort of rural children in Iowa to determine an association, if any, between farm and other environmental risk factors and several asthma outcomes. The study found a high prevalence of asthma health outcomes among children living on farms that raise swine (44.1%, p = 0.03) and among children living on farms that raise swine and add antibiotics to feed (55.8%, p = 0.013) despite lower rates of hypersensitivity and allergy and significantly lower exposure to household tobacco smoke. For comparison, children who were not raised on farms had a prevalence of 33.6% (p = 0.1877) while those living on farms that did not raise swine had a prevalence of 26.2% (referent group, p-value not given). One major limitation of this study is that it

CAFO Chemicals May 10, 2006
Page 15
was not designed to quantitatively characterize the exposure scenario nor correlate exposures to dusts, gases, or odors from farms with asthma outcomes (Merchant et al. 2005).
None of the above studies concerning either community or occupational health measured VOC or VFA concentrations to establish a correlation with adverse health effects. Powers and Bastyr, (2004) correlated odor with several VOCs and hydrogen sulfide. Their findings indicate that the highest correlation existed with hydrogen sulfide followed by the compounds: 4-methyl phenol, phenol, 3-methyl indole, 1-decene, butyric acid, and 4-ethyl phenol. VOCs and VFAs are definite contributors to odor problems; however, they are highly variable from operation to operation and may not constitute the principle odorant from these facilities. A study from California’s San Joaquin Valley Air Pollution Control District proposed an emission factor for dairies at 19.3 lbs/head-yr of VOCs (Crow 2005). Regulatory activities for these compounds cannot be properly implemented until the nature, extent, and subsequent health effects around CAFOs are further documented.
Summary The TSG subcommittee conducted a review of the scientific literature concerning emissions from CAFOs and the related human health effects. The subcommittee identified ammonia, hydrogen sulfide, methane, particulate matter, endotoxins, pathogens, VOCs, and organic fatty acids as the most significant chemicals or constituents of CAFO emissions. Tables in the attached appendix provide various regulatory standards and/or health benchmarks for these compounds. It must be noted, however, that the values provided are for individual constituents and may not be protective of concomitant exposures that are likely in CAFO buildings or in near-by residential communities. Future efforts in Michigan should focus on characterizing levels of chemical and other emissions from CAFOs. While the chemicals discussed in this report have been associated with human health effects, it is not known if these emissions are present at levels that could be injurious to human health either at the fence line of the CAFO or at near-by residential properties. Several states and the EPA have conducted extensive reviews of the emissions and health effects associated with CAFOs. The MTT is referred to the documents listed below for a more detailed discussion of CAFO emissions and associated health effects. EarthTech. 2001. Final Technical Work Paper for Human Health Issues. Animal Agriculture
GEIS. Prepared for Minnesota Planning. Available: http://www.eqb.state.mn.us/geis/TWP_HumanHealth.pdf. [Accessed 23 February 2006].
EHSRC (Environmental Health Sciences Research Center). 2002. Iowa Concentrated Animal Feeding Operation Air Quality Study. Available: http://www.public-health.uiowa.edu/ehsrc/CAFOstudy.htm. [Accessed 23 June 2003].
EPA. 2001. Emission Standards Division. Office of Air Quality Planning and Standards. 2001. Emissions From Animal Feeding Operations. Draft. Available: http://www.epa.gov/ttn/chief/ap42/ch09/draft/draftanimalfeed.pdf. [Accessed 23 February 2006].

CAFO Chemicals May 10, 2006
Page 16
REFERENCES
AIHA. 1989. Odor Threshold for Chemicals with Established Occupational Health Standards. Fairfax, VA :American Industrial Hygiene Association.
Amoore, J.E., E. Hautala. 1983. Odor as an Aid to Chemical Safety: Odor Thresholds Compared With Threshold Limit Values and Volatilities for 214 Industrial Chemicals in Air and Water Dilution. J Appl Toxicol 3(6):272-90.
ATSDR. 2004a. Toxicological Profile for Ammonia (Update). Atlanta, GA: Public Health Service.
ATSDR. 2004b. Toxicological Profile for Hydrogen Sulfide (Update). Atlanta, GA: Public Health Service.
Avery, R.C., S. Wing, S.W. Marshall and S.S. Schiffman. 2004. Odor from Industrial Hog Farming Operations and Mucosal Immune Function in Neighbors. Arch Environ Health 59(2):101-8.
Bremmeman K.A., James R.A., Gross E.A., et al. 2000. Olfactory neuron loss in adult male CD rats following subchronic inhalation exposure to hydrogen sulfide. Toxicol Pathol 28(2):326-333.
Buzby, J.C. 2001. Children and Microbial Foodborne Illness. Food Review 24(2):32-7.
Canadian Centre for Occupational Health and Safety. Chemical Profile for Methane. Available: http://www.ccohs.ca/products/databases/cheminfoprofiles.html. [Accessed 23 February 2006].
Chapin, A., A. Rule, K. Gibson, T. Buckley and K. Schwab. 2005. Airborne Multidrug-Resistant Bacteria Isolated from a Concentrated Swine Feeding Operation. Environ Health Perspect 113(2):137-42.
Clark, S., R. Rylander and L. Larsson. 1983. Airborne Bacteria, Endotoxin and Fungi in Dust in Poultry and Swine Confinement Buildings. Am Ind Hyg Assoc J 44(7):537-41.
Cole, D., L. Todd and S. Wing. 2000. Concentrated Swine Feeding Operations and Public Health: a Review of Occupational and Community Health Effects. Environ Health Perspect 108(8):685-99.
Cormier, Y., G. Tremblay, A. Meriaux, G. Brochu and J. Lavoie. 1990. Airborne Microbial Contents in Two Types of Swine Confinement Buildings in Quebec. Am Ind Hyg Assoc J 51(6):304-9.
Crook, B., J.F. Robertson, S.A. Glass, E.M. Botheroyd, J. Lacey and M.D. Topping. 1991. Airborne Dust, Ammonia, Microorganisms, and Antigens in Pig Confinement Houses and the Respiratory Health of Exposed Farm Workers. Am Ind Hyg Assoc J 52(7):271-9.

CAFO Chemicals May 10, 2006
Page 17
Crow, D.L. 2005. Air Pollution Control Officer's Determination of VOC Emission Factors for Dairies. Available: http://www.valleyair.org/busind/pto/dpag/APCO%20Determination%20of%20EF_August%201_.pdf. [Accessed 23 February 2006 ].
Donham K., Haglind P., Peterson Y, Rylander R. and Belin L. 1989. Environmental And Health Studies Of Farm Workers In Swedish Swine Confinement Buildings. Br J Ind Med 46(1): 31-7.
Donham, K.J., D. Cumro and S. Reynolds. 2002. Synergistic Effects of Dust and Ammonia on the Occupational Health Effects of Poultry Production Workers. J Agromedicine 8(2):57-76.
Donham, K.J., D. Cumro, S.J. Reynolds and J.A. Merchant. 2000. Dose-Response Relationships Between Occupational Aerosol Exposures and Cross-Shift Declines of Lung Function in Poultry Workers: Recommendations for Exposure Limits. J Occup Environ Med 42 (3):260-9.
EarthTech. 2001. Final Technical Work Paper For Human Health Issues. Animal Agriculture GEIS. Prepared for Minnesota Planning. Available: http://www.eqb.state.mn.us/geis/TWP_HumanHealth.pdf. [Accessed 23 February 2006].
EHSRC (Environmental Health Sciences Research Center). 2002. Iowa Concentrated Animal Feeding Operation Air Quality Study. Available: http://www.public-health.uiowa.edu/ehsrc/CAFOstudy.htm. [Accessed 23 June 2003].
EPA. 2001. Emission Standards Division. Office of Air Quality Planning and Standards. 2001. Emissions From Animal Feeding Operations. Draft. Available: http://www.epa.gov/ttn/chief/ap42/ch09/draft/draftanimalfeed.pdf. [Accessed 23 February 2006].
EPA. 2003a. IRIS Database. Hydrogen sulfide (CASRN 7783-06-4). Available: http://www.epa.gov/IRIS/subst/0061.htm. [Accessed 27 February 2006].
EPA. 2003b Clean Air Scientific Advisory Committee (CASAC) PM Air Quality Criteria Document, Chapter 8, Epidemiology of Human Health Effects Associated with Ambient Particulate Matter.
EPA. 2004. Ag 101, Environmental Impacts from Pathogens. Available: http://www.epa.gov/agriculture/ag101/impactpathogens.html. [Accessed 26 February 2006].
Ghio A.J., Kim C., Devlin R.B., 2000 Concentrated ambient air particles induce mild pulmonary inflammation in healthy human volunteers. American Journal of Respiratory & Critical Care Medicine, 162: 981-988.
Hill, V.R. 2003. Prospect for Pathogen Reductions in Livestock Wastewaters: a Review. Critical Reviews in Environmental Science and Technology: 187-235.

CAFO Chemicals May 10, 2006
Page 18
Hirsch, A.R. 2002. Hydrogen Sulfide Exposure Without Loss of Consciousness: Chronic Effects in Four Cases. Toxicol Ind Health 18 (2):51-61.
Homes M.J., Heber A.J., Wu C.C., Clark L.K., Grant R.H., Zimmerman N.J., Hill M.A., Strobel B.R., Peugh M.W. & Jones D.D., Viability of Bioaerosols Produced from a Swine Facility (online publication accessed 3/7/2005 http://www.ces.purdue.edu/pork/house/conf.htm).
Kilburn, K.H. 1997. Exposure to Reduced Sulfur Gases Impairs Neurobehavioral Function. South Med J 90(10):997-1006.
Kilburn, K.H. 2003. Effects of Hydrogen Sulfide on Neurobehavioral Function. South Med J 96(7):639-46.
Mead, P.S., L. Slutsker, V. Dietz, L.F. McCaig, J.S. Bresee, C. Shapiro et al. 1999. Food-Related Illness and Death in the United States. Emerg Infect Dis 5(5):607-25.
Merchant, J.A., A.L. Naleway, E.R. Svendsen, K.M. Kelly, L.F. Burmeister, A.M. Stromquist et al. 2005. Asthma and Farm Exposures in a Cohort of Rural Iowa Children. Environ Health Perspect 113(3):350-6.
Michigan Environmental Science Board. Hydrogen Sulfide Investigation Panel. 2000. Health Effects of Low-Level Hydrogen Sulfide in Ambient Air (a Science Report to Governor John Engler). Available: http://www.michigan.gov/mesb/1,1607,7-117-1254_14230_0-7508--,00.html. [Accessed 27 February 2006].
NRC (National Research Council). Committee on Animal Nutrition. 2002. The Scientific Basis for Estimating Air Emissions from Animal Feeding Operations: Interim Report . Available: http://www.nap.edu/catalog/10391.html?se_side. [Accessed 25 January 2006].
NRC (National Research Council). Committee on Animal Nutrition. 2003. Air Emissions from Animal Feeding Operations: Current Knowledge, Future Needs . Available: http://www.nap.edu/catalog/10586.html. [Accessed 23 February 2006].
Powers, W., S. Bastyr. 2004. Downwind Air Quality Measurements From Poultry and Livestock Facilities. Iowa State University Animal Industry Report 2004. A.S. Leaflet. R1927. Available: http://www.iowabeefcenter.org/pdfs/BRR/R1927.pdf. [Accessed 23 February 2006].
Predicala, B.Z., J.E. Urban, R.G. Maghirang, S.B. Jerez and R.D. Goodband. 2002. Assessment of Bioaerosols in Swine Barns by Filtration and Impaction. Curr Microbiol 44(2):136-40.
Rabaud, N.E., S.E. Ebeler, L.L. Ashbaugh and R.G. Flocchini. 2003. Characterization and Quantification of Odorous and Non-Odorous Volatile Organic Compounds Near a Commercial Dairy in California. Atmos Environ 37(7):933-40.
CAFO Chemicals May 10, 2006
Page 19
Reynolds S.J., Donham K.J., Whitten P., Merchant J.A., Burmeister L.F., Popendorf W.J. 1996. Longitudinal Evaluation Of Dose-Response Relationships For Environmental Exposures And Pulmonary Function In Swine Production Workers. Am J Ind Med 29(1): 33-40.
Schiffman, S.S., J.L. Bennett and J.H. Raymer. 2001. Quantification of Odors and Odorants from Swine Operations in North Carolina. Agric For Meteorol 108(3):213-40.
Schiffman, S.S., E.A. Miller, M.S. Suggs and B.G. Graham. 1995. The Effect of Environmental Odors Emanating from Commercial Swine Operations on the Mood of Nearby Residents. Brain Res Bull 37(4):369-75.
Schiffman, S.S., C.E. Studwell, L.R. Landerman, K. Berman and J.S. Sundy. 2005. Symptomatic Effects of Exposure to Diluted Air Sampled from a Swine Confinement Atmosphere on Healthy Human Subjects. Environ Health Perspect 113(5):567-76.
Shusterman, D. 1992. Critical Review: The Health Significance of Environmental Odor Pollution. Arch Environ Health 47(1):76-87.
Sigurdarson, S.T., P.T. O'Shaughnessy, J.A. Watt and J.N. Kline. 2004. Experimental Human Exposure to Inhaled Grain Dust and Ammonia: Towards a Model of Concentrated Animal Feeding Operations. Am J Ind Med 46(4):345-8.
Thu, K.M., K.J. Donham, R. Ziegenhorn, S. Reynolds, P.S. Thorne, P. Subramanian et al. 1997. A Control Study of the Physical and Mental Health of Residents Living Near a Large-Scale Operation. Journal of Agricultural Safety and Health 3(1):13-26.
Valcour, J.E., P. Michel, S.A. McEwen and J.B. Wilson. 2002. Associations Between Indicators of Livestock Farming Intensity and Incidence of Human Shiga Toxin-Producing Escherichia Coli Infection. Emerg Infect Dis 8(3):252-7.
Vogelzang, P.F., J.W. van der Gulden, H. Folgering, D. Heederik, M.J. Tielen and C.P. van Schayck. 2000. Longitudinal Changes in Bronchial Responsiveness Associated With Swine Confinement Dust Exposure. Chest 117(5):1488-95.
Wing, S., S. Wolf. 2000. Intensive Livestock Operations, Health, and Quality of Life Among Eastern North Carolina Residents. Environ Health Perspect 108(3):233-8.

CAFO Chemicals DRAFT May 10, 2006 For Internal Review
Page 20
Appendix A. Health-Based Bench Marks and/or Regulatory Levels Table 1. Occupational Standards
Ammoniaa Hydrogen Sulfidec Methane
Total Particulate
Matter (Dust)e
Respirable Dust e Endotoxins VOCsf Fatty Acids
AIHA TWA 17.5 mg/m3 0.14 mg/m3 NA Not listed Not listed NA Various NA
ACGIH TWA 17.5 mg/m3 14 mg/m3 NA 10 mg/m3 3 mg/m3 NA Various NA
NIOSH REL 17.5 mg/m3 (24.5 mg/m3 b) 14 mg/m3 NA Not Listed Not listed NA Various NA
OSHA PEL 35 mg/m3 28 mg/m3 (70 mg/m3 d) NA 15 mg/m3 5 mg/m3 NA Various NA
Iowa RML 4.9 mg/m3 NA NA 2.5 mg/m3 0.23 mg/m3 100 EU/m3 NA NA
AIHA TWA = American Industrial Hygiene Association Time Weighted Average ACGIH TWA = American Conference of Governmental Industrial Hygienists Time Weighted Average NIOSH REL = National Institute for Occupational Safety and Health Recommended Exposure Limit OSHA PEL = Occupational Safety and Health Administration Permissible Exposure Limit Iowa RML = Iowa Recommended Maximum Levels for CAFO Workers (as proposed in EHSRC 2002) EU = Endotoxin Units a Conversion for ammonia: 1 ppm = 0.7 mg/m3 b Short Term Exposure Limit c Conversion for hydrogen sulfide: 1ppm = 1.4 mg/m3
d 10-minute maximum peak e Occupation standards for total and respirable dust are applicable to biologically inert, poorly soluble particles. As discussed in the above text,
particulate matter at CAFOs contains biologically active contaminants, therefore, these standards may not be protective for CAFO dusts f Occupation standards for specific VOCs may be available.
CAFO Chemicals DRAFT May 10, 2006 For Internal Review
Page 21
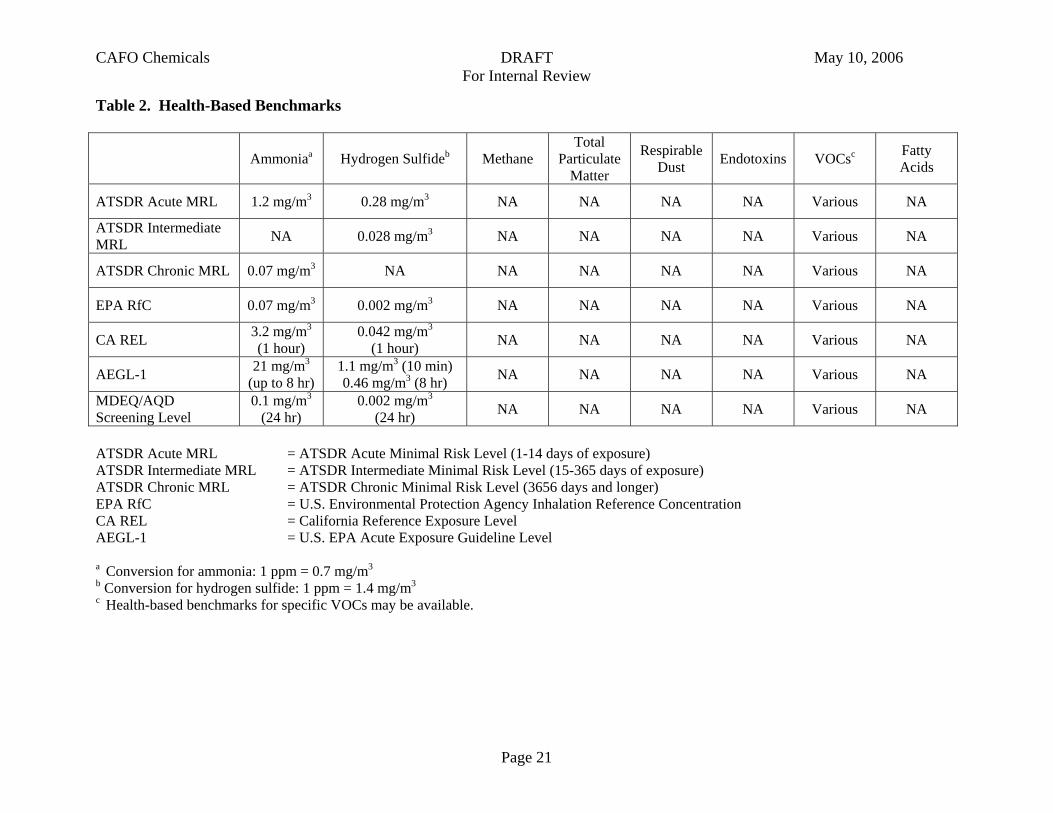
Table 2. Health-Based Benchmarks
Ammoniaa Hydrogen Sulfideb Methane Total
Particulate Matter
Respirable Dust Endotoxins VOCsc Fatty
Acids
ATSDR Acute MRL 1.2 mg/m3 0.28 mg/m3 NA NA NA NA Various NA
ATSDR Intermediate MRL NA 0.028 mg/m3 NA NA NA NA Various NA
ATSDR Chronic MRL 0.07 mg/m3 NA NA NA NA NA Various NA
EPA RfC 0.07 mg/m3 0.002 mg/m3 NA NA NA NA Various NA
CA REL 3.2 mg/m3 (1 hour)
0.042 mg/m3 (1 hour) NA NA NA NA Various NA
AEGL-1 21 mg/m3 (up to 8 hr)
1.1 mg/m3 (10 min) 0.46 mg/m3 (8 hr) NA NA NA NA Various NA
MDEQ/AQD Screening Level
0.1 mg/m3 (24 hr)
0.002 mg/m3 (24 hr) NA NA NA NA Various NA
ATSDR Acute MRL = ATSDR Acute Minimal Risk Level (1-14 days of exposure) ATSDR Intermediate MRL = ATSDR Intermediate Minimal Risk Level (15-365 days of exposure) ATSDR Chronic MRL = ATSDR Chronic Minimal Risk Level (3656 days and longer) EPA RfC = U.S. Environmental Protection Agency Inhalation Reference Concentration CA REL = California Reference Exposure Level AEGL-1 = U.S. EPA Acute Exposure Guideline Level a Conversion for ammonia: 1 ppm = 0.7 mg/m3 b Conversion for hydrogen sulfide: 1 ppm = 1.4 mg/m3
c Health-based benchmarks for specific VOCs may be available.