Caffeine used as a Tracer of Wastewater Contamination in ...
52
Rollins College Rollins Scholarship Online Honors Program eses Spring 2017 Caffeine used as a Tracer of Wastewater Contamination in South Florida Stephanie Spence Rollins College, [email protected] Follow this and additional works at: hp://scholarship.rollins.edu/honors Part of the Analytical Chemistry Commons , Environmental Chemistry Commons , and the Environmental Monitoring Commons is Open Access is brought to you for free and open access by Rollins Scholarship Online. It has been accepted for inclusion in Honors Program eses by an authorized administrator of Rollins Scholarship Online. For more information, please contact [email protected]. Recommended Citation Spence, Stephanie, "Caffeine used as a Tracer of Wastewater Contamination in South Florida" (2017). Honors Program eses. 50. hp://scholarship.rollins.edu/honors/50
Transcript of Caffeine used as a Tracer of Wastewater Contamination in ...

Rollins CollegeRollins Scholarship Online
Honors Program Theses
Spring 2017
Caffeine used as a Tracer of WastewaterContamination in South FloridaStephanie SpenceRollins College, [email protected]
Follow this and additional works at: http://scholarship.rollins.edu/honors
Part of the Analytical Chemistry Commons, Environmental Chemistry Commons, and theEnvironmental Monitoring Commons
This Open Access is brought to you for free and open access by Rollins Scholarship Online. It has been accepted for inclusion in Honors ProgramTheses by an authorized administrator of Rollins Scholarship Online. For more information, please contact [email protected].
Recommended CitationSpence, Stephanie, "Caffeine used as a Tracer of Wastewater Contamination in South Florida" (2017). Honors Program Theses. 50.http://scholarship.rollins.edu/honors/50

Caffeine used as a Tracer of Wastewater Contamination in South
Florida Stephanie Spence
Thesis Advisor: Dr. Ellane J. Park
Rollins College
Department of Chemistry
1
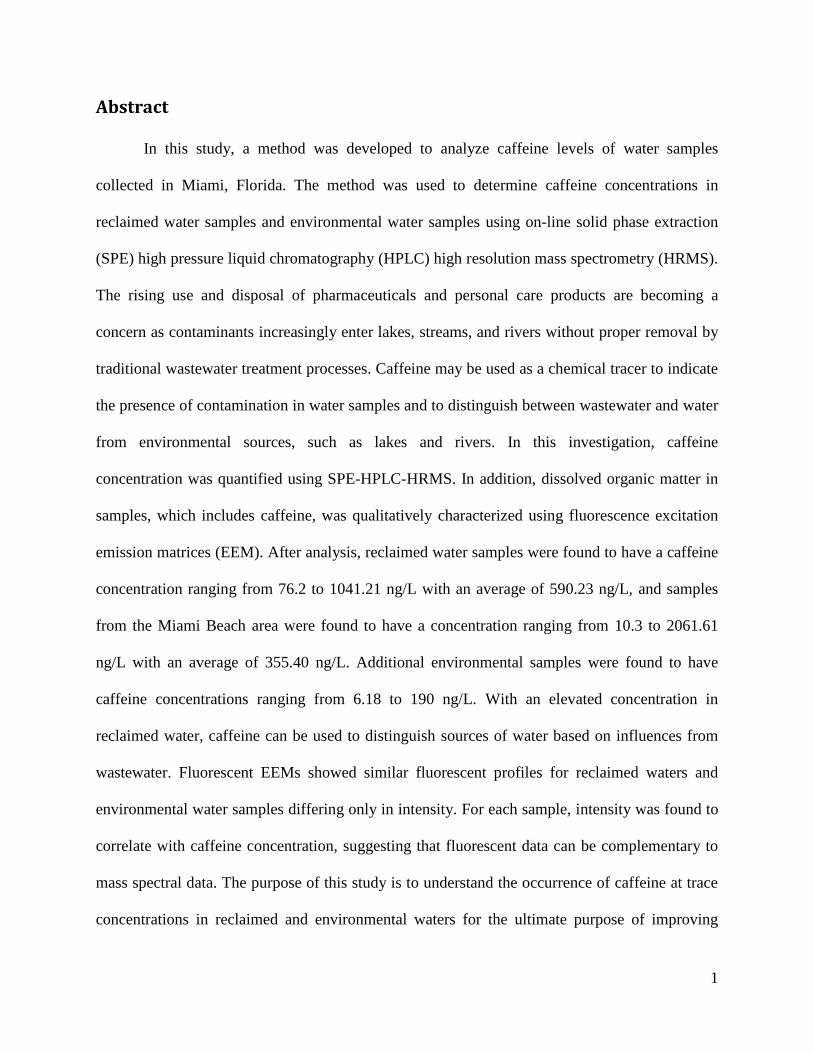
Abstract
In this study, a method was developed to analyze caffeine levels of water samples
collected in Miami, Florida. The method was used to determine caffeine concentrations in
reclaimed water samples and environmental water samples using on-line solid phase extraction
(SPE) high pressure liquid chromatography (HPLC) high resolution mass spectrometry (HRMS).
The rising use and disposal of pharmaceuticals and personal care products are becoming a
concern as contaminants increasingly enter lakes, streams, and rivers without proper removal by
traditional wastewater treatment processes. Caffeine may be used as a chemical tracer to indicate
the presence of contamination in water samples and to distinguish between wastewater and water
from environmental sources, such as lakes and rivers. In this investigation, caffeine
concentration was quantified using SPE-HPLC-HRMS. In addition, dissolved organic matter in
samples, which includes caffeine, was qualitatively characterized using fluorescence excitation
emission matrices (EEM). After analysis, reclaimed water samples were found to have a caffeine
concentration ranging from 76.2 to 1041.21 ng/L with an average of 590.23 ng/L, and samples
from the Miami Beach area were found to have a concentration ranging from 10.3 to 2061.61
ng/L with an average of 355.40 ng/L. Additional environmental samples were found to have
caffeine concentrations ranging from 6.18 to 190 ng/L. With an elevated concentration in
reclaimed water, caffeine can be used to distinguish sources of water based on influences from
wastewater. Fluorescent EEMs showed similar fluorescent profiles for reclaimed waters and
environmental water samples differing only in intensity. For each sample, intensity was found to
correlate with caffeine concentration, suggesting that fluorescent data can be complementary to
mass spectral data. The purpose of this study is to understand the occurrence of caffeine at trace
concentrations in reclaimed and environmental waters for the ultimate purpose of improving

2
wastewater treatment facilities. Overall, results indicate that caffeine shows potential as an
environmental tracer of wastewater contamination in this region.
3
Acknowledgments
For making this research possible, I would like to thank Dr. Piero Gardinali, the
Environmental Analysis Research Laboratory, and the Research Experience for Undergraduates
(REU) program at Florida International University.
I would also like to thank the Rollins College Department of Chemistry, my thesis
advisor Dr. Ellane Park, and the professors on my thesis review committee, Dr. Pedro Bernal,
Dr. Chris Fuse, and Dr. Laurel Habgood for their continued assistance and guidance in the
creation of this work.
Thank you to my parents, family and friends their unwavering support and
encouragement throughout my time at Rollins.
This research was supported by grant CHE-1560375 awarded by the National Science
Foundation.
4
Contents
Abstract ........................................................................................................................................... 1
Acknowledgments........................................................................................................................... 3
1. Introduction ............................................................................................................................. 6
1.1. Wastewater Treatment and Emerging Contaminants .................................................................. 6
1.2. Environmental Tracers ................................................................................................................ 11
1.3. Caffeine as an Ideal Tracer .......................................................................................................... 12
1.4. Analysis of Emerging Contaminants and Tracers ........................................................................ 13
1.4.1. Solid Phase Extraction High Performance Liquid Chromatography Mass Spectrometry ... 13
1.4.2. Fluorescence EEM-PARAFAC ............................................................................................... 17
1.5. Caffeine in Wastewater Treatment ............................................................................................ 19
1.6. Caffeine as a Tracer of Contamination ....................................................................................... 22
1.7. Additional Tracers ....................................................................................................................... 24
1.8. Advantages of Caffeine ............................................................................................................... 27
1.9. Current Limitations on Analysis of Emerging Contaminants ...................................................... 29
1.10. Project Overview: Caffeine Analysis of Wastewater in South Florida .................................... 30
2. Experimental .......................................................................................................................... 32
2.1. Reagents and Chemicals ............................................................................................................. 32
2.2. Sample Collection and Preparation ............................................................................................ 32
2.3. Online SPE Pre-concentration and HPLC Separation .................................................................. 33
5
2.4. Mass Spectrometry ..................................................................................................................... 34
2.5. Method Validation ...................................................................................................................... 34
2.6. Fluorescence Analysis ................................................................................................................. 35
3. Results and Discussion .......................................................................................................... 36
3.1. SPE-HPLC-HRMS Optimization .................................................................................................... 36
3.2. Method Validation ...................................................................................................................... 38
3.2.1. Calibration and Quality Control .......................................................................................... 38
3.2.2. Method Detection Limits .................................................................................................... 39
3.3. Occurrence of Caffeine by SPE-HPLC-HRMS ............................................................................... 40
3.4. EEM Fluorescence Analysis of Samples ...................................................................................... 43
3.5. Caffeine’s Usefulness as a Tracer ................................................................................................ 45
4. Conclusion ............................................................................................................................. 48
References ..................................................................................................................................... 49

6
1. Introduction
1.1. Wastewater Treatment and Emerging Contaminants
In recent years, there has been a widespread and growing consumption of
pharmaceuticals, personal care products, and other anthropogenic, or human originating, organic
compounds. Thousands of these compounds enter wastewater through human excretion or
disposal, and wastewater, in turn, becomes an important contributor of trace organic compounds
to aquatic environments. Environmental waters, such as natural rivers or lakes, are susceptible to
wastewater contamination from sewage discharges, or unspecified non-point sources which
include urban runoff, storm water, intrusions from septic tanks, misapplication of recycled
wastewater used for irrigation, human activities during rain events, or erosion from pervious
surfaces.1 Given the large discharge of pollutants, there has been a rising interest in monitoring
pharmaceuticals, personal care products, pesticides, fragrances, dyes, and other compounds as
they are introduced into environmental waterways. Many current studies documented in reviews
are concerned with the analysis, occurrence, and fate of these emerging contaminants in
wastewater treatment plants or natural waterways.2–4
Analysis of targeted tracer compounds in
water samples can give useful information on the amount of emerging contaminants that enter
into the environment. The ultimate goal of this investigation is to improve the efficiency of
contaminant removal from waterways by refining wastewater treatment processes. In this water
analysis, caffeine has the potential to be an effective environmental tracer of contamination and
is investigated by quantifying caffeine concentrations in treated wastewater and environmental
water samples in Miami, Florida.
Wastewater Treatment. In order to investigate the efficiency of environmental tracers,
an understanding of the basics of the sewage treatment process is required. Sewage treatment

7
uses a series of physical, chemical, and biological processes to treat and remove contaminants
from raw sewage, also known as influent water.5 Water from toilets, showers, kitchens, bathtubs,
laundry facilities, car washes and storm drains makes up the majority of raw sewage. Wastewater
treatment plants typically purify influent water through three phases: primary, secondary, and
tertiary treatment processes (Figure 1). Before the first phase, preliminary treatment (step 1) first
removes large pieces of debris as the sewage passes through a screen filtration system. Primary
treatment (step 2) occurs after filtration as sewage passes through a grit chamber where course
sand and gravel can settle to the bottom of the flowing sewage. The water then enters a
sedimentation tank where suspended solids settle as raw sludge. They are later treated to produce
biosolids, a product used as a fertilizer. In secondary treatment (step 3), aerobic bacteria are
introduced to the sewage discharge to break down the remaining oxygen consuming wastes in
the water which settle into a second sedimentation tank as the treated water moves on. After
secondary treatment, the water may be disinfected with chlorine gas by an additional process
(step 4) which kills disease-causing bacteria, destroys viruses, and removes color from the water.
Tertiary treatment (step 5) can be employed after chlorination. This removes disinfectant by-
products using heat activated granular charcoal and precipitates excess phosphates out of the
water by the addition of aluminum sulfate or lime (CaO).5 The process results in treated effluent
water that returns to natural waterways. Treated water that is used in agricultural irrigation
systems or ground water recharge is known as reclaimed water, which is also defined as the end
product of wastewater reclamation that meets water quality requirements for biodegradable
materials, suspended matter and pathogens.6 While sewage treatment is effective at removing
targeted contaminants, these processes are not entirely thorough in water purification.

8
Figure 1: Wastewater treatment schematic including preliminary treatment (1), primary treatment (2), secondary
treatment (3), disinfection (4), and tertiary treatment (5).
Efficiency of Removal. With the passage of the Clean Water Act in 1972, the
Environmental Protection Agency was tasked with establishing water quality criteria and
monitoring surface waters for 130 priority pollutants. However, many pharmaceuticals and their
metabolites are not targeted by the traditional processes of wastewater treatment plants.5,7–9
These may originate from prescription and non-prescription drugs, painkillers, tranquilizers,
antidepressants, antibiotics, birth control, chemotherapeutic agents, hormones and personal care
products containing organic contaminants. Due to the relatively low concentrations of emerging
contaminants in wastewaters (ng/L to several μg/L) and complexity and variety of chemical
structures, treatment plants are not entirely effective at their removal.2,4
Mean removal rates have
been seen to vary from 8.1 – 87.5% per compound.8 Trace amounts of these contaminants end up
being dispensed in waterways or released directly into the environment via human or animal
excretion.2,5
A five-month monitoring program in South Wales, UK, determined the occurrence
9
and concentration of 55 pharmaceuticals, personal care products, endocrine disruptors, and illicit
drugs in two wastewater treatment plants. The study also assessed the impact of the treated
effluent water on the quality of the receiving river water. One wastewater plant utilizing
activated sludge had a removal efficiency of over 85% for all contaminants monitored; however,
the study also revealed that the treated wastewater was the main contributor of contaminant
concentration (up to 3 kg per day) in the rivers studied.9 An alternative method to sustain the
management of water resources is the use of on-site wastewater treatment systems, or septic
tanks, which are generally employed in suburban or rural areas and serve approximately 25% of
the U.S. population.10
The environmental discharges of four household dwellings containing
septic tank systems located on the Skaneateles Lake, New York, were evaluated for their
occurrence of a range of organic contaminants, including personal care products.10
All of the
target compounds were found to be present in both the septic tank and lake water samples, but
they were significantly higher in the septic tanks at a concentration range of 0.45 to 388 ng/L.
While continued studies are needed to describe flux and fate of emerging contaminants in and
around septic systems, results may indicate that septic tanks, like traditional wastewater
treatment plants, can be a source of anthropogenic contaminants in the environment.10
Environmental Concern. In recent years, about 160 pharmaceutical products and 30 by-
products have been targeted in studies that concern their occurrence in aquatic environments;
occurrence and elimination during wastewater and drinking water treatments; or analytical
developments.2 A list of the most common classes of pharmaceutical compounds that are found
as emerging contaminants categorized according to therapeutic use is shown in Table 1. These
contaminants have been detected in sewage effluents, streams and rivers, surface waters, soils
and tap waters. Also, they have been found to effect aquatic life. The full impacts of these

10
compounds, which include hormonally active and endocrine disrupting chemicals, are not
entirely known, but undesirable effects on aquatic organisms altering reproduction and growth,
and damage to sensitive ecosystems are possible.4 The impact of the chemicals is dictated not
only by their presence in the environment, but also by the biological activity of their degradation
by-products. However, little is known about the occurrence and fate of by-products as most
studies are limited to parent pharmaceutical products.2,4
Table 1: Classes of common pharmaceutical contaminants found in waterways as emerging contaminants.3
Classes of Pharmaceuticals
Therapeutic classes Examples
Veterinary and human antibiotics
-β-lactams Amoxicillin, ampicillin, benzylpenicillin
-marolides Erythomycin, azithromycin, tylosin
-sulfonamides Sulfamethazine, sulfadiazine, sulfaguanidine
-tetracyclines Oxytetracycline, tetracycline
Analegesics and anti-inflammatory drugs Codeinem ibuprofen, acetoaminofen,
diclofenac, fenoprofen
Lipid regulators Benzafibrate, clofibric acid, fenofibric acid
Psychiatric drugs Diazepam
β-blockers Metoprolol, propranolol, timolol, solatol
X-ray contrast media Lopromide, lopamidol, diatrizoate
Anti-depressants Fluoxetine
Hormones Estradiol, estrone, estriol, diethylstilbestrol
Lack of Regulation in the Environment. Currently there is no federal requirement for
monitoring treated wastewater for pharmaceuticals, despite major worry that contaminants may
be concentrated in marine ecosystems.5 Without proper monitoring or regulation, the presence of
emerging pharmaceutical contaminants in natural water sources will likely increase in the
future.5 Concentrations of emerging contaminants vary among regions of the world due to sales,
usage, water consumption, and water treatment methods. Areas of North America, Europe, Asia,
and Australia have been well documented in several studies. The general presence of
pharmaceuticals and emerging contaminants in water bodies is found to range from ng/L (ppt) to
11
several μg/L (ppb); however, no generalized conclusions can be drawn from one region to
another.2,11
In order to minimize ecological effects there is an increasing need to identify
compound structures and study the occurrence, transport, and effects of emerging contaminants.3
1.2. Environmental Tracers
With thousands of compounds existing in a water sample, it is useful to identify a single
compound that can indicate the presence of additional emerging contaminants. These target
analytes, or environmental tracers, are widely distributed compounds that can be used to indicate
contamination in environmental waters. Variations in abundances in a tracer can be used to
distinguish the contributions of different sources of contamination in specific environments, or
determine sources, pathways and timescales of environmental processes.12,13
An effective tracer
should have:
regular and constant consumption,
an origin from human sources,
sufficient quantities for analytical quantification in the environment, and
the ability to identify the source of and quantify the magnitude of pollution.14
Thus, tracers can lead to the development of sustainable management policies for protection of
water resources and aquatic environments. Studies continue to explore how tracers can address
issues of vulnerability, sustainability, and uncertainty of water resources and water systems.13
The search for the ideal tracer is a continuous process, but many compounds have been identified
and studied. Several anthropogenic organic compounds classified as pharmaceuticals or personal
care products have been used as potential chemical tracers due to their behavior as persistent
aqueous organic pollutants.1 These include carbamazepine,
1,8,15,16 N,N-diethyl-meta-toluamide
(DEET),1,17
and gemfibrozil,1,11,18
as well as various antibiotics (e.g. tetracycline,
12
fluoroquinolone, sulfonamide, lincosamide and macrolide antibiotics),1,7,10,15,19,20
and drugs and
metabolites (e.g. amphetamine, THC)17,21
. Bacterial markers have also been used as tracers, but
short lifetime and limited source specificity limit their usefulness.14,22
Caffeine14,16,22–25
and
artificial sweeteners like sucralose1,6,26
have recently shown potential as environmental tracers.
This paper explores the use of caffeine as a tracer of wastewater contamination.
1.3. Caffeine as an Ideal Tracer
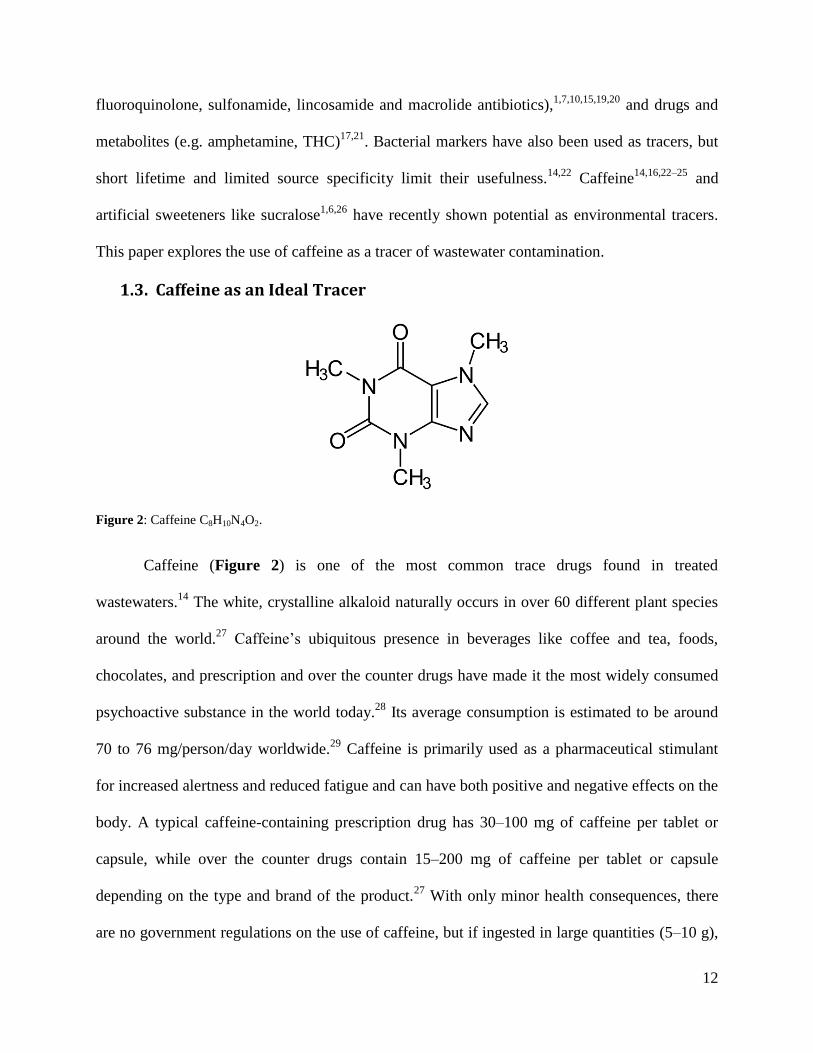
Figure 2: Caffeine C8H10N4O2.
Caffeine (Figure 2) is one of the most common trace drugs found in treated
wastewaters.14
The white, crystalline alkaloid naturally occurs in over 60 different plant species
around the world.27
Caffeine’s ubiquitous presence in beverages like coffee and tea, foods,
chocolates, and prescription and over the counter drugs have made it the most widely consumed
psychoactive substance in the world today.28
Its average consumption is estimated to be around
70 to 76 mg/person/day worldwide.29
Caffeine is primarily used as a pharmaceutical stimulant
for increased alertness and reduced fatigue and can have both positive and negative effects on the
body. A typical caffeine-containing prescription drug has 30–100 mg of caffeine per tablet or
capsule, while over the counter drugs contain 15–200 mg of caffeine per tablet or capsule
depending on the type and brand of the product.27
With only minor health consequences, there
are no government regulations on the use of caffeine, but if ingested in large quantities (5–10 g),
13
the substance can be lethal.28,30
Caffeine is metabolized in the liver to form dimethyl- and
monomethylxanthines, dimethyl and monomethyl uric acids, trimethyl- and dimethyllantion, and
uracil derivaties.28
The caffeine molecule is efficiently metabolized in humans and animals but a
small portion, 0.5–10%, remains un-metabolized and can reach sewage by excretion.14
Excess
caffeine containing beverage and food products disposed in drains also account for its elevated
presence in reclaimed water. The regular consumption and sufficient quantity of caffeine in
environmental waters, due to its relatively higher water solubility, has allowed it to be used as a
tracer in studies worldwide.12
As a tracer, caffeine can be used to indicate anthropogenic
influences, contamination by wastewaters, and the presence of pharmaceuticals and personal care
products.
1.4. Analysis of Emerging Contaminants and Tracers
1.4.1. Solid Phase Extraction High Performance Liquid Chromatography Mass
Spectrometry
Chromatography and Spectrometry. Before exploring the use of caffeine as a tracer,
the methods of trace analysis of water samples must first be described. In studies of emerging
contaminants and tracers, highly sensitive analytical techniques are required to detect compound
concentrations in influent samples, effluent treated samples, and receiving waters samples. It is
necessary to identify structures of emerging contaminants and determine their amounts in order
to assess the risks associated with some compunds.4 Separation is a necessary prerequisite for the
analysis of a large number of polar contaminants in water samples in the investigation of
emerging contaminant occurrence.31
Chromatographic separation methods including gas
chromatography (GC) and high performance liquid chromatography (HPLC) are the dominant
analytical techniques for determination of highly polar and water soluble emerging contaminants

14
in complex aqueous matrices.3 In GC, differences in absorptive interactions between components
in the gas stream mobile phase and liquid stationary phase lead to analytes in the mixture being
primarily separated based on boiling point differences.3 In HPLC, samples in a liquid mobile
phase are mechanically pumped through a narrow column, and analytes are separated based on
affinity for the stationary phase packed in the column. This method has been used since the
1960’s and is employed for separating nonvolatile ionic compounds.3 Mass spectrometry (MS) is
the most valuable detection technique for trace level determination in environmental waters,
providing information on a compound’s molecular structure with high sensitivity and selectivity.
Each chemical species is ionized, separated, and then detected based on mass to charge ratio. The
identity of a compound can be confirmed by molecular ion or fragment ion masses. The
combination of chromatography and MS allows for the separation of mixtures based on
individual components, and the subsequent analysis of each compound qualitatively and
quantitatively.3
Solid Phase Extraction. Due to the fact that contaminants appear at trace levels in
wastewater or environmental water, it is advantageous to concentrate samples before analytical
assessment. This leads to the implementation of pre-concentration methods, including liquid-
liquid extraction (LLE) or solid phase extraction (SPE).4 SPE is an advanced extraction
technique where compounds are dissolved or suspended in a liquid mobile phase and are
separated from other compounds according to physical and chemical properties. This method is
gaining popularity because it is robust and highly selective; both off-line and on-line SPE
methods are used.3 Off-line or manual SPE is more commonly used and requires a large volume
of solution to pass through a cartridge containing a silica based packing that retains analytes
based on polarity.19
Absorbed compounds must then be eluted out of the cartridge and prepared

15
for chromatography. Recently, on-line SPE, which is fully automated and can be coupled directly
with liquid chromatography, has been increasingly used.23
In the on-line method, the SPE pre-
column is connected to the LC analytical pump, and a system of two switching valves determines
the analysis steps (Figure 3). After loading, samples first pass through a sample loop to the SPE
column where analytes are retained in the stationary phase. The second valve is then switched on
and the trapped analytes are eluted directly from the SPE pre-column to the analytical column
where gradient separation starts.32,33
On-line SPE is advantageous compared to traditional SPE
methods due to its higher reliability and sensitivity, simpler sample preparation, shorter analysis
time, improved reproducibility, reduced manual labor, and avoidance of sample losses due to
evaporation.33
Figure 3: Schematic illustration of the two valve on-line solid phase extraction (SPE) system coupled to high
pressure liquid chromatography where the rectangle in the center of Valve B represents the SPE pre-column. Red:
sample. Blue: mobile phases.32
Optimization. This study uses on-line SPE-HPLC coupled directly with MS for
quantitative analysis of caffeine in water samples. In preparation to analyze concentration of
analytes, several experimental variables in the SPE-HPLC-HRMS method must be optimized to
achieve maximum extraction efficiency of target analytes.34
These variables can include type of

16
column used, mobile phase composition, and elution gradient. The goal is to optimize peak
shapes and signal intensities of the chromatograms collected. An optimal peak is a narrow
Gaussian distribution with a baseline width equal to 1.7 times the width at half height of the peak
being ideal. Identification criteria for analytes is defined in terms of molecular and fragmentation
ions, relative abundances, or retention times.31
Individual studies will select experimental
variables for their methods based on the identity and properties of the analyte or analytes that
they are targeting. Final optimization is usually achieved through a trial-and-error approach
before sample analysis.
Application. Studies have successfully applied different techniques including SPE GC-
MS,18
LLE GC-MS,32
SPE UPLC (ultra-performance liquid chromatography),9,20
SPE LC-MS-
MS (ion trap mass spectrometry),19,35
SPE GC-MS-MS and GC-MC-MS-MRM (multi reaction
monitoring)14
for analysis of target compounds in water samples. One investigation aims for
better selective analytical detection of environmentally relevant concentrations than the usual
methodology. This study focused on the development and validation of an analytical protocol
using LLE pre-concentration followed by detection using HPLC and atmospheric pressure
chemical ionization mass spectrometry. Using this method, caffeine was detected in the Biscayne
Bay and Miami River in South Florida at a concentration range of less than 4 to 41 ng/L.12
As
advanced analytical techniques were continually developing, a universal screening method using
both GC-MS and LC-MS was developed to detect and identify a multitude of contaminants
simultaneously in environmental water samples.36
Of 2000 compounds screened in ground and
effluent wastewater samples, including pesticides, pharmaceuticals, personal care products, illicit
drugs and their metabolic transformation products produced by bio- or photo-degradation, 300
were quantitatively validated. This universal method offers realistic and complete information on
17
the undesired compounds present in environmental samples and allows for the detection of as
many contaminants as possible. However, highly polar or highly volatile compounds which need
special sample pretreatment need to be investigated separately. Based on this method, pollutants
detected and considered relevant could be included in improved monitoring programs, but the
easy and rapid sample procedure represents a compromise between efficiency and simplicity. A
method like this can be used to target 200–300 analytes, but contaminants present in the samples
other than target analytes are commonly ignored.36
Measuring this large of a number of
contaminants is not needed to verify the presence of wastewater contamination, instead targeted
tracers, such as caffeine, can indicate the presence of additional compounds.
1.4.2. Fluorescence EEM-PARAFAC
In addition to mass spectrometry, fluorescence excitation emission matrix (EEM)
analysis was used in this study as a method of wastewater and environmental water
characterization. An EEM presents three-dimensional spectra where fluorescent intensity is
displayed as a function of excitation and emission wavelengths. Fluorescence EEM measures the
full ultraviolet to near infrared spectrum of water contaminants at several thousand pairs of
excitation and emission wavelength. It can be combined with parallel factor analysis
(PARAFAC), a mathematical tool that can be used to interpret the complex information
presented in an EEM of a sample for qualitative and quantitative analysis.37
PARAFAC
mathematically separates components of the EEM by emission/excitation peak pairs based on the
characteristics of detected fluorescent dissolved organic matter (DOM). DOM can be classified
as carbohydrates, polysaccharides, amino acids, peptides, proteins, lipids, humic substances or
anthropogenic organic pollutants which may harmfully affect biological activity in aquatic
systems.38
EEM-PARAFAC measurements on environmental samples and treated wastewater

18
samples give a broad picture of the organic components present and can be used to track changes
of organic matter quantity and quality.37
This method has been investigated and shown to be a
viable technique for analyzing environmental water samples and monitoring wastewater
treatment process efficiency by measuring the removal of DOM.
In a study conducted in Sicily, Italy, correlation of fluorescent intensity of EEM peaks or
PARAFAC components and water quality parameters demonstrate the feasibility of fluorescence
spectroscopy as a monitoring tool to quantify emerging contaminants in wastewater treatments
(Figure 4).39
Reduced intensity of fluorescent DOM, indicated by the loss of color, is seen in
EEM images after the sample is treated. EEM-PARAFAC has also been used to characterize
DOM and examine the correlation of DOM with water quality in two rivers in Shenyang City,
China.37
However, further studies are needed utilizing EEM-PARAFAC to assess the effects of
water quality and variable treatment conditions on the removal of organic contaminants. Future
research may help to optimize water treatment processes and ensure quality of treated water.38
This study uses EEM as a qualitative characterization technique for water samples. Since
caffeine is included as a part of DOM, this preliminary technique gives a qualitative overview of
samples before caffeine quantification.
Figure 4: Example of a fluorescent excitation emission profile before and after wastewater treatment on a water
sample from Sicily, Italy.39
19
1.5. Caffeine in Wastewater Treatment
Using the analytical methods described above, recent studies are able to quantify
concentrations of trace analytes in water samples before and after wastewater treatment
processes. In order to investigate the usefulness of caffeine as an environmental tracer of
untreated wastewater contamination, the occurrence of caffeine during wastewater treatment has
been studied in areas such as Beijing, Switzerland, Greece, and India.11,14,18,40
In one study, the
relative mass distribution and removal efficiencies of nine pharmaceutical contaminants,
including caffeine, were investigated in a wastewater treatment plant in Beijing.40
In this facility
an Anaerobic-Anoxic-Oxic (A2/O) treatment, a simple simultaneous nitrogen and phosphorus
removal process, was employed in secondary treatment. Absorbed and dissolved concentrations
of contaminants were measured in two phases at each step in the treatment process using SPE-
UPLC-MS-MS. The relative mass distributions and removal efficiencies were then determined.
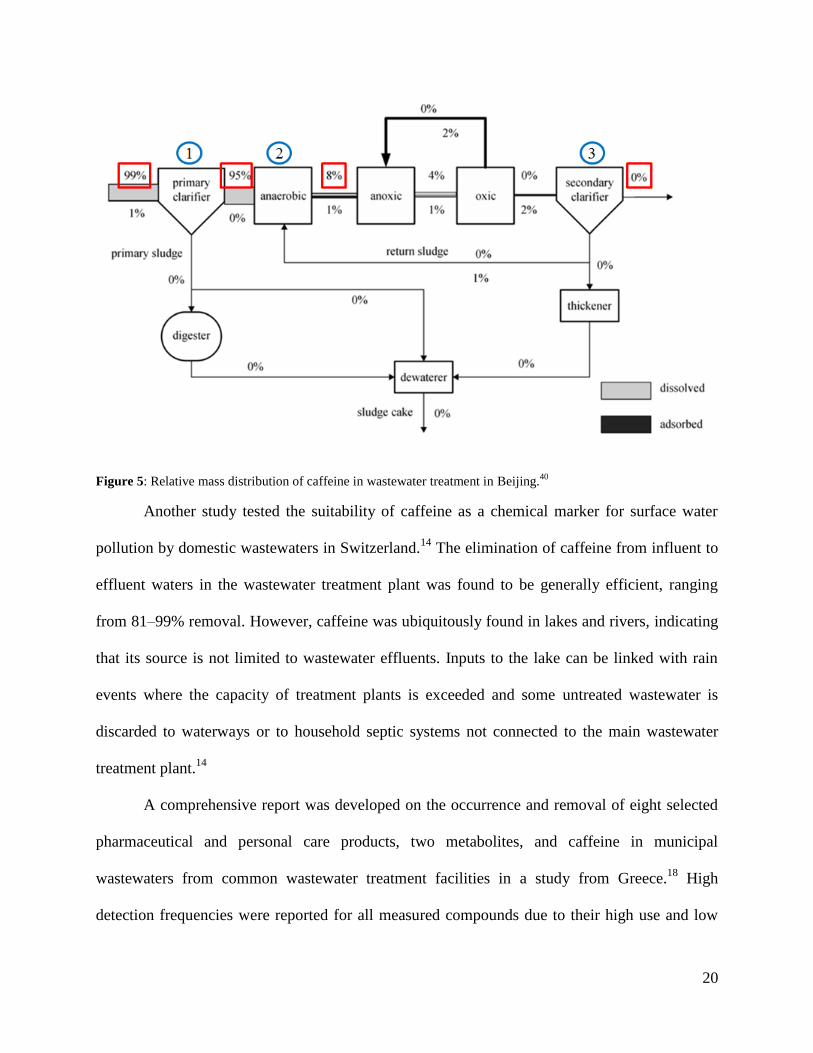
Figure 5 shows the relative mass distribution of caffeine throughout the wastewater treatment
process. Caffeine showed the highest contamination level in the effluent after primary treatment
(1). This indicates it is not removed to a significant extent during primary treatment, but it was
reduced significantly after the A2/O secondary process (2). The figure shows that caffeine was
nearly 100% removed after complete treatment (3), indicating that the secondary anaerobic and
anoxic tanks are efficient at contaminant removal. However, concentrations in the receiving river
still showed large amounts of the target contaminants. This suggests that the mass, not just the
concentrations, of the pollutions should be taken into account, and that caffeine can originate
from additional sources upstream.40
The high removal rates suggest that caffeine is a viable
indicator of untreated wastewater contamination as its concentration levels can be used to
distinguish treated and untreated water.
20
Figure 5: Relative mass distribution of caffeine in wastewater treatment in Beijing.40
Another study tested the suitability of caffeine as a chemical marker for surface water
pollution by domestic wastewaters in Switzerland.14
The elimination of caffeine from influent to
effluent waters in the wastewater treatment plant was found to be generally efficient, ranging
from 81–99% removal. However, caffeine was ubiquitously found in lakes and rivers, indicating
that its source is not limited to wastewater effluents. Inputs to the lake can be linked with rain
events where the capacity of treatment plants is exceeded and some untreated wastewater is
discarded to waterways or to household septic systems not connected to the main wastewater
treatment plant.14
A comprehensive report was developed on the occurrence and removal of eight selected
pharmaceutical and personal care products, two metabolites, and caffeine in municipal
wastewaters from common wastewater treatment facilities in a study from Greece.18
High
detection frequencies were reported for all measured compounds due to their high use and low
21
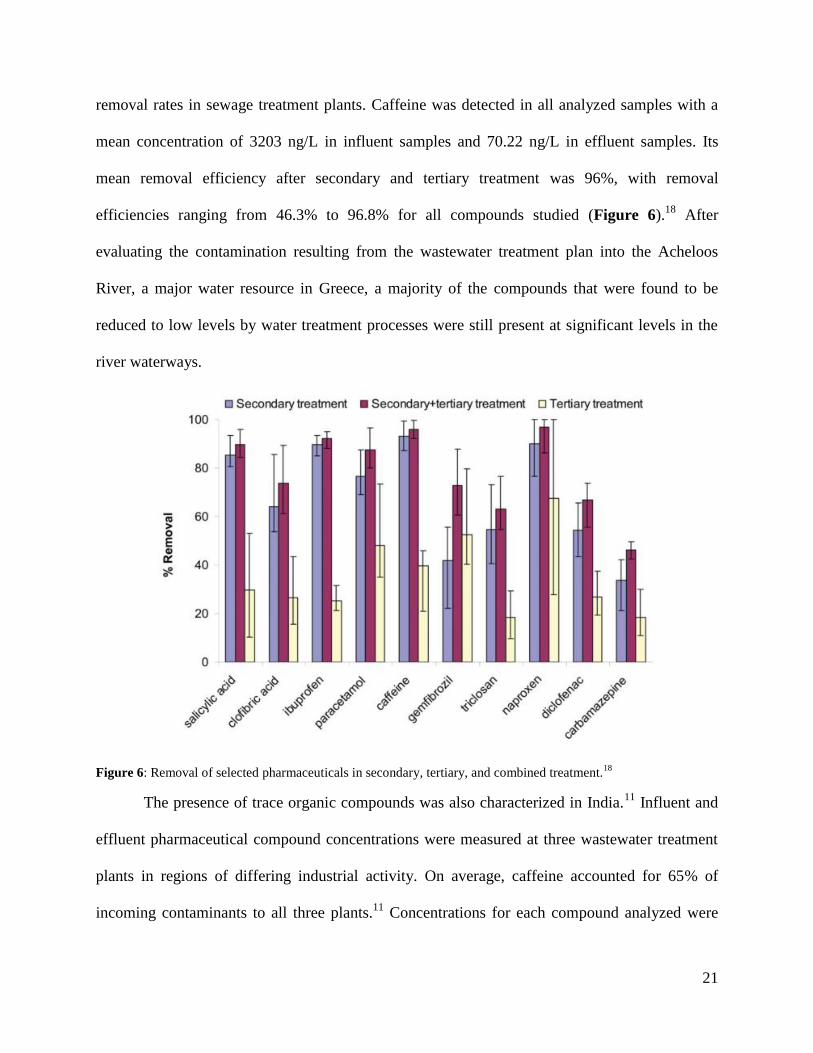
removal rates in sewage treatment plants. Caffeine was detected in all analyzed samples with a
mean concentration of 3203 ng/L in influent samples and 70.22 ng/L in effluent samples. Its
mean removal efficiency after secondary and tertiary treatment was 96%, with removal
efficiencies ranging from 46.3% to 96.8% for all compounds studied (Figure 6).18
After
evaluating the contamination resulting from the wastewater treatment plan into the Acheloos
River, a major water resource in Greece, a majority of the compounds that were found to be
reduced to low levels by water treatment processes were still present at significant levels in the
river waterways.
Figure 6: Removal of selected pharmaceuticals in secondary, tertiary, and combined treatment.18
The presence of trace organic compounds was also characterized in India.11
Influent and
effluent pharmaceutical compound concentrations were measured at three wastewater treatment
plants in regions of differing industrial activity. On average, caffeine accounted for 65% of
incoming contaminants to all three plants.11
Concentrations for each compound analyzed were

22
found to be much lower on average in the effluent than the influent. This indicates efficient
removal, but the three treatment plants showed variability in effluent concentrations and removal
efficiency due to differences in the treatment processes and the location of the plants. This study
indicated that data on wastewater contamination is lacking in small isolated communities that are
not heavily influenced by industry. Region and site-specific monitoring of trace organic
compounds has proven to be important. Caffeine was seen to be efficiently removed throughout
the treatment process at each of the plants, but a large increase in caffeine concentration was
noticed in environmental water, perhaps as a result of untreated wastewater contamination.11
1.6. Caffeine as a Tracer of Contamination
The repeated detection of caffeine in water samples after wastewater treatment illustrates
that these processes are not effective at preventing caffeine or other unmonitored emerging
contaminants from entering environmental waterways. Anthropogenic compounds that are
characteristic of wastewater may potentially be used as tracers of contamination. Caffeine has
been used in a study to estimate the mass of untreated water entering an aquifer in Germany and
showed superior source specificity than conservative tracers whose uniform appearance cannot
be used to distinguish between treated and untreated water.24
A more specific indicator for
untreated wastewater is required and is seen in caffeine. A study in Hawaii of caffeine and
agricultural pesticide concentrations in environmental waters assessed whether caffeine
concentrations in environmental samples were consistent with wastewater caffeine sources.41
Caffeine was detected at concentrations of up to 88 ng/L in all groundwater, river, stream, and
coastal ocean water samples collected.41
The fact that caffeine was not detected in offshore ocean
samples or upstream river samples demonstrates it source specificity for wastewater in this study.

23
Fecal coliform bacteria have been widely used as indicators of sewage and human source
contamination in surface waters. In a 2008 study, caffeine and pharmaceuticals were investigated
as alternatives to bacterial tracers to detect human source contamination.22
Fecal coliform is
limited as a tracer because it is difficult to distinguish between human and animal fecal material
sources, whereas caffeine and pharmaceuticals have clear human origin. The correlation to fecal
coliform was measured for the analytes of interest (caffeine, ketoprofen, naproxen, diclofenac,
gemfibrozil, and ibuprofen) in several river ways in the Philippines.22
Using off-line SPE-LC
MS-MS, caffeine concentration was determined to be highly correlated to the fecal coliform
bacteria. This indicates that caffeine presence can be used as an alternative tracer to validate
sewage contamination.22
Caffeine was also analyzed in natural water sites throughout the Boston Harbor using off-
line SPE and LC MS-MS, and the compound was detected in concentration ranges from 15-185
ng/L.35
Illicit sewage discharges through storm water outfalls and residential treatment systems
were found to contribute to caffeine accumulation in the harbor. In addition, data collected in this
2015 study compared to data collected in the same area from 1988 to 1999 showed reductions in
caffeine levels. This preliminary data suggests that previous studies in this area have led to
upgrades in water treatment infrastructure, reducing combined sewage overflow and illicit
discharges in natural waterways.35
Outside variables may have also caused reduction in caffeine
levels, so additional analysis is needed.
The successful quantification of caffeine in environmental samples has shown it has
potential as a tracer; however, its use is limited by its degradation. In a study in Adelaide,
Australia, where wastewater was detained for 6 weeks in a polishing lagoon before analysis,
caffeine was not detected above the detection limit of 0.1 μg/L.23
Long wait times between
24
collection and detection limit caffeine’s use as a tracer due to its natural degradation. In the same
study, caffeine was stored for a shorter period in a Mandurah, Australia, site. It was detected in
the treated sewage effluent at 0.7 μg/L and in groundwater near the ponds at 0.5μg/L.23
Studies
of the degradation of various pharmaceuticals showed a rapid microbial degradation rate and
variable half-life for caffeine of 3.5 to over 100 days in estuary waters.42
Microbial degradation
of caffeine was confirmed by production of 14
CO2. Photocatalytic degradation of caffeine was
investigated in aqueous suspension of titanium dioxide (TiO2) and demonstrated that caffeine
quickly degraded by a photomineralization pathway.30
The exact method and timescale of
caffeine degradation is not known and environmental conditions under which caffeine remains
conservative require better definition. Investigations of caffeine show its potential as a tracer, as
well as some of its limitations, but studies will need to be continued in order to use caffeine
concentrations to quantify the extent of pollution.
1.7. Additional Tracers
Caffeine is used widely and successfully as a tracer for wastewater contamination in
environmental samples, but it is certainly not the only tracer available for analysis. Human
specific antibiotics, artificial sweeteners, drugs of abuse, or any persistent pharmaceutical can be
studied to indicate the presence of additional emerging contaminates. In a single study, online
SPE LC-MS-MS was used for the simultaneous detection of 31 antibiotics in drinking water,
surface water, and reclaimed water. The concentrations and number of target analytes detected
decreased from reclaimed waters to drinking waters, showing source specificity of the antibiotics
for wastewater. Results of this study also indicate that both surface and drinking water sources
are influenced by anthropogenic intrusions.20
Occurrences of drugs of abuse were also analyzed
and reported with concentrations reaching 27,000 ng/L. Transformation products of these
25
compounds formed by photodegradation, hydrolysis, chemical oxidation, and biodegradation,
which are typically not taken into account, were analyzed. A total of 35 transformation products
from 16 target analytes were identified.43
In another study, 18 illicit drugs and metabolites were
detected in sewage influents.21
Metabolites were found to be more abundant than the parent
compounds, suggesting metabolites should be used as main analytes for monitoring and tracing
sewage contamination in further studies.
Artificial sweeteners, particularly sucralose, which is found in Splenda, account for a
large amount of trace organic compounds discharged from wastewater treatment plants in the
United States due to their high consumption and poor removal by wastewater treatment
processes after secondary treatment.11
In one study, artificial sweeteners were found to account
for 2–3.3% of all incoming contaminants to a wastewater treatment plant. Unlike caffeine,
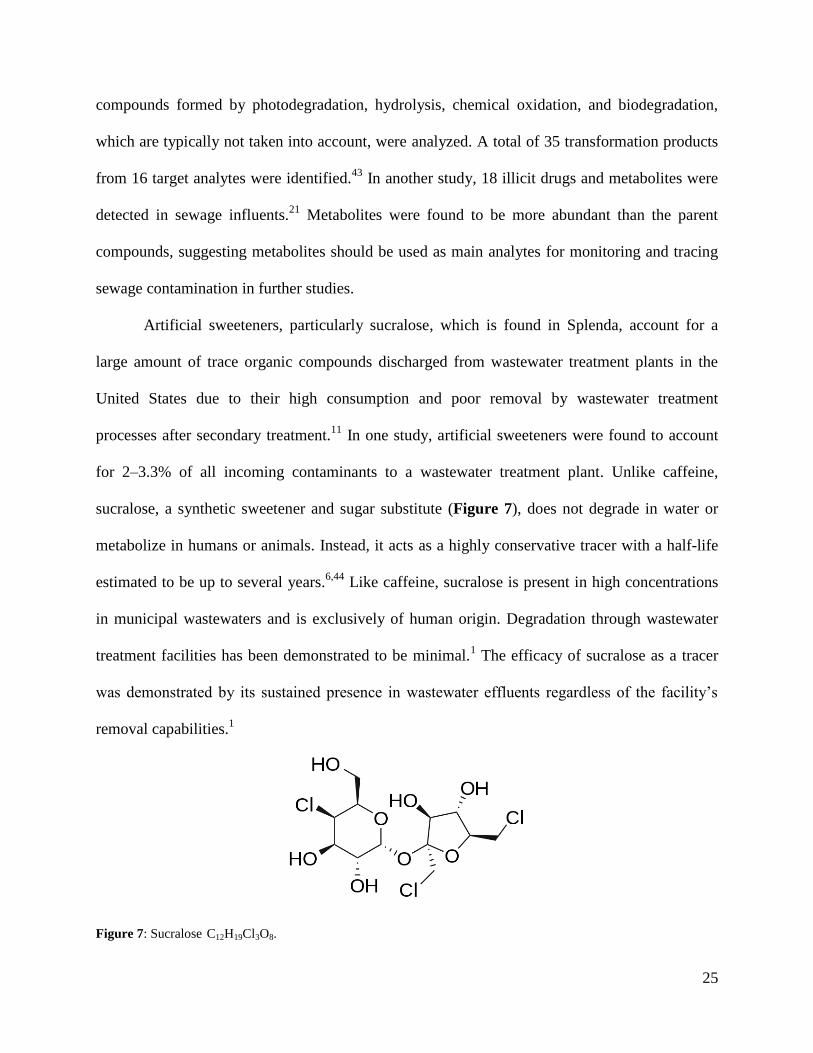
sucralose, a synthetic sweetener and sugar substitute (Figure 7), does not degrade in water or
metabolize in humans or animals. Instead, it acts as a highly conservative tracer with a half-life
estimated to be up to several years.6,44
Like caffeine, sucralose is present in high concentrations
in municipal wastewaters and is exclusively of human origin. Degradation through wastewater
treatment facilities has been demonstrated to be minimal.1 The efficacy of sucralose as a tracer
was demonstrated by its sustained presence in wastewater effluents regardless of the facility’s
removal capabilities.1
Figure 7: Sucralose C12H19Cl3O8.

26
The sucralose molecule is not adsorbed or metabolized by humans, and 98% is excreted
unchanged. Using an online SPE LC-MS-MS method, sucralose was detected in South Florida in
82% of reclaimed water samples at concentrations reaching 18 μg/L. Sucralose was also
observed in drinking water at a lowered, but still relevant, concentration of 465 ng/L. The
widespread occurrence in environmental waters, extreme resistance to photodegredation,
minimal sorption, and high solubility of sucralose indicate it has potential to be a feasible tracer.6
One study compared the suitability of a variety of anthropogenic compounds to sucralose as
wastewater indicators. The occurrence of each of the 85 selected organic compounds was
examined from a sample site with known wastewater inputs and a sample site without known
source inputs of contamination (upstream of discharge). Sucralose was consistently detected in
the effluent wastewater source and always absent in sources without wastewater influence,
indicating superior performance as a potential tracer. All other compounds were prone to false
negatives or false positives in detection in the environmental samples.1 While sucralose is a
suitable tracer, caffeine offers advantages that sucralose does not which will be discussed in
greater detail in section 1.8.
In the investigation of anthropogenic chemicals using offline SPE-HPLC-MS-MS as co-
tracers in two sites in Alberta and Ontario Canada, concentrations of artificial sweeteners,
pharmaceutical compounds, and a transformation product of nicotine in groundwater were found
to strongly correlate.26
The use of multiple tracers can be employed as a tool to increase the
confidence of identifying wastewater contamination. A wide range of wastewater tracers were
proposed, including both nearly ideal and less than ideal tracers and ubiquitous and non-
ubiquitous tracers. Non-ubiquitous tracers may help identify specific wastewater sources if
unique tracers from individual household septic systems are present in wastewater. Correlation

27
analysis and spatial distributions of co-tracers were considered to differentiate impacts by
different wastewater sources on groundwater at each site. Groundwater samples were analyzed
for chemicals considered to be candidates as wastewater co-tracers including caffeine,
sweeteners, and a variety of pharmaceuticals. The artificial sweetener acesulfame, commonly
marketed under the names Sunett or Sweet One, was the most commonly detected. Caffeine was
found in all samples, but it was also found in laboratory blanks at similar concentrations to
groundwater detections, so caffeine was not considered as a co-tracer in this study. Strong
correlations were found between all paired compounds. Multiple correlations suggest a single
source of contamination, whereas differences in the relative concentrations of the co-tracers and
a weaker correlation may indicate multiple sources of contamination. At the second site,
correlation was inconsistent, indicating different wastewater sources. Results of co-tracer studies
suggest that the use of more than one tracer may be needed to distinguish wastewater sources.26
1.8. Advantages of Caffeine
While there is a wide variety of tracers that have been studied for indication of
environmental contamination, caffeine is a more effective choice than other pharmaceuticals,
antibiotics or artificial sweeteners. With relatively high concentrations in domestic wastewater
due to regular and constant consumption, clear anthropogenic origin, and the ability to
distinguish sources of pollution, caffeine meets all of the requirements of an ideal environmental
tracer.32
Its persistence in surface waters, high solubility, and negligible volatility also make it
easy to detect compared to other pharmaceutical chemicals.22
Caffeine concentrations detected
in the North Sea at up to 16 ng/L were found to be at least one order of magnitude higher than
those of the pharmaceutical clofibric acid or the insect repellent DEET.17
Caffeine is also directly
related to human activities with no potential biogenic sources.24
When compared to fecal
28
coliforms, caffeine is a better tracer because LC analysis can be performed much faster than
measurement of bacterial cultures. Caffeine is also exclusively human, whereas fecal coliform
cultures cannot differentiate human and animals.
The lack of specificity for treated or untreated wastewaters may be another drawback of
many antibiotic or artificial sweetener tracers. Caffeine is more wastewater specific than other
pharmaceuticals or emerging contaminants due to excellent elimination rates during wastewater
processing. Sucralose, for example, is somewhat limited as a tracer due to its high stability,
persistence, and slow rate of decay. It has a much more widespread and uniform appearance than
caffeine, making it harder to differentiate older from newer sources of contamination. Caffeine’s
degradation rate allows the indication of rapidly transported, untreated wastewater.24
Caffeine,
however, is also limited by its variable degradation rate and its undefined lifetime in
environmental water.23
In future studies, caffeine may be used as a co-tracer with sucralose or
additional pharmaceuticals to provide comprehensive information about environmental water
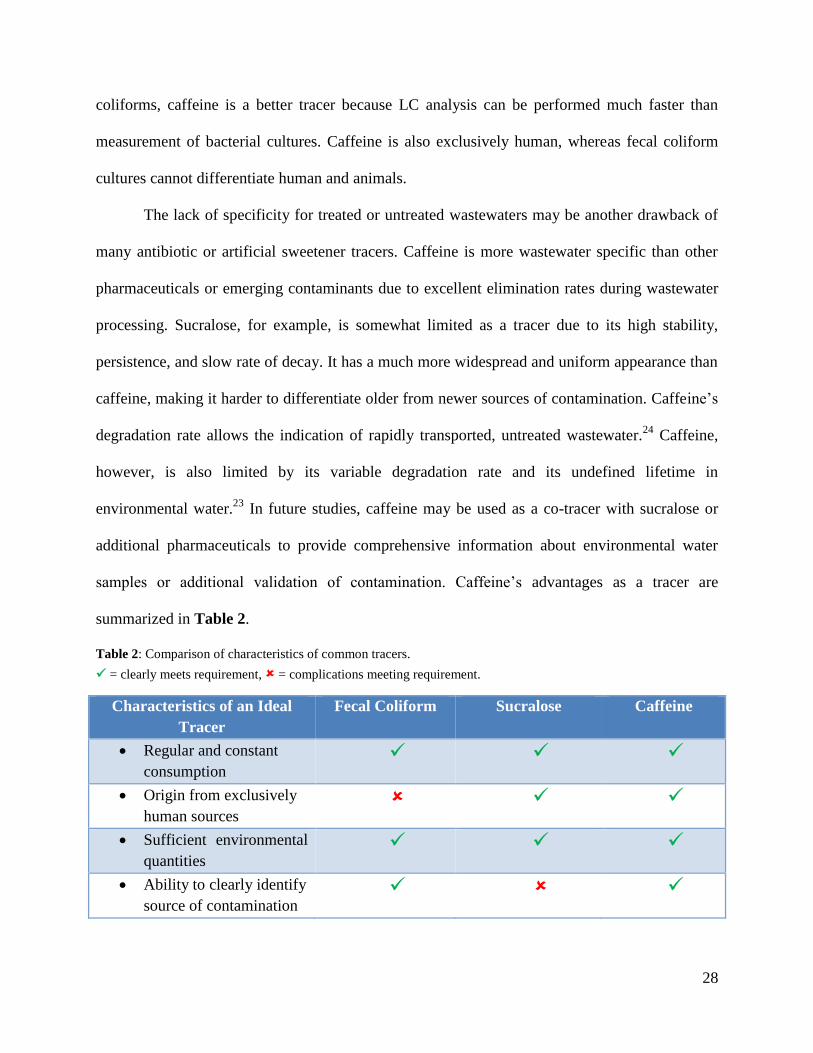
samples or additional validation of contamination. Caffeine’s advantages as a tracer are
summarized in Table 2.
Table 2: Comparison of characteristics of common tracers. = clearly meets requirement, = complications meeting requirement.
Characteristics of an Ideal
Tracer
Fecal Coliform Sucralose Caffeine
Regular and constant
consumption
Origin from exclusively
human sources
Sufficient environmental
quantities
Ability to clearly identify
source of contamination
29
1.9. Current Limitations on Analysis of Emerging Contaminants
The analysis of emerging contaminants and the implications of the research on improving
wastewater treatment processes are still being studied. While GS and HPLC MS are established
for use in analysis of wastewater contamination, improvements to the methods are still needed.
Emerging contaminants and metabolites may have unknown structures or exist in complex
environmental matrices at trace levels making it a challenge to develop rapid and accurate
analytical methods. Further research is needed to expand the current knowledge of compound
structures and improve method accuracy and sensitivity.3 Additionally, some pharmaceuticals
and personal care products may transform via bio- or photo-degradation, but very few by-
products or transformation products of pharmaceutical compounds are studies or monitored. The
fate of emerging contaminates may strongly depend on environmental conditions such as
temperature, salinity, pH, and biological activity.45
Knowledge of the physico-chemical
properties for each pharmaceutical compound is essential for predicting removal mechanisms.3
Analysis of contamination has also yet to be extensively explored in drinking water.
Concentrations of contaminants vary in different areas and regions based on human activity and
changes in climate, so emerging contaminants must continue to be studied in areas throughout
the world.
To refine the use of caffeine as a tracer, further research is needed on its half-life and
degradation behavior in natural waters.35
Studies often conclude the presence of a tracer or
targeted compound is indicative of domestic wastewater contamination, but they fail to predict
the extent of contamination.12
While caffeine concentration is expected to correlate with the
concentration of emerging contaminants, further studies need to address the co-occurrence of
caffeine and other traditional water quality contaminants in order to quantify contamination.12
30
Human health risk assessment and eco-toxicological risk assessment must also be developed to
understand the extent of the effect of contaminants on the environment and various aquatic
species.2 After confirming the presence of contamination, studies in emerging contaminants must
then be applied to identify sources of wastewater contamination and to initiate improvements to
wastewater treatment plants’ infrastructure or processes.
1.10. Project Overview: Caffeine Analysis of Wastewater in South Florida
This goal of this study is to develop and validate a fast and reliable method based on on-
line SPE-HPLC-MS for the analysis of caffeine in reclaimed waters and surface waters at Florida
International University located in Miami, Florida. In this project, samples of reclaimed water,
Miami Beach water, and environmental waters from Florida International University and around
South Florida were collected and analyzed to determine their concentrations of caffeine. This
study aims to:
(1) develop a comprehensive screening technique for caffeine using on-line solid phase
extraction pre-concentration coupled with a high-pressure liquid chromatography
system and high resolution mass spectrometer
(2) characterize the relative intensities of dissolved organic matter in water samples using
fluorescence excitation emission matrices
(3) understand the occurrence of caffeine at trace concentrations in reclaimed and
environmental waters for the ultimate purpose of improving wastewater treatment
facilities
Using multiple characterization methods, we can evaluate caffeine’s usefulness as an
environmental tracer for wastewater contamination in South Florida. Caffeine has shown
potential as an environmental tracer in previous studies and is expected to indicate the presence
31
of pharmaceuticals, personal care products, and additional emerging contaminants. In this study,
we expect caffeine to be detected in significant concentrations in reclaimed water due to its
ubiquitous presence and non-comprehensive removal in traditional wastewater treatment
systems. Similarly significant concentrations of caffeine detected in environmental samples
would indicate contributions of wastewater contamination and the presence of emerging
contaminants. Relatively lower concentrations would suggest that samples have not been
influenced by reclaimed or treated wastewaters or that their contributions have been highly
diluted. Using these methods, we can assess the quality of wastewater treatment facilities and
processes and determine their effects on nearby environmental water ways.

32
2. Experimental
2.1. Reagents and Chemicals
Caffeine and deuterated caffeine solutions were received from Fisher Scientific. Working
solutions of the standard and internal standard solutions were prepared in deionized (DI) water at
concentrations of 10 ng/L (ppt). Optima LC/MS grade methanol, water, and acetonitrile were
purchased from Fisher Scientific and used for standard preparation and HPLC mobile phases.
Optima LC/MS grade formic acid was purchased from Fisher Scientific and used to prepare
0.1% solution of modifier mobile phase. Artificial seawater (3.5 % w/v) was prepared using
Instant Ocean salt.
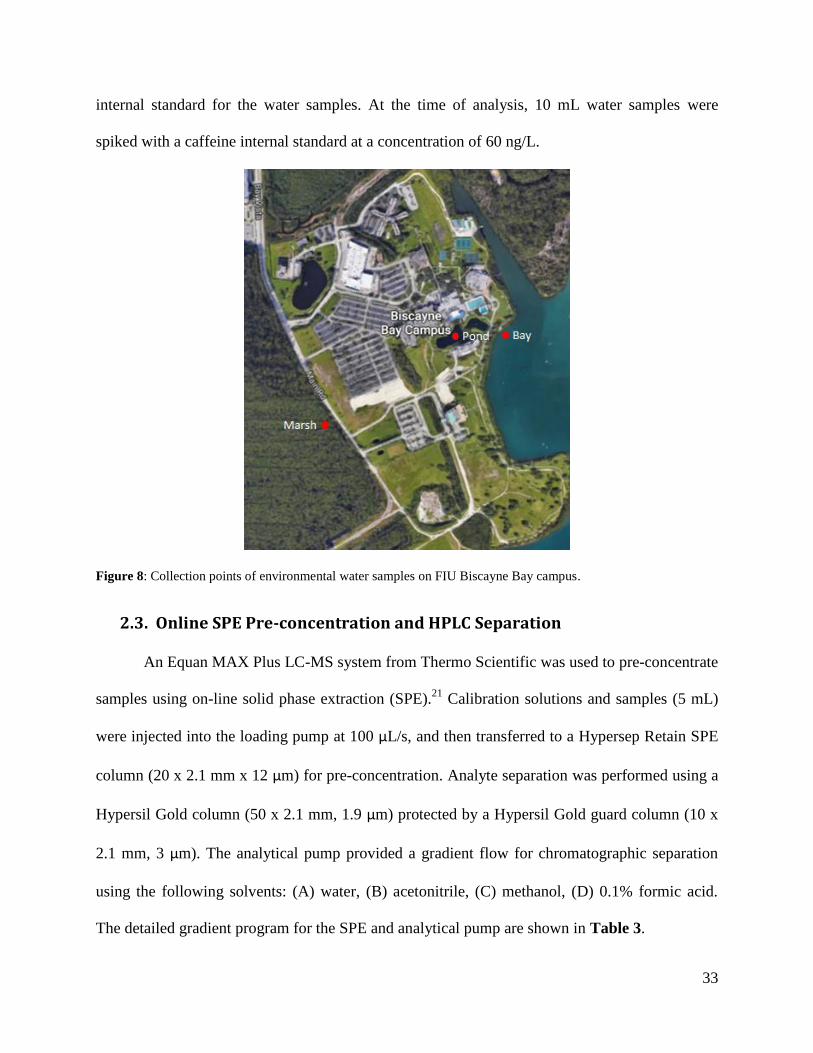
2.2. Sample Collection and Preparation
The Miami-Dade North District Waste Water Treatment Facility has a reclaimed
distribution line to the Florida International University (FIU) Biscayne Bay campus that was
used as the source of reclaimed water in this study. A total of eight reclaimed water samples
were collected during June and July of 2016. In addition, 22 samples from surface waters and the
outfall of flood-control pumps were collected from the Miami Beach area during a King Tide
event (the highest high tide of the year) in 2015. Although the exact collection locations of these
samples varied, they will be collectively referred to as Miami Beach samples. Additional
samples were collected from the Biscayne Bay, a retention pond and a marsh on the FIU campus
(Figure 8), and an unmarked airboat trail and canal S333 in Everglades National Park in June
and July of 2016. All samples were refrigerated at 4 °C until the time of analysis. Samples were
filtered using a 2.0 μm Millipore nylon membrane filter. Deuterated caffeine was used as the
33
internal standard for the water samples. At the time of analysis, 10 mL water samples were
spiked with a caffeine internal standard at a concentration of 60 ng/L.
Figure 8: Collection points of environmental water samples on FIU Biscayne Bay campus.
2.3. Online SPE Pre-concentration and HPLC Separation
An Equan MAX Plus LC-MS system from Thermo Scientific was used to pre-concentrate
samples using on-line solid phase extraction (SPE).21
Calibration solutions and samples (5 mL)
were injected into the loading pump at 100 μL/s, and then transferred to a Hypersep Retain SPE
column (20 x 2.1 mm x 12 μm) for pre-concentration. Analyte separation was performed using a
Hypersil Gold column (50 x 2.1 mm, 1.9 μm) protected by a Hypersil Gold guard column (10 x
2.1 mm, 3 μm). The analytical pump provided a gradient flow for chromatographic separation
using the following solvents: (A) water, (B) acetonitrile, (C) methanol, (D) 0.1% formic acid.
The detailed gradient program for the SPE and analytical pump are shown in Table 3.

34
Table 3: SPE pump and analytical pump gradient programs. Mobile phases: (A) water; (B) acetonitrile; (C)
methanol; (D) 0.1% formic acid.
SPE Pump Analytical Pump
Time
(min)
A% B% C% D% Flow
(μl/min)
Time
(min)
A% B% C% D% Flow
(μl/min)
0.0 1 1 98 500 0.0 100 2000
4.0 100 500
8.0 47 50 3 500 8.0 50 50 500
10.5 1 1 98 500 10.5 100 1000
14.0 1 1 98 500 14.0 100 1000
2.4. Mass Spectrometry
Detection of caffeine was performed using Xcalibur software and a Q Exactive™
Orbitrap-quadrupole hybrid mass spectrometer with a heated electrospray ionization source
(HESI). Samples were run in full scan (m/z 70–400), positive identification mode. Detailed
operating conditions for mass spectral analysis are shown in Table 4. The concentration of
caffeine in each sample was quantitated using TraceFinder EFS 3.0 software and the standard
calibration plot for caffeine in DI water.
Table 4: Source and full scan operating conditions for mass spectrometry.
Parameter Setting Source HESI II Capillary temperature (°C) 350 Method duration (min) 14 Polarity Positive Mass range (m/z) 70–400 Resolution settings 140,000 AGC target 3e6 Max injection time (ms) 200
2.5. Method Validation
Calibration plots were used to determine the concentration of unknown samples by
comparing the samples to a set of standard solutions with known concentrations of caffeine.
35
Seven standard solutions were prepared at concentrations of 10, 50, 100, 250, 500, 1000, and
2000 ng/L caffeine, and each was spiked with 60 ng/L deuterated caffeine in DI water. Two
additional calibration plots were prepared in tap water and artificial seawater respectively to
examine matrix effects. After HPLC and mass spectral analysis, the area ratio of the caffeine
chromatography peak to the deuterated caffeine peak as a function of caffeine concentration was
used to obtain three separate linear regression plots for DI water, tap water, and artificial sea
water. Method detection limits, or the minimum concentration of a substance that can be
measured and reported, were calculated by multiplying the standard deviation of seven replicate
10 mL samples (spiked with 50 ng/L caffeine, 60 ng/L deuterated caffeine) by the Student t
value (t=3.143, 98% confidence) following the procedure are outlined by the USEPA.21
Method
detection limits were calculated for caffeine in DI water, tap water, and artificial sea water.
2.6. Fluorescence Analysis
Fluorescence EEM spectra were recorded for all water samples using a Horiba Scientific
Aqualog. Excitation wavelengths were determined every 1 nm from 250 nm to 600 nm, and
emission wavelengths were determined from 200 nm to 600 nm at intervals of 0.8 nm with 1
second integration times. The EEM of DI water was used as a blank and 1st order Rayleigh
scattering was masked for all sample EEMs.
36
3. Results and Discussion
3.1. SPE-HPLC-HRMS Optimization
During optimization for analytical separation of water samples, a Hypersil Gold column
(50 x 2.1 mm, 1.9 μm) is selected based on the clarity of the resulting peak shape and its use in
related experiments.43
Adequate chromatographic separation results in resolved, narrow peaks
with a Gaussian distribution. Mobile phase composition includes water, acetonitrile, methanol,
and 0.1% formic acid and is adjusted to affect peak shape and signal intensity. The detailed
gradient composition and flow rate from 500 to 2000 μL/min are shown in Table 3. MS analysis
of samples is run in full scan and positive ion identification mode. Observed masses are recorded
in Xcalibur software. Due to the use of a HESI, a soft ionization source, fragmentation of the
caffeine molecule does not occur; instead the major ionization product results from the addition
of a hydrogen cation to the mass of the analyte, [M+H+]. The presence of caffeine can be
confirmed by mass and is determined to be m/z 195.0878 for caffeine and m/z 198.0977 for the
deuterated caffeine internal standard. The MS spectrum below (Figure 9) of a 2000 ng/L
calibration standard solution shows the full scan spectrum (m/z 70–400) and relative abundance
of each compound present in the sample. The image zooms in on the m/z 195.00–195.15 region
of the spectrum and identifies the caffeine peak at m/z 195.0875, which is consistent with the
major ionization product [M+H+].
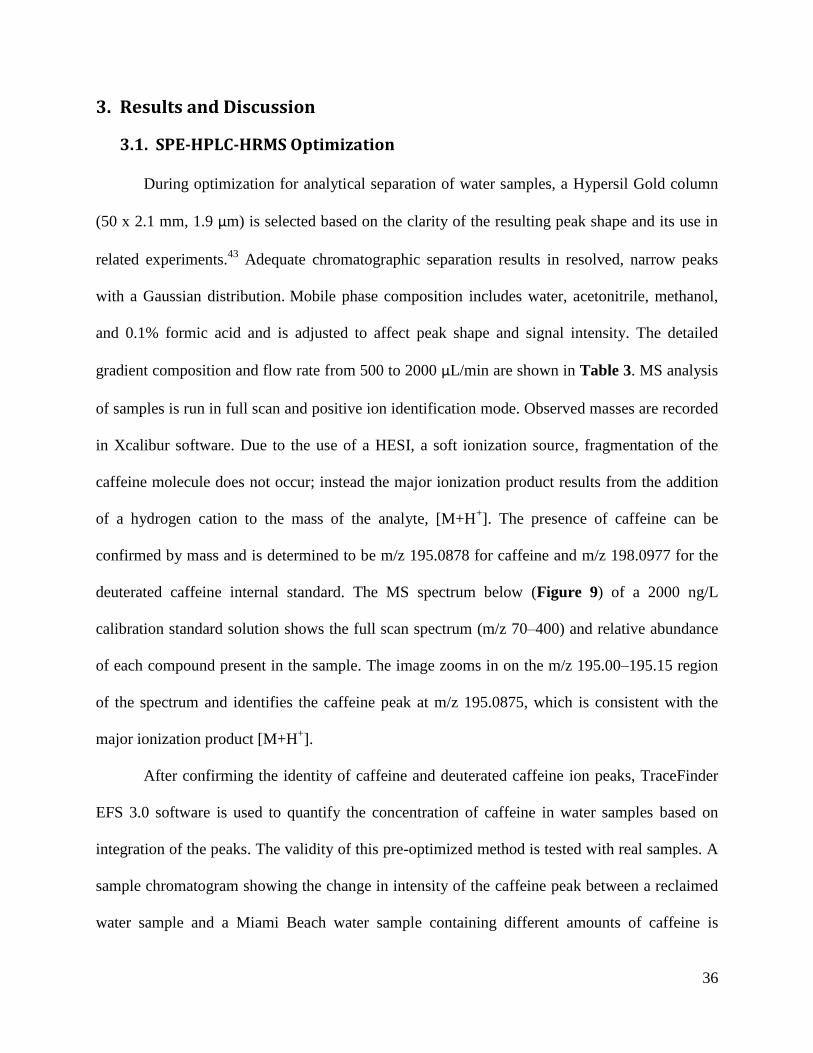
After confirming the identity of caffeine and deuterated caffeine ion peaks, TraceFinder
EFS 3.0 software is used to quantify the concentration of caffeine in water samples based on
integration of the peaks. The validity of this pre-optimized method is tested with real samples. A
sample chromatogram showing the change in intensity of the caffeine peak between a reclaimed
water sample and a Miami Beach water sample containing different amounts of caffeine is

37
shown in Figure 10. The sample of reclaimed water (a) has a peak integration of 7.8 × 10⁷ and
caffeine concentration is calculated as 746.25 ng/L. The peak has a narrow distribution
indicating efficient separation, but slight tailing is seen due to adsorptive effects of the stationary
phase or the quality of column packing. Slight tailing is negligible and deemed acceptable within
the optimal procedure. A sample of Miami Beach water (b) is found to have a peak integration of
2.8 ×10⁶ and caffeine concentration 10.33 ng/L. This peak is more uniform but much lower in
intensity due to the lower concentration of caffeine in the sample. Caffeine concentrations in
samples are described in more detail in section 3.3. After optimization, calibration is performed
to validate the method.
Figure 9: Full scan (m/z 70–400) mass spectrum of 2000 ng/L caffeine calibration standard solution in DI water and
zoomed scan range of m/z 195.00–195.15 identifying caffeine peak at m/z 195.0875 (inserted figure).
38
Figure 10: TraceFinder EFS 3.0 ion chromatograms of caffeine in (a) reclaimed water and (b) Miami Beach water
samples.
3.2. Method Validation
3.2.1. Calibration and Quality Control
The optimized online SPE-HPLC-MS method is validated based on linearity and
detection limits. Three calibration plots are made by first preparing seven calibration standard
solutions (10–2000 ng/L caffeine) each in DI water, artificial salt water, and tap water. After
SPE-HPLC analysis, calibration plots are obtained from plotting the peak area ratio of caffeine to
deuterated caffeine internal standard against concentration in ng/L. Using this standard
calibration method, linearity is observed in all three plots. Although three calibration plots are
prepared in various matrices, matrix effects on caffeine recovery are not fully investigated in this
study. A previous study has shown good recovery (89%) of caffeine in fresh, saltwater, and
natural samples independently of matrix composition.12
Additional analyses can be implemented
in future iterations of this study, but the effects of sample matrices are not expected to
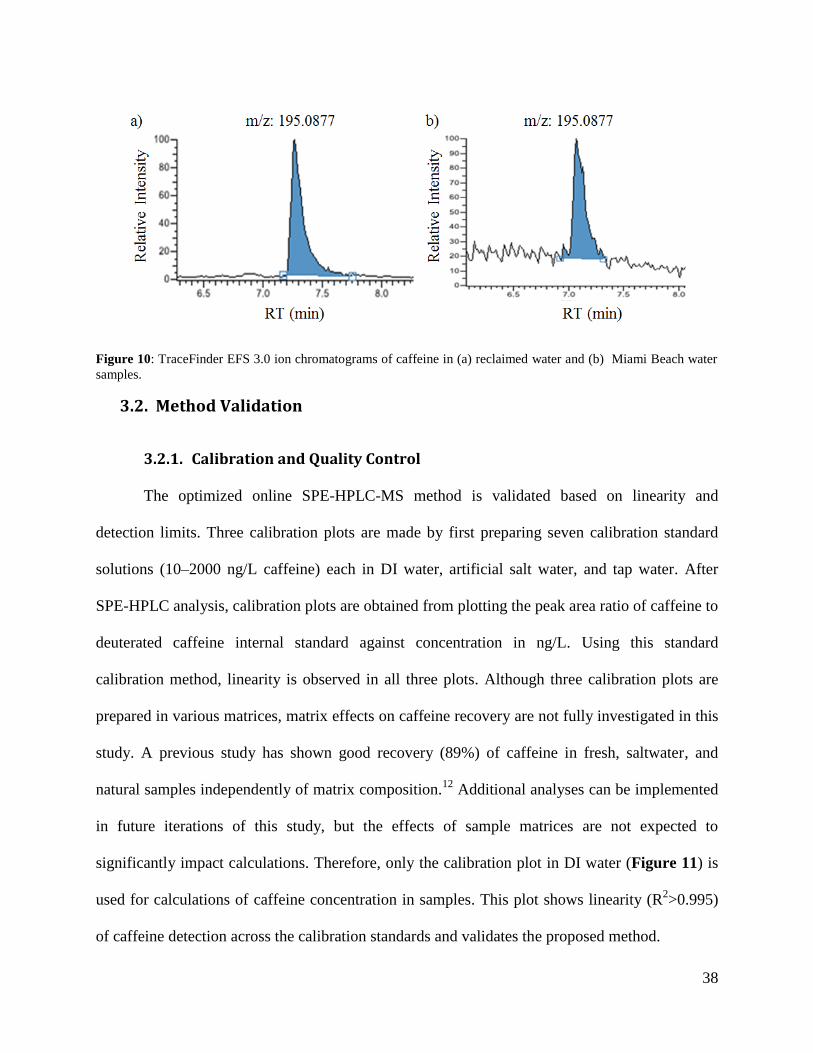
significantly impact calculations. Therefore, only the calibration plot in DI water (Figure 11) is
used for calculations of caffeine concentration in samples. This plot shows linearity (R2>0.995)
of caffeine detection across the calibration standards and validates the proposed method.
39
Figure 11: Calibration curve of 0, 10, 50, 100, 250, 500, 1000 and 2000 ng/L caffeine standard solutions in DI
water.
With every analysis batch, additional quality control samples are also used. Blanks are
run with each set of samples to assess contamination and background levels. A laboratory
fortified blank, laboratory fortified blank duplicate (LFB and LFB-DUP), and laboratory fortified
matrix (LFM) each spiked with 100 ng/L caffeine are used as a measure of accuracy and
precision of the analytical procedure and to determine accuracy of the method in the presence of
the matrix.21
3.2.2. Method Detection Limits
To determine method detection limits (MDL), three sets of seven replicate 50 ng/L spiked
samples are prepared in DI water, artificial sea water, and tap water respectively. The caffeine
concentration is then calculated for each sample after MS analysis. MDLs are calculated by
multiplying the standard deviation of the calculated concentration for each of the seven replicates
by the Student t value, (t=3.143, 98% confidence). MDL calculations for each matrix are
reported in Table 5. The variation in the MDLs for DI water, artificial sea water, and tap water
results from effects of each matrix, an area that is not explored in depth in this study. Calculated

40
concentrations of caffeine that are below the MDL for DI water are considered non-detections.
The MDL is consistent with other detection limits reported for caffeine in recent studies which
range from a few ng/l to as low as <1.0 ng/L.12,35
After validation of the method by calibration
and determination of MDLs, sample analysis can begin.
Table 5: Calculated method detection limits (ng/L) for caffeine at a spike level of 50 ng/L.
Matrix MDL (ng/L)
DI water 3.3
Artificial seawater 8.3
Tap water 7.9
3.3. Occurrence of Caffeine by SPE-HPLC-HRMS
After MS analysis of samples, concentration of caffeine is obtained using TraceFinder
EFS 3.0 software based on the prepared calibration plots. Analysis is performed on the eight
samples of reclaimed water and 22 Miami Beach samples, as well as the additional
environmental samples taken from the retention pond, marsh, Biscayne Bay, Everglades airboat
trail canal, and canal S333. Preliminary analysis of samples from these additional sources is
based on one sample collection. The calculated caffeine concentrations of these samples, along
with the average values of the data sets from the reclaimed water and the Miami Beach water
samples, are shown in the bar graph in Figure 12.
41
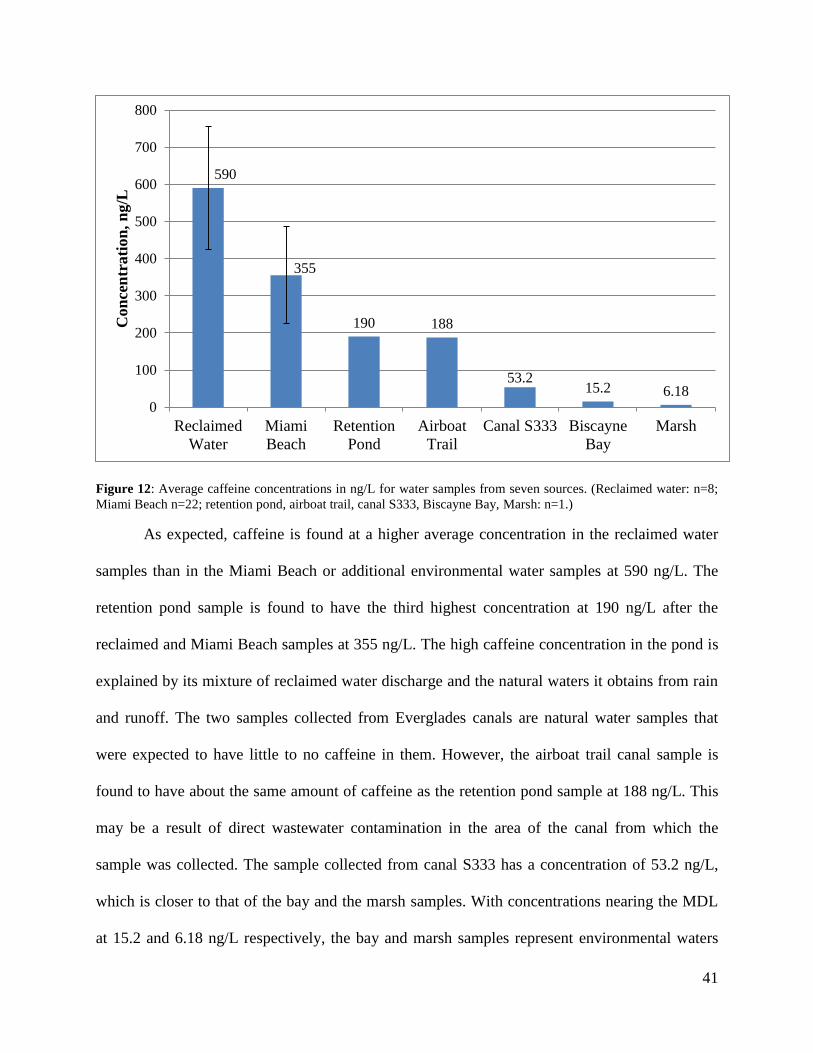
Figure 12: Average caffeine concentrations in ng/L for water samples from seven sources. (Reclaimed water: n=8;
Miami Beach n=22; retention pond, airboat trail, canal S333, Biscayne Bay, Marsh: n=1.)
As expected, caffeine is found at a higher average concentration in the reclaimed water
samples than in the Miami Beach or additional environmental water samples at 590 ng/L. The
retention pond sample is found to have the third highest concentration at 190 ng/L after the
reclaimed and Miami Beach samples at 355 ng/L. The high caffeine concentration in the pond is
explained by its mixture of reclaimed water discharge and the natural waters it obtains from rain
and runoff. The two samples collected from Everglades canals are natural water samples that
were expected to have little to no caffeine in them. However, the airboat trail canal sample is
found to have about the same amount of caffeine as the retention pond sample at 188 ng/L. This
may be a result of direct wastewater contamination in the area of the canal from which the
sample was collected. The sample collected from canal S333 has a concentration of 53.2 ng/L,
which is closer to that of the bay and the marsh samples. With concentrations nearing the MDL
at 15.2 and 6.18 ng/L respectively, the bay and marsh samples represent environmental waters
590
355
190 188
53.2 15.2 6.18
0
100
200
300
400
500
600
700
800
Reclaimed
Water
Miami
Beach
Retention
Pond
Airboat
Trail
Canal S333 Biscayne
Bay
Marsh
Con
cen
trati
on
, n
g/L

42
that have not been exposed to significant contamination by wastewater or reclaimed water. These
results are comparable to caffeine concentrations found during previous studies; surface waters
samples from the Biscayne Bay and Miami River ranged from <4 to 41.2 ng/L while samples
from shore environments along South Florida ranged from 5.5 – 68 ng/L.12,46
Additional
replicate samples from each collection site examined in this study are necessary to verify the
amount of caffeine present in each source.
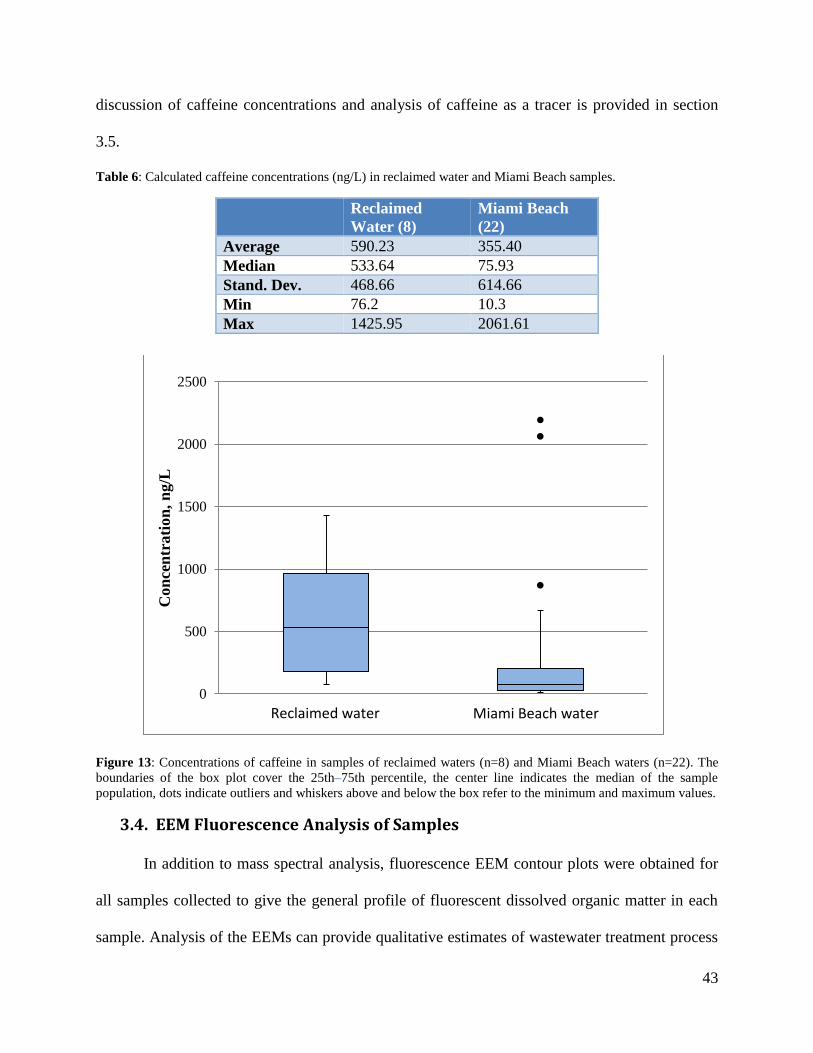
The reclaimed water and Miami Beach water sample sets can be compared in more depth.
The average, median, standard deviation, and minimum and maximum values of the calculated
concentration of caffeine in the eight samples of reclaimed water and 22 Miami Beach samples
are shown in Table 6. Concentrations found in this study for each sample source are highly
variable. The broad range of caffeine in the reclaimed water suggests the concentration of
contaminants can still vary significantly in treated waters. The Miami Beach samples were
collected from flood control pumps in different areas of Miami and Miami Beach. The large
range in concentration values may be a result of differing levels of exposure to wastewater
depending on the location of collection. The outlying values of high concentration may have
been from areas which were highly contaminated with runoff wastewaters, but the exact
collection location of each sample was not provided. A comparison of the caffeine
concentrations found in the reclaimed water samples and Miami Beach samples is shown in the
box plot below (Figure 13). The boundaries of the box cover the 25th
–75th
percentile, the center
lines indicate the median of the sample population, and the whiskers above and below the box
represent the 10th
and 90th
percentile. Outliers are depicted at dots. When the three high value
outliers, are removed, the average amount of caffeine in the Miami Beach samples is found to be
141.76, and is statistically significantly different than the reclaimed water concentration. Further
43
discussion of caffeine concentrations and analysis of caffeine as a tracer is provided in section
3.5.
Table 6: Calculated caffeine concentrations (ng/L) in reclaimed water and Miami Beach samples.
Reclaimed
Water (8)
Miami Beach
(22)
Average 590.23 355.40
Median 533.64 75.93
Stand. Dev. 468.66 614.66
Min 76.2 10.3
Max 1425.95 2061.61
Figure 13: Concentrations of caffeine in samples of reclaimed waters (n=8) and Miami Beach waters (n=22). The
boundaries of the box plot cover the 25th–75th percentile, the center line indicates the median of the sample
population, dots indicate outliers and whiskers above and below the box refer to the minimum and maximum values.
3.4. EEM Fluorescence Analysis of Samples
In addition to mass spectral analysis, fluorescence EEM contour plots were obtained for
all samples collected to give the general profile of fluorescent dissolved organic matter in each
sample. Analysis of the EEMs can provide qualitative estimates of wastewater treatment process
0
500
1000
1500
2000
2500
Con
cen
trati
on
, n
g/L
Reclaimed water Miami Beach water

44
efficacy. Emission wavelength (nm) is plotted against excitation wavelength (nm) with color
corresponding to the intensity of fluorescence. The contour plots of a single sample of reclaimed
water (168.914 ng/L), the retention pond water sample (190 ng/L), and a Miami Beach water
sample (10.33 ng/L) are shown in Figure 14 to demonstrate the differences in intensity of DOM
in each sample source. All samples are found to have nearly identical profile patterns, indicating
their compositions of organic matter are nearly the same. Identification and analysis of the
PARAFAC components is needed in order to identify the actual makeup of the dissolved organic
matter; however, PARAFAC components were not determined for the fluorescence EEMs in this
study. The differences in the intensities of the EEM profiles between samples are the only factor
that is being examined.
Figure 14: Fluorescence emission excitation contour plots showing intensity of fluorescent dissolved organic matter
(DOM) in reclaimed water, retention pond water, and Miami Beach water.
The intensities of the fluorescence matrices are compared to the calculated caffeine
concentrations in each sample. The intensity may be expected to correspond to the concentration
of additional emerging contaminants. The similar light blue color profiles in the reclaimed water
and retention pond water samples indicate a similar composition and concentration of dissolved
organic matter. This trend is supported by the similarities in the caffeine concentration in the two
samples (168.914 ng/L and 189.958 ng/L) calculated from mass spectral analysis. The samples
45
with the greatest intensity appear to correlate to the sample with the greatest concentration of
caffeine. Conversely, the differing intensities between the first two samples and the Miami
Beach sample (light blue to dark blue) indicate their differing concentrations of dissolved
organic matter. This trend is again supported by mass spectral analysis, as the Miami Beach
sample contains only 10.33 ng/L of caffeine. Overall, where intensity of DOM is greater, the
relative abundance of peaks throughout the MS spectrum of a sample also appeared to be greater.
These findings indicate that fluorescence EEM data can be used as a complementary method to
mass spectral data in determining relative concentrations of dissolved organic matter or emerging
contaminants between samples. Comparison of MS data on additional emerging contaminants
with sample EEMs would further define this relationship.
3.5. Caffeine’s Usefulness as a Tracer
Caffeine has been ubiquitously found in natural waters even after treatment; previous
studies on the removal efficiency of caffeine in wastewater treatment processes show incomplete
removal with 81–99% efficiency.14
Mean concentration of 3203 ng/L in influent samples and
70.22 ng/L in effluent samples have been reported.18
Similarly, caffeine detected in sewage
samples at 20–293 μg/L was reduced to 7–87 ng/L in sea water samples in Norway.45
The
repeated detection of caffeine in water samples after treatment shows that caffeine or other
unmonitored emerging contaminants still enter environmental waterways through effluent
waters. In this study, caffeine is detected in significantly higher concentrations in reclaimed
water samples (at an average of 590.23 ng/L) than in environmental samples. This is as expected
due to the ubiquitous presence and non-comprehensive removal of caffeine in wastewater
treatment processes. Its source specificity for domestic wastewater is also demonstrated, as in
previous studies.24,41
Calculated caffeine concentrations in each sample are in agreement with

46
their sources’ expected exposure to wastewater. Concentrations of caffeine in environmental
water samples that are around or above the concentration found in reclaimed water indicate
contamination. This is seen in several of the Miami Beach water samples, with caffeine
concentrations up to four times the average for reclaimed water. Samples with concentrations
lower than those found in the reclaimed water and close to the MDL, such as the samples from
the bay and the marsh, suggest that the water sources have not been significantly contaminated or
have successfully undergone a complete treatment process. The ability to differentiate sample
sources based on relative caffeine levels indicates the superior performance of caffeine as a
tracer.
A correlation is suggested between the concentrations of caffeine in each sample and the
concentration of other pollutants or emerging contaminants found; however, that correlation is
not explored in depth in this study, as only the tracer caffeine is studied. Additional water
samples from a variety of sources and mass spectral analysis of common targeted emerging
contaminants including caffeine are required to identify the extent of the correlation. With
additional analysis, we can assess the quality of wastewater treatment processes and facilities on
their removal of contaminants, as well as the effect of their effluents on nearby environmental
water ways. Results of this study suggest that the method developed to quantity caffeine at trace
levels in environmental aqueous matrices using SPE HPLC HRMS is successfully employed. In
addition, changes in intensity of fluorescence EEM can be used as an additional method of
quantifying the efficiency of water treatment facilities. The study demonstrates the capability of
caffeine to differentiate samples based on their exposure to wastewater and its suitability as an
anthropogenic tracer of wastewater contamination in environmental water samples. Development
of this method is important for consistent detection of caffeine at trace levels. Improved

47
monitoring to assess changes in water treatment processes may lead to upgrades in water
treatment infrastructure and reduction of environmental contamination.
48
4. Conclusion
A new on-line solid phase extraction pre-concentration coupled with high pressure liquid
chromatography and high resolution mass spectrometry method for caffeine was developed and
optimized in this study. Successful quantification of caffeine in aqueous samples of reclaimed
water and environmental samples in Miami, FL was reported. Caffeine was found to be present
in reclaimed water sample at an average concentration of 590.23 ng/L and in Miami Beach
samples at an average of 355.40 ng/L. Additional environmental samples had concentrations
ranging from 6.18 to 190 ng/L. Caffeine’s elevated presence in reclaimed water demonstrates its
ability to differentiate between treated wastewaters and environmental waters. This suggests that
caffeine can be employed as a useful tracer for indicating the presence of wastewater and
additional compounds in natural water samples in this region. Additionally, fluorescence
emission excitation analysis was performed for all water samples to compare profiles of
fluorescent dissolved organic matter (DOM). Data showed similar characteristic profiles for
reclaimed water and natural waters differing only in intensity of DOM. This supports mass
spectral data when compared to caffeine concentrations in individual samples; sample with high
intensity DOM were found to have higher concentrations of caffeine and vice versa. Additional
analysis is needed to strengthen the correlation between caffeine and additional emerging
contaminants in the environment. This research can be applied to the continued monitoring of
emerging contaminants in order to improve wastewater treatment facilities and reclaimed water
distribution policies.
49
References
(1) Oppenheimer, J.; Eaton, A.; Badruzzaman, M.; Haghani, A. W.; Jacangelo, J. G. Water
Res. 2011, 45 (13), 4019–4027.
(2) Mompelat, S.; Le Bot, B.; Thomas, O. Environ. Int. 2009, 35 (5), 803–814.
(3) Wu, J.; Zhang, L.; Yang, Z. Crit. Rev. Anal. Chem. 2010, 40 (March), 234–245.
(4) Caliman, F. A.; Gavrilescu, M. Clean - Soil, Air, Water. 2009, pp 277–303.
(5) Girarad, J. E. In Principles of Environmental Chemistry; Jones and Bartlett Learning:
Burlington, MA, 2014; pp 228–255.
(6) Batchu, S. R.; Quinete, N.; Panditi, V. R.; Gardinali, P. R. Chem. Cent. J. 2013, 7 (1), 1–
16.
(7) Stackelberg, P. E.; Gibs, J.; Furlong, E. T.; Meyer, M. T.; Zaugg, S. D.; Lippincott, R. L.
Sci. Total Environ. 2007, 377 (2–3), 255–272.
(8) Santos, J. L.; Aparicio, I.; Callejón, M.; Alonso, E. J. Hazard. Mater. 2009, 164 (2–3),
1509–1516.
(9) Kasprzyk-Hordern, B.; Dinsdale, R. M.; Guwy, A. J. Water Res. 2009, 43 (2), 363–380.
(10) Subedi, B.; Codru, N.; Dziewulski, D. M.; Wilson, L. R.; Xue, J.; Yun, S.; Braun-
Howland, E.; Minihane, C.; Kannan, K. Water Res. 2015, 72, 28–39.
(11) Anumol, T.; Vijayanandan, A.; Park, M.; Philip, L.; Snyder, S. A. Environ. Int. 2016, 92,
33–42.
(12) Gardinali, P. R.; Zhao, X. Environ. Int. 2002, 28 (6), 521–528.
(13) Elliot, T. Water (Switzerland). 2014, pp 3264–3269.
(14) Buerge, I. J.; Poiger, T.; Müller, M. D.; Buser, H.-R. Environ. Sci. Technol. 2003, 37 (4),
691–700.
(15) Choi, K.; Kim, Y.; Park, J.; Park, C. K.; Kim, M.; Kim, H. S.; Kim, P. Sci. Total Environ.
2008, 405 (1–3), 120–128.
(16) Wanda, E. M. M.; Nyoni, H.; Mamba, B. B.; Msagati, T. A. M. Int. J. Environ. Res.
Public Health 2017, 14 (1).
(17) Weigel, S.; Kuhlmann, J.; Hühnerfuss, H. Sci. Total Environ. 2002, 295 (1–3), 131–141.
(18) Stamatis, N. K.; Konstantinou, I. K. J. Environ. Sci. Heal. Part B 2013, 48 (9), 800–813.
(19) Batt, A. L.; Aga, D. S. Anal. Chem. 2005, 77 (9), 2940–2947.
(20) Panditi, V. R.; Batchu, S. R.; Gardinali, P. R. In Analytical and Bioanalytical Chemistry;
2013; Vol. 405, pp 5953–5964.
(21) Heuett, N. V.; Ramirez, C. E.; Fernandez, A.; Gardinali, P. R. Sci. Total Environ. 2015,
511, 319–330.
(22) Wu, J.; Yue, J.; Hu, R.; Yang, Z.; Zhang, L. World Acad. Sci. Eng. Technol 2008, 44 (8),
438–442.
(23) Chen, Z.; Pavelic, P.; Dillon, P.; Naidu, R. Water Res. 2002, 36 (19), 4830–4838.
(24) Hillebrand, O.; Nödler, K.; Licha, T.; Sauter, M.; Geyer, T. Water Res. 2012, 46 (2), 395–
402.
(25) Potera, C. Environ. Health Perspect. 2012, 120 (3), a108–a109.
(26) Van Stempvoort, D. R.; Roy, J. W.; Grabuski, J.; Brown, S. J.; Bickerton, G.; Sverko, E.
Sci. Total Environ. 2013, 461, 348–359.
(27) Barone, J. J.; Roberts, H. In Caffeine: Perspectives from Recent Research; Dews, P. B.,
Ed.; Springer Berlin Heidelberg: Berlin, Heidelberg, 1984; pp 59–73.
(28) Fredholm, B. B.; Bättig, K.; Holmén, J.; Nehlig, A.; Zvartau, E. E. Pharmacol. Rev. 1999,

50
51 (1), 83–133.
(29) Gilbert, R. M. Prog. Clin. Biol. Res. 1984, 158, 185—213.
(30) Carotenuto, M.; Lofrano, G.; Siciliano, A.; Aliberti, F.; Guida, M. Glob. NEST J. 2014, 16
(3, SI), 463–473.
(31) Zwiener, C.; Frimmel, F. H. Anal. Bioanal. Chem. 2004, 378 (4), 851–861.
(32) Ramirez, C. E.; Wang, C.; Gardinali, P. R. Anal. Bioanal. Chem. 2014, 406 (1), 329–344.
(33) Hennion, M.-C. J. Chromatogr. A 1999, 856 (1–2), 3–54.
(34) Mazzoni, M.; Rusconi, M.; Valsecchi, S.; Martins, C. P. B.; Polesello, S. J. Anal. Methods
Chem. 2015, 2015.
(35) Cantwell, M. G.; Katz, D. R.; Sullivan, J. C.; Borci, T.; Chen, R. F. Caffeine in Boston
Harbor past and present, assessing its utility as a tracer of wastewater contamination in
an urban estuary; 2016; Vol. 108.
(36) Hernández, F.; Ibáñez, M.; Portolés, T.; Cervera, M. I.; Sancho, J. V.; López, F. J. J.
Hazard. Mater. 2015, 282, 86–95.
(37) Yu, H.; Song, Y.; Du, E.; Yang, N.; Peng, J.; Liu, R. Environ. Sci. Pollut. Res. 2016, 23
(11), 10644–10655.
(38) Yang, L.; Hur, J.; Zhuang, W. Environmental Science and Pollution Research. 2015, pp
6500–6510.
(39) Sgroi, M.; Roccaro, P.; Korshin, G. V.; Greco, V.; Sciuto, S.; Anumol, T.; Snyder, S. A.;
Vagliasindi, F. G. A. Journal of Hazardous Materials. 2016.
(40) Gao, J.; Huang, J.; Chen, W.; Wang, B.; Wang, Y.; Deng, S.; Yu, G. Front. Environ. Sci.
{&} Eng. 2016, 10 (3), 491–501.
(41) Knee, K. L.; Gossett, R.; Boehm, A. B.; Paytan, A. Mar. Pollut. Bull. 2010, 60 (8), 1376–
1382.
(42) Benotti, M. J.; Brownawell, B. J. Environ. Pollut. 2009, 157 (3), 994–1002.
(43) Heuett, N. V.; Batchu, S. R.; Gardinali, P. R. J. Hazard. Mater. 2015, 282, 41–50.
(44) Ramirez, C. E. High-Throughput, Ultra-Trace Analysis of Sucralose in Multi-Matrix
Aqueous Samples by Online SPE HPLC-High Resolution Mass Spectrometry.; North
Miami, Florida, 2014.
(45) Weigel, S.; Berger, U.; Jensen, E.; Kallenborn, R.; Thoresen, H.; Hühnerfuss, H.
Chemosphere 2004, 56 (6), 583–592.
(46) Singh, S. P.; Azua, A.; Chaudhary, A.; Khan, S.; Willett, K. L.; Gardinali, P. R.
Ecotoxicology 2010, 19 (2), 338–350.