
Cadth 2015 breakfast 2 excel hta tools presentation final
24
CADTH Excel-Based HTA Tools: Overview and Application Presenters: Chris Cameron, Michelle Mujoomdar, Tammy Clifford, Brian Hutton Date: Tuesday: April 13 th , 2015
-
Upload
cadth-symposium -
Category
Health & Medicine
-
view
87 -
download
5
Transcript of Cadth 2015 breakfast 2 excel hta tools presentation final

CADTH Excel-Based HTA Tools: Overview and Application
Presenters: Chris Cameron, Michelle Mujoomdar, Tammy Clifford, Brian Hutton
Date: Tuesday: April 13th, 2015
2
CADTH Excel based HTA ToolsContext: Overview of CADTH Excel based tools that have
been developed or are in development • NetMetaXL is one product of this relationship
Overview of NetMetaXL: • What is network meta-analysis (NMA)? • Demonstration of how NetMetaXL works, how it can save
time, and help our future work in the realm of network meta-analysis
Live Demo of 3 other CADTH Excel-based HTA tools in development

3
CADTH Excel based HTA ToolsEach CADTH Excel-based HTA Tools consists of:
Short user guide and/or publication
Freely available Excel-based HTA Tool for download
Short YouTube video on how to use each tool
Each CADTH Excel-based HTA Tool also:
Undergoes a paid statistical/economic review beyond the peer review process of journals
Developed in collaboration with academic groups
NetMetaXL is the first in the suite of Excel-based tools under development. Tools are available here: www.cadth.ca/en/resources/hta-excel-tools

4
NetMetaXL
Based on a Sept 29, 2014 manuscript published in Systematic Reviews Journal….

5
NetMetaXL
NetMetaXL is the first in the suite of Excel-based tools under development. Tools are available here: www.cadth.ca/en/resources/hta-excel-tools
6
NetMetaXL
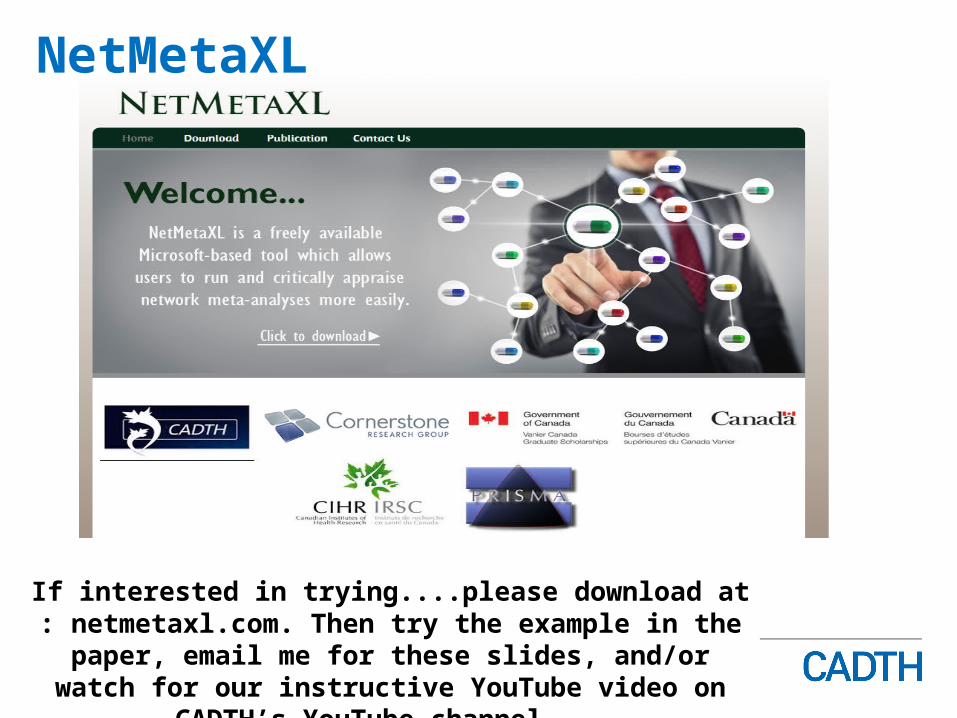
If interested in trying....please download at : netmetaxl.com. Then try the example in the paper, email
me for these slides, and/or watch for our instructive YouTube video on CADTH’s YouTube channel....

7
NetMetaXL
The left depicts the ‘traditional pairwise’ approach...many drugs=many MAs.
The right side depects NMA; a unified analysis to make multiple pairwise comparisons using direct and indirect information
8
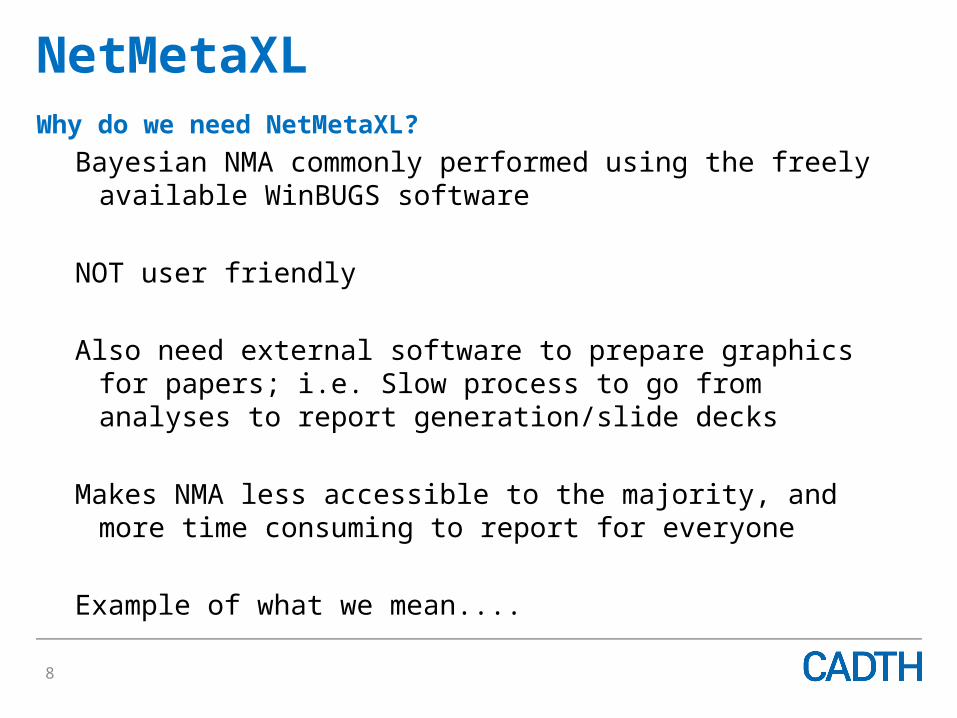
NetMetaXLWhy do we need NetMetaXL?
Bayesian NMA commonly performed using the freely available WinBUGS software
NOT user friendly
Also need external software to prepare graphics for papers; i.e. Slow process to go from analyses to report generation/slide decks
Makes NMA less accessible to the majority, and more time consuming to report for everyone
Example of what we mean....

10
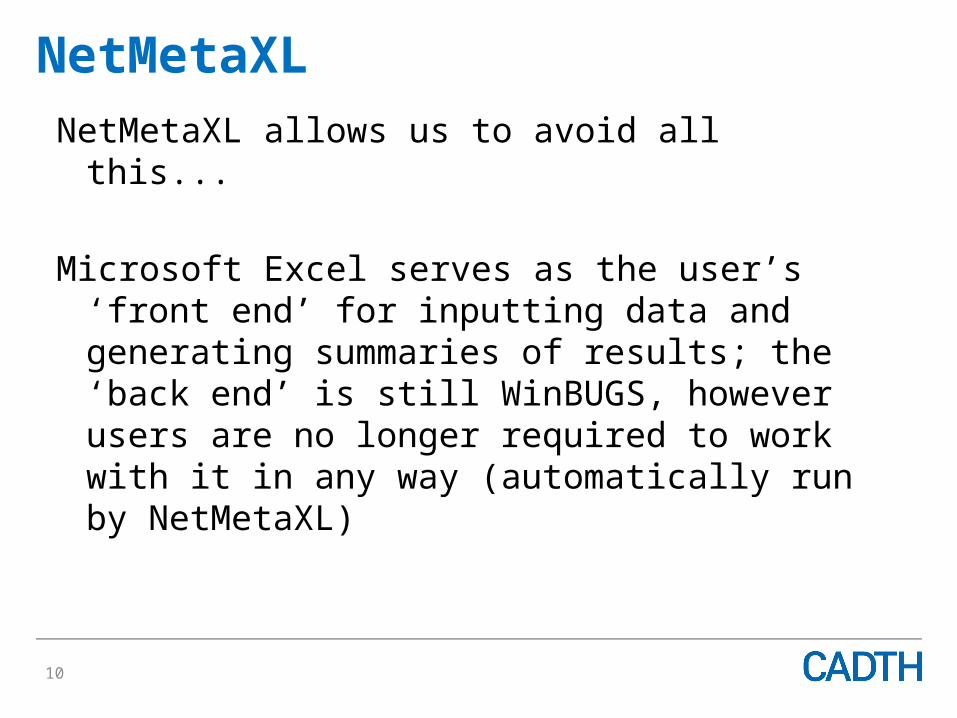
NetMetaXLNetMetaXL allows us to avoid all this...
Microsoft Excel serves as the user’s ‘front end’ for inputting data and generating summaries of results; the ‘back end’ is still WinBUGS, however users are no longer required to work with it in any way (automatically run by NetMetaXL)
11
NetMetaXL Screenshots

NetMetaXL Screenshots
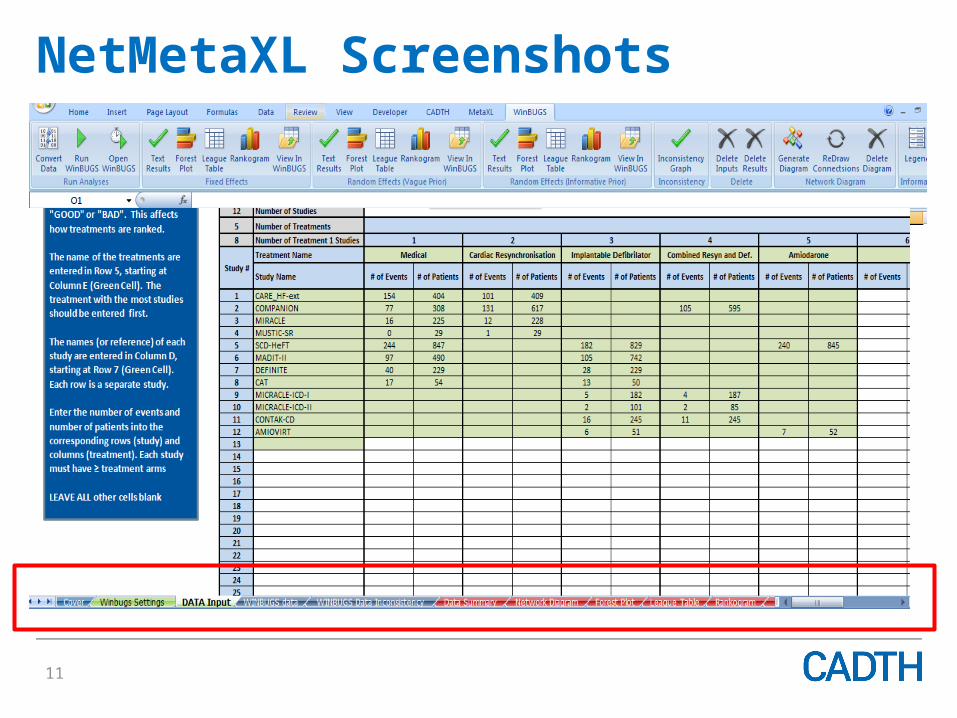
Place to specify the duration of our ‘burn-in’ and ‘sampling’ periods for our network meta-analyses, and some options about efforts to track model convergence (important for obtaining reliable estimates)
Place where we tell NetMetaXL some instructions: where to find Winbugs to run analyses; where to store data and results files; how to name these files
13
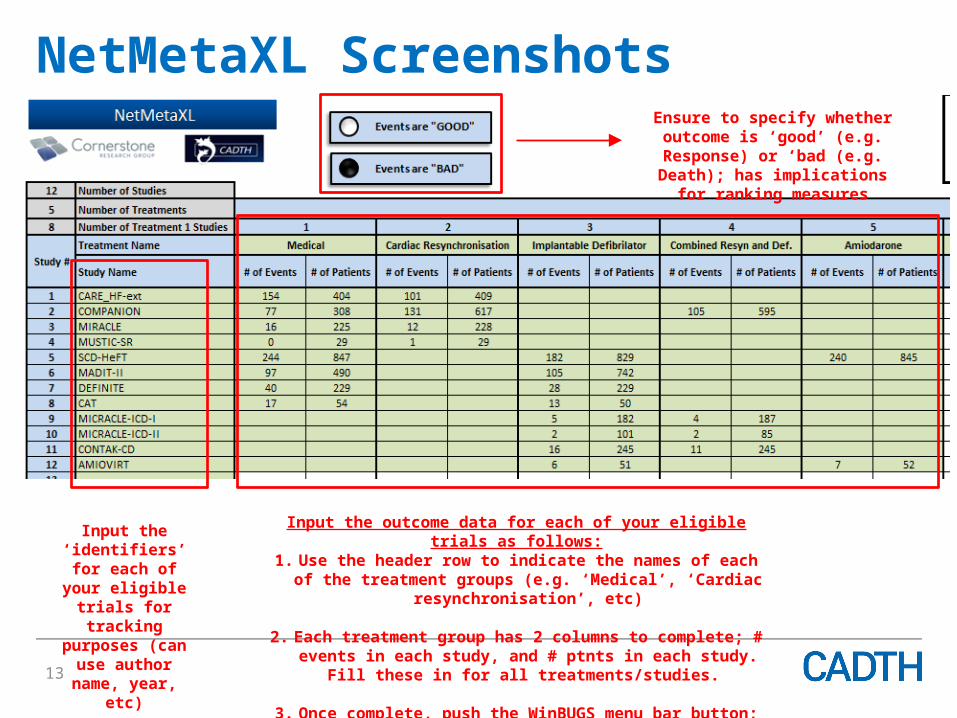
NetMetaXL ScreenshotsEnsure to specify whether outcome is
‘good’ (e.g. Response) or ‘bad (e.g. Death); has implications for ranking
measures
Input the ‘identifiers’ for each of your eligible trials for
tracking purposes (can use author name, year, etc)
Input the outcome data for each of your eligible trials as follows:1. Use the header row to indicate the names of each of the treatment
groups (e.g. ‘Medical’, ‘Cardiac resynchronisation’, etc)
2. Each treatment group has 2 columns to complete; # events in each study, and # ptnts in each study. Fill these in for all treatments/studies.
3. Once complete, push the WinBUGS menu bar button; then push ‘Convert Data’ to set up the data set which will be passed to Winbugs
to run the network meta-analysis.
NetMetaXL Screenshots
NetMetaXL Screenshots
NetMetaXL Screenshots
NetMetaXL Screenshots
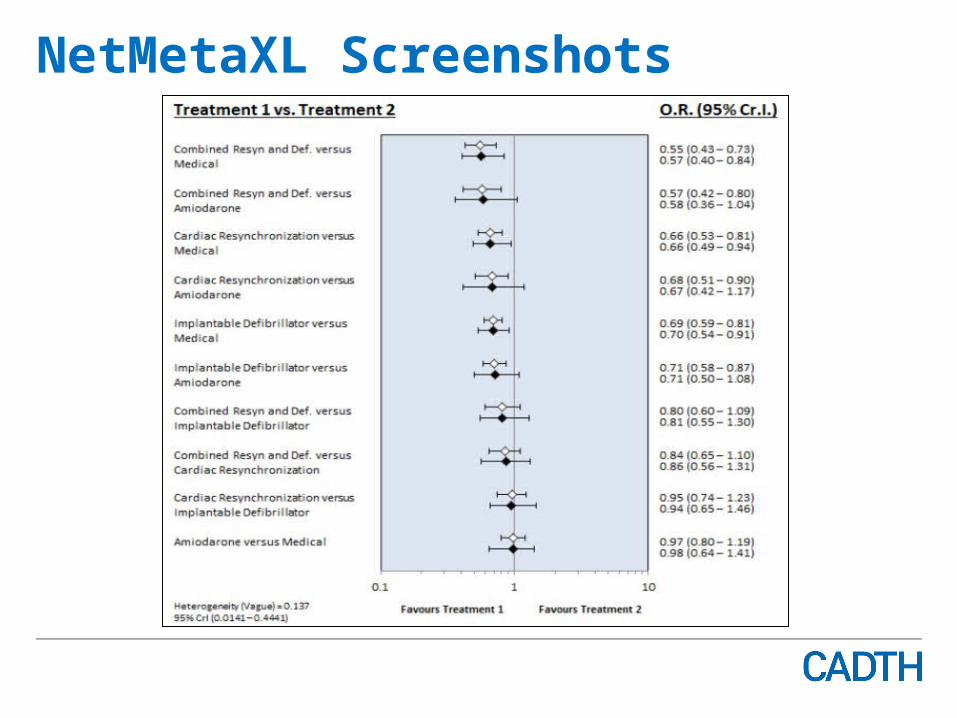
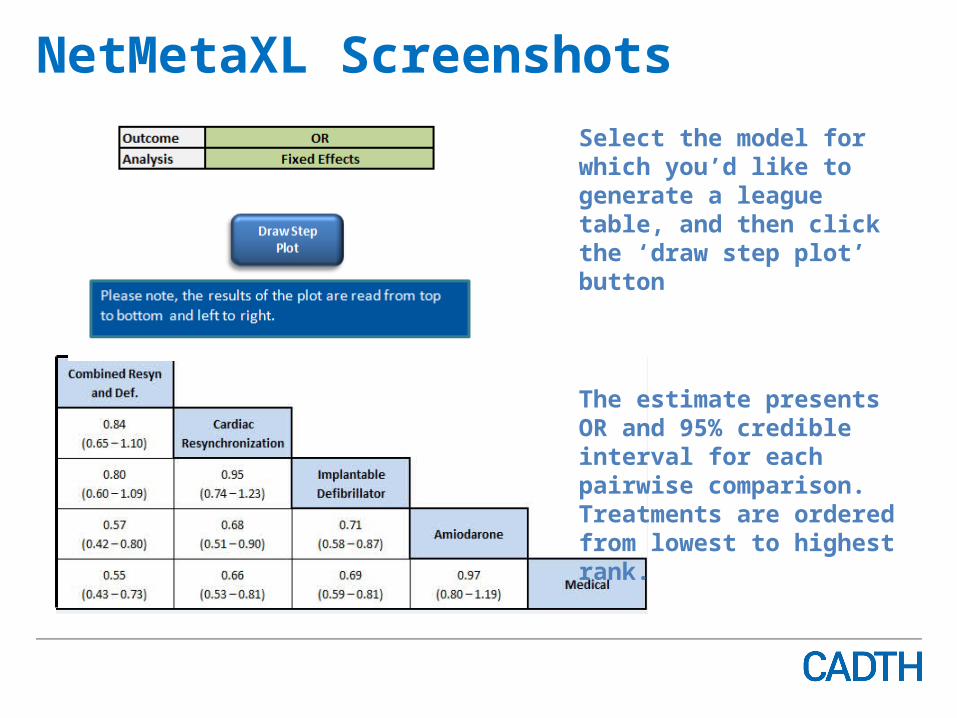
Select the model for which you’d like to generate a league table, and then click the ‘draw step plot’ button
The estimate presents OR and 95% credible interval for each pairwise comparison. Treatments are ordered from lowest to highest rank.
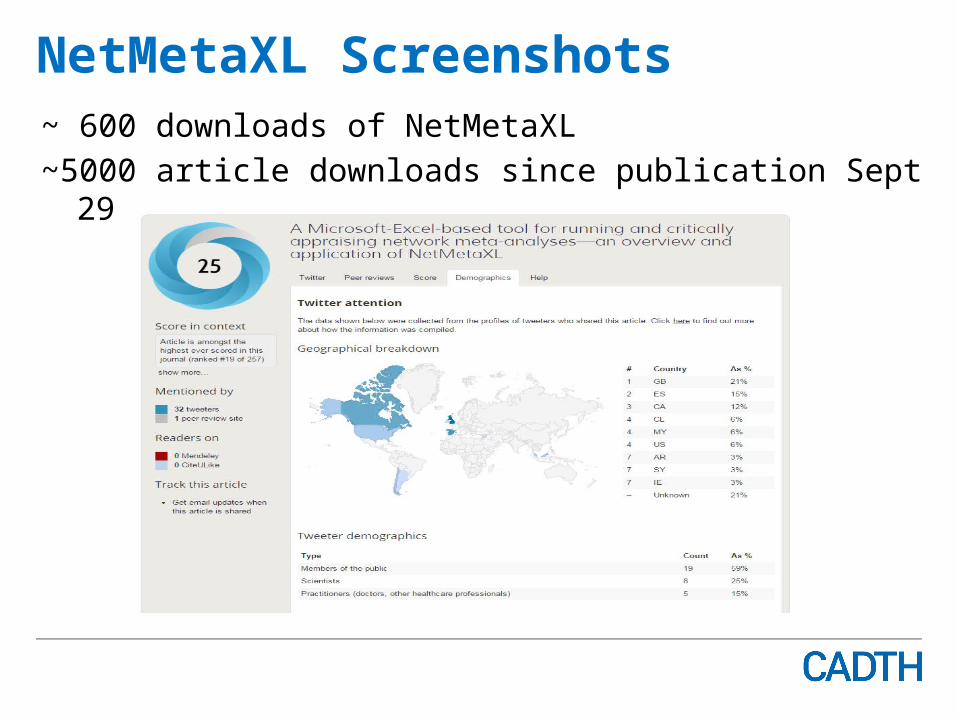
NetMetaXL Screenshots~ 600 downloads of NetMetaXL
~5000 article downloads since publication Sept 29
NetMetaXL Screenshots
20
CADTH Excel based HTA ToolsCADTH Excel based Tools in development :
NetMetaXL – Excel-based tool for conducting network meta-analysis of dichotomous outcomes (released)
ForestPlotXL – tool for producing publication quality forest plots entirely within Excel (mid 2015)
IconArrayXL – Excel-based tool for producing icon arrays to depict absolute risks(mid 2015)
MetaQoL – Excel-based tool for conducting meta-analysis of quality of life data (mid 2015)

21
CADTH Excel based HTA ToolsCADTH Excel based Tools in development :
NetMetaXL for continuous outcomes – Excel-based tool for conducting network meta-analysis of continuous outcomes (Late 2015)
Health economics toolkit – Excel-based tool for supporting health economic evaluations
CE Plane and Dominance Tool (mid 2015)
CE Sensitivity Analysis and PSA Tool (late 2015)
CE Value of Information analysis Tool (late 2015)
Other data manipulation and extraction tools
22
Live Demos of 3 ToolsForestPlotXL – tool for producing publication quality forest
plots entirely within Excel (mid 2015)
IconArrayXL – Excel-based tool for producing icon arrays to depict absolute risks(mid 2015)
Health Economics Tool Kit – CE Plane and Dominance Tool (mid 2015)


24